1. Introduction
X-ray pulsar navigation, as a new type of astronomical navigation system, provides crucial support for deep space exploration, autonomous spacecraft operations, and comprehensive navigation in near-Earth space. Pulsars are rapidly rotating neutron stars, and their highly periodic and stable signals can be utilized to identify changes in a spacecraft’s spatial position, allowing for high-precision navigation and positioning of spacecraft [
1,
2,
3,
4,
5].
Research on pulsars has been ongoing for over half a century, leading to numerous breakthroughs. Countries such as the United States and Russia have conducted extensive surveys and studies on various aspects of pulsars and have established a complete pulsar navigation technology system [
6,
7,
8]. In 2017, NASA installed the NICER detector on the International Space Station and carried out in-orbit demonstration experiments and verification of X-ray millisecond pulsar navigation technology [
9,
10]. Despite its late start in X-ray pulsar observation activities due to limitations in the X-ray sensor hardware technology, China has rapidly developed in recent years and successfully launched several independently developed X-ray pulsar observation satellites, such as XPNAV-1 and Tiangong 2, validating the feasibility of practical applications of pulsar navigation [
11,
12,
13].
X-ray pulsar positioning utilizes the periodic signals emitted by pulsars and the time differences between multiple receivers on Earth to determine positions. In theory, measurements of spacecraft spatial positions can be derived by observing three pulsars in different directions. Combined with spacecraft orbital dynamics models [
14], spacecraft’s spatial positions can be estimated using navigation filters. The estimation of a spacecraft’s radial velocity using X-ray pulsars is achieved based on the Doppler effect, through short-term observations of the pulsar period by the spacecraft [
15,
16]. In terms of navigation filtering, the methods include robust filtering algorithms for model uncertainties [
17], the Augmented Sigma-point Kalman Filter algorithm for addressing pulsar direction errors [
18], and the Unscented Kalman Filter algorithm based on multi-mode adaptive estimation [
19]. Li N, Kang Z W, and others have combined Empirical Mode Decomposition (EMD) with an extended Kalman filter (EKF) to propose an adaptive extended Kalman filter method based on EMD [
20].
High-speed spacecraft flight and pulsar period leaps can cause cumulative distortion in the pulsar profile, leading to a shift in the pulsar time of arrival (TOA) [
21]. The estimation of the Doppler shift in the pulsar velocity utilizes the accumulated distortion of the X-ray pulsar profile to provide navigation information. The basic principle is as follows: first, the pulsar signal is folded according to different periods to obtain a series of accumulated profiles with different distortions. Then, these accumulated profiles are analyzed to identify the profile with the least distortion, and the corresponding period is determined as the intrinsic period of the pulsar [
22]. Therefore, pulsar period estimation is also an important topic. In the field of period estimation, numerous experts and scholars have conducted in-depth research and achieved significant results. Currently, the typical methods include time-domain methods, Fourier spectrum methods [
23], and others. Song M Z and Wang Y D improved the fast folding algorithm by introducing the post-order traversal of a binary tree, which can be used to estimate the spin period of an X-ray pulsar under low signal-to-noise ratio conditions. [
24]. Shen L R et al. used the Fast Lomb Periodogram to estimate the initial value of the pulsar’s rotation frequency and implemented fine frequency division based on a criterion of layer-by-layer overlap in a small domain around the initial frequency value, calculating continuous Lomb periodograms at a fine frequency, thus achieving high-precision pulsar period estimation with low computational cost [
25]. Liu J proposed a rapid pulsar period estimation method based on compressed sensing, leveraging the strong sparse signal processing capability of compressed sensing and the concentration of the pulsar profile energy in the low-frequency part, developing a low-frequency Fourier transform matrix into a measurement matrix. Super-resolution sparse recovery algorithms have been used to achieve period estimation for X-ray pulsars [
26].
However, for pulsars in orbit, they may be significantly affected by the effects of gravitational fields, and the non-uniformity of the gravitational field can cause a pulsar’s orbit to twist and deform, affecting its position in the line of sight. In addition, disturbances from other celestial bodies may also affect a pulsar’s orbit and position [
27]. For example, close interactions with other celestial bodies may alter a pulsar’s trajectory, leading to positional drift. This drift could cause accumulated distortion in the pulsar’s profile, necessitating modeling and correction of these positional drifts to obtain accurate observational results. Wang Y D utilized satellite orbital dynamics to approximate pulsar phase evolution and proposed the use of on-orbit pulsar timing algorithms for X-ray pulsar navigation correction [
28]. Wang Y D introduced a framework called on-orbit epoch folding, which, through steps that eliminate the effects of spacecraft orbit motion, can transform the TOA with the original photon TOA corrected according to the Solar System Barycenter (SSB). This enables the search for the period of the transformed photons’ TOAs and estimation of the initial phase [
29]. Wu D L introduced the concept of quantum computing and proposed a fast pulsar positioning and velocity estimation method based on sparrow-optimized quantum compressed sensing, capable of simultaneously providing position and velocity information [
30]. Sun Haifeng proposed the grouped bi-chi-squared technique inversion method based on a significant enhancement in orbital dynamics pulse profiles, which can reduce the orbital elements in the distorted information in X-ray pulse profiles [
31]. Su J Y studied the distribution characteristics of significant data and proposed using the variance in pulsar profile significance data as the basis for the optimal estimation of orbital elements, achieving the estimation of orbital elements under the presence of deviations in all six orbital parameters [
32].
The traditional methods for measuring the velocity and distance of pulsars have focused primarily on radial velocity or position information, presenting several limitations. Firstly, if a pulsar possesses velocity components in directions other than radial, traditional methods, by only considering the radial velocity, may lead to misconceptions about the pulsar’s overall motion state. Additionally, the traditional distance measurement techniques typically calculate the distance by measuring the time it takes for a pulse signal emitted by a pulsar to be received by a receiver [
33]. In reality, slight variations in a pulsar’s position due to various factors may affect the accuracy of distance calculations. Moreover, these methods do not provide information on the relative velocity between the pulsar and the receiver, which may be required in certain application scenarios. Jia Y Z utilized the cyclic cross-correlation method to solve for the arrival time of pulsars in the radial direction, established a model for pulsar profile distortion under transverse position errors, and thereby determined the observable directions in the transverse plane; finally, this method has been used to calculate position errors in the observable directions on the pulsar’s transverse surface [
34]. Liu J employed singular value decomposition to study the directions of observable velocity components, estimating the two Doppler velocity components corresponding to the largest and middle singular values, while also proposing the Dictionary Folding (DF) method to reduce computational requirements [
35].
In non-linear orbits, even velocity or position errors for pulsars in the perpendicular plane can lead to radial velocity errors, subsequently causing deformations in the pulsar profile. Experiments have shown that for pulsars with low flux, the signal-to-noise ratio of their profiles is too low, allowing only for the detection of phase shifts; effective detection of profile distortions is possible only for high-flux pulsars [
36]. A combined estimate of velocity and distance measurements can provide a more accurate estimation of the target position than using distance measurements alone. Integrating pulsar distance and velocity measurements can offer a more precise target position estimation. By combining the results of both measurements, certain errors can be eliminated, enhancing the accuracy of the target position estimation. For these reasons, we utilize the accumulated profile distortions of the high-flux Crab pulsar to infer transverse position and velocity, proposing a method to achieve comprehensive measurement of position and velocity information using a single pulsar. This method, in principle, determines the observable position-reactive directions and velocity-reactive directions on the transverse surface of the pulsar. Then, given that the pulsar profile distortions caused by transverse position and velocity errors are indistinguishable, we establish a reactive motion state measure concerning transverse position and velocity errors in the observable directions, serving as a new motion observational metric in X-ray pulsar navigation.
2. The Orbital Dynamics Equations and Pulsar Profile Distortion
Currently, autonomous positioning of spacecraft using pulsars primarily relies on filtering algorithms based on orbital dynamics. For spacecraft in orbit, short-term forecasts of their position, velocity, and other state information can be accomplished by adhering to the laws of orbital dynamics. For Earth satellites, the geocentric inertial coordinate system (J2000.0) is typically selected. The state model of the autonomous navigation system for Earth satellites can be described using a general state equation.
In Equation (1), the state vector components , , and correspond to the spacecraft’s position and velocity vectors, respectively. denotes the orbital dynamics model, and w denotes the noise.
The Pulsar Profile Distortion
During its flight, a spacecraft continuously collects photons from pulsars and processes them according to a predicted period (or frequency) through Epoch Folding (EF), thereby reconstructing the real-time accumulated profile of the pulsar. Due to the unknown pulsar period, the accumulated pulsar profile obtained through the predicted period may exhibit certain distortions when compared to the standard pulsar profile.
Let the normalized standard profile of the pulsar be denoted by
. Herein,
signifies the pulse phase; the cumulative pulsar profile
is represented as the average of all the accumulated sub-profiles of the pulsar and can be articulated as follows:
where
c represents the speed of light;
signifies the intrinsic period of the pulsar;
denotes the phase error for the
period;
N stands for the number of pulsar periods within the cumulative observation time.
From Equation (2), it is evident that the cumulative profile of a pulsar is a superposition of pulsar sub-profiles at different phases, inevitably leading to distortions. According to the literature [
28], the pulsar profile results from the superposition of sub-profiles at various phases; to prevent distortions in the cumulative pulsar profile, the radial error must always be zero. Based on the properties of error propagation, for the radial error to remain consistently zero, the transverse position and velocity errors must also be zero.
For non-linear orbits, our method is predicated upon the time-domain
estimation technique, with the
value serving as the criterion for assessing the extent of the distortion in the cumulative profile. Theoretically, the highest
value denotes the minimum degree of distortion. This is attributable to the fact that compared to distorted profiles, the standard pulsar profile exhibits the sharpest peaks [
37].
3. Comprehensive Measurement of Position and Velocity in the Transverse Direction
In this section, we propose a method that exclusively utilizes the Crab pulsar to comprehensively measure the transverse position and velocity. Contrary to traditional methods of pulsar-based positioning and velocity determination using X-rays, this approach employs the observable transverse reactive direction as a physical measure, focusing on the transverse position and velocity information. Due to the strong correlation between position and velocity, which typically results in significant errors in an ordinary dimensionless directional search for position and velocity, we introduce a reactive motion state measure related to both position and velocity to enhance the search accuracy. The method outlined in this paper comprises three modules: (1) searching for the position- and velocity-reactive directions in the transverse plane; (2) solving for the adjustment coefficients of position and velocity, constructing a reactive motion state measure; (3) comprehensively measuring position and velocity transversely.
3.1. The Reactive Direction in the Transverse Plane
Velocity and position errors can be decomposed into three perpendicular components in three-dimensional space. The error component in the line-of-sight direction is readily estimable, whereas the two mutually perpendicular error components in the plane in the transverse plane are challenging to assess. Our research has found that in the transverse plane, distortions exhibit varying sensitivities to the two error components, with the degree of pulsar profile distortion caused by errors in different directions varying accordingly. The greater the distortion induced in the pulsar profile, the better the observability in that transverse direction.
Based on the methodology described in reference [
34], it is known that on the pulsar’s perpendicular plane, the distortion profiles of different radial and tangential positions or velocity errors form a “ridge”. The peak of this ridge, representing the maximum
value, signifies the pulsar profile with the minimal positional error. In the “ridge direction”,
values of the pulsar’s distortion profiles are nearly identical, that is, based on the pulsar’s distortion profiles with the same
values. In contrast, perpendicular to the “ridge”, the
values of the pulsar’s distortion profiles vary significantly, enabling the differentiation of positions along this direction based on
of the pulsar’s distortion profiles. The variation in the distortion degree of the pulsar profile is more reactive along the perpendicular to the ridge. As seen in
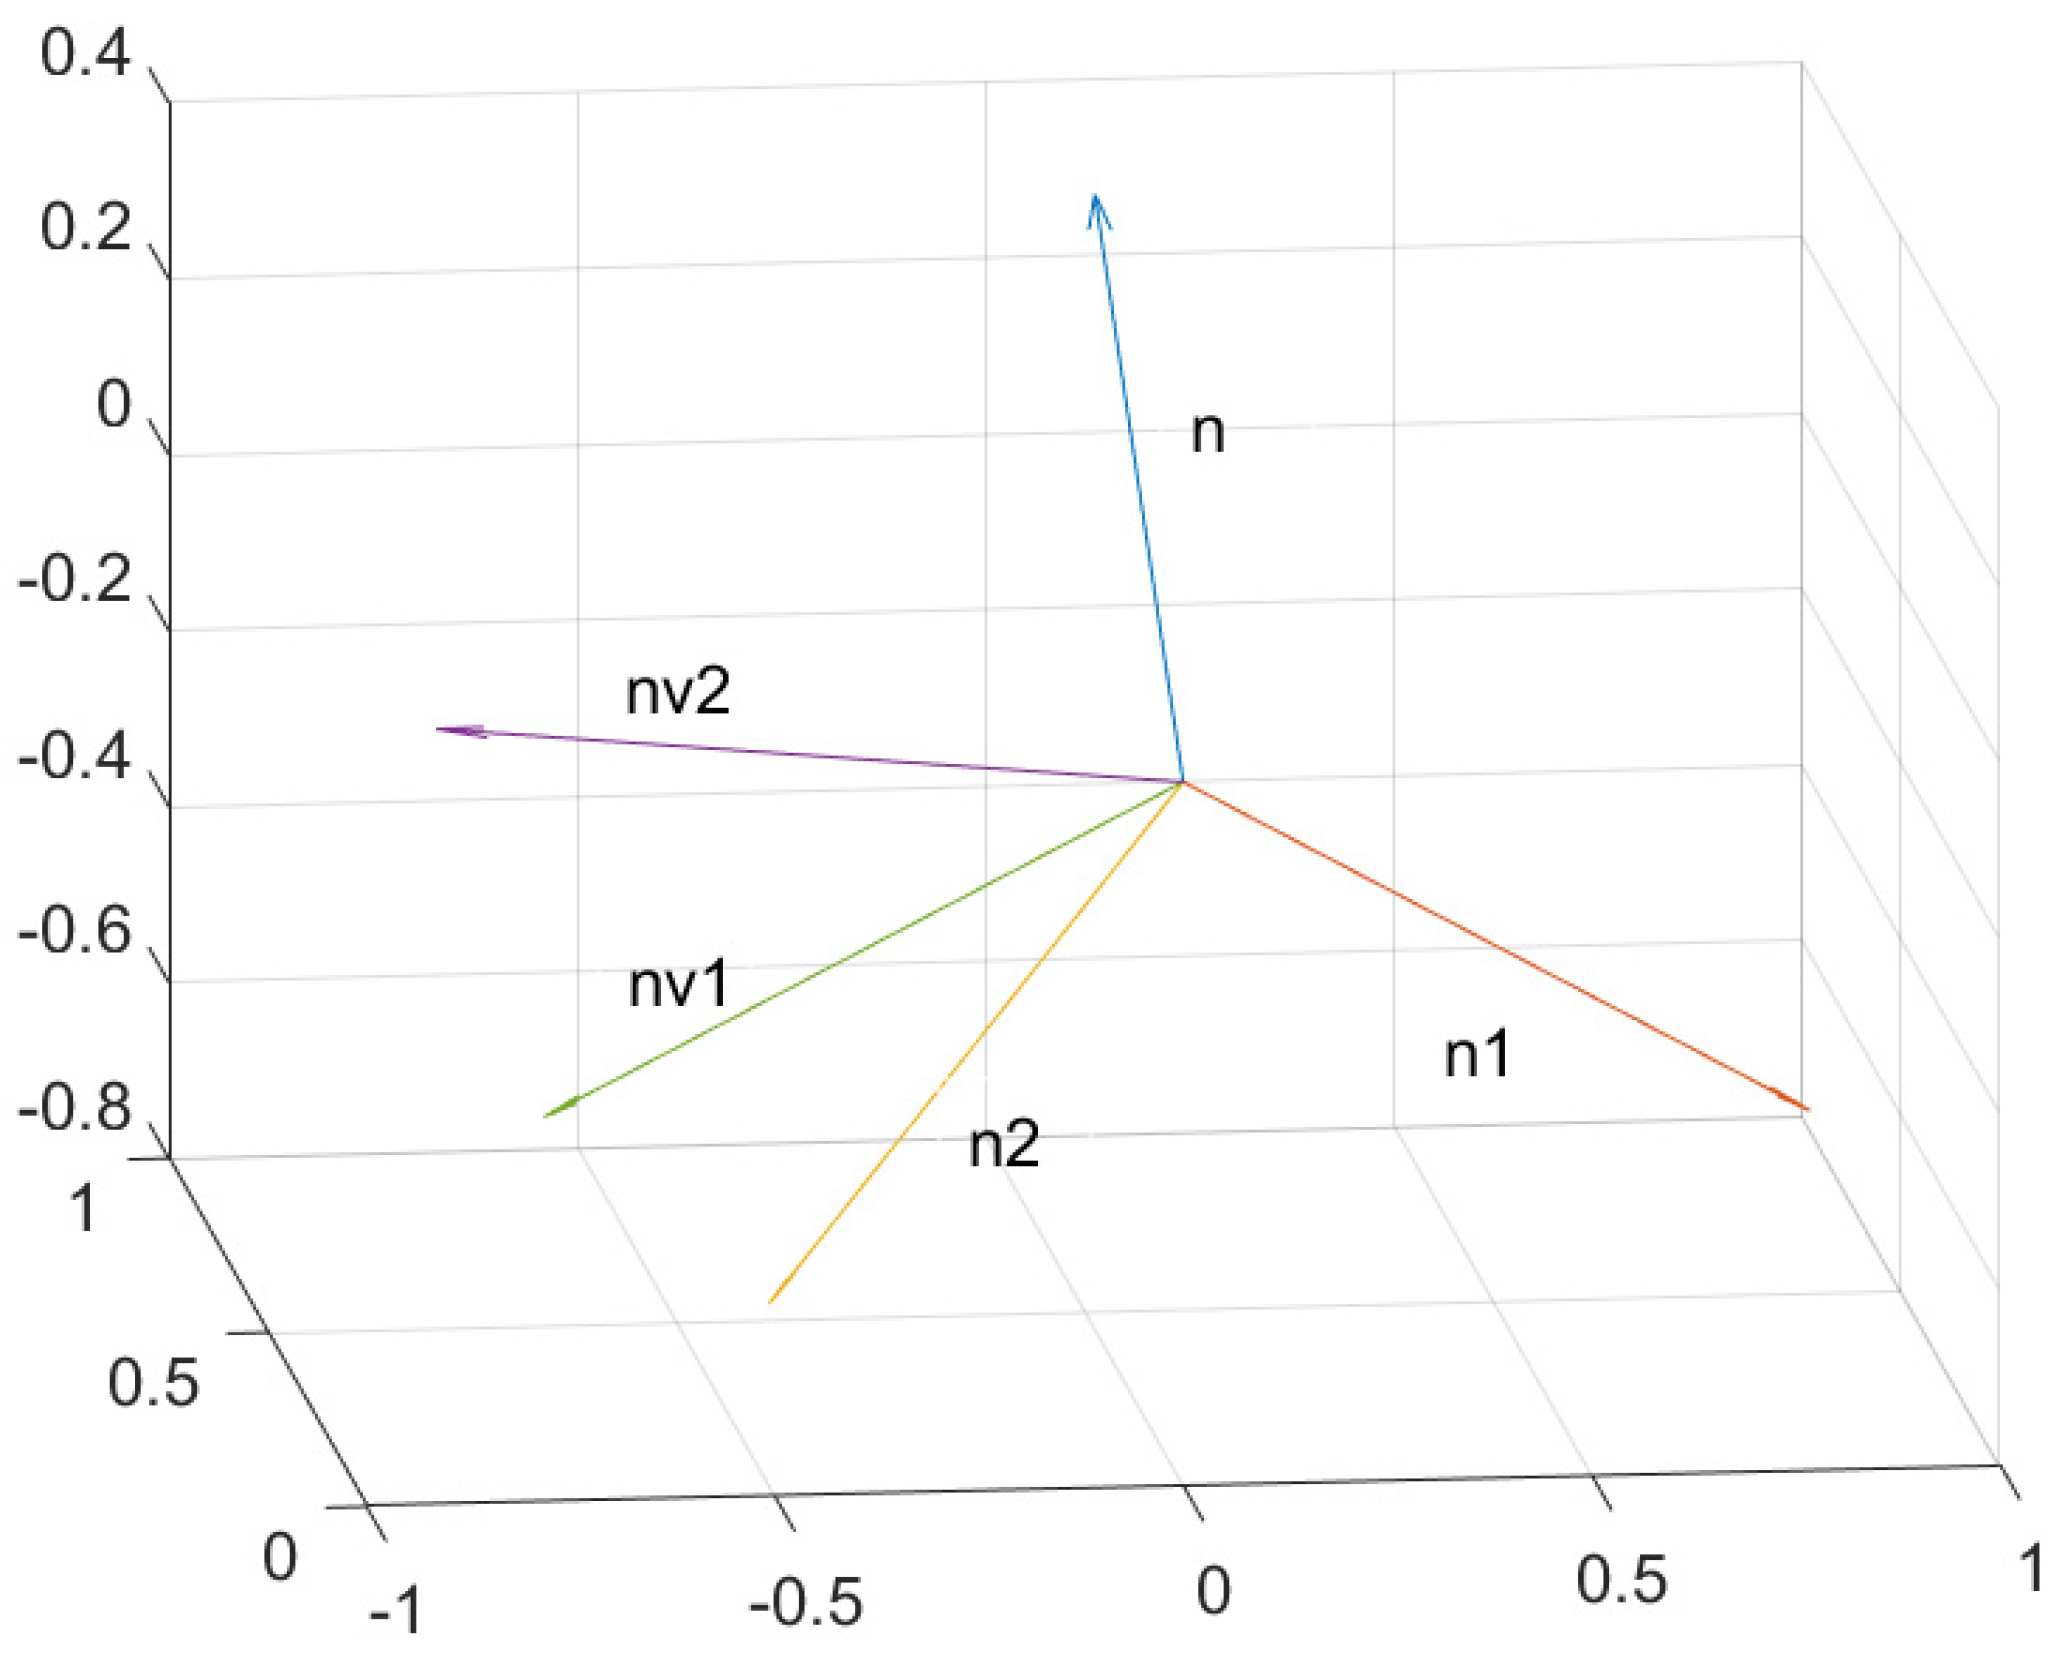
Figure 1, the reactive direction is a specific radial direction of the orbital projection on the pulsar’s perpendicular plane. The reactive direction indicates that velocity errors and positional errors in this direction can easily lead to positional errors in the radial direction. Since the reactive direction can be regarded as the radial direction at a specific time within the observation period, it is termed the Reactive Radial Direction (RRD).
After constructing the model for pulsar profile distortion, based on the “ridge line direction”, the observable transverse direction perpendicular to it can be calculated. After obtaining the slope
of the “ridge line”, the RRD can be obtained through the following set of equations:
where
is the angle between the direction of the “ridge line” and the velocity direction at the initial position, and
is the angle between the RRD and the velocity direction at the initial position.
represents the direction of the pulsar, while
,
,
, respectively, denote the three components of
.
is a matrix formed by
,
is an antisymmetric matrix, and
is the rotation matrix from the velocity direction at the initial position to the RRD.
is the vertical direction of the initial position’s projection onto the transverse plane, and
is the RRD being solved for.
We aim to comprehensively measure the velocity and position perpendicular to the transverse direction of the pulsar, thus necessitating separate determination of the position-reactive direction and the velocity-reactive direction .
Figure 1 provides a schematic illustration concerning the pulsar’s radial direction and orbital plane, orbital projection, and initial position, as well as the position-reactive and velocity-reactive directions. Herein, the vector
denotes the direction of the pulsar; vector
represents the projection of the initial position vector of the detector onto the transverse plane.
is perpendicular to
;
is the position-reactive direction;
is the velocity-reactive direction;
,
,
, and
are all on the same plane, that is, the transverse plane.
3.2. The Solution for Adjustment Coefficients for Position and Velocity
Due to the correlation between the distortion caused by position and velocity offsets, they mutually influence each other, resulting in lower accuracy in the dimensionless directional search for position and velocity. In this section, an attempt is made to demonstrate that with the same orbital error, it is impossible to differentiate whether it is caused by an initial positional error or an initial velocity error. Additionally, it may be assumed that there exists a linear relationship between position and velocity. Subsequently, this linear relationship may be theoretically solved and termed the adjustment coefficient. Finally, a reactive motion state measure concerning the position and velocity on the transverse plane is established as a new observable in X-ray pulsar navigation.
3.2.1. The Indistinguishability of the Offsets in Position and Velocity
In this subsection, we explore whether the orbital errors caused by initial position errors and initial velocity errors can be distinguished.
As shown in
Figure 2, the position error curves of curves s1, s2, and s3 are quite similar, and the difference in the trajectory prediction error caused by them is very small with an increase in time. Among them, curve s1 has an initial position error of only 735 m, curve s2 has an initial velocity error of only 1 m/s, and curve s3 has both an initial position error of 410 m and a velocity error of 1 m/s. Curve s4 has both an initial position error of −410 m and a velocity error of 1 m/s. Curves s3 and s4 indicate that errors caused by velocity and position can either cancel each other out or accumulate, demonstrating that errors caused by position and velocity are indistinguishable. As mentioned in the previous section, if the initial velocity error and position error are set according to a certain linear relationship, curves similar to the above can be obtained, and it is impossible to distinguish whether the trajectory prediction error is caused by the initial position error or the velocity error.
3.2.2. The Adjustment Coefficients for Position and Velocity
In
Section 2, we have already introduced that initial positional errors and velocity errors can cause orbital errors, leading to profile distortion. It is assumed that if there exists a positional error in the direction of
, there must be a velocity error in
such that the positional error caused by the pulsar’s line of sight can be approximately canceled out.
We use the fourth-order Runge–Kutta method to obtain the next orbit recursive position error by computing multiple slopes using weighted averaging. According to the fourth-order Runge–Kutta method, we can predict the state of the spacecraft at time t. The approximate state at time t is shown in the equation.
where
represents the slope at the beginning of the time interval,
and
represent the slopes at the midpoints of the time interval, and
represents the slope at the end of the time interval.
Let the initial state of
be:
Through the orbital dynamics equations and the Runge–Kutta method, the spacecraft’s position
can be derived, which can be simplified as follows:
Assuming only an initial positional error
is introduced, with
, we obtain the orbital propagation error
caused by the initial positional error:
Assuming only an initial velocity error
is introduced, with
, we obtain the orbital propagation error
caused by the initial velocity error:
We assume that the orbital recursive error caused by the initial position error and the orbital recursive error caused by the initial velocity error in the direction of the pulsar’s line of sight are linearly related since the line of sight of the pulsar
and the initial position
of the spacecraft orbit are approximately perpendicular and
is perpendicular to the equatorial plane. After simplification, we can derive Equation (14):
Formula (14) is simplified into Formula (15).
Given that the orbital propagation error varies over time, we attempt to find the most suitable
using the least squares method. Least squares analysis provides a standard method for obtaining approximate solutions. Within the overall solution, the least squares calculation results in the equation’s output and minimizes the sum of the squares of residuals. Let
be
and
be
, as shown in Equation (16):
To demonstrate the effectiveness of
, Equation (17) is provided. Let
:
where
represents the standard deviation,
stands for the orbital period,
denotes the mean, and
represents the true value.
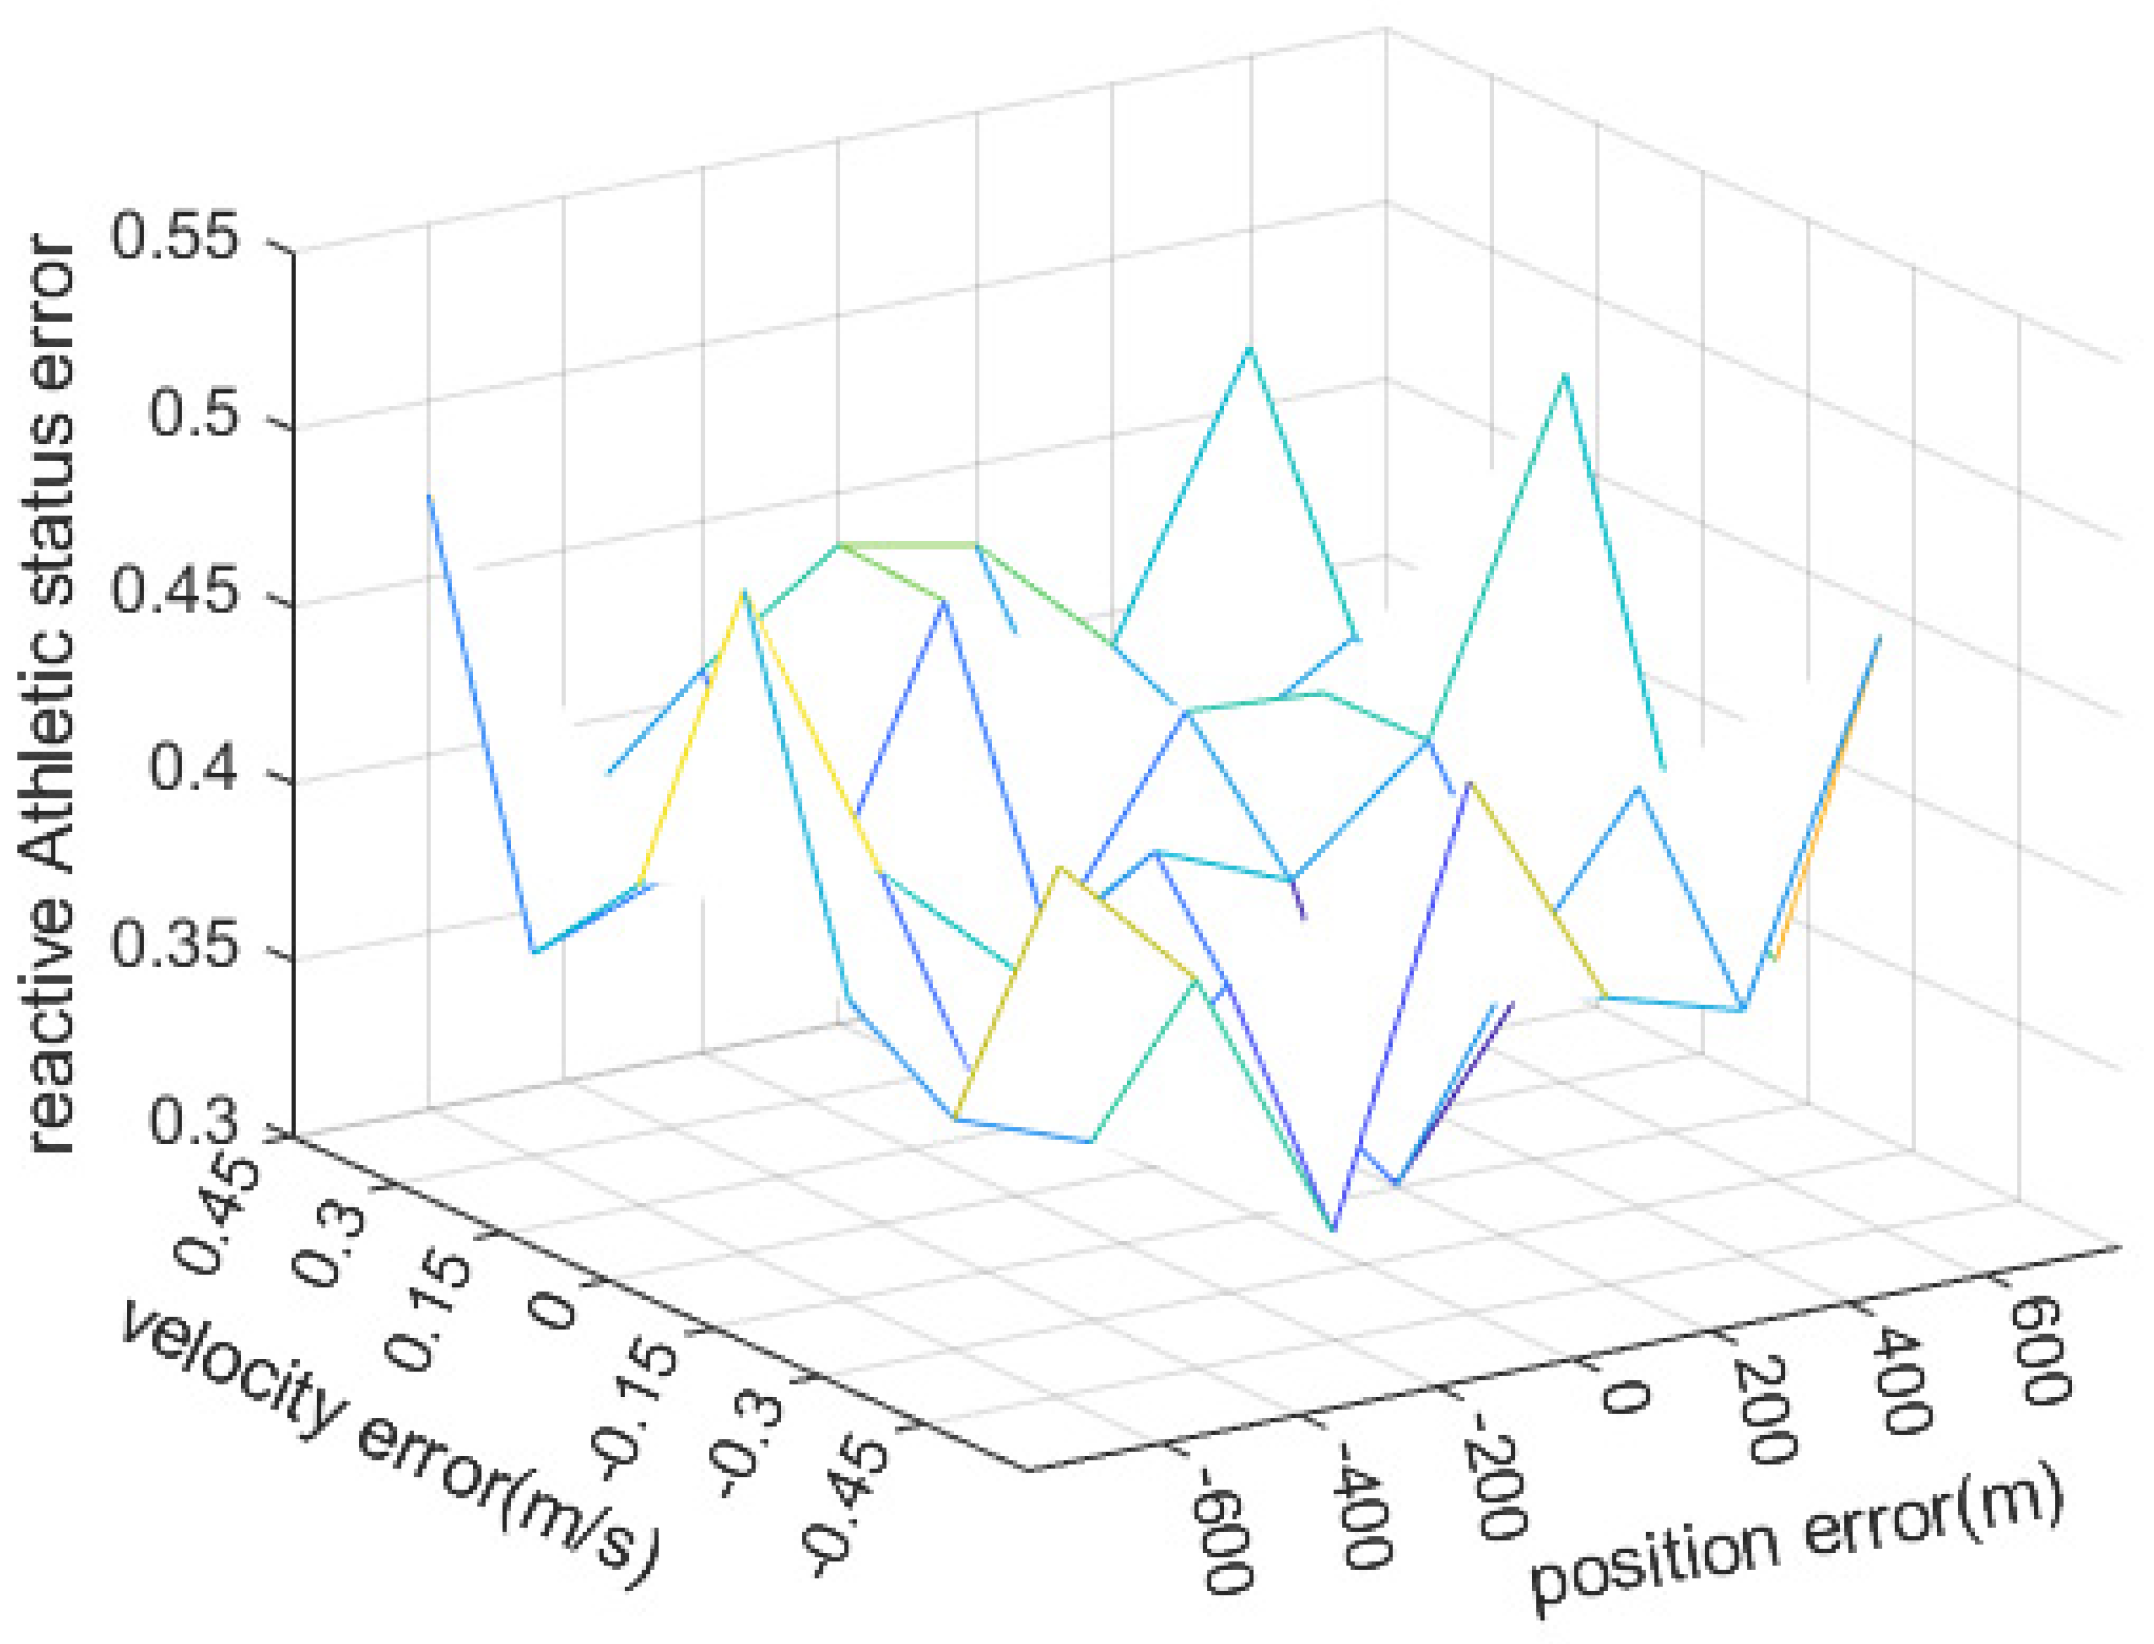
Based on Equation (17), we obtain the normalization result of the standard deviation, as shown in
Figure 3. From
Figure 3, it can be observed that when the initial velocity error in the
direction and the initial position error in the
direction change, the corresponding adjustment coefficients are determined through the least squares method and then substituted into the equation. Considering the nature of straight lines, after normalization, the standard deviation of the orbit propagation error over the entire observation period is generally around 17, proving the position error and velocity error can be fitted into a new observation direction using the adjustment coefficient
k.
3.2.3. Construction of the Reactive Motion State Measure for Position and Velocity
Due to the indistinguishability of the distortion of pulsar contours caused by the offset between position and velocity, this distinguishes traditional two-dimensional position and velocity searches, suffering from low precision. Consequently, we utilize Equation (16) to determine the adjustment coefficient
for position and velocity, thereby synthesizing a reactive motion state measure that encapsulates both. To standardize the units and normalize the process, the positional error and velocity error are divided by their respective sampling intervals, as shown in Equation (18).
The reactive motion state measure represents, when the initial positional error is zero, approximately the velocity error in direction , and when the initial velocity error is zero, approximately the positional error in direction .
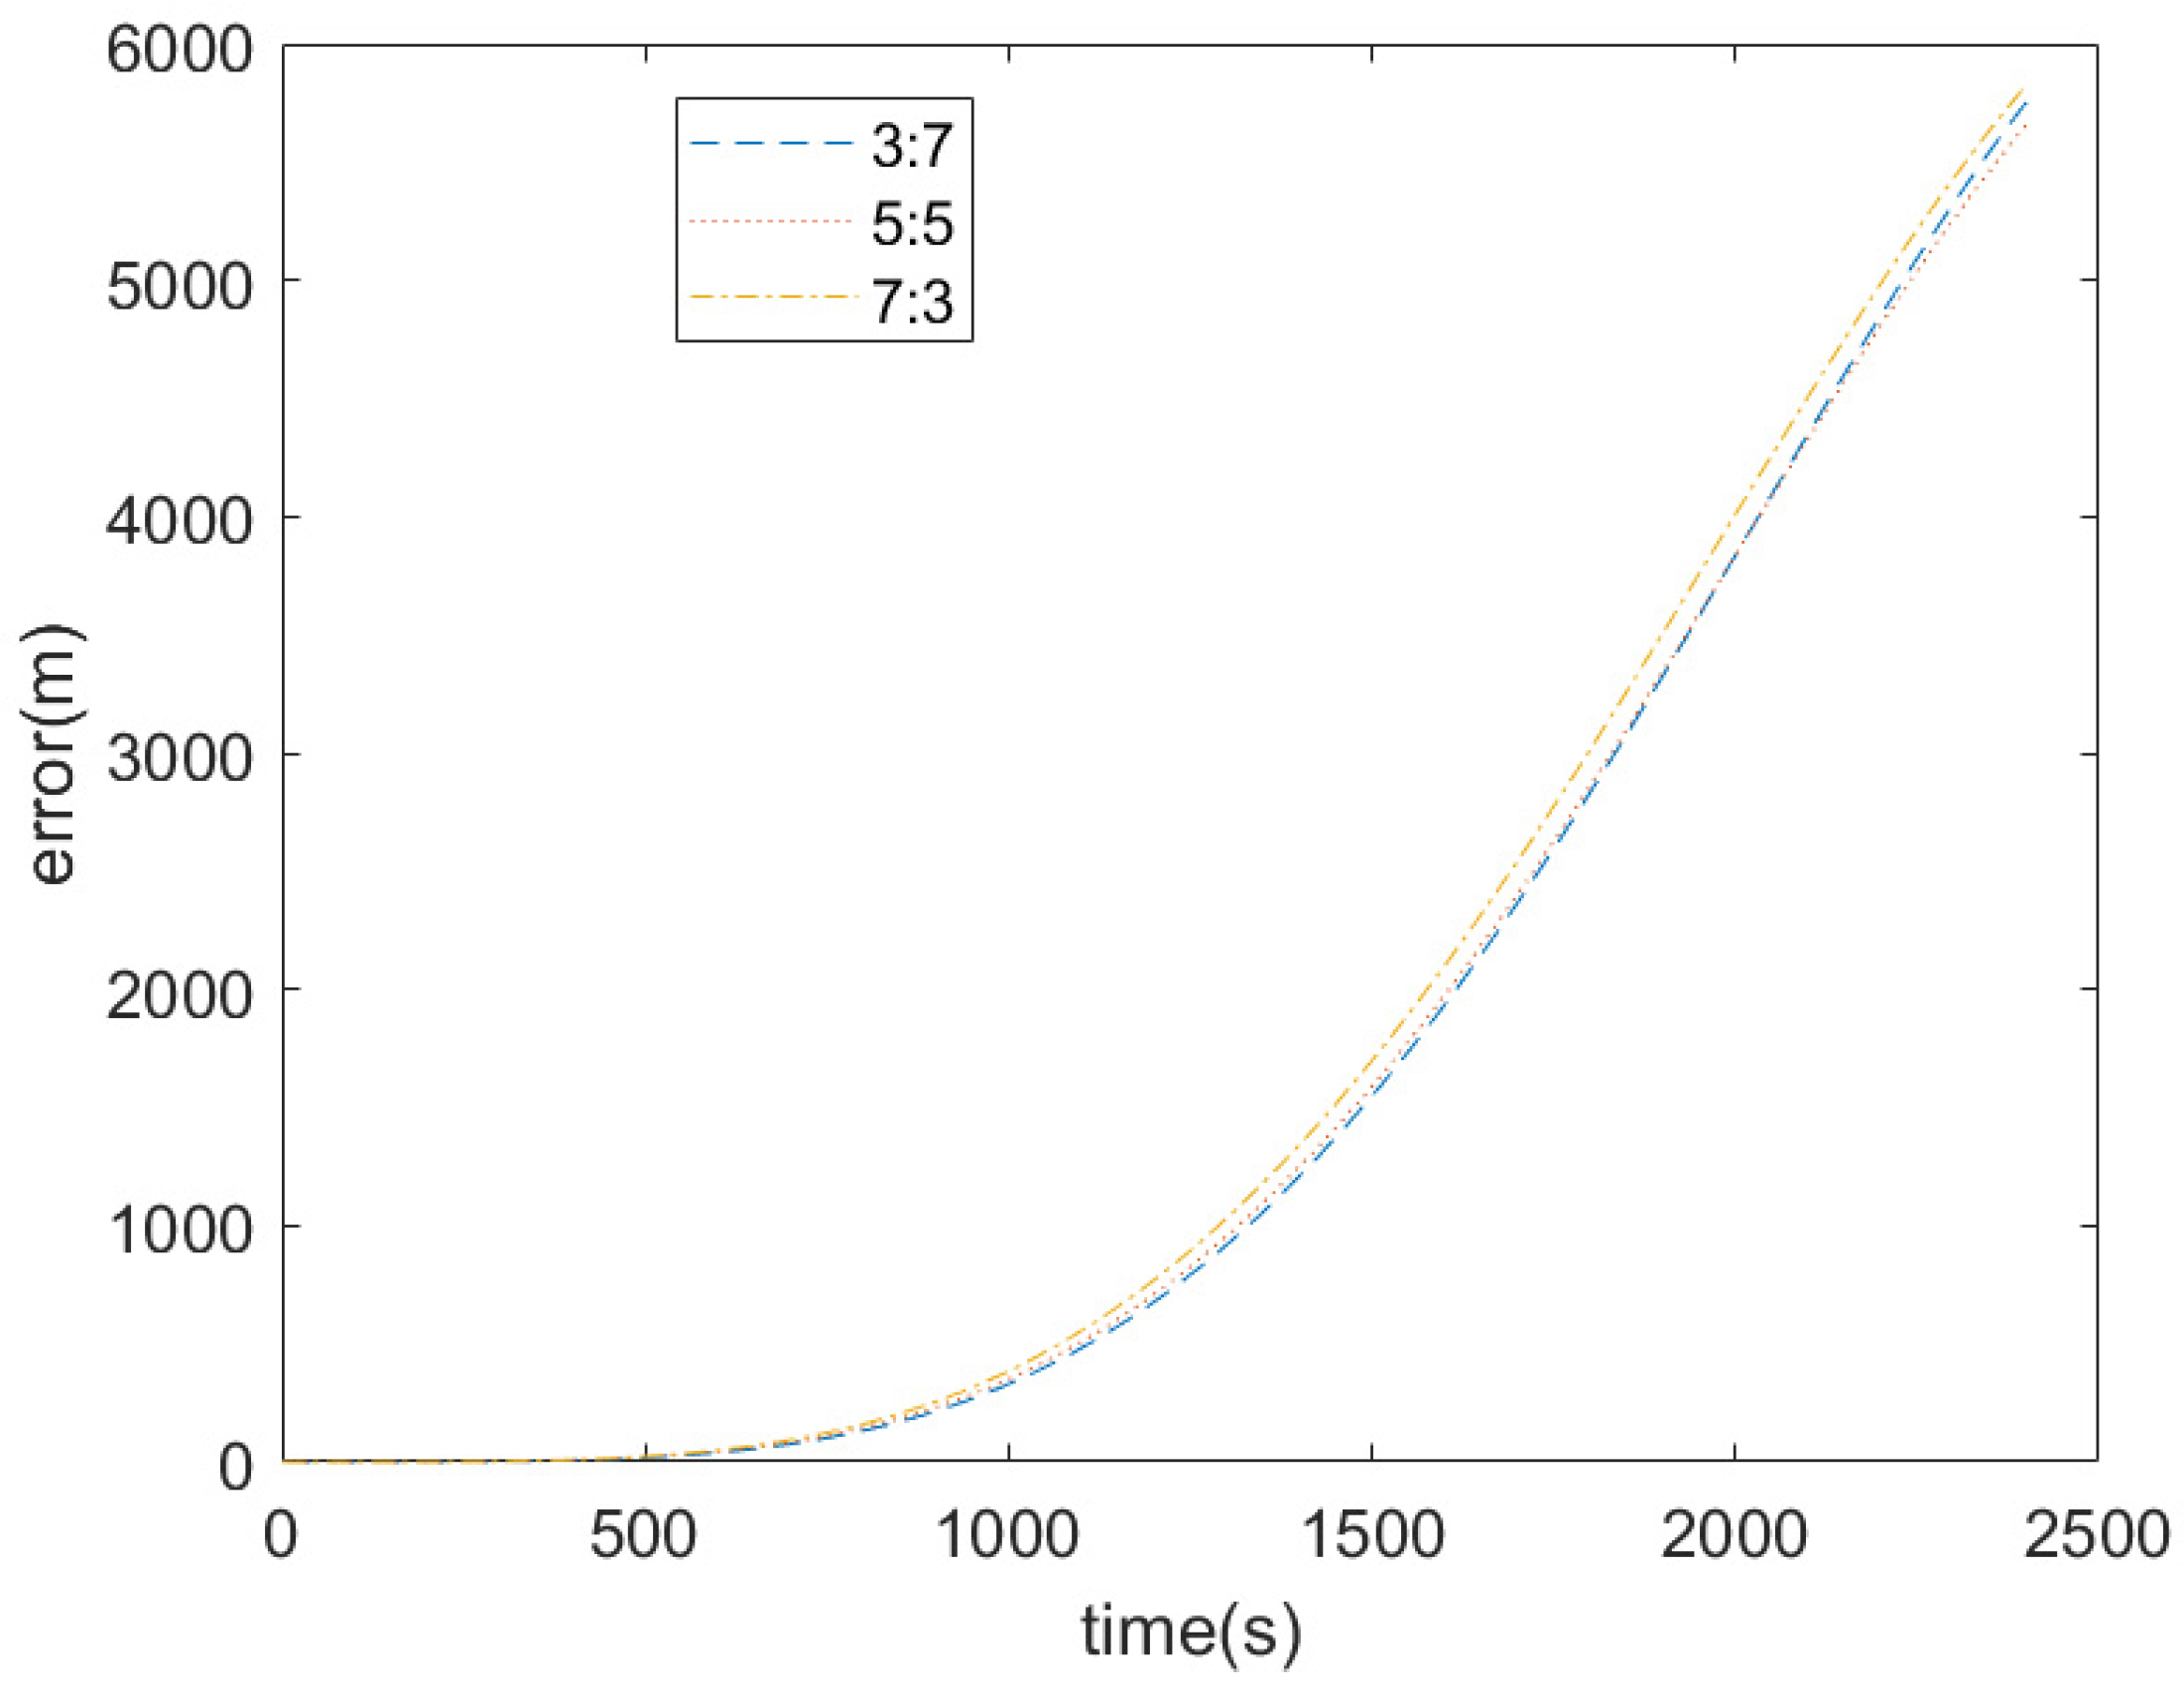
Due to the displacement of position and velocity, pulsar distortion can be caused. The measure of the reactive motion state is a dimensionless quantity. This measurement is obtained by fitting the position error and velocity error using the least squares method. We can sample the position and velocity parts together according to different proportions of sampling steps.
3.3. The Comprehensive Measurement of Position and Velocity
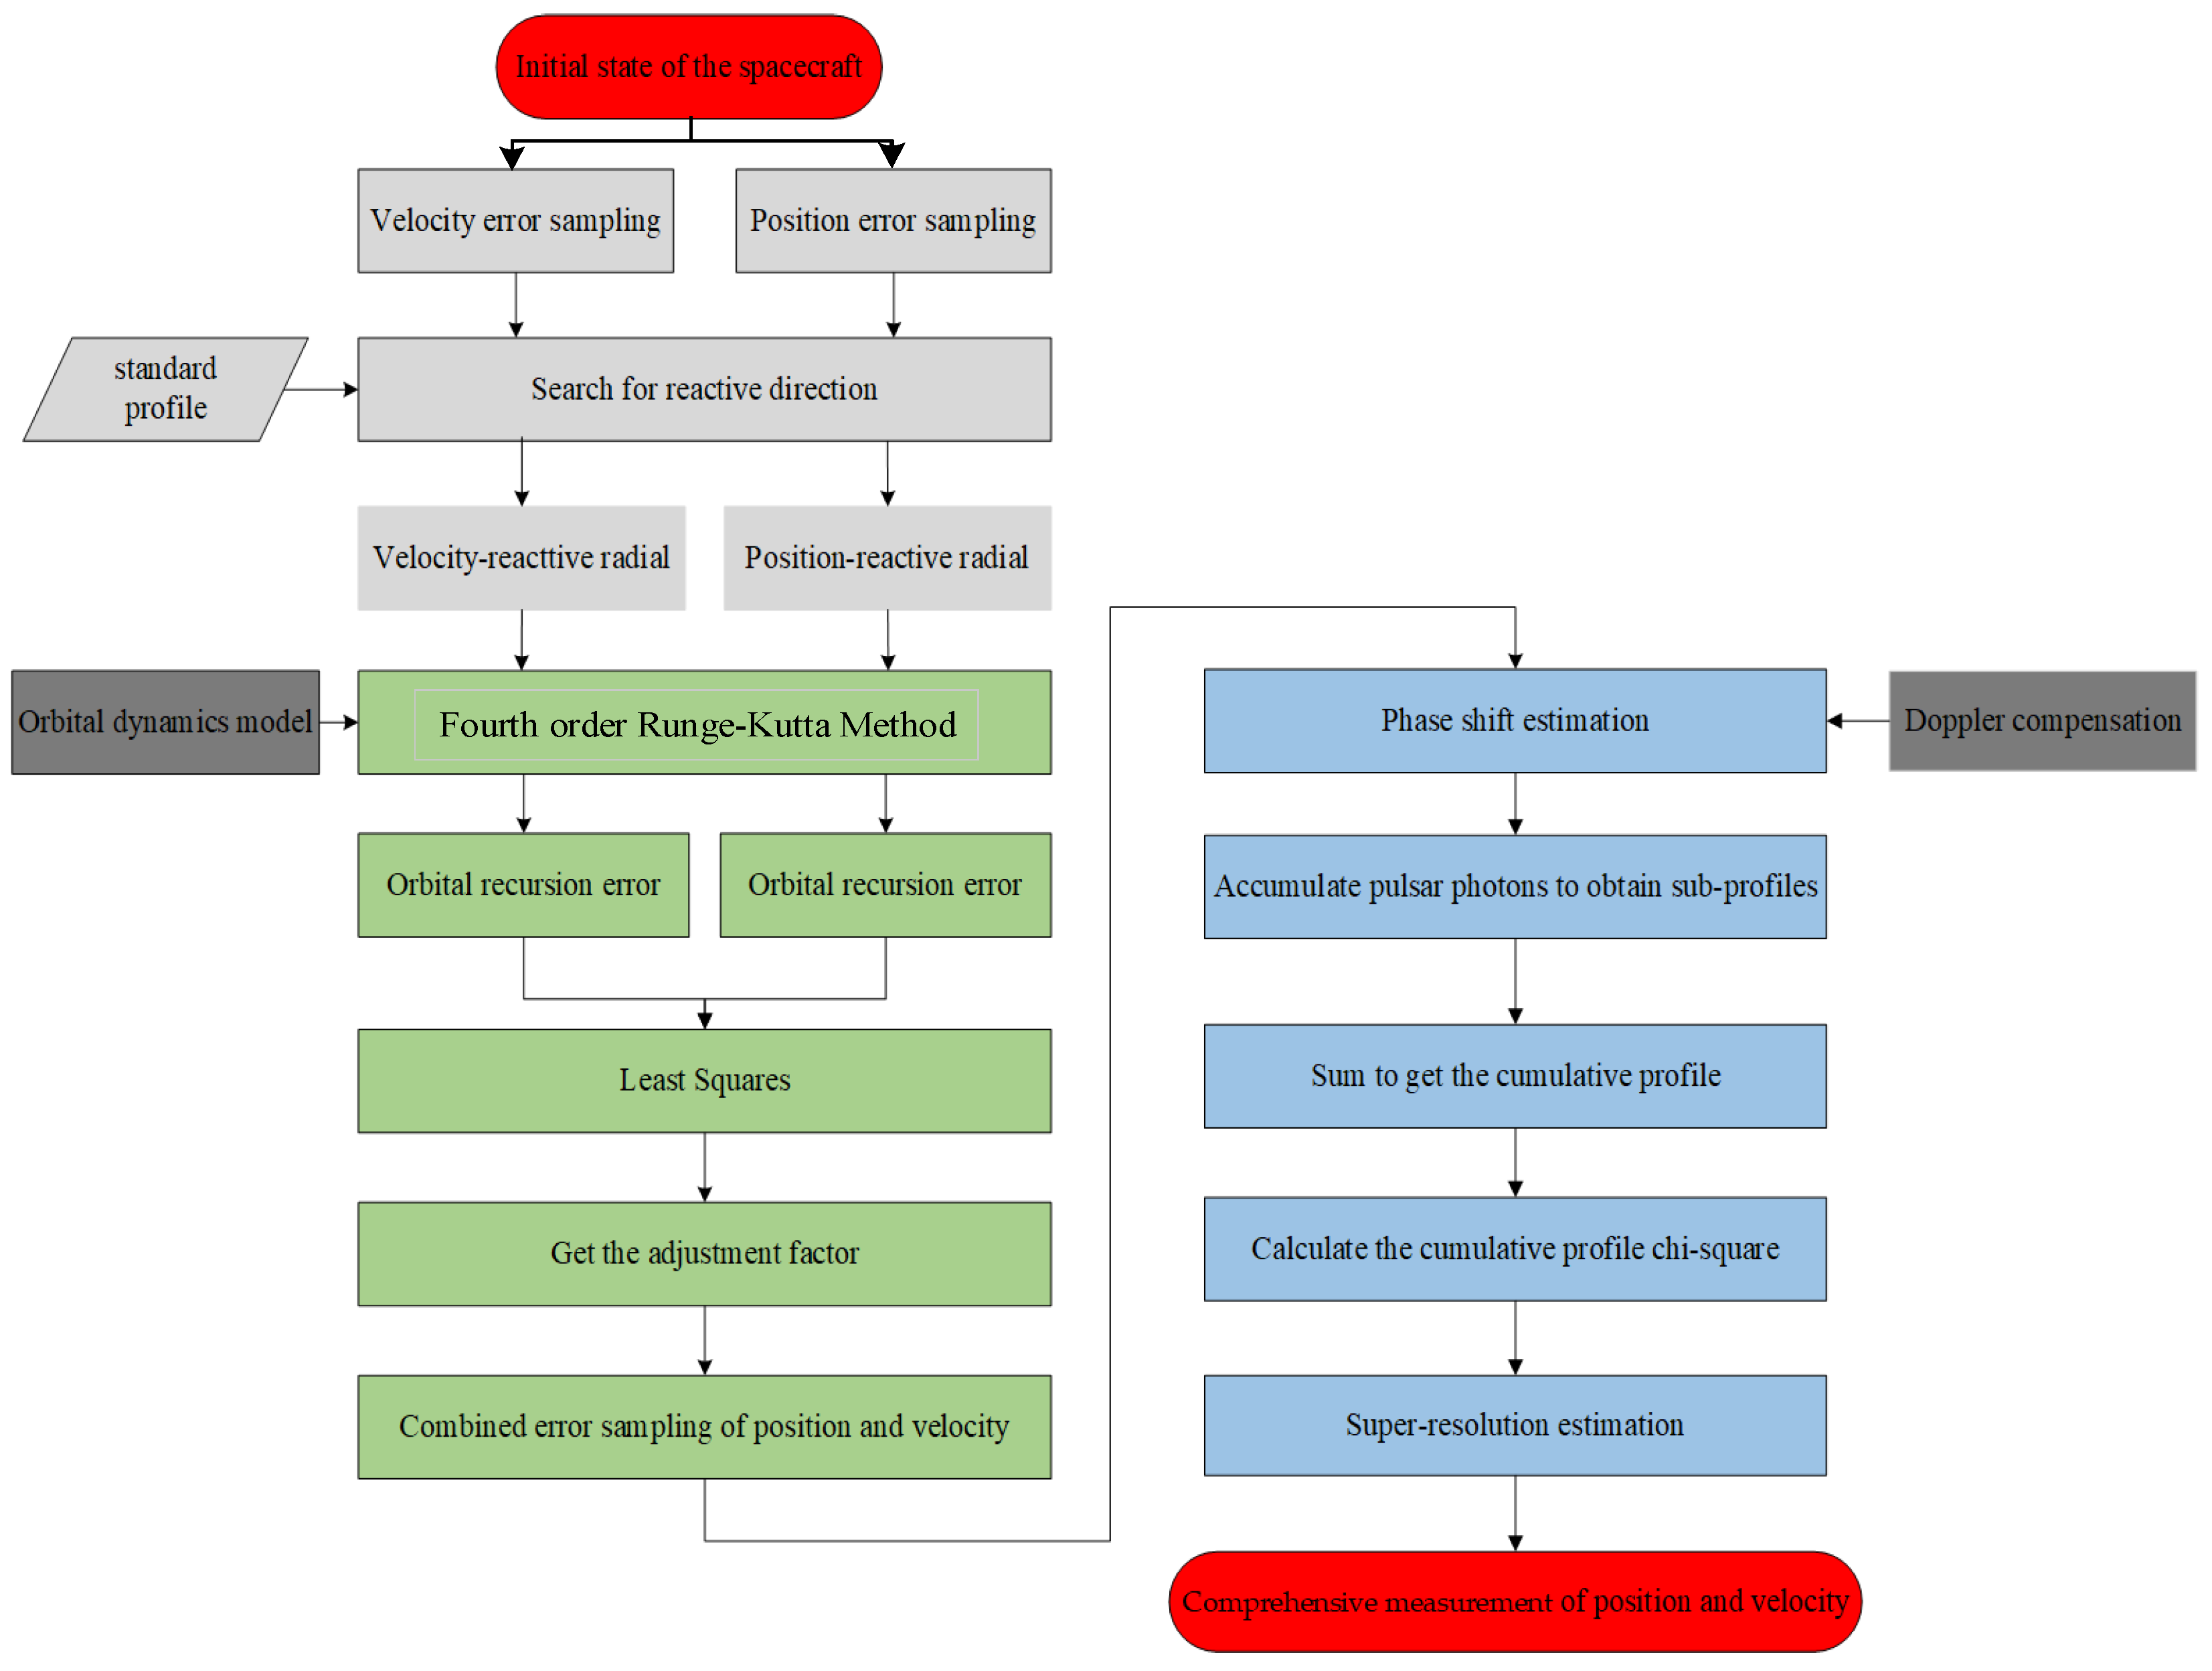
The flowchart of the Comprehensive Measurement of Position and Velocity is shown in
Figure 4. The specific steps are as follows:
Step 1: Solve the position–velocity adjustment coefficient. Combining the orbital dynamics model and the fourth-order Runge–Kutta method, we also solve for the adjustment coefficient k in the discovered reactive directions and according to Equation (16).
Step 2: Sample the reactive motion state measure. Given the indistinguishability between position and velocity, we set the error ratio to 5 to 5, defining a reactive motion state measure for the joint position–velocity. The combined initial error is expressed as follows:
where
and
represent the sampling interval;
denotes the number of samples;
is a variable,
.
and
are proportional coefficients.
and
are the errors in
and
, respectively.
Step 3: Estimate the phase shift. Due to the presence of combined initial errors, it inevitably causes a phase drift. Based on the nature of error propagation, errors on the transverse plane can induce positional errors in the radial direction of the pulsar. By incorporating the combined errors into the orbital dynamics model, the radial position at moment
can be estimated as
. At this point, the phase shift of the pulsar is as follows:
where c is the speed of light, and
is the intrinsic period of the pulsar.
Step 4: Accumulate the pulsar profiles. Let
be the sub-profile of the pulsar accumulated over a time period. The accumulated pulsar profile
is the result of shifting and superimposing all the accumulated sub-profiles of the pulsar, which can be represented as follows:
Step 5: Calculate the accumulated profiles. Calculate the value of for a total of profiles generated in Step 4.
Step 6: Perform comprehensive super-resolution measurement [
38]. Perform a comprehensive measurement with super-resolution estimation to significantly improve the estimation accuracy. The super-resolution expression for a one-dimensional matrix is as follows:
In the expression, element represents the maximum element, and is the index of the maximum element, while and denote the elements immediately to the right and left of the maximum element, respectively. From Equation (22), it follows that is the sampling point for super-resolution, and is the error in the reactive motion state measure that we seek.
