Article

Analytic Solutions for Volume, Mass, Center of Gravity, and Inertia of Wing Segments and Rotors of Constant Density †

by
Benjamin C. Moulton
* and
Douglas F. Hunsaker
Mechanical and Aerospace Engineering, Utah State University, Logan, UT 84322, USA
*
Author to whom correspondence should be addressed.
This paper is an extended version of our paper published in Paper 2023-2432 at the AIAA SciTech Forum, National Harbor, Maryland, 23–27 January 2023.
Aerospace 2024, 11(6), 492; https://doi.org/10.3390/aerospace11060492
Submission received: 2 April 2024 / Revised: 6 June 2024 / Accepted: 13 June 2024 / Published: 19 June 2024
(This article belongs to the Section Aeronautics)

Abstract

:
In the preliminary design of aircraft lifting surfaces, accurate mass and inertia properties can be difficult to obtain. Typically, such methods as computer-aided design or statistical processes are used to determine these properties. These methods require significant time and effort to implement. The present paper presents an exact analytic method for calculating the volume, mass, center of gravity, and inertia properties of wing segments and rotors of constant density. The influence of taper, spanwise thickness distribution, airfoil geometry, and sweep are included. The utility of the method is presented, and the accuracy is evaluated with various test cases via percent difference with a corresponding computer-aided design model. These case studies demonstrate the present method to be accurate to within about 1% for typical wing geometries and within about 1.3% for typical propeller geometries.

1. Introduction

A primary facet of aircraft design is the determination of aircraft volume, mass, center of gravity (CG), and inertia properties. This is because each of these properties can significantly affect the evaluation metrics of the aircraft design. For example, the wing volume can be used to inform the design of internal structures such as fuel tanks and actuators. The mass and CG location can be used to evaluate aircraft performance and stability properties. The inertias can be used to determine aircraft dynamics and overall performance.
Once a design has sufficiently matured, these mass and inertia properties can quite accurately be evaluated using computer-aided design (CAD) software [1,2,3,4] or measured using various experimental techniques such as bifilar pendulums [5,6,7,8,9], trifilar pendulums [10], compound pendulums [8,11,12], suspension systems [13,14,15], knife-edge fulcrums [16,17], torque frames [18], and flight test data [19].
However, volume, mass, CG location, and inertia properties can be difficult to determine during early design phases. This is because they depend on wing external shape and internal mass distribution, which can change frequently in the initial stages of design. Several methods have been suggested for use in early design phases by previous authors, such as the lumped masses method [1,20,21,22], statistical methods [1], or approximate methods [23]. Each of these methods may not be ideal during the early phases of design due to the time required to obtain a solution, as is typically the case for CAD renderings, or due to inaccuracies arising from over-simplistic assumptions.
The present paper presents an analytic closed-form solution developed by the authors for calculating the exact volume, mass, CG location, and inertia properties of wing segments and rotors of constant density. The influence of geometric properties such as airfoil geometry, spanwise maximum thickness distribution, sweep, and taper are included. The present work fills a gap in the preliminary stages of the lifting surface design of some aircraft since it can be used to analytically obtain exact solutions for the volume, mass, CG location, and inertia properties of wing segments and rotors with minimal time and effort. Although the constraint of constant density in the present analysis may seem extremely limiting, a section has been included in this paper to discuss the application of this analytic solution to wings with complex internal structure or systems. For many unmanned air vehicles (UAVs), a foam core is used within the wings, making the assumptions used here very accurate for many UAV applications.
The following analysis requires solving several volume integrals. The steps for solving these integrals analytically are quite lengthy and, for brevity, have not been included here. These steps can be found in the original conference paper [24]. In the present paper, we include only the solutions to the volume integrals. The solutions included here are sufficient to employ the methods in a software environment to predict the volume, mass, CG location, and inertia properties of wings and rotors of constant density. An implementation of these methods in Python is publicly available in an online Github repository (https://github.com/benjaminmoulton/MMoIpy (accessed on 1 April 2024)) and in a graphical aerodynamic design tool (http://aerotools.usu.edu/mu6 (accessed on 1 April 2024)).
The present paper is outlined as follows: in Section 2 are described the analytic equations for the volume, mass, CG location, and inertia properties of a wing segment and rotor. In each case, the geometry is described, as well as the general integral equation that must be solved. These equations are then applied in Section 3 for comparison of the present exact method with an approximate method presented by Lanham [23]. In Section 4 the present method is applied to two simple examples of a wing segment and a rotor to evaluate some of the limitations of the method. In Section 5, an example application is presented for how this method could be used with respect to more complicated wing geometries, for which the density may not be constant. Conclusions are drawn in Section 6 regarding the use of the presented method.

2. Analytic Solutions

2.1. Wing Segment

A wing segment can be wholly defined by the semispan b, root chord c r , tip chord c t , root airfoil percent maximum thickness τ r , tip airfoil percent maximum thickness τ t , airfoil thickness distribution μ , quarter-chord sweep angle Λ , dihedral angle Γ , and airfoil thickness distribution μ ( x a / c ) . A drawing of a wing segment is shown in Figure 1. In the present method, sweep and dihedral angles are assumed to be constant, and chord and airfoil thickness are allowed to vary linearly from root to tip. In this development, the influences of the wing twist and airfoil camber are neglected, as these generally have a minor effect on the mass properties of the wing relative to the other parameters listed.
Here, the quarter-chord location at the wing root is selected as the origin for the wing coordinate frame. The x-axis is aligned with the chord-line and points out the leading edge, the y-axis is specified as positive from the root to tip of a right wing, and the z-axis points out the bottom of the wing, completing the right-handed coordinate system. Wing sweep is defined as a chordwise shearing of the wing in the x y plane, whereas dihedral is defined as a rotation of the wing coordinate frame about an aircraft body-fixed x-axis. Therefore, the present analysis includes the effects of sweep on the inertia properties of the wing in the wing coordinate system. However, since dihedral is a solid-body rotation of the wing, the effects of dihedral are not included in the wing coordinate system but can be easily accounted for in the aircraft coordinate system by rotating the results obtained from this analysis [24]. Note, semispan length b is defined parallel to the y-axis.
The airfoil used for the wing segment can have a significant effect on the mass properties of the wing. The mass properties of the airfoil are calculated to include effects due to airfoil thickness distribution, and neglect effects due to camber. For the purposes of this analysis, it is helpful to define an airfoil coordinate system. The traditional coordinate frame for an airfoil is used here, with the origin at the airfoil leading-edge, the x-axis pointing along the chord-line out the trailing edge, and the y-axis pointing up normal to the x-axis. The ordinates are subscripted as x a and y a for clarity.
The thickness distribution of an airfoil as a function of percent chord τ ( x a / c ) can be defined as the product of the maximum thickness τ m and thickness distribution function μ ( x a / c )
τ x a c = τ m μ x a c
In the present analysis, the thickness distribution function μ ( x a / c ) is held constant across the wing segment, although the maximum thickness τ m is allowed to vary linearly as shown in Equation (5). The method presented here can be used to account for any arbitrary thickness distribution μ ( x a / c ) . Results for two thickness distributions are included as examples. The two thickness distributions that are considered here are the NACA 4-digit series distribution, and a diamond airfoil distribution. The thickness distribution of the NACA 4-digit series [25] is
μ x a c = a 0 x a c + a 1 x a c + a 2 x a c 2 + a 3 x a c 3 + a 4 x a c 4
This thickness distribution is quite versatile and can be used to fit a wide range of airfoils outside of the NACA 4-digit series. Any values for these coefficients can be used without a loss of the generality of the model. Table 1 shows values for each of these coefficients that can be used to match the thickness distribution for a number of airfoils, even those that do not use a NACA 4-digit thickness distribution.
The general thickness distribution for a diamond airfoil is also demonstrated. This thickness distribution can be written as
μ x a c = x a / c x m / c , 0 x a c x m c 1 x a / c 1 x m / c , x m c x a c 1
where x m / c is the chordwise location of max thickness in percent chord.
For the wing segment, the chord c and airfoil maximum thickness in percent chord τ m vary linearly from the root to tip of the wing segment as
c ( y ) = ( c t c r ) y b + c r
τ m ( y ) = ( τ t τ r ) y b + τ r
The maximum wing thickness at any spanwise location depends on both the local airfoil maximum thickness and the local chord according to
t m ( y ) = τ m ( y ) c ( y )
Note, as τ m ( y ) and c ( y ) vary linearly, t m ( y ) may be nonlinear.

2.1.1. Volume and Center of Gravity

The volume, mass, center of gravity, and inertia properties of the wing require solving the general volume integrals given in detail in [24]. Each of these integrals are volume integrals with terms of the form x i y j z k where i, j, and k are each whole numbers. For brevity, detailed solutions to those integrals are not included here but are included in [24] and have the general form
S i , j , k = 0 b 3 4 c ( y ) 1 4 c ( y ) 1 2 τ m ( y ) μ ( x ) c ( y ) 1 2 τ m ( y ) μ ( x ) c ( y ) x i y j z k d z d x d y
The solutions to Equation (7) will be referenced here as S i , j , k . Integrals related to the airfoil thickness distribution are also included in [24].
The boundary of a wing-segment in the wing segment coordinate frame is defined by the region
0 x ^ 1 , 0 y ^ 1 , 0 z ^ 1
where the following change in variables has been applied:
x ^ = 1 4 x c ( y ^ ) , y ^ = y b , z ^ = 1 2 z τ m ( y ^ ) μ ( x ^ ) c ( y ^ )
This change in variables results in the following derivatives:
d x ^ = d x c ( y ^ ) , d y ^ = d y b , d z ^ = d z τ m ( y ^ ) μ ( x ^ ) c ( y ^ )
Note, the negative signs in the derivatives for x and z, when applied in the integral derivations, flip the integrand direction from 1 through 0 to 0 through 1.
The local chord and maximum airfoil thickness given in Equations (4) and (5) can be written using this change in variables as follows:
c ( y ^ ) = c t c r y ^ + c r
τ m ( y ^ ) = τ t τ r y ^ + τ r
Because the dimensional x and c ( y ^ ) values for the x ^ change in variables in Equation (9) are in the wing segment coordinate system, the symbol x ^ is equivalent to the local airfoil chordwise ratio x a / c . Therefore, because we are fixing μ ( x a / c ) to be constant along the wing, the general thickness distribution given in Equation (1) can be written as a function of both spanwise location and chordwise coordinate.
τ ( x ^ , y ^ ) = τ m ( y ^ ) μ ( x ^ )
For the NACA 4-digit thickness distribution,
μ ( x ^ ) = a 0 x ^ + a 1 x ^ + a 2 x ^ 2 + a 3 x ^ 3 + a 4 x ^ 4
and for the diamond airfoil thickness distribution,
μ ( x ^ ) = x ^ x ^ m , 0 x ^ x ^ m 1 x ^ 1 x ^ m , x ^ m x ^ 1
Due to the definition of thickness distribution in the chordwise direction, the z bounds depend on the chordwise coordinate x. Also, due to the definition of linear changes in chord and airfoil thickness, the x and z bounds depend on the spanwise coordinate y. The change in variables and corresponding bounds are applied to the S i , j , k volume integral in Equation (7) as
S i , j , k = Υ n b j + 1 0 1 τ m ( y ^ ) k + 1 c ( y ^ ) i + k + 2 y ^ j 0 1 1 4 x ^ i 0 1 1 2 z ^ k d z ^ d x ^ d y ^
where
Υ n = 0 1 μ ( x ^ ) k + 1 1 4 x ^ i d x ^ 0 1 1 4 x ^ i d x ^
Applying the change in variables and integrating gives the volume of the wing segment
V V d V = S 0 , 0 , 0 = b 12 κ a υ 0
where
κ a = τ r 3 c r 2 + 2 c r c t + c t 2 + τ t c r 2 + 2 c r c t + 3 c t 2
The parameter υ 0 depends on the integral shown in Equation (17), which is a function of the thickness distribution (solved as shown in [24]). For a wing using the NACA 4-digit thickness distribution,
υ 0 = 1 60 40 a 0 + 30 a 1 + 20 a 2 + 15 a 3 + 12 a 4
and for a wing using the diamond airfoil thickness distribution,
υ 0 = 1 2
Detailed derivations of the integrals resulting in the expressions for κ a and υ 0 are included in Moulton and Hunsaker [24]. The wing mass is related to the density ρ through
m = ρ V
The center of gravity of the wing segment is related to the mass-moment about each axis. Because sweep affects the x coordinate of the mass of the wing, the sweep angle must be accounted for when computing the x-coordinate of the CG location. The shift due to sweep, y tan Λ , can be applied to the x-coordinate, which gives
x ¯ = ρ m V x y tan Λ d V = ρ m V x d V ρ m tan Λ V y d V
It should be noted that sweep does not need to be applied to the integrations for y ¯ or z ¯ because these integrals do not contain an x term, and sweep does not affect the y or z coordinates of mass within the wing segment. Because sweep affects a right wing differently than a left wing, the difference in solution between left and right wings will be accounted for by defining
δ 1 , right wing 1 , left wing
The integrals required to find x ¯ , y ¯ , and z ¯ about the wing root quarter-chord are given in Moulton and Hunsaker [24] and result in
(25) x ¯ = ρ m V x y tan Λ d V = ρ m [ S 1 , 0 , 0 tan Λ S 0 , 1 , 0 ] = ρ m b 240 3 κ b υ 1 + 4 b κ c υ 0 tan Λ (26) y ¯ = ρ m V y d V = ρ m δ S 0 , 1 , 0 = ρ m δ b 2 60 κ c υ 0 (27) z ¯ = ρ m V z d V = ρ m S 0 , 0 , 1 = 0
where
(28) κ b = τ r 4 c r 3 + 3 c r 2 c t + 2 c r c t 2 + c t 3 + τ t c r 3 + 2 c r 2 c t + 3 c r c t 2 + 4 c t 3 (29) κ c = τ r 3 c r 2 + 4 c r c t + 3 c t 2 + 2 τ t c r 2 + 3 c r c t + 6 c t 2
For a wing using the NACA 4-digit thickness distribution [24],
υ 1 = 1 60 56 a 0 + 50 a 1 + 40 a 2 + 33 a 3 + 28 a 4
and for a wing using the diamond airfoil thickness distribution [24],
υ 1 = 4 x ^ m + 1 6
Using Equation (18) and applying the result along with Equations (25)–(27) gives the location of the CG relative to the wing origin:
(32) x ¯ = 3 κ b υ 1 + 4 b κ c υ 0 tan Λ 20 κ a υ 0 (33) y ¯ = δ b κ c 5 κ a (34) z ¯ = 0
Because twist and camber are neglected, the z coordinate of the CG location, z ¯ , is zero. Note, sweep only affects the x coordinate of the CG location, x ¯ .

2.1.2. Inertia Tensor

The inertia tensor for the wing segment can be computed about the origin of the wing segment coordinate system. Applying the shift due to sweep results in the inertia tensor about the wing segment origin
[ I ] o = ρ V y 2 + z 2 ( x y ) ( x z ) ( x y ) x 2 + z 2 ( y z ) ( x z ) ( y z ) x 2 + y 2 d V + ρ V 0 ( y 2 tan Λ ) ( y z tan Λ ) ( y 2 tan Λ ) y 2 tan 2 Λ 2 x y tan Λ 0 ( y z tan Λ ) 0 y 2 tan 2 Λ 2 x y tan Λ d V
The volume integrals required in Equation (35) can be expressed as [24]
[ I ] o I x x o I x y o I x z o I y x o I y y o I y z o I z x o I z y o I z z o
where
(37) I x x o = ρ ( S 0 , 2 , 0 + S 0 , 0 , 2 ) = ρ b 3360 56 b 2 κ f υ 0 + κ g υ 3 I y y o = ρ ( S 2 , 0 , 0 + S 0 , 0 , 2 + S 0 , 2 , 0 tan 2 Λ 2 S 1 , 1 , 0 tan Λ ) (38) = ρ b 10080 84 b 2 b κ f υ 0 tan 2 Λ + κ d υ 1 tan Λ + 49 κ e υ 2 + 3 κ g υ 3 I z z o = ρ S 2 , 0 , 0 + tan 2 Λ + 1 S 0 , 2 , 0 2 S 1 , 1 , 0 tan Λ (39) = ρ b 1440 12 b 2 b tan 2 Λ + 1 κ f υ 0 + κ d υ 1 tan Λ + 7 κ e υ 2
(40) I x y o = I y x o = ρ δ ( S 1 , 1 , 0 S 0 , 2 , 0 tan Λ ) = ρ δ b 2 240 4 b κ f υ 0 tan Λ + κ d υ 1 (41) I x z o = I z x o = ρ ( S 1 , 0 , 1 S 0 , 1 , 1 tan Λ ) = 0 (42) I y z o = I z y o = ρ δ S 0 , 1 , 1 = 0
and
(43) κ d = τ r c r + c t 2 c r 2 + c r c t + 2 c t 2 + τ t c r 3 + 3 c r 2 c t + 6 c r c t 2 + 10 c t 3 (44) κ e = τ r 5 c r 4 + 4 c r 3 c t + 3 c r 2 c t 2 + 2 c r c t 3 + c t 4 + τ t c r 4 + 2 c r 3 c t + 3 c r 2 c t 2 + 4 c r c t 3 + 5 c t 4 (45) κ f = τ r c r 2 + 2 c r c t + 2 c t 2 + τ t c r 2 + 4 c r c t + 10 c t 2 κ g = τ r 3 35 c r 4 + 20 c r 3 c t + 10 c r 2 c t 2 + 4 c r c t 3 + c t 4 + τ r 2 τ t 15 c r 4 + 20 c r 3 c t + 18 c r 2 c t 2 + 12 c r c t 3 + 5 c t 4 + τ r τ t 2 5 c r 4 + 12 c r 3 c t + 18 c r 2 c t 2 + 20 c r c t 3 + 15 c t 4 (46) + τ t 3 c r 4 + 4 c r 3 c t + 10 c r 2 c t 2 + 20 c r c t 3 + 35 c t 4
For a wing using the NACA 4-digit thickness distribution [24],
(47) υ 2 = 1 980 856 a 0 + 770 a 1 + 644 a 2 + 553 a 3 + 484 a 4 υ 3 = 2 5 a 0 3 + a 0 2 a 1 + 3 4 a 0 2 a 2 + 3 5 a 0 2 a 3 + 1 2 a 0 2 a 4 + 6 7 a 0 a 1 2 + 4 3 a 0 a 1 a 2 + 12 11 a 0 a 1 a 3 + 12 13 a 0 a 1 a 4 + 6 11 a 0 a 2 2 + 12 13 a 0 a 2 a 3 + 4 5 a 0 a 2 a 4 + 2 5 a 0 a 3 2 + 12 17 a 0 a 3 a 4 + 6 19 a 0 a 4 2 + 1 4 a 1 3 + 3 5 a 1 2 a 2 + 1 2 a 1 2 a 3 + 3 7 a 1 2 a 4 + 1 2 a 1 a 2 2 + 6 7 a 1 a 2 a 3 + 3 4 a 1 a 2 a 4 + 3 8 a 1 a 3 2 + 2 3 a 1 a 3 a 4 + 3 10 a 1 a 4 2 + 1 7 a 2 3 + 3 8 a 2 2 a 3 + 1 3 a 2 2 a 4 + 1 3 a 2 a 3 2 + 3 5 a 2 a 3 a 4 (48) + 3 11 a 2 a 4 2 + 1 10 a 3 3 + 3 11 a 3 2 a 4 + 1 4 a 3 a 4 2 + 1 13 a 4 3
and for a wing using the diamond airfoil thickness distribution [24],
(49) υ 2 = 8 x ^ m 2 + 3 14 (50) υ 3 = 1 4
Because mass is directly related to volume and density, the tensor components can also be expressed as
(51) I x x o = m 56 b 2 κ f υ 0 + κ g υ 3 280 κ a υ 0 (52) I y y o = m 84 b 2 b κ f υ 0 tan 2 Λ + κ d υ 1 tan Λ + 49 κ e υ 2 + 3 κ g υ 3 840 κ a υ 0 (53) I z z o = m 12 b 2 b tan 2 Λ + 1 κ f υ 0 + κ d υ 1 tan Λ + 7 κ e υ 2 120 κ a υ 0 (54) I x y o = I y x o = δ b m 4 b κ f υ 0 tan Λ + κ d υ 1 20 κ a υ 0 (55) I x z o = I z x o = I y z o = I z y o = 0
The inertia components given in Equations (37)–(42) and (51)–(55) can be used in Equation (36) to compute the inertia tensor about the origin of the wing segment coordinate frame. However, in order to include the inertia components of the wing segment in the computation of the inertia of an entire aircraft, it is helpful to know the inertia components of the wing segment about the CG of the wing segment. From the parallel axis theorem, the inertia tensor about an arbitrary point [ I ] 1 is related to the inertia tensor about the CG [ I ] according to
[ I ] 1 = [ I ] + m ( s · s ) [ E ] s s T
where s is the vector from the CG to the point of interest and [ E ] is a 3 × 3 identity matrix. This relationship can be rearranged to yield the inertia about the wing segment CG given the inertia about the origin of the wing segment coordinate system
[ I ] = [ I ] o m ( s · s ) [ E ] s s T
where s is the vector from the wing segment CG to the wing segment origin
s = x ¯ y ¯ z ¯
Using Equation (58) in Equation (57) and simplifying gives the inertia tensor of the wing segment about the wing segment CG
[ I ] = [ I ] o m y ¯ 2 + z ¯ 2 x ¯ y ¯ x ¯ z ¯ x ¯ y ¯ x ¯ 2 + z ¯ 2 y ¯ z ¯ x ¯ z ¯ y ¯ z ¯ x ¯ 2 + y ¯ 2

2.2. Rotor

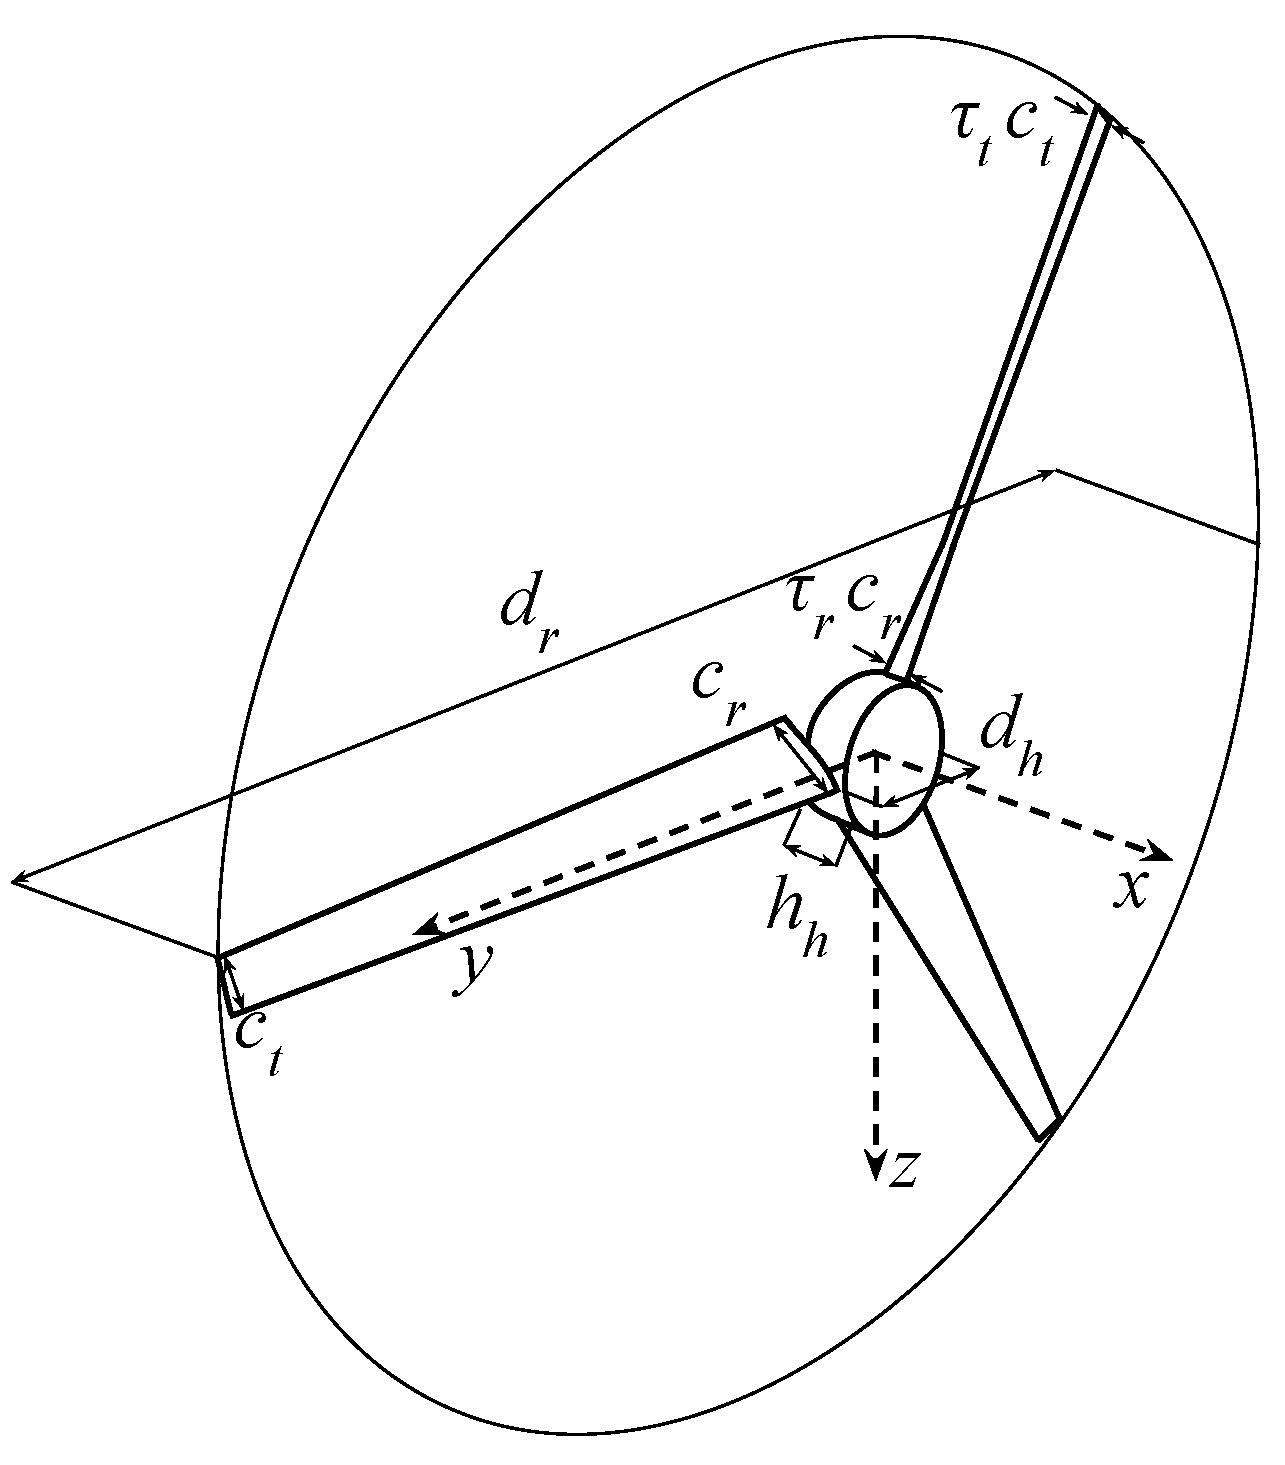
To estimate the volume, mass, and inertia properties of a rotor, the rotor will be defined by the number of blades N b , rotor diameter d r , hub diameter d h , hub height h h , blade root chord c r , blade tip chord c t , blade root airfoil percent maximum thickness τ r , and blade tip airfoil percent maximum thickness τ t . Just as wing twist and airfoil camber were neglected in the analysis of a wing segment, the influence of blade pitch and airfoil camber will be neglected in the analysis of a rotor. Figure 2 shows a rotor and the associated local Cartesian coordinates. Note that because camber and pitch are neglected, the coordinate system of the origin coincides with the rotor CG.
In the present analysis, the chord and maximum airfoil thickness ratio are allowed to vary linearly as a function of radius r according to
c ( r ) = ( c t c r ) ( r r r ) ( r t r r ) + c r
τ m ( r ) = ( τ t τ r ) ( r r r ) ( r t r r ) + τ r
where r r = d h / 2 and r t = d r / 2 denote the radius at the blade root and tip, respectively. The dimensional maximum airfoil thickness at any radius is
t ( r ) = τ m ( r ) c ( r )

2.2.1. Volume

The volume of this time-averaged rotor can be calculated by summing the volume of each blade and the volume of the hub. The volume of the hub can be determined from the volume of a cylinder with a diameter equal to the hub diameter and a height equal to the hub height. Hence, the volume of the hub can be computed from
V h = π h h r r 2
The volume of an individual rotor blade is simply the volume of a single wing segment. Replacing the semispan in Equation (18) with the difference in rotor radius and hub radius gives
V b = r t r r 12 κ a υ 0
The total volume of the rotor is the sum of the volume of the hub and the volume of the blades
V = V h + N b V b
Given a total weight or mass of the rotor, the density of the rotor can be found by applying the total volume determined from Equation (65). Once the density is known, the mass and weight of the hub and blades can be found individually from the known individual volumes given in Equations (63) and (64). This information will be useful in the computation of the inertia tensor.

2.2.2. Inertia Tensor

The inertia tensor of a rotor can be determined by summing the inertia tensor of the hub and blades as
[ I ] = [ I ] h + [ I ] b
The inertia tensor of the hub can be determined from that of a cylinder with the outer diameter equal to the diameter of the hub R 2 = r r and using a cylinder height equal to the hub height h = h h . This gives
[ I ] h = m h 2 r r 2 0 0 0 m h 12 3 r r 2 + h h 2 0 0 0 m h 12 3 r r 2 + h h 2
where m h is the mass of the hub.
The inertia tensor of the rotor blades at any point in time depends on the orientation of the blades about the axis of the rotor. Since rotors are commonly spinning during flight, the inertia tensor is a function of time. However, an approximate static inertia tensor for the rotor can be developed by distributing the mass of the rotor blades within a circular disk of the same diameter as the rotor. At each radial distance, the differential area of the disk is equal to the differential area from all the rotor blades at the same radial location. This fact can be applied by setting the area of a thin cylinder equal to the area of the rotor blades at any given radial distance. The area A of a thin cylinder of radius r and height h is
A ( r ) = 2 π r h
The total area of the rotor blades passing through a given radius is
A ( r ) = N b τ m ( r ) c ( r ) 2 υ 0
where τ m ( r ) υ 0 accounts for the airfoil area nondimensionalized by c 2 . Setting Equation (68) equal to Equation (69) and solving for the disk height gives the height of the disk as a function of radial position
h ( r ) = N b τ m ( r ) c ( r ) 2 υ 0 2 π r
In order to compute the inertia components, it is helpful to convert this system to polar coordinates (to align the axes as defined for the rotor) where
x = x , y = r cos φ , z = r sin φ
The angle φ is the angle about the x-axis, with a counter clockwise angle being positive. The inertia tensor can be written as
[ I ] b = ρ V r 2 x r cos φ x r sin φ x r cos φ x 2 + r 2 sin 2 φ 1 2 r 2 sin ( 2 φ ) x r sin φ 1 2 r 2 sin ( 2 φ ) x 2 + r 2 cos 2 φ d x r d r d φ
This form of the inertia tensor can be defined using volume integrals T i , j , k defined as
T i , j , k = 0 2 π cos j φ sin k φ r r r t r j + k + 1 1 2 h ( r ) 1 2 h ( r ) x i d x d r d φ
Solutions for these integrals are included in [24] and can be used to compute the inertia tensor of the blades
[ I ] b = I x x I x y I x z I y x I y y I y z I z x I z y I z z
where
I x x = m b T 0 , 2 , 0 + T 0 , 0 , 2 T 0 , 0 , 0 = m b r r 3 γ l + r r 2 r t γ m + r r r t 2 γ n + r t 3 γ o 5 r t r r κ a
I y y = m b T 2 , 0 , 0 + T 0 , 0 , 2 T 0 , 0 , 0 = I z z = m b T 2 , 0 , 0 + T 0 , 2 , 0 T 0 , 0 , 0
I x y = I y x = I x z = I z x = I y z = I z y = 0
with
m b = ρ b T 0 , 0 , 0 = ρ b N b V b
and
(79) T 0 , 0 , 0 = 1 12 N b κ a υ 0 r t r r (80) T 1 , 0 , 0 = T 0 , 1 , 0 = T 0 , 0 , 1 = T 1 , 1 , 0 = T 1 , 0 , 1 = T 0 , 1 , 1 = 0 T 2 , 0 , 0 = N b 3 υ 0 3 [ γ a r r 10 + γ b r r 9 r t + γ c r r 8 r t 2 + γ d r r 7 r t 3 + γ e r r 6 r t 4 + γ f r r 5 r t 5 + γ g r r 4 r t 6 (81) + γ h r r 3 r t 7 + γ i r r 2 r t 8 + γ j r r r t 9 + γ k r t 10 ] 13440 π 2 r r r t ( r r r t ) 9 (82) T 0 , 2 , 0 = T 0 , 0 , 2 = 1 120 N b υ 0 r r 3 γ l + r r 2 r t γ m + r r r t 2 γ n + r t 3 γ o
The coefficients γ a through γ o can be computed from [24]
γ a = 280 c t 6 τ t 3
γ b = d b c o T 35 15 5 1 5 5 3 1 5 9 9 5 1 3 5 5 1 5 15 35 5 45 315 3123 5 105 3123 4329 + 840 ln r r r t 0 0 0 0 0 0 0 0 0 0 0 0 0 0 0 0 0 0 0 0 0 0 0 1 0 0 1 3 τ o
γ c = 4 d c c o T 90 40 14 3 40 42 27 10 14 27 30 20 3 10 20 30 10 60 270 1089 20 270 3267 996 10 363 332 840 + 420 ln r r r t 0 0 0 0 0 0 0 0 0 0 0 0 0 0 0 0 0 0 0 1 0 0 3 4 0 1 3 4 3 0 τ o
γ d = 14 d d c o T 120 56 21 5 56 63 45 20 7 15 20 20 5 20 60 117 20 180 1053 21 20 351 21 280 39 7 280 280 + 60 ln r r r t 0 0 0 0 0 0 0 0 0 0 0 0 0 0 0 1 0 0 9 7 0 3 7 0 1 3 7 3 0 0 τ o
γ e = 28 d e c o T 168 84 35 10 28 35 30 20 35 90 180 174 10 60 174 33 20 174 99 70 174 297 630 280 33 210 280 420 + 60 ln r r r t 0 0 0 0 0 0 0 0 0 0 0 2 0 0 2 1 0 2 3 0 2 9 0 0 1 0 0 0 τ o
γ f = 70 d f c o T 126 70 35 15 14 21 27 12 7 27 36 12 1 4 4 1 12 36 27 7 12 27 21 14 15 35 70 126 + 60 ln r r r t 0 0 0 0 0 0 0 1 5 0 0 3 5 1 5 0 1 15 1 15 0 1 5 3 5 0 0 1 5 0 0 0 0 0 0 0 τ o
γ g = 28 d g c o T 420 280 210 33 280 630 297 174 70 99 174 20 33 174 60 10 174 180 90 35 20 30 35 28 10 35 84 168 60 ln r r r t 0 0 0 1 0 0 9 2 0 3 2 0 1 2 0 0 2 0 0 0 0 0 0 0 0 0 0 0 τ o
γ h = 14 d h c o T 280 280 7 39 280 21 351 20 21 1053 180 20 117 60 20 5 20 20 15 7 20 45 63 56 5 21 56 120 60 ln r r r t 0 0 7 3 1 3 0 7 3 0 7 9 0 0 1 0 0 0 0 0 0 0 0 0 0 0 0 0 0 0 τ o
γ i = 4 d i c o T 840 332 363 10 996 3267 270 20 1089 270 60 10 30 20 10 3 20 30 27 14 10 27 42 40 3 14 40 90 420 ln r r r t 0 4 3 1 3 0 4 3 0 0 1 0 0 0 0 0 0 0 0 0 0 0 0 0 0 0 0 0 0 0 τ o
γ j = d j c o T 4329 3123 105 5 3123 315 45 5 35 15 5 1 5 5 3 1 5 9 9 5 1 3 5 5 1 5 15 35 840 ln r r r t 3 1 0 0 1 0 0 0 0 0 0 0 0 0 0 0 0 0 0 0 0 0 0 0 0 0 0 0 τ o
γ k = 280 c r 6 τ r 3
(94) γ l = τ r 10 c r 2 + 4 c r c t + c t 2 τ t 2 c r 2 + 2 c r c t + c t 2 (95) γ m = τ r 6 c r 2 c t 2 τ t 2 c r c t + 3 c t 2 (96) γ n = τ r 3 c r 2 + 2 c r c t + τ t c r 2 6 c t 2 (97) γ o = τ r c r 2 + 2 c r c t + 2 c t 2 + τ t c r 2 + 4 c r c t + 10 c t 2
where
(98) c o = c r 6 c r 5 c t c r 4 c t 2 c r 3 c t 3 c r 2 c t 4 c r c t 5 c t 6 T (99) τ 0 = τ r 3 τ r 2 τ t τ r τ t 2 τ t 3 T (100) d b = diag 1 6 5 20 15 2 1 T (101) d c = diag 1 2 5 20 5 2 3 T (102) d d = diag 1 2 15 20 5 6 3 T (103) d e = diag 1 6 5 20 15 2 1 T (104) d f = diag 1 10 25 300 25 10 1 T (105) d g = diag 1 2 15 20 5 6 1 T (106) d h = diag 3 6 5 20 15 2 1 T (107) d i = diag 3 2 5 20 5 2 1 T (108) d j = diag 1 2 15 20 5 6 1 T
The derivation of the integral coefficients given in Equations (79)–(82) is given in Moulton and Hunsaker [24]. The calculations for the CG location are not presented because the integrations in [24] show that x ¯ = y ¯ = z ¯ = 0 .
The authors note that the matrices with purely numeric components shown in Equations (83)–(93) have an element of symmetry. Each equation for the γ values γ a through γ k have the form
γ = k 1 d c o T B + k 2 ln r r r t D τ o
where k 1 and k 2 are numeric coefficients, c o and τ o are, respectively, vectors of chord and max thickness percentage variables, and d, B, and D are purely numeric matrices. This pseudo-symmetry can be seen, for example, in γ b and γ j as
γ b = k 1 , b d b c o T B b + k 2 , b ln r r r t D b τ o γ j = k 1 , b d b c o T B b k 2 , b ln r r r t D b τ o
where for an n × n matrix, M = M T T . The symbol   T is used to denote the anti-transpose defined by M T = J M T J and J i j = 1 , i + j = n + 1 0 , otherwise 1 i , j < n , or
J = 0 1 1 0
i.e., J is an “anti-identity” matrix. The symbol   is used because the matrix M could be seen as a 180° “rotation” of the M matrix. This pseudo-symmetry pairing can be seen between γ a and γ k , γ b and γ j , γ c and γ i , γ d and γ j , and γ e and γ g . The matrices for γ f are also peculiar in that the first two numeric matrices ( d f , B f ) are equivalent after a   manipulation, and the third matrix ( D f ) is equivalent after the same manipulation, multiplied by negative one.
The number of blades N b and blade length ( r r r t ) will have exponential and opposite effects on the T 2 , 0 , 0 term in Equation (76). Thus, the I y y and I z z properties of propellers with greater diameter and fewer blades could be approximated by dropping the T 2 , 0 , 0 term. However, for propellers with smaller length and more blades, the magnitude of term T 2 , 0 , 0 is much larger relative to the term T 0 , 0 , 2 , and cannot be neglected.
The total inertia of the rotor about the origin of the rotor can be computed by summing the inertia of the hub with the inertia of the blades as shown in Equation (66).

3. Method Evaluation

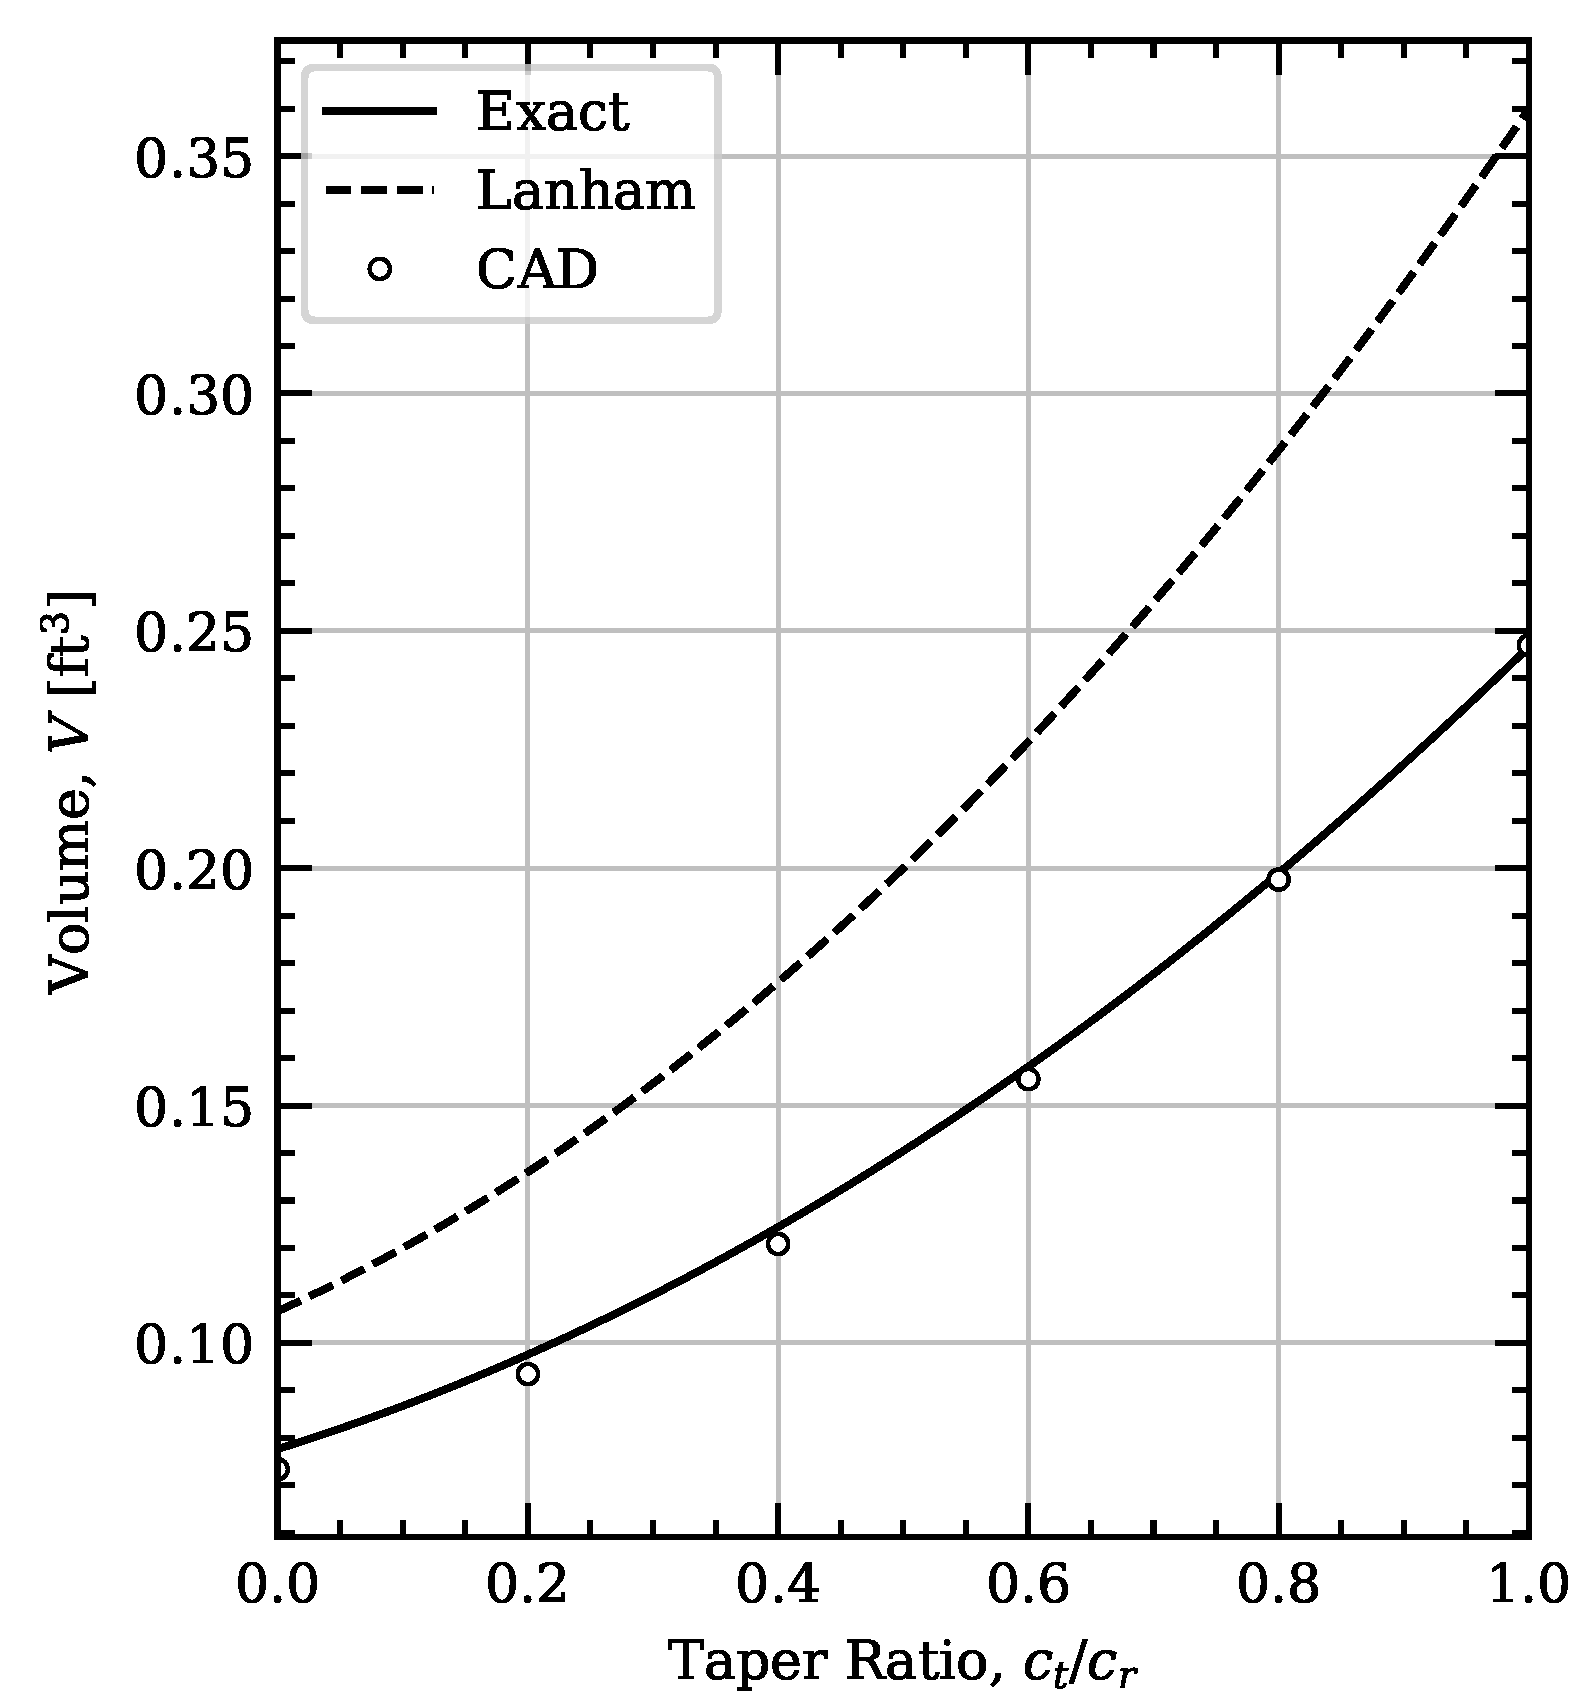
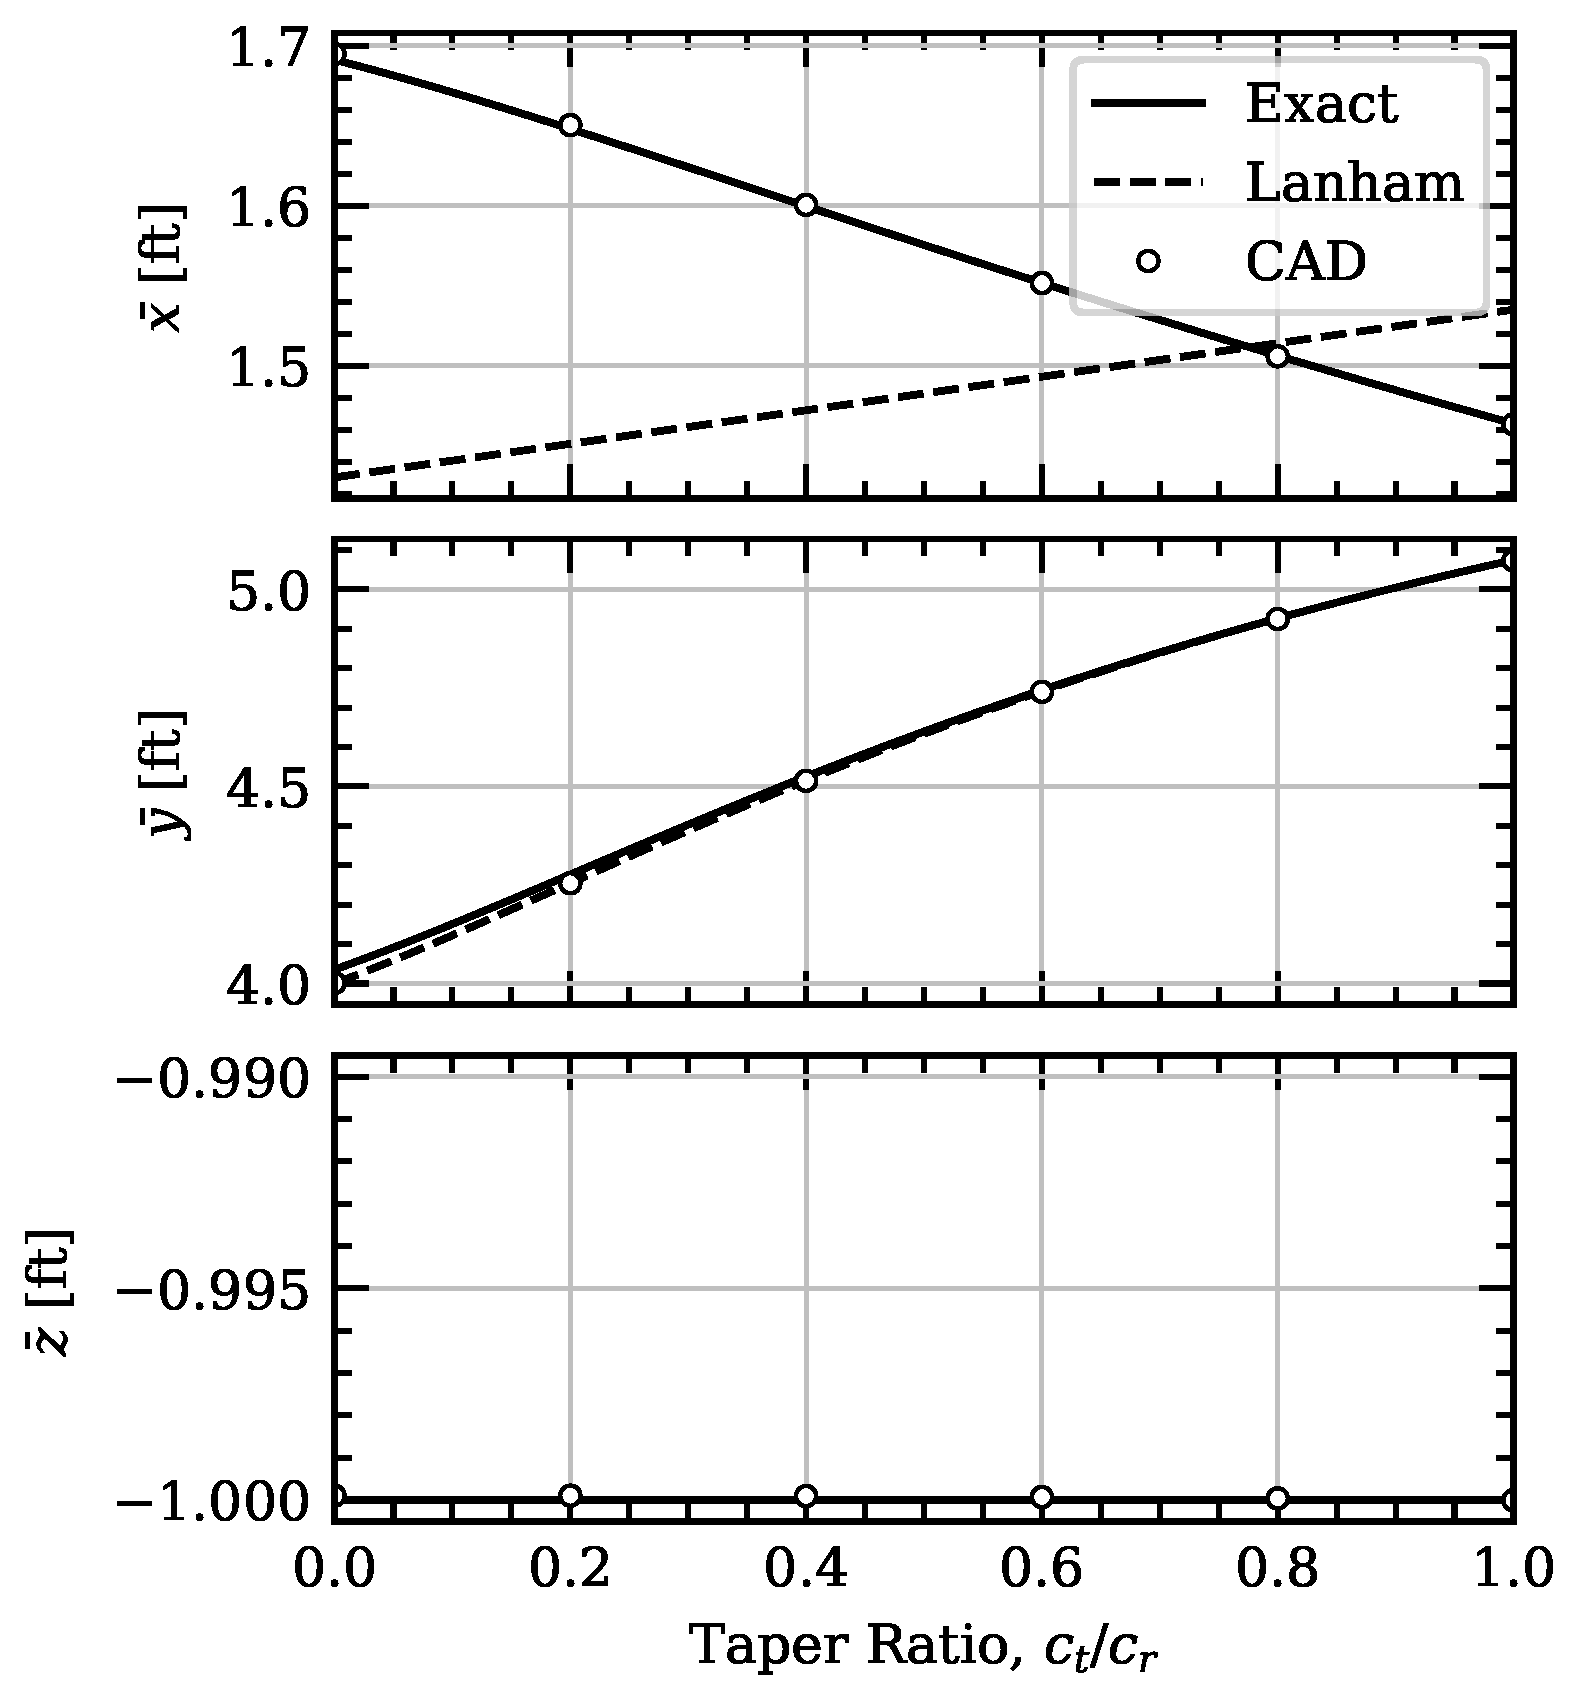
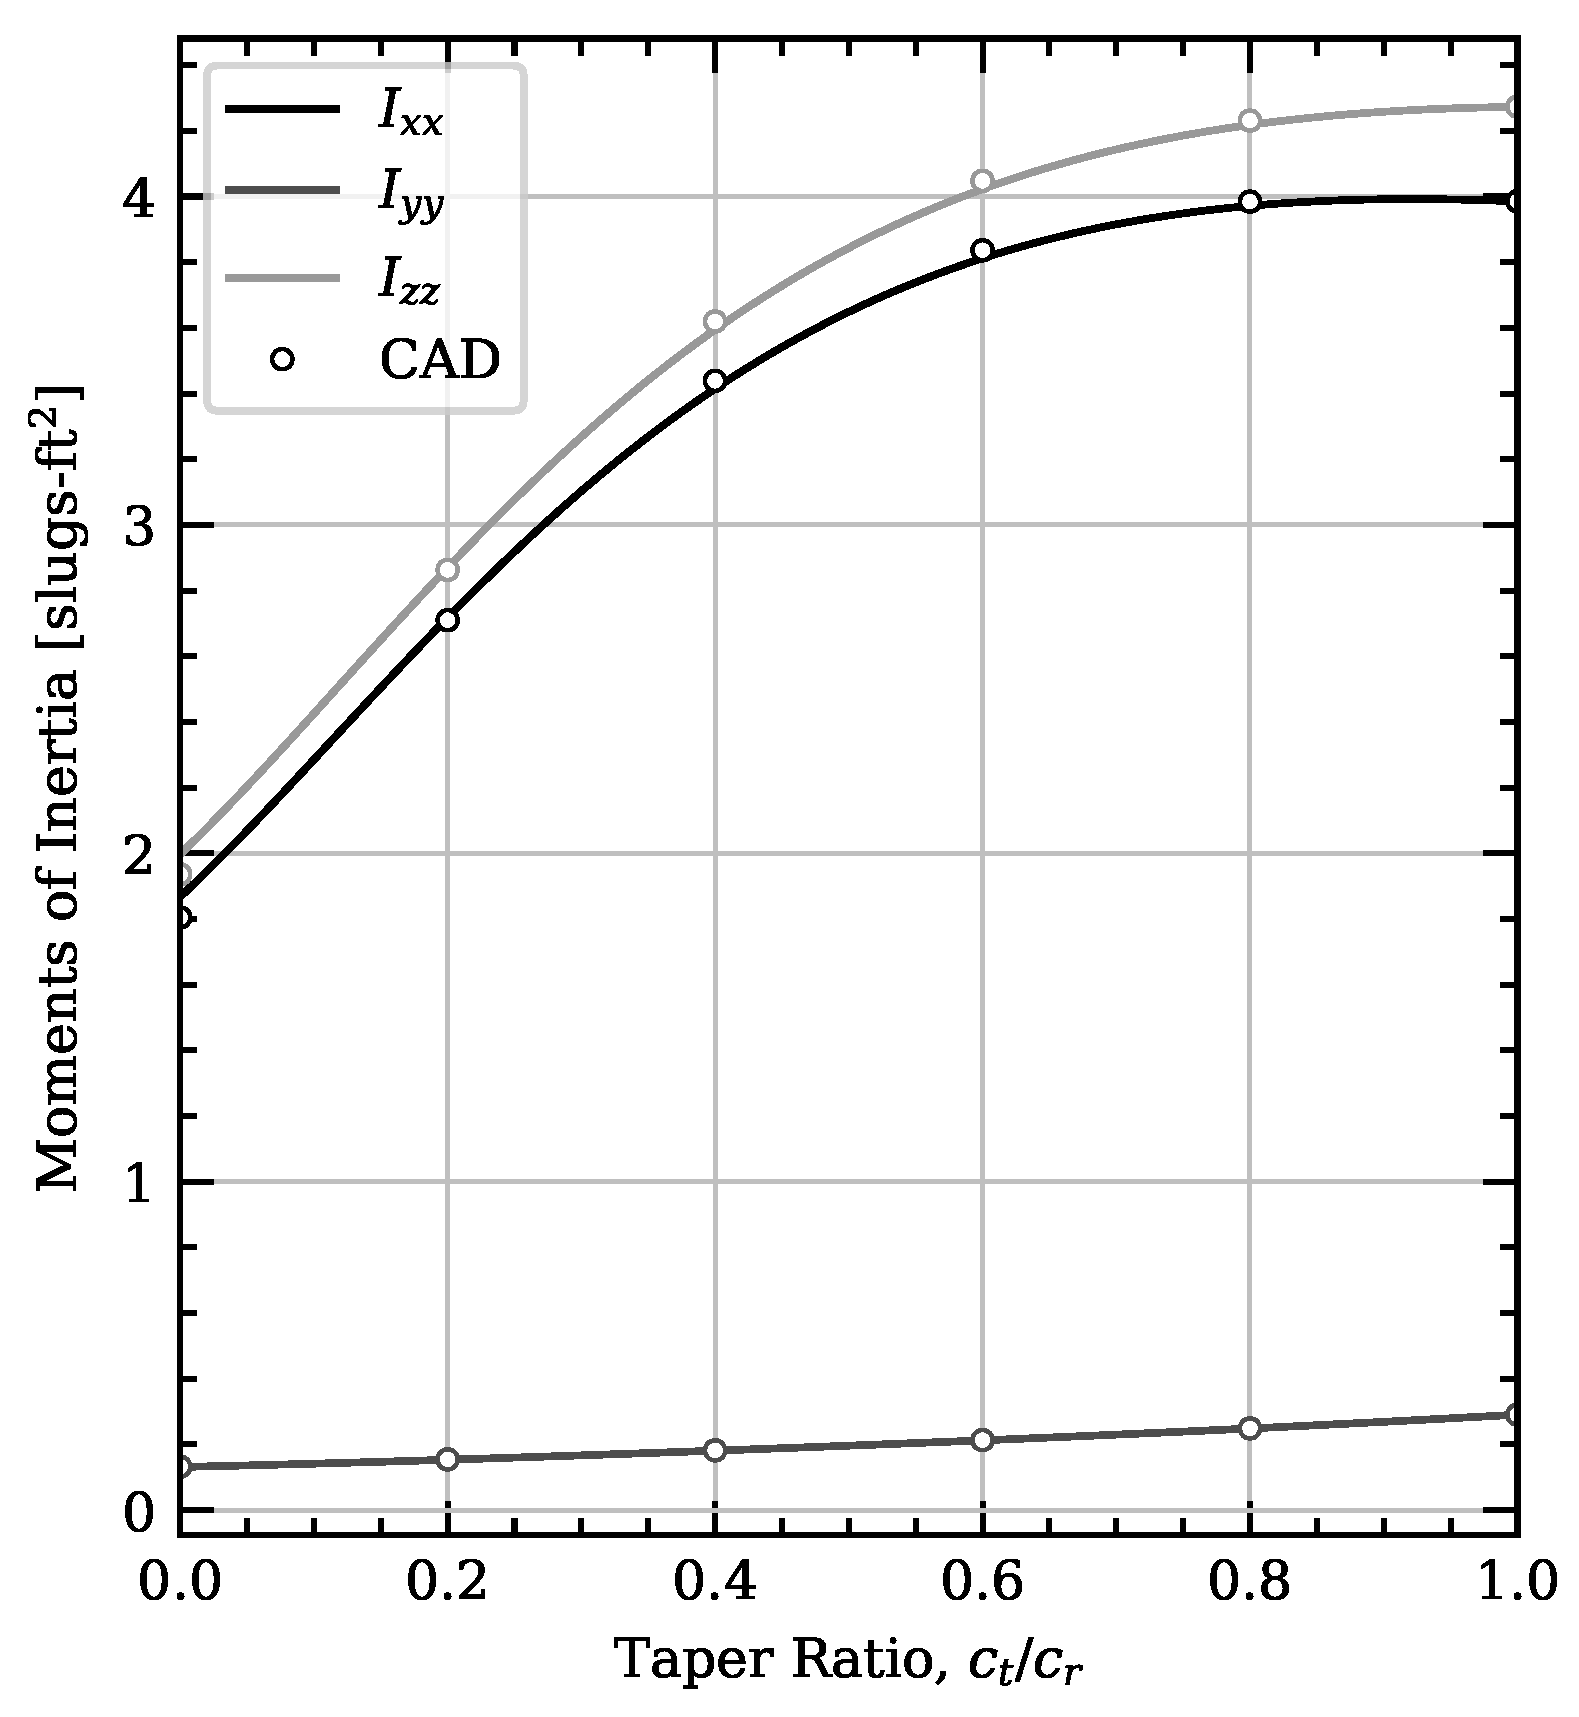
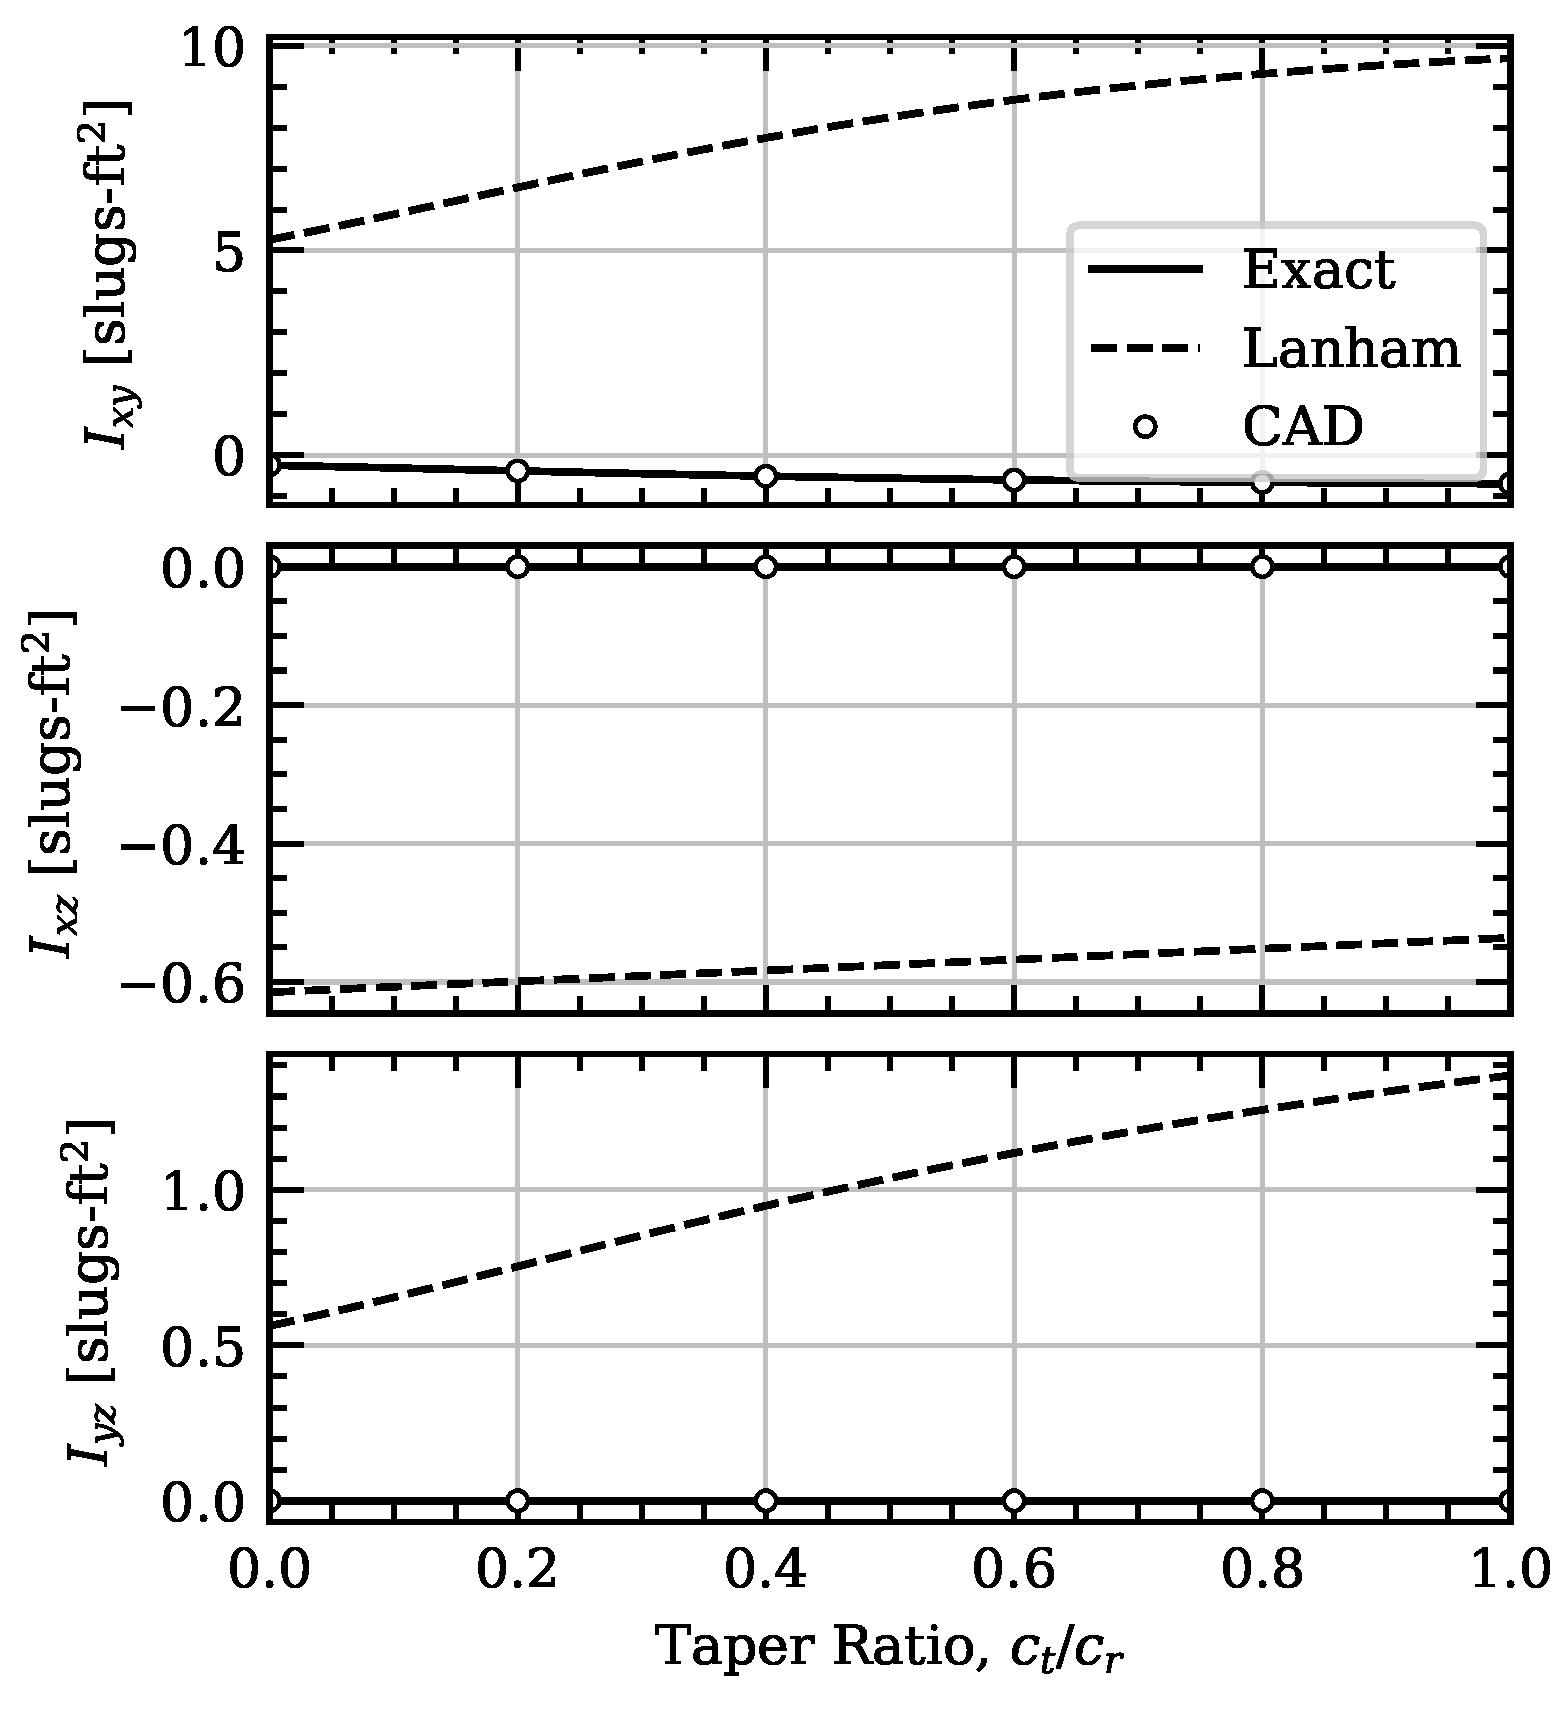
Lanham’s method [23] was developed on similar principles as the present method but with severely limiting assumptions. In the following analysis, the properties of a wing are determined using the present method (titled “Exact” on plots), Lanham’s (“Lanham”), and the CAD package Solid Works 2022 (“CAD”). In each case, the analysis is performed on a wing with the geometry given in Table 2.
There are minute differences between the “CAD” and “Exact” results at low taper ratios, primarily due to two reasons. First, the CAD model was built assuming the thickness to vary linearly along the span, where the present method implements a slight nonlinearity in thickness due to linearity in maximum thickness percentage and chord distribution, as shown in Equation (6). Second, the lofting feature in the CAD method was implemented with guide curves only at the leading and trailing edges, thus not explicitly constraining the wing upper and lower surfaces over the span and causing minute differences in numerical results. Therefore, as will be shown in the following plots, the CAD results typically deviate from the exact result as the taper ratio decreases. At a taper ratio of 1, the CAD and exact solutions are nearly indistinguishable on the plots.
Three property evaluations are performed for the wing. These include the volume, CG location, and inertias, with mass held constant for all evaluations. The compared volumes are shown in Figure 3. The volume difference between Lanham’s method and the present method is due to Lanham’s method assuming the wing to be a prismoid. Note that a more accurate volume calculation can be used to better estimate fuel capacity, actuator sizing, etc. The effect of the minute differences due to thickness distribution linearity can be seen at low taper ratios.
The evaluation results for the CG locations are shown in Figure 4. Note the slight differences in y ¯ and z ¯ at low taper ratios between the CAD model properties and the present method. This is due to the slight non-linearities in the wing thickness along the span. Note Lanham’s method predicts the opposite trend in x ¯ as a function of taper ratio.
The evaluation results for the moments of inertia are shown in Figure 5. The Lanham results are not shown in Figure 5 because they are off by an order of magnitude for each moment of inertia and make the corresponding relationships difficult to see. Note the offset values at small taper ratios (particularly c t / c r = 0.0 ) are due to the nonlinearities mentioned previously.
The evaluation results for the products of inertia are shown in Figure 6. Lanham’s method defines the products of inertia to be zero for a wing with no dihedral. Similar to the present method, Lanham’s method evaluates the inertia tensor about the origin, which can be shifted to the CG. For this reason, the products of inertia are non-zero in Figure 6.
The forgoing analysis and plots demonstrate the exactness of the method. Differences in the plots above are due to assumptions in method (such as Lanham) or imperfections in implementation (such as the model in the CAD tool). The analytic solutions given in Section 2 are exact for the case of a wing segment with linear taper, linear spanwise maximum thickness changes, no camber, constant airfoil thickness distribution, constant sweep, and constant dihedral.

4. Case Studies

The foregoing analysis is exact for any component that matches the component geometric constraints described. However, not all wing segments satisfy these limitations, which invites the question: how does application of the method perform in situations where the wing has camber, twist, or thickness distributions other than those that can be fit to Equations (2) or (3)? To answer this question, several validation cases were performed to evaluate the accuracy that might be expected when using the present method to represent wing and rotor geometries that include properties not considered in the analytic development such as camber and twist.

4.1. Case Study: Accuracy for a Typical Wing Segment

The first study is used to examine the effects of camber, twist, and airfoil thickness distribution on a simple constant-density wing like that shown in Figure 1. Within this case study, a rectangular wing having a symmetric airfoil is examined as the base case. Perturbations in the following properties are then examined: linear taper (taper), linear thickness (thickness), sweep, airfoil thickness distribution (Clark Y and diamond), constant camber (camber), linear twist (twist), and a combination of all of the perturbations (all). To reflect the combination of all perturbations, airfoils are chosen from the same NACA 4-digit family but with changes in thickness and camber properties. Table 3 shows the properties for each of the perturbation studies performed. For the diamond airfoil, the parameters τ m = 12 % and x ^ m = 0.5 are used.
A right wing was created for each of these cases in a CAD package with a wingspan of 8 ft and assigned a density of 0.25 slugs/ft3. Results were truncated to two digits following the decimal point (Calculated using “Higher” accuracy). The percent difference between the mass and inertia results computed from CAD and those computed from the analytic method presented in the previous section are given in Table 4 and Table 5, respectively.
Results in these tables show that the analytic method presented above is accurate to within less than 1% for typical wing geometries including twist, camber, and arbitrary airfoil thickness distributions. The cases for which 100% error is shown result from the present method predicting a value of zero for a given property and the CAD model having a finite small value. The very small errors (<0.1%) in many of the other terms is likely due to a difference in how linear taper and thickness distributions are handled in the present method compared to the splines used by Solid Works, as mentioned in Section 3. In general, the results presented here show that the analytic method presented above is accurate for individual wing sections with geometric properties in the ranges of parameters commonly used on aircraft.

4.2. Case Study: Accuracy for a Typical Rotor

A five-bladed propeller similar to that used on the Supermarine Spitfire Mark XIV was studied to test the expected accuracy of the analytic solution for rotors with non-zero pitch. The buildup of error across the last three limitations utilized in the development of this method was studied, namely neglecting camber, neglecting twist, and approximating propeller blades using a disk with radially changing thickness. The propeller in this study had the following properties.
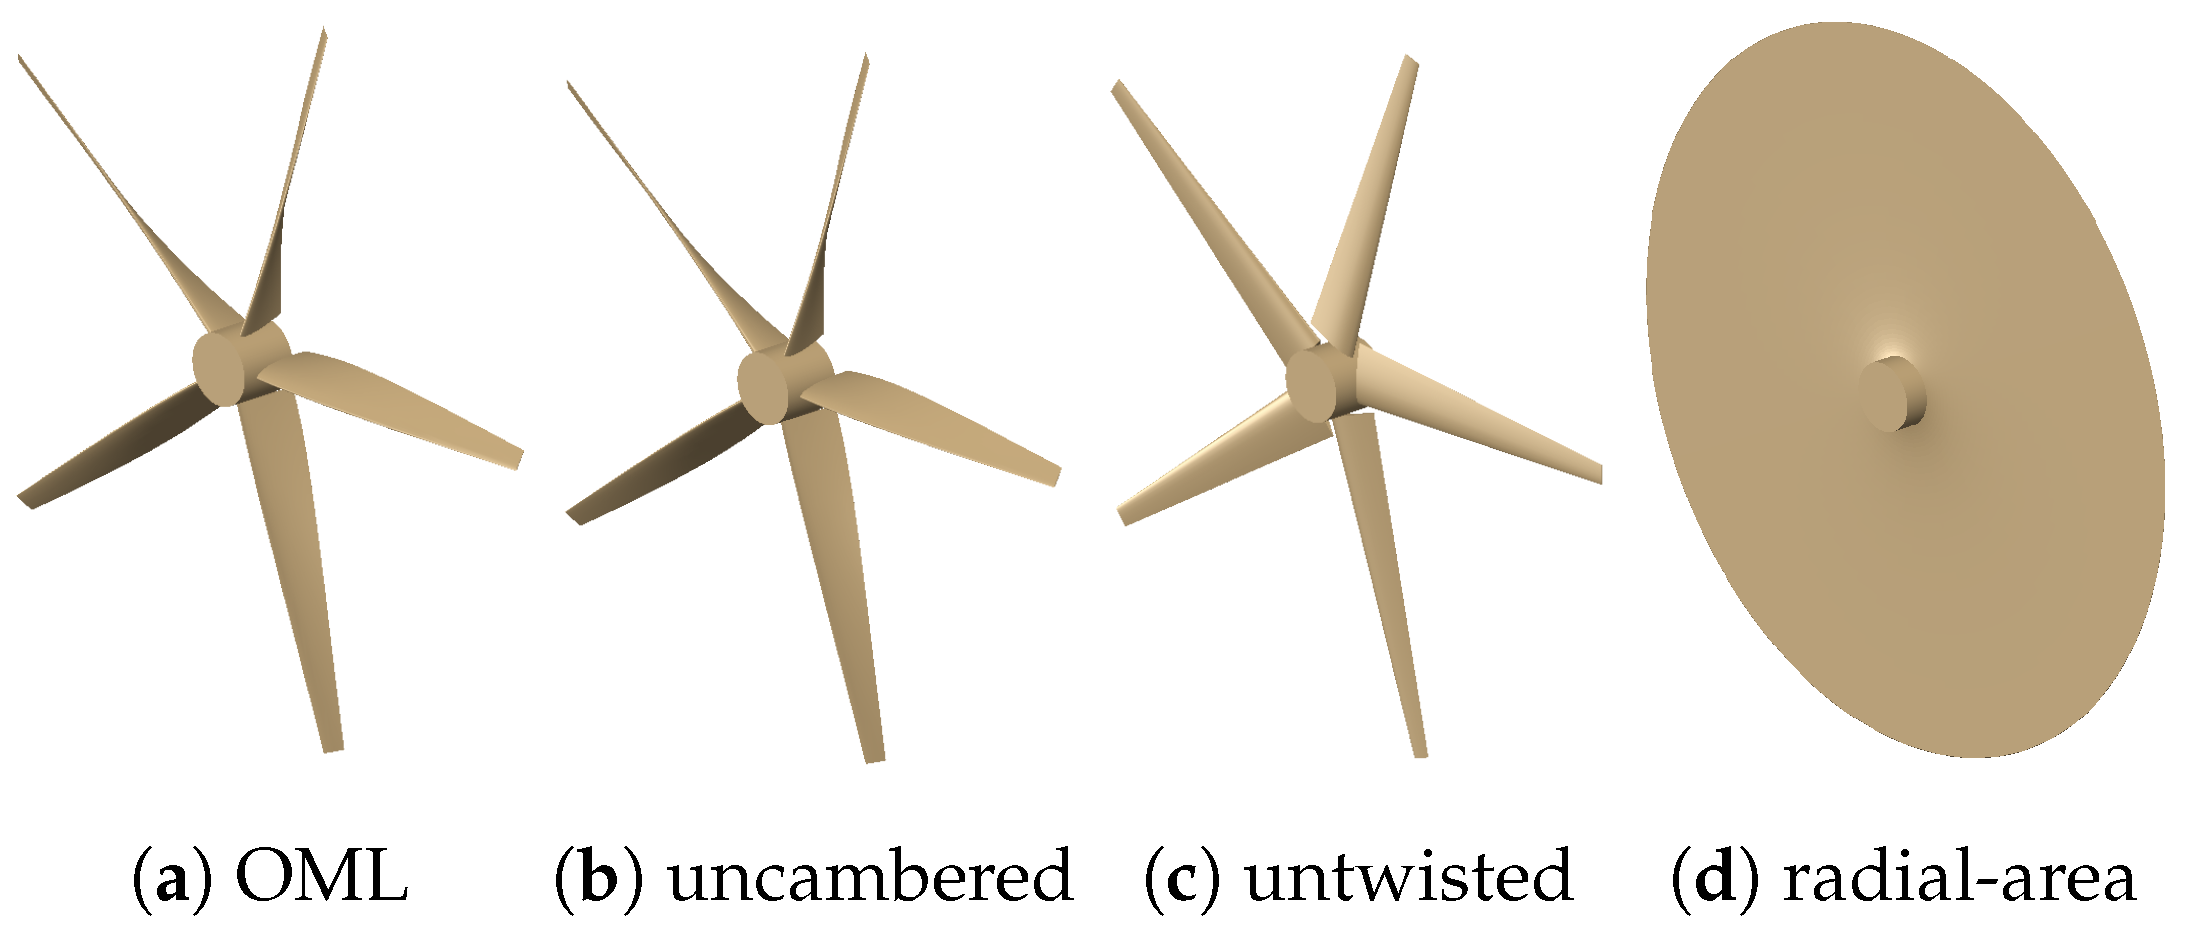
The first mass study was performed on a CAD model of constant density of the outer mold line (OML) of the propeller and hub described in Table 6. The density for this model was set as that of Hydulignum laminate wood, having a density of 2.54864 slugs/ft3, this material being that from which the Spitfire Mark XIV propellers were constructed [27]. The drawing for this CAD model is shown in Figure 7a. This CAD model was created using the parameters given in Table 6 and had a traditional airfoil section-shape, linear taper, linear airfoil changes, and non-linear twist [28] as determined from
β c ( r ) = tan 1 λ c 2 π r tan α L 0 2 π r + λ c tan α L 0 α L 0
where β c is the propeller pitch angle relative to the chord-line, with a propeller chord-line pitch of λ c = 16.8681 ft and a zero-lift angle of attack of α L 0 = 2 . 0741 ° .
The second mass study was performed on the CAD model shown in Figure 7b which is identical to the model in Figure 7a but without any camber. The density for this model was determined using an equivalent mass to the propeller OML model.
The third mass study was performed on the CAD model shown in Figure 7c which is identical to the model in Figure 7b but without any twist. The density for this model was determined using an equivalent mass to the propeller OML model.
The fourth mass study was performed on a CAD model of constant density of a disk and the hub, where the disk was modeled to have a differential area equal to that of the propeller, as defined in Equation (69). The density for this model was determined using an equivalent mass to the propeller CAD model. The drawing for this OML model is shown in Figure 7d.
Below in Table 7, Table 8 and Table 9 are the percent differences between the analysis in each column with respect to that in each row. Each of the above mass studies are compared with each other and with results found using the equations developed in the presented method. Results which are between two zero values or are uninformative are not presented. Note, the corresponding percent differences in Table 7, Table 8 and Table 9 are not time averaged (due to propeller rotation) but rather at the individual orientations shown in Figure 7 (where one blade is aligned with the negative y-axis). This is because the time-averaged change in the products of inertia are negligible, and the percent change in any of the moments of inertia due to rotating orientation is less than 0.0001%.
The percent differences in moments of inertia of the presented method are less than 1.3% compared to that of the constant density OML model. This study demonstrates the effectiveness of the present method for analyzing rotor inertia properties. The very small difference between the radial-area model and the present method values are due to the resolution of the CAD model radial thickness distribution. The increased resolution (and clustering of the imported radial-shape geometry points) gives a smaller difference between the two models.

5. Example Application

A wing does not always have properties which satisfy the limitations of the present method. In these instances, the present method can be applied by discretizing the geometry of both the airframe and the internal mass distribution. See Moulton and Hunsaker [24] for some examples. In the above analysis, the wing is treated as a single object of constant density; the additional internal complexity of the wing can be modeled by adding or subtracting other simple shapes. Because the method is developed from exact analytic equations, it can readily be incorporated in parametric design using various component geometries.
Simple shapes can be used to represent much more complex internal structures and mass distributions than may first appear obvious. The moments and products of inertia of an aircraft can be estimated using a series of components including wing segments and rotors or other shapes for which mass and volume properties can be analytically computed including cuboids, cylinders, spheres, etc. Indeed, several contemporary groups have utilized this method of summing components [22,29,30,31] using Lanham’s estimated equations for wing inertia [23] in approximating the inertia of full-size aircraft.
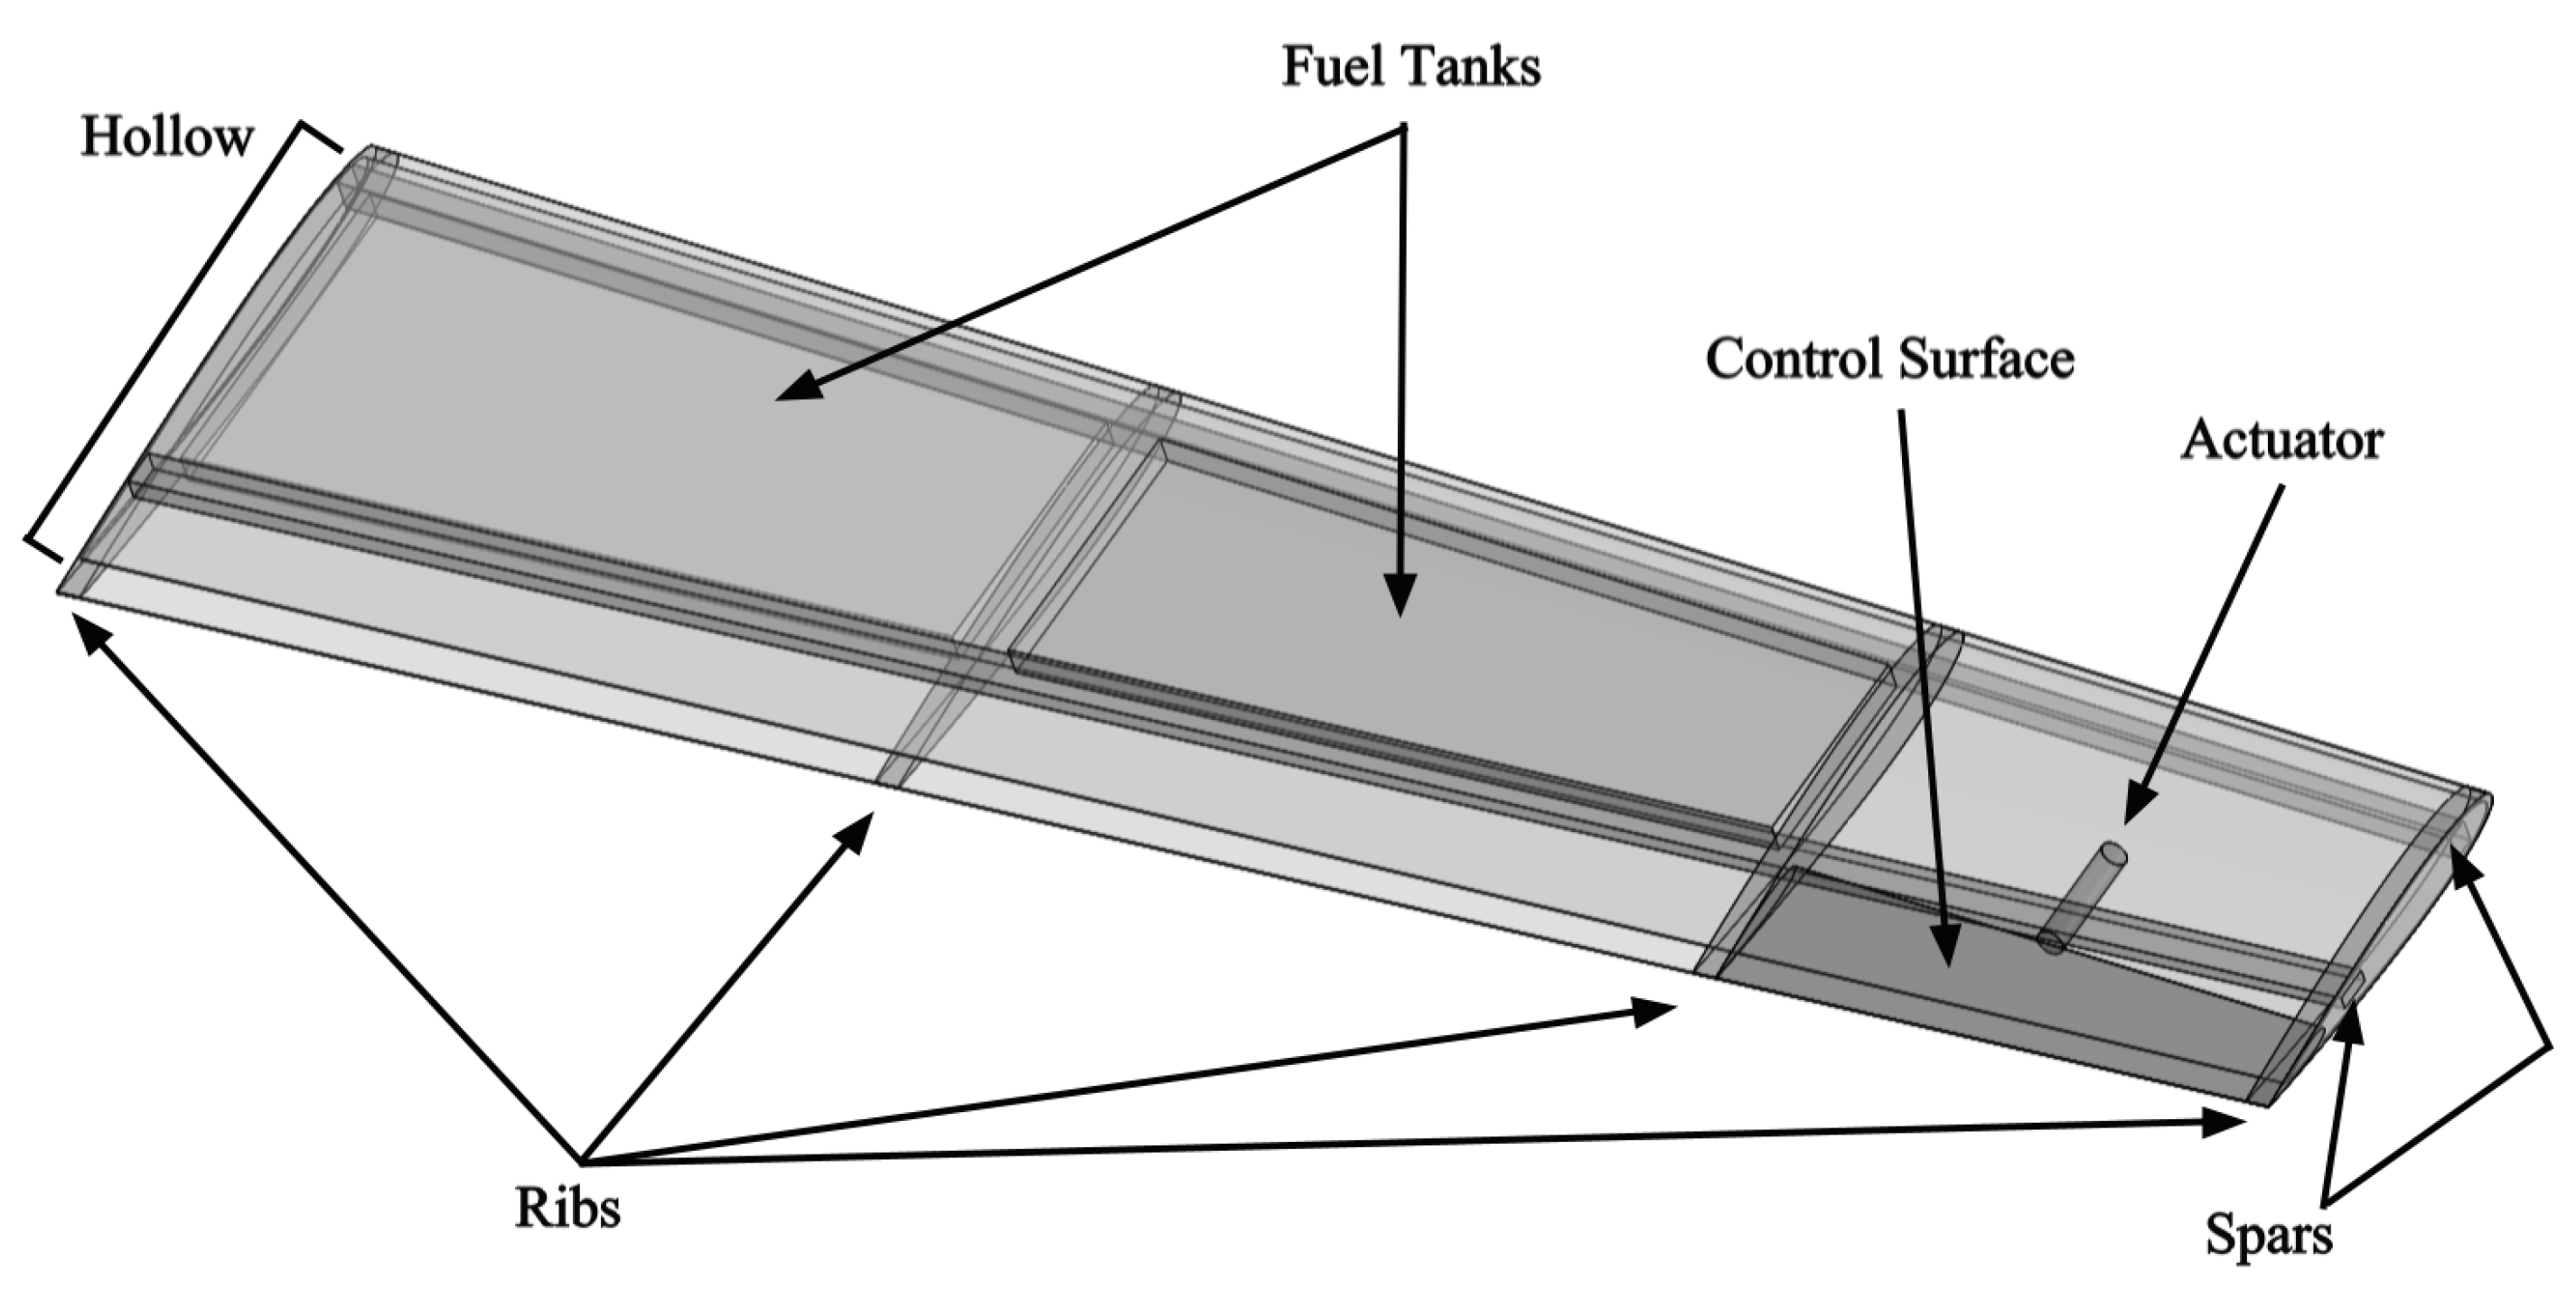
An example application for a wing segment is shown in Figure 8. In Figure 8, the complicated internal geometry of an aircraft wing segment is approximated to include such geometries as ribs, spars, fuel tanks, and actuators. Each component in Figure 8 can be modeled using the present method in conjunction with simple geometric shapes:
  • Ribs can be modeled as wing segments with very small span.
  • The wing skin can be modeled by using two collocated wings, one with a slightly smaller root and tip chord. The outer wing is given the density of the skin, and the inner wing is given the negative density of the skin.
  • Fuel tanks can be modeled as wing segments with constant thickness distribution (i.e., μ x a c = 1 ).
  • A control surface can be modeled as a wing segment of given span, thickness distribution, and prescribed airfoil.
  • An actuator can be modeled as a cylinder.
  • Spars can be modeled as a combination of cuboids for which inertia properties are analytically known.
Summing the inertial properties of each of the simple geometric components gives a very reasonable estimate for the actual inertial properties of the complex wing. The fidelity of the application can be increased by including additional considerations. For example, with respect to the ribs, negative density cylinders can be added to create lightening holes.

6. Conclusions

Typical methods for determining the mass and inertia characteristics of lifting surfaces during initial design phases can be difficult and time-consuming. A simple method has been developed and presented here for calculating the exact volume, mass, CG location, and inertia properties of a wing segment and a rotor. These closed-form solutions neglect camber and twist but can account for arbitrary airfoil thickness distributions. Validation cases demonstrate the utility and accuracy of the methods presented. Evaluation cases demonstrate the method to be exact for wings with linear taper, linear spanwise maximum thickness, constant symmetric airfoil thickness distribution, constant sweep, and constant dihedral. Case studies demonstrate that the present method is accurate to within about 1% for common wing geometries and within about 1.3% for common propeller geometries, which include typical amounts of camber and twist or pitch. These methods can be used in the preliminary design phase of aircraft development for rapidly estimating the inertial properties of lifting surfaces and rotors.

Author Contributions

Conceptualization and methodology, B.C.M. and D.F.H.; software and validation, B.C.M.; formal analysis, B.C.M. and D.F.H.; investigation, B.C.M.; resources, B.C.M. and D.F.H.; data curation, B.C.M.; writing—original draft preparation and writing—review and editing, B.C.M. and D.F.H.; visualization, B.C.M.; supervision, project administration, and funding acquisition, D.F.H. All authors have read and agreed to the published version of the manuscript.

Funding

This work was funded by the U.S. Office of Naval Research Sea-Based Aviation program (grant no. N00014-18-1-2502) with Brian Holm-Hansen as the Program Officer.

Data Availability Statement

Data are contained within the article.

Conflicts of Interest

The authors declare no conflicts of interest.

References

  1. Pegram, J.P.; Anemaat, W.A. Preliminary Estimation of Airplane Moments of Inertia Using CAD Solid Modeling; Technical Report; SAE Technical Paper: Warrendale, PA, USA, 2000. [Google Scholar]
  2. Parikh, K.; Dogan, A.; Subbarao, K.; Reyes, A.; Huff, B. CAE Tools for Modeling Inertia and Aerodynamic Properties of an RC Airplane. In Proceedings of the AIAA Atmospheric Flight Mechanics Conference, Chicago, IL, USA, 10–13 August 2009; p. 6043. [Google Scholar] [CrossRef]
  3. Jordan, T.; Langford, W.; Hill, J. Airborne Subscale Transport Aircraft Research Testbed-Aircraft Model Development. In Proceedings of the AIAA Guidance, Navigation, and Control Conference and Exhibit, San Francisco, CA, USA, 15–18 August 2005; p. 6432. [Google Scholar] [CrossRef]
  4. Bai, C.; Mingqiang, L.; Zhong, S.; Zhe, W.; Yiming, M.; Lei, F. Wing Weight Estimation Considering Constraints of Structural Strength and Stiffness in Aircraft Conceptual Design. Int. J. Aeronaut. Space Sci. 2014, 15, 383–395. [Google Scholar] [CrossRef]
  5. Jardin, M.R.; Mueller, E.R. Optimized Measurements of Unmanned-Air-Vehicle Mass Moment of Inertia with a Bifilar Pendulum. J. Aircr. 2009, 46, 763–775. [Google Scholar] [CrossRef]
  6. Habeck, J.; Seiler, P. Moment of Inertia Estimation Using a Bifilar Pendulum; University of Minnesota: Minneapolis, MN, USA, 2016. [Google Scholar]
  7. Lorenzetti, J.S.; Bañuelos, L.; Clarke, R.; Murillo, O.J.; Bowers, A. Determining Products of Inertia for Small Scale UAVs. In Proceedings of the 55th AIAA Aerospace Sciences Meeting, Grapevine, TX, USA, 9–13 January 2017; p. 0547. [Google Scholar] [CrossRef]
  8. de Silva Bussamra, F.L.; Vilchez, C.M.M.; Santos, J.C. Experimental Determination of Unmanned Aircraft Inertial Properties. In Proceedings of the 3rd CTA-DLR Workshop on Data Analysis and Flight Control 2009 Brazilian Symposium on Aerospace Eng. & Applications, São José dos Campos, Brazil, 14–16 September 2009; p. 900. [Google Scholar]
  9. Soule, H.A.; Miller, M.P. The Experimental Determination of the Moments of Inertia of Airplanes; Technical Report NACA-TR-467; NASA: Washington, DC, USA, 1934.
  10. du Bois, J.L.; Lieven, N.A.; Adhikari, S. Error Analysis in Trifilar Inertia Measurements. Exp. Mech. 2009, 49, 533–540. [Google Scholar] [CrossRef]
  11. Gracey, W. The Experimental Determination of the Moments of Inertia of Airplanes by a Simplified Compound-Pendulum Method; Technical Report NACA-TN-1629; National Aeronautics and Space Administration: Washingtion, DC, USA, 1948.
  12. Green, M. Measurement of the Moments of Inertia of Full Scale Airplanes; Technical Report NACA-TN-265; National Aeronautics and Space Administration: Washingtion, DC, USA, 1927.
  13. De Jong, R.; Mulder, J. Accurate Estimation of Aircraft Inertia Characteristics From a Single Suspension Experiment. J. Aircr. 1987, 24, 362–370. [Google Scholar] [CrossRef]
  14. Lehmkühler, K.; Wong, K.; Verstraete, D. Methods for Accurate Measurements of Small Fixed Wing UAV Inertial Properties. Aeronaut. J. 2016, 120, 1785–1811. [Google Scholar] [CrossRef]
  15. Previati, G.; Gobbi, M.; Mastinu, G. Method for the Measurement of the Inertia Properties of Bodies with Aerofoils. J. Aircr. 2012, 49, 444–452. [Google Scholar] [CrossRef]
  16. Perry, D. Measurements of the Moments of Inertia of the Avro 707B Aircraft; Technical Report C.P. No. 647; Ministry of Aviation: London, UK, 1963.
  17. Wolowicz, C.H.; Yancey, R.B. Experimental Determination of Airplane Mass and Inertial Characteristics; Technical Report NASA-TR-R-433; NASA: Washingtion, DC, USA, 1974.
  18. Dantsker, O.D.; Vahora, M.; Imtiaz, S.; Caccamo, M. High Fidelity Moment of Inertia Testing of Unmanned Aircraft. In Proceedings of the 2018 Applied Aerodynamics Conference, Atlanta, GA, USA, 25–29 June 2018; p. 4219. [Google Scholar] [CrossRef]
  19. Morelli, E.A. Determining Aircraft Moments of Inertia from Flight Test Data. J. Guid. Control. Dyn. 2022, 45, 4–14. [Google Scholar] [CrossRef]
  20. Valencia, E.; Alulema, V.; Hidalgo, V.; Rodriguez, D. A CAD-Free Methodology for Volume and Mass Properties Computation of 3-D Lifting Surfaces and Wing-Box Structures. Aerosp. Sci. Technol. 2021, 108, 106378. [Google Scholar] [CrossRef]
  21. do Vale, J.L.; Sohst, M.; Crawford, C.; Suleman, A.; Potter, G.; Banerjee, S. On the Multi-Fidelity Approach in Surrogate-Based Multidisciplinary Design Optimisation of High-Aspect-Ratio Wing Aircraft. Aeronaut. J. 2023, 127, 2–23. [Google Scholar] [CrossRef]
  22. Mutluay, T. The Development of an Inertia Estimation Method to Support Handling Quality Assessment. Master’s Thesis, Delft University of Technology, Delft, The Netherlands, 2015. [Google Scholar]
  23. Lanham, C. Inertia Calculation Procedure for Preliminary Design; Technical Report ASD-TR-79-5004; Aeronautical Systems Division: Xenia, OH, USA, 1979. [Google Scholar]
  24. Moulton, B.C.; Hunsaker, D.F. Simplified Mass and Inertial Estimates for Aircraft with Components of Constant Density. In Proceedings of the AIAA SciTech 2023 Forum, National Harbor, MD, USA, 23–27 January 2023; p. 2432. [Google Scholar] [CrossRef]
  25. Abbott, I.H.; Doenhoff, A.E.V. Families of Wing Sections. In Theory of Wing Sections; McGraw–Hill: New York, NY, USA, 1949; Chapter 6; pp. 111–123, Republished by Dover, New York, 1959. [Google Scholar]
  26. Hunsaker, D.F.; Reid, J.T.; Joo, J.J. Geometric Definition and Ideal Aerodynamic Performance of Parabolic Trailing-Edge Flaps. Int. J. Astronaut. Aeronaut. Eng. 2019, 4, 1–17. [Google Scholar] [CrossRef]
  27. Haines, A.; Chater, P. 24-ft. Tunnel Tests on a Rotol Wooden Spitfire Propeller. Test Results, and Data for Single Radius Calculations; Technical Report; Aeronautical Research Council: London, UK, 1946. [Google Scholar]
  28. Phillips, W.F. Overview of Propulsion: The Propeller. In Mechanics of Flight, 2nd ed.; John Wiley & Sons, Inc.: Hoboken, NJ, USA, 2010; Chapter 2; pp. 168–173. [Google Scholar]
  29. Plumley, R.W. Conceptual Assessment of an Oblique Flying Wing Aircraft Including Control and Trim Characteristics. Ph.D. Thesis, Virginia Tech, Blacksburg, VA, USA, 2008. [Google Scholar]
  30. Bueno Fernández, J. Modelling of the Ascender Spaceplane and Development of an Autopilot and Flight Control System. Master’s Thesis, Universitat Politècnica de València, Valencia, Spain, 2020. [Google Scholar]
  31. Bendarkar, M.V.; Sarojini, D.; Mavris, D.N. Off-Nominal Performance and Reliability of Novel Aircraft Concepts During Early Design. J. Aircr. 2022, 59, 400–414. [Google Scholar] [CrossRef]
Figure 1. Wing-segment geometry definitions.
Aerospace 11 00492 g001
Figure 2. Rotor geometry definitions.
Aerospace 11 00492 g002
Figure 3. Comparison of volumes computed from each method.
Aerospace 11 00492 g003
Figure 4. Comparison of CG location computed from each method.
Aerospace 11 00492 g004
Figure 5. Comparison of moments of inertia about the CG computed from each method.
Aerospace 11 00492 g005
Figure 6. Comparison of products of inertia about the CG computed from each method.
Aerospace 11 00492 g006
Figure 7. Validation CAD models of the 5-bladed propeller.
Aerospace 11 00492 g007
Figure 8. Example application of the present method with various wing segment structural components.
Aerospace 11 00492 g008
Table 1. NACA 4-digit series coefficients for various airfoil thickness distributions.
Airfoil a 0 a 1 a 2 a 3 a 4
Traditional NACA 4-Digit Series2.969−1.260−3.5162.843−1.015
NACA 4-Digit, closed trailing edge [26]2.980−1.320−3.2862.441−0.815
Clark Y (with τ m = 0.117 )2.947−1.102−3.9753.533−1.399
Selig S10100.00019.9980.087−1.92214.381
Diamond with τ m at x / c = 0.5 0.479−0.94814.248−26.97013.234
Table 2. Wing properties in method evaluation study.
PropertyValue
sideright
wing root location [ft] 2 3 1 T
c r [ft]1
τ r 0.08
τ t 0.10
b [ft]4
m [slugs]3
Λ [deg]10
Γ [deg]0
root airfoilNACA 0008
tip airfoilNACA 0010
Table 3. Wing properties.
Wing Name c r [ft] c t [ft] Ω [deg]Root AirfoilTip Airfoil Λ [deg]
rectangular110NACA 0012NACA 00120
taper1.50.50NACA 0012NACA 00120
thickness110NACA 0016NACA 00080
sweep110NACA 0012NACA 001214
Clark Y110Clark YClark Y0
diamond110DiamondDiamond0
camber110NACA 4812NACA 48120
twist11 2 7 NACA 0012NACA 00120
all1.50.5 2 7 NACA 4816NACA 480814
Table 4. Percent difference in solutions as predicted by CAD and the analytic solution.
Namem x ¯ y ¯ z ¯
rectangular0.00%0.00%0.00%0.00%
taper0.00%−0.05%0.00%0.00%
thickness−0.12%0.29%−0.02%0.00%
sweep0.00%0.00%0.00%0.00%
Clark Y0.00%−0.35%0.00%100.00%
diamond0.00%0.00%0.00%0.00%
camber0.30%0.12%0.00%100.00%
twist0.00%−0.29%0.00%100.00%
all0.61%−0.17%0.17%100.00%
Table 5. Percent difference in solutions as predicted by CAD and the analytic solution.
Name I xx I yy I zz I xy I xz I yz
rectangular0.01%0.00%0.00%0.00%0.00%0.00%
taper0.01%0.00%0.00%0.00%0.00%0.00%
thickness−0.08%0.00%−0.08%0.00%0.00%0.00%
sweep0.01%0.00%0.00%0.00%0.00%0.00%
Clark Y0.00%0.00%−0.01%0.00%0.00%0.00%
diamond0.00%0.00%0.00%0.00%0.00%0.00%
camber0.27%1.08%0.27%0.00%100.00%0.00%
twist0.01%0.00%−0.01%100.00%100.00%100.00%
all0.71%0.74%0.67%0.55%100.00%100.00%
Table 6. Rotor properties in propeller case study.
PropertyValue
N b 5
c r [ft]0.87333
c t [ft]0.29111
τ r [%]0.16
τ t [%]0.06
d h [ft]1.0
d r [ft]10.5
h h [ft]0.85774
m b [slugs]1.91211
ρ h [slugs/ft3]2.54864
root airfoilNACA 2416
tip airfoilNACA 2406
Table 7. Percent difference between analyses of I xx about the CG of the 5-bladed propeller.
AnalysisUncamberedUntwistedRadial-AreaPresent Method
OML0.02%−0.97%0.22%0.21%
uncambered −0.99%0.20%0.19%
untwisted 1.18%1.16%
radial-area −0.01%
Table 8. Percent difference between analyses of I yy about the CG of the 5-bladed propeller.
AnalysisUncamberedUntwistedRadial-AreaPresent Method
OML0.00%0.12%1.28%1.27%
uncambered 0.11%1.28%1.27%
untwisted 1.17%1.15%
radial-area −0.01%
Table 9. Percent difference between analyses of I zz about the CG of the 5-bladed propeller.
AnalysisUncamberedUntwistedRadial-AreaPresent Method
OML0.00%0.12%1.28%1.27%
uncambered 0.11%1.28%1.27%
untwisted 1.17%1.15%
radial-area −0.01%
Disclaimer/Publisher’s Note: The statements, opinions and data contained in all publications are solely those of the individual author(s) and contributor(s) and not of MDPI and/or the editor(s). MDPI and/or the editor(s) disclaim responsibility for any injury to people or property resulting from any ideas, methods, instructions or products referred to in the content.