Abstract
Ensuring the integrity of aviation plug components is crucial for maintaining the safety and functionality of the aerospace industry. Traditional methods for detecting surface defects often show low detection probabilities, highlighting the need for more advanced automated detection systems. This paper enhances the YOLOv5 model by integrating the Generalized Efficient Layer Aggregation Network (GELAN), which optimizes feature aggregation and boosts model robustness, replacing the conventional Convolutional Block Attention Module (CBAM). The upgraded YOLOv5 architecture, incorporating GELAN, effectively aggregates multi-scale and multi-layer features, thus preserving essential information across the network’s depth. This capability is vital for maintaining high-fidelity feature representations, critical for detecting minute and complex defects. Additionally, the Focal EIOU loss function effectively tackles class imbalance and concentrates the model’s attention on difficult detection areas, thus significantly improving its sensitivity and overall accuracy in identifying defects. Replacing the traditional coupled head with a lightweight decoupled head improves the separation of localization and classification tasks, enhancing both accuracy and convergence speed. The lightweight decoupled head also reduces computational load without compromising detection efficiency. Experimental results demonstrate that the enhanced YOLOv5 architecture significantly improves detection probability, achieving a detection rate of 78.5%. This improvement occurs with only a minor increase in inference time per image, underscoring the efficiency of the proposed model. The optimized YOLOv5 model with GELAN proves highly effective, offering significant benefits for the precision and reliability required in aviation component inspections.
1. Introduction
Ensuring the integrity and functionality of various components in the aerospace industry is paramount for maintaining flight safety and operational efficiency [1,2]. Specifically, aviation plug key slots and pin numbers, as integral components of aircraft electrical systems, critically influence the aircraft’s reliability and safety. Key slots ensure stable electrical connections, while pin numbers provide vital operational and maintenance information. Defects in these components, such as physical damage, dimensional inaccuracies, or eroded markings, can lead to electrical failures or operational mishaps, thereby compromising in firsthand the operability of the aircraft and ultimately the flight safety.
This process has primarily depended on visual inspections. Upon detecting a defect, a thorough evaluation is required to ascertain whether a failure has occurred. In recent years, to minimize human intervention and improve detection accuracy and efficiency, Various machine vision-based techniques have been successfully implemented in specific industrial and aviation contexts, producing outstanding results.
Advancements in computer vision have transformed visual inspection into the mainstream methodology for quality control. Defect detection, a subset of surface inspection, has been thoroughly explored by numerous scholars [3,4,5]. They have detailed the application of traditional visual techniques in detecting surface defects, encompassing aspects such as texture, color, and shape features. With ongoing improvements in computer hardware, deep learning algorithms have outperformed traditional algorithms in detection probability and speed due to their streamlined and efficient network architectures. Non-destructive detection techniques include ultrasound [6,7,8], magnetic particle [9,10], X-ray [11,12], and optical inspections [13,14,15], with the latter progressively becoming the preferred choice due to its minimal material requirements and capability for continuous product monitoring. The prevalent approach involves capturing images of the inspection areas and analyzing them with various image recognition algorithms. Initially, the captured images undergo preprocessing, which typically includes normalization [14], filtering [16], and enhancement [17,18]. Following this, localization and segmentation tasks are performed, using techniques like template matching [17,19], thresholding [8,20], or segmentation based on edges [21,22]. Algorithms then apply rules based on human experience to define target features by shape, area, grayscale, and texture. Ultimately, common classification algorithms are employed for quality assessment, such as the Gaussian-mixture-model-based automatic optical inspection algorithm for solder joints introduced by Cai et al. [23]. Robust principal component analysis has recently been applied to various defect detection tasks, enhancing the identification of anomalies [24] and demonstrating impressive efficacy. Khan et al. [25] proposed an innovative hierarchical ensemble machine learning model to predict flight departure delays and durations, effectively handling the complexity of aviation data. The model sequentially predicts to reduce decision ambiguity and integrates various machine learning algorithms and advanced sampling techniques like SMOTETomek, enhancing its ability to handle imbalanced and high-dimensional data. Khan et al. [26] proposed a novel data-driven model to predict IATA-coded flight delays and analyze the underlying causes. The model combines a parallel-sequential structure with the Adaptive Bidirectional Extreme Learning Machine (AB-ELM), optimizing training efficiency and performance through adaptive learning rate adjustments.
Recently, deep convolutional neural networks (CNNs) have gained considerable interest across diverse anomaly detection tasks [27,28,29,30], especially within image datasets [31,32], due to their ability to autonomously learn features with robustness and broad generalizability. Wang et al. [33] proposed an automated data augmentation framework for industrial defect detection called “ALADA.” This framework employs a novel three-step bilevel optimization scheme to reduce hyperparameter tuning and implements policy gradient sampling to address the challenges of non-differentiable optimization, thereby optimizing augmentation strategies more effectively.
Moreover, in general object detection methodologies, detectors are primarily categorized into two types: one-stage detectors and two-stage detectors. Prominent two-stage detectors, such as Fast R-CNN [34], adhere to a coarse-to-fine detection pipeline—first generating preliminary candidate objects and then employing a region classifier to predict their categories and refine their positioning. Although they achieve higher detection precision, their extensive computational demands and suboptimal real-time performance restrict their practical applications. To enhance detection speed, various one-stage detectors have been developed. These detectors execute a single inference step, directly determining the coordinates of bounding boxes and their respective class probabilities, exemplified by models like SSD [35], YOLO [36], and related models [36,37,38]. Due to their exceptional inference speed and dependable detection accuracy, these models are extensively utilized for defect detection across various industrial sectors.
Sha et al. [24] developed a refined YOLOv5 model by integrating an SE with a Feature Pyramid Network (FPN) to detect solder defects on aviation plugs, generating enhanced multi-scale features for the subsequent localization and quality assessment of the solder spots. Gao et al. [39] adapted YOLOv5, enhancing the model with deconvolution computations and K-means clustering to address challenges in the effectiveness and generality of complex label text detection, thereby improving detection accuracy. Ning et al. [40] proposed an improved YOLOv8 model that integrates the DCNV2 module and channel attention in C2f to combine adaptive receptive fields. Along with the efficient Faster Block, this enhancement strengthens the model architecture, simplifies feature extraction, reduces redundant information processing, and improves the accuracy and speed of multi-class steel defect detection.
Table 1 reviews CNN-based detection methods, highlighting their strengths and limitations. YOLO stands out for its high efficiency, precision, and strong generalization capability, making it the most popular and reliable method for various defect detection tasks. Considering its ease of use, rapid deployment, and compatibility with multiple frameworks, this study selected YOLOv5. Consequently, we are exploring its application for detecting key slot and pin number defects in aviation plugs.

Table 1.
Advantages and limitations of various detection techniques.
In the early stages, to extend the lifespan of aviation plugs and enhance system reliability, a comprehensive approach includes regular preventive maintenance and the use of advanced materials coupled with real-time monitoring. Predictive maintenance, optimized through data analytics, reduces costs and focuses resources effectively. Compliance is ensured by keeping up-to-date with safety standards and conducting thorough audits. System reliability is further enhanced by incorporating redundancy, high-quality materials, and continuous improvement processes. These strategies collectively ensure the operational efficiency and long-term safety of aviation plugs.
However, as depicted in Figure 1, typical defects in aviation plug key slots closely resemble normal key slots, making differentiation using solely low-level, manually crafted features challenging. Moreover, these methods are often too slow for real-time, online detection. While traditional methods employing handcrafted features suffice for simple tasks, their limited representational capacity results in low accuracy and poor robustness. Therefore, accurate detection of defects in aviation plug key slots and pin numbers is crucial. This detection not only facilitates the timely identification and repair of potential safety hazards but also significantly extends the lifespan of aircraft components, reduces maintenance costs, and ensures compliance with stringent aviation regulations. Moreover, it enhances system reliability by minimizing unexpected failures.
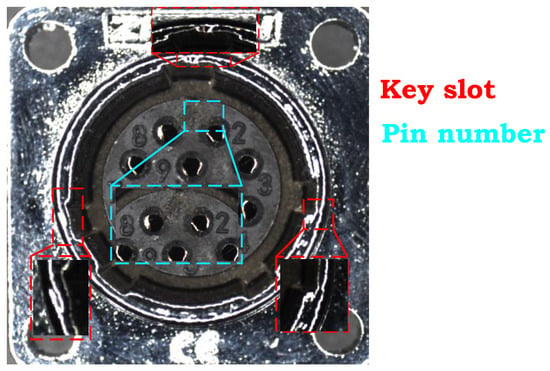
Figure 1.
Examples of aviation plug defects.
This study utilizes a proprietary aviation plug defect dataset. Due to inherent variability in the dataset, experimental results may vary across different systems. Consequently, this research assesses network improvements primarily through comparisons of results before and after network optimization.
Utilizing the current YOLOv5 model to detect keyway defects in aviation plugs presents several challenges. Keyway defects may be underrepresented in the training dataset, leading to class imbalance issues that hinder the model’s learning efficacy. The quality of the training dataset is crucial; labeling inaccuracies, noise, or inconsistencies can adversely affect detection outcomes. Keyway defects exhibit a variety of shapes and appearances, requiring robust generalization capabilities to identify different defect types effectively. While YOLOv5 is known for its detection speed, identifying complex keyway defects may require more computational resources and time, potentially impacting real-time performance. The model must also accurately distinguish keyway defects from other defect categories. Beyond detection accuracy, the interpretability of the model remains critical to ensure the results are conducive to further analysis and processing.
This paper advances the traditional YOLOv5 model to address the specific challenges associated with detecting defects in aviation plug components, by incorporating several cutting-edge features:
- The Generalized Efficient Layer Aggregation Network (GELAN) [42] was integrated to reduce information loss across network layers by aggregating multi-scale and multi-layer features, essential for pinpointing subtle defects;
- Furthermore, the Focal EIOU loss [43] function was implemented to enhance focus on challenging detection areas, thereby improving detection accuracy in regions where defects are critical but less visually apparent;
- An S-Decoupled Head was also introduced to optimize the separation of localization and classification tasks, significantly enhancing both the precision and efficiency of defect identification.
Collectively, these enhancements not only augment the model’s detection capabilities but also bolster its reliability and operational efficiency in the quality control processes of aviation components.
2. The Improved YOLOv5 Algorithm System Overview
2.1. Image Augmentation
The YOLOv5 model requires numerous training images for robust detection. To maintain economic efficiency, efforts are made to prevent manufacturing defects, but creating a large volume of defective items wastes resources. Consequently, the limited number and variety of defective samples can lead to overfitting and decreased performance. Image augmentation addresses this issue by generating diverse images from available datasets. For detecting keyway and pin number defects in aviation plugs, YOLOv5’s built-in augmentation techniques, such as random cropping, rotation, and color transformation, are effective and simplify implementation. ALADA [33] is suited for more complex datasets and may be unnecessary for standardized images. YOLOv5’s direct parameter control offers transparency and predictability, crucial for accuracy. Therefore, YOLOv5’s built-in augmentation techniques are sufficient and resource-efficient for specific defect detection tasks. This study adopted the following image enhancement techniques:
Image graying: Converting images from RGB to grayscale eliminates reliance on color information, allowing the model to focus on contextual features, thereby enhancing generalization. Image graying is applied to 30% of the images.
Image blurring: Platform movement, camera shake, and depth of field variations can blur aviation plug images. This study uses mean and median filtering to enhance model recognition of blurred images. Mean filtering reduces noise by averaging pixel values, while median filtering preserves edge details. These techniques improve performance with images of varying clarity. Gaussian blur with a 3 × 3 kernel is applied to 20% of the images.
Horizontal flipping: Given the symmetrical left–right structure of aviation plugs, horizontal flipping does not alter their appearance. This study uses horizontal flipping to augment the dataset, effectively doubling the number of training images. This method enhances dataset diversity and improves the model’s robustness and generalization capabilities. Horizontal flipping is applied to 50% of the images.
HSV jittering: Converting images from RGB to HSV space allows intuitive color adjustments. By modifying hue, saturation, and value, diverse environmental and lighting conditions can be simulated, enhancing the model’s generalization and robustness. HSV jittering is applied to 30% of the images, with ranges of ±10% for hue, ±30% for saturation, and ±30% for value.
Mosaic [44]: A data augmentation technique randomly scales and combines four training samples into a single image during training. This method allows the model to process four images simultaneously without additional computational demands, promoting robust feature learning from complex composites. Scaling reveals smaller objects, enhancing small target detection. This technique increases data diversity and complexity, improving generalization across various scales and object sizes. The mosaic technique, applied to all images, maintains the original image size while stitching four images together.
Figure 2 illustrates the outcomes of the data augmentation process. These augmented images maintain structural integrity while subtly modifying the spatial and semantic contexts of objects. Such adjustments are essential for training the model to recognize objects under diverse conditions and perspectives. Augmentation techniques are combined and applied at specified probabilities to enhance dataset diversity, crucial for developing a robust model that generalizes well across varied real-world scenarios.
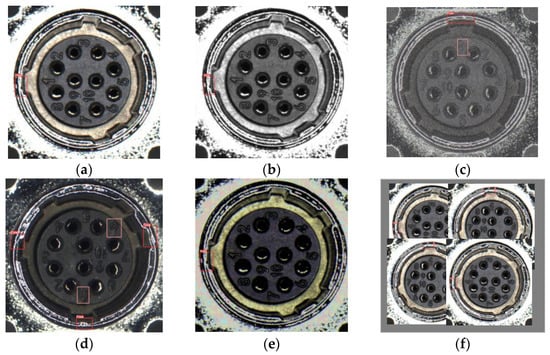
Figure 2.
The example of image augmentation for defect detection. (a) Original image. (b) Image graying. (c) Image blurring. (d) Horizontal flipping. (e) HSV jittering. (f) Composite mosaic image.
2.2. GELAN
CBAM [45] is an attention module for CNNs that enhances key feature focus through channel and spatial attention (Figure 3). The channel attention module creates channel descriptors using global average and max pooling, processed through an MLP and combined via a sigmoid function. The spatial attention module compresses feature maps with pooling and captures dependencies using a 7 × 7 convolution, producing a spatial attention map via a sigmoid function. CBAM can be integrated into any CNN architecture, enhancing classification, detection, and segmentation tasks with low complexity. However, potential issues include missing critical local details due to global pooling and emphasizing non-critical background features, leading to model confusion. Integrating CBAM adds computational steps, increasing the model’s burden and potentially affecting speed and efficiency. The additional parameters and layers may complicate training and optimization, especially with limited or imbalanced data, potentially causing instability or overfitting.

Figure 3.
The architecture of CBAM.
Recent advancements in deep learning have focused on addressing the challenge of information loss across deep network layers, which is crucial for maintaining feature integrity in tasks such as object detection. To effectively tackle this issue, the Generalized Efficient Layer Aggregation Network (GELAN) [42] has been introduced. GELAN combines the neural network architectures of CSPNet [46] and ELAN [47], designed to balance lightweight design, inference speed, and accuracy. The overall architecture is illustrated in Figure 4. GELAN extends the original ELAN, which only used stacked convolutional layers, to a new architecture that can utilize any computational block. This ensures the retention of critical data throughout the network and maintains an accurate and reliable gradient flow during training. GELAN optimizes parameter usage by replacing deep convolutions with traditional convolutional operators, creating a lightweight and efficient structure that enhances accuracy and inference speed.
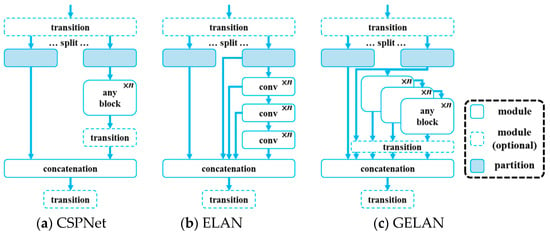
Figure 4.
The architecture of GELAN: (a) CSPNet [46], (b) ELAN [47], and (c) GELAN.
Specifically, GELAN combines global and local attention mechanisms to refine feature representations effectively. The global attention mechanism is represented by Equation (1).
represents the input feature map, and denotes the global average pooling operation, which reduces each channel of the feature map to a scalar. and are the weights of the fully connected layers used to learn the importance of global information. is the non-linear activation function, and is the sigmoid function, which normalizes the weights to the [0, 1] range. The symbol ⊙ denotes element-wise multiplication. It captures broad contextual information from the input features by applying global pooling, followed by a series of transformations that weigh the importance of each channel-wise feature. Concurrently, the local attention mechanism is described by Equation (2).
represents the convolutional layer weights used to capture local dependencies, and denotes the convolution operation. It focuses on enhancing local feature details by applying a convolution that adjusts spatial relevance across the feature map.
Integrating GELAN into our object detection framework is expected to significantly improve detection accuracy and model robustness, particularly in challenging applications such as detecting defects in aviation plug components, by leveraging GELAN’s advanced feature aggregation capabilities, represented by the fusion Equation (3).
is the weight parameter used to balance the contributions of global and local attention. This integration enables YOLOv5 to better handle various complex detection tasks, especially those requiring the simultaneous processing of multi-scale and fine-grained features. This approach provides an effective means to enhance the model’s attention mechanism, thereby improving its recognition capability. As a result, our model can detect subtle defects that previous models might have overlooked, thereby increasing the overall safety and reliability of aviation components.
In detecting keyway and pin number defects in aviation plugs, GELAN offers significant advantages over CBAM. The design of GELAN enables it to simultaneously handle local details and global context, which is crucial for accurately capturing small defects in aviation plugs, such as cracks, deformations, or wear. It effectively identifies these subtle defects through a detailed attention mechanism and integrates global information to understand the potential impact of these local defects on the overall structure, thereby improving detection accuracy and reliability. Additionally, GELAN can effectively separate true defects from complex backgrounds, reducing background interference, especially when background elements are complex or similar to defect features. GELAN also demonstrates superior adaptability and generalization capability, maintaining high performance under varying lighting conditions and from different viewing angles, ensuring stability and accuracy in detection tasks across diverse environments. Thus, GELAN provides a more comprehensive solution for high-precision and detailed recognition tasks in aviation plug defect detection.
In the field of object detection, heatmaps are an invaluable tool that visually demonstrates the degree of response by a model to specific regions within an image, providing an intuitive way to understand model behavior. This visualization technique not only assists developers and researchers in verifying whether the model is appropriately focusing on regions containing the target but also reveals whether the model is influenced by the background or irrelevant objects. Heatmaps generated using techniques such as Class Activation Mapping (CAM) [48] or Grad-CAM [49] effectively highlight the areas that most significantly impact model decisions. This not only boosts the model’s interpretability but also enhances its performance optimization. As illustrated in Figure 5, the heatmaps display the response levels of models integrated with CBAM and GELAN to specific areas of the image.

Figure 5.
Grad-CAM visualizations show that the heatmap color change from cool to warm represents increasing attention: (a) the original image of the defect; (b) the image processed by the CBAM module; (c) the image processed by GELAN.
2.3. Focal EIOU
The traditional YOLOv5 algorithm employs the Complete Intersection Over Union (CIOU) loss function for its computations, representing a significant improvement over more conventional metrics such as Intersection Over Union (IOU), Generalized Intersection Over Union (GIOU), and Distance Intersection Over Union (DIOU). The IOU loss function calculates the ratio of the intersection area to the union of areas, specifically defined as the area of overlap between the predicted bounding box A and the ground truth bounding box B relative to their combined area. The formulation of the CIOU loss function is presented as Equation (4).
When the predicted bounding box does not intersect with the ground truth bounding box, the Intersection Over Union (IOU) metric yields a value of zero, leading to the vanishing of the loss function’s gradient. To address this limitation, the Generalized Intersection Over Union (GIOU) loss function was optimized. The GIOU loss function identifies the smallest enclosing rectangle C that encompasses both bounding boxes A and B and quantifies the distance between the boxes based on C. The formula for GIOU is presented as Equation (5).
From the formulation of the Generalized Intersection Over Union (GIOU), it is established that the range of GIOU values lies between (−1, 1). Specifically, when the rectangular boxes A and B do not intersect, the farther apart the two boxes are, the larger the encompassing box C becomes, and the GIOU value approaches . Conversely, when the rectangular boxes A and B completely overlap, the numerator becomes 0, resulting in a GIOU value of 1. However, GIOU does not effectively address scenarios where the overlapping areas are the same, but their orientations and distances differ, as illustrated in Figure 6.
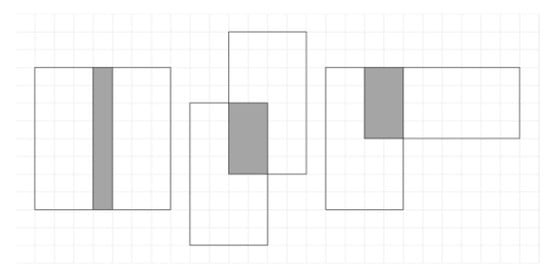
Figure 6.
Varying cases of overlap with identical IOU values.
In response to the limitations of the Generalized Intersection Over Union (GIOU) loss function, researchers have proposed the Distance Intersection Over Union (DIOU) loss function. This improvement focuses on the degree of overlap and the centroid distance between the target and the prediction frame, enhancing alignment and accuracy. The DIOU approach aims to reduce the distance between the centroids of the bounding boxes, thus ensuring that the predicted box not only overlaps more accurately with the target but also aligns better in terms of position. This alignment enhances both the accuracy and the robustness of the bounding box predictions. The formula for the DIOU loss function is given as Equation (6).
In the Distance Intersection Over Union (DIOU) loss formula, and represent the prediction frame and the actual frame, respectively. The term quantifies the Euclidean distance between the centroids of the two bounding boxes, while denotes the diagonal length of the smallest enclosing rectangle that encompasses both frames. Although DIOU offers improvements by considering the centroid distance, it does not address the variations in aspect ratio between the bounding boxes. This specific issue is addressed by the CIOU loss function, which incorporates adjustments for aspect ratio disparities. This enhancement optimizes the alignment further and improves the accuracy of bounding box predictions. The formulation of the CIOU loss function, which includes these additional compensatory measures, is detailed in Equation (7).
The CIOU loss function, employed in the YOLOv5 algorithm, represents a significant optimization over previous loss functions. CIOU comprehensively accounts for the overlap area, centroid distance, and aspect ratio in bounding box regression. However, its treatment of the aspect ratio as a relative value introduces some ambiguity. This relative measure can sometimes hinder model optimization by failing to adequately address the balance problem between difficult and easy samples. This limitation can impact the precision with which the model discriminates between more complex and simpler detection scenarios.
To overcome these challenges, this research adopts the Efficient Intersection Over Union (EIOU) loss function [43] instead of the Complete Intersection Over Union (CIOU) loss function. EIOU directly calculates the differences in width and height rather than relying on the aspect ratio, which reduces ambiguity. Additionally, to address the imbalance between difficult and easy samples, Focal Loss was incorporated, significantly improving the training process in scenarios affected by sample disparities. Focal Loss [43] primarily addresses the issue of class imbalance in object detection. In object detection tasks, background class samples far outnumber foreground class samples. Traditional cross-entropy loss functions often lead models to focus excessively on the abundant, easily classified samples while ignoring the fewer, harder-to-classify samples. Focal Loss modifies the cross-entropy loss by introducing a modulation factor , where is the probability that the model predicts the sample as its true class, and is a tunable parameter. This factor reduces the loss contribution of easily classified samples and increases the loss weight of hard-to-classify samples, ensuring the model focuses more on the latter. The combined Focal-EIOU loss function [43] addresses class imbalance and enhances bounding box localization accuracy. This loss function is particularly well suited for detecting small objects and targets in complex backgrounds, as the Focal Loss component improves sensitivity to hard-to-detect samples, while the EIOU component ensures more accurate bounding box localization. The detailed implementation of the Focal EIOU loss function [43] in this study is presented in Equations (8)–(10).
and represent the width and height, respectively, of the smallest external rectangle that encompasses both bounding boxes involved in the computation. The variables and denote the centroids of the prediction box and the target box, respectively. The term signifies the Euclidean distance between these centroids, enhancing the spatial accuracy of the model. Additionally, is a parameter that modulates the degree of outlier suppression in the model’s learning process. represents the probability that the model predicts the current class. is a balancing factor used to adjust the weights of positive and negative samples. and are weight parameters used to adjust the relative importance of the two loss components. This modulation is crucial for adapting the learning rates based on the proximity of the bounding boxes, thereby optimizing the detection accuracy and robustness.
2.4. S-Decoupled
In this study, we explore the integration of a decoupled head [50] within the YOLOv5 framework, specifically tailored for detecting defects in aviation plug key slots and pin numbers. Traditional YOLO architectures employ coupled detection heads that integrate classification and localization tasks, potentially compromising the model’s efficiency in complex detection scenarios. Our analysis indicates that transitioning to a decoupled head significantly enhances both model convergence and end-to-end performance. As a result, the original coupled detection head was replaced with a lightweight, decoupled variant. This new head incorporates a 1 × 1 convolution layer aimed at reducing channel dimensions, followed by two parallel branches, each consisting of 3 × 3 convolution layers, dedicated to independently handling classification and localization tasks. This architectural modification not only improves detection accuracy but also boosts the model’s structural and operational efficiency by clearly separating responsibilities relevant to different detection tasks. Experimental results confirm that introducing the decoupled head reduces average precision loss and results in a marginal increase in inference time, validating its effectiveness in accurately identifying subtle defects in aviation plug components, such as key slots and pin number markings. This advancement successfully addresses the inherent conflict between classification and regression tasks in object detection frameworks, providing a robust solution that enhances accuracy and reliability in aviation component inspections.
To address the challenge of class imbalance and enhance early model convergence while reducing computational load, we systematically improved the decoupled head based on recent research [43], as shown in Figure 7. Specifically, we made targeted adjustments to the bias parameters within the neural network to resolve two main issues. First, by modifying the biases in the object presence layers, we optimized the network’s sensitivity to potential object locations, as shown in Equation (11).
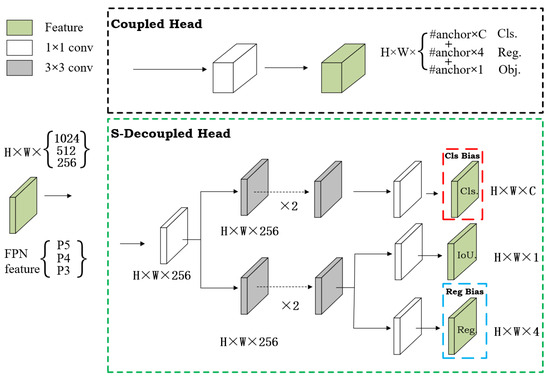
Figure 7.
Illustration of the coupled head and decoupled head.
This Equation is used to initialize the bias for predicting whether each anchor contains an object, aiming to adjust the model’s sensitivity to object presence and adapt to different feature map resolutions. The 8 in the equation represents the assumed average number of objects in each 640 × 640 pixel image, based on empirical data or analysis. The 640/s term indicates the feature map’s stride, where s is the scaling factor of the feature map relative to the original image, thus determining the feature map’s size. As the feature map size decreases, the actual area covered by each cell increases, necessitating appropriate bias adjustments to reflect this change. By setting the bias for object presence prediction at each anchor appropriately, the formula helps balance the model’s sensitivity to object detection across different scales, enabling more accurate identification and localization of objects within images.
Second, by adjusting the biases in the classification layers, we enhanced the model’s ability to handle class imbalances present in the training data, as shown in Equation (12).
This is used to initialize the bias for predicting the target class of each anchor. When class frequency data are available, it utilizes the actual class frequencies to set the biases. Here, cf is an array representing the frequency of each class in the training set, and cf.sum() is the total number of occurrences of all classes in the training data. This bias initialization method enables the model to pay more attention to less frequent classes in the dataset, thereby effectively improving the detection performance for these rare classes. By adjusting the biases, this method helps the model handle all classes more equitably in the face of class imbalance, particularly enhancing the recognition of minority classes.
This is crucial for improving the overall effectiveness and fairness of the model. These refinements significantly increase the model’s classification accuracy and robustness in detecting defects in aviation plug key slots and pin numbers. The architecture of the improved YOLOv5 network is illustrated in Figure 8.
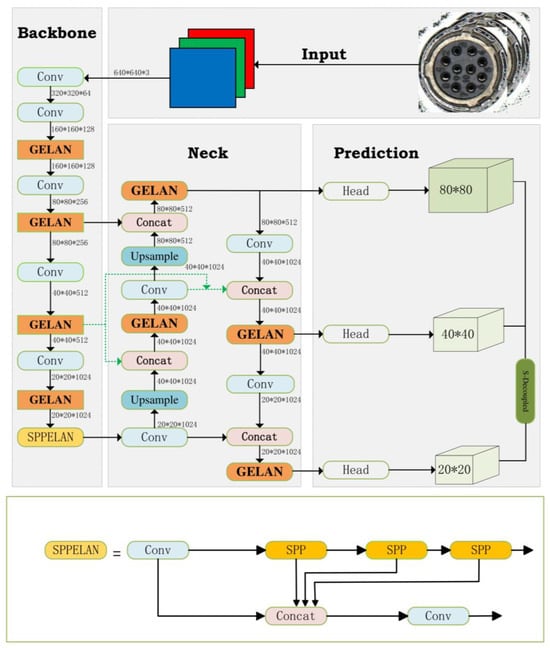
Figure 8.
The structure of improved YOLOv5 algorithm.
3. Experimental Results and Analysis
3.1. Experimental Dataset and Environment
To validate the efficacy of the enhanced YOLOv5 model, a specialized dataset including aviation plug key slot defects (Flaw) and pin number defects (0) was utilized. This dataset was curated from the assembly line of an aerospace electronics manufacturing facility in Zhejiang, China. To prevent overfitting, the dataset underwent augmentation using five previously described image enhancement techniques. Additionally, to test the method’s robustness under different lighting conditions, the brightness levels in the test samples were variably adjusted—decreased in one dataset and increased in another.
The augmented dataset comprises 2700 images, each with a resolution of 1920 × 1080 pixels. It was randomly shuffled and split into training, validation, and testing sets in an 8:1:1 ratio, providing 2160 images for training, 270 for validation, and 270 for testing. Figure 9 details the distribution of bounding boxes across various categories within the training set. The experimental setup, including these configurations, is outlined in Table 2.
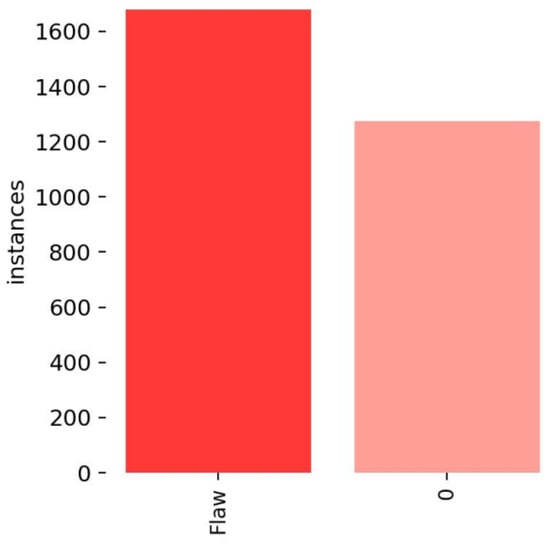
Figure 9.
Statistics on bounding box counts within the training dataset.

Table 2.
Experiment configuration.
3.2. Evaluation Criteria
The primary metrics for evaluating object detection include both accuracy and speed. Speed metrics measure the number of images processed per second or the processing time per image under consistent conditions. Accuracy is assessed using Average Precision (AP) and Mean Average Precision (mAP), with Precision (P) indicating the likelihood of correct detections and Recall (R) assessing the completeness of detections across relevant instances. These metrics, detailed in Equations (13)–(16), provide a consistent basis for evaluating object detection model performance.
Within the aforementioned formulas, TP denotes the number of true positive detections, accurately identified as such. FP represents the number of false positives, which are instances where negative samples are erroneously classified as positive. FN represents the count of false negatives, indicating positive samples mistakenly classified as negative. Additionally, N represents the total number of target categories considered, indicating the scope of the dataset utilized in assessing detection algorithms.
FPS (Frames Per Second) is a key metric for evaluating the performance of video processing and image processing systems, particularly in video games, video streaming, and real-time image recognition and processing. FPS indicates the number of imaging frames a system, program, or device can process per second, reflecting processing speed and real-time handling capability. In model-based visual tasks such as object detection using YOLO models, FPS demonstrates how quickly and efficiently the model can process input images. FPS is calculated based on the total number of frames processed and the total time taken, with Equation (17).
In real-time applications, a high FPS means that images are updated more frequently, processing speed is faster, and thus, a smoother visual experience and quicker response can be provided. Therefore, optimizing FPS is crucial for enhancing the performance of video and real-time image processing systems, especially in environments requiring rapid response, such as autonomous vehicles and real-time surveillance systems. This paper uses the FPS metric to test the improved model’s detection efficiency in industrial and aerospace scenarios.
3.3. P-R Curve
In the aerospace sector, maintaining the integrity of plug key slots and pin numbers is crucial due to their direct impact on flight safety and equipment reliability. An effective defect detection system is therefore indispensable, with the Precision–Recall (PR) curve serving as a vital tool for evaluating such systems. The PR curve illustrates the precision of the detection model at various recall levels, providing a thorough understanding of its performance. Analysis of the PR curve enables quantification of the model’s accuracy in identifying genuine defects while minimizing false positives. Additionally, the area under the PR curve (AUC-PR) acts as a comprehensive performance metric, facilitating the comparison of various algorithms in real-world settings. This assessment is especially beneficial in refining the selection and development of detection algorithms that meet specific industry requirements, thus enhancing equipment reliability and ensuring flight safety.
Figure 10 and Figure 11 present the Precision–Recall (P-R) curves for YOLOv5 and the improved model for detecting key slot and pin number defects. These visual representations provide empirical evidence of the superior detection capabilities of the enhanced model, with an AP improvement of 15.8% for Flaw, highlighting its effectiveness in consistently and accurately identifying defects under various conditions. The improvement in the P-R curves specifically indicates increased precision and recall, reflecting significant advancements in the model’s ability to detect subtle and critical defects in aviation components.
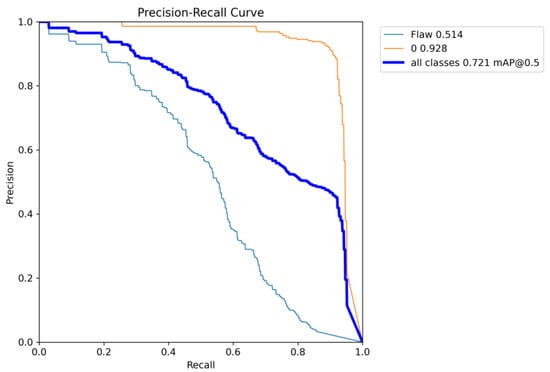
Figure 10.
P-R curve of the YOLOv5.
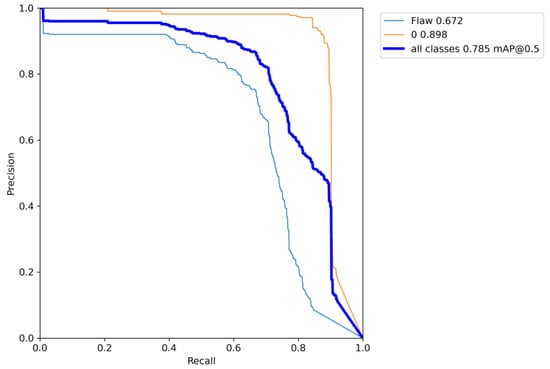
Figure 11.
P-R curve of the enhanced algorithm.
3.4. Ablation Experiment
This study utilized an enhanced version of the YOLOv5s model, validated through a series of ablation experiments designed to assess the efficacy of various enhancements. The experimental results are shown in Table 3. Initially, by integrating the Generalized Efficient Layer Aggregation Network (GELAN), the model’s Mean Average Precision (mAP) increased from 72.1% to 74.4%, as observed in comparisons between Experiments 1 and 2. This improvement underscores a heightened probability of defect detection and a reduction in the rate of missed detections. Furthermore, replacing the traditional CIOU loss function with the Focal EIOU loss function, as examined between Experiments 2 and 3, advanced the mAP from 74.4% to 75.2%. This demonstrates the Focal EIOU loss function’s effectiveness in enhancing model performance, particularly when dealing with imbalanced data.

Table 3.
Ablation study results.
Significant improvements were noted between Experiments 3 and 4, where substituting the traditional coupled head with a decoupled head increased the mAP by an additional 3.3%. Furthermore, the transition from Experiments 4 to 5 involved implementing a lightweight decoupled head, which reduced the computational load while maintaining detection efficiency, significantly enhancing the model’s performance in challenging environments. Additionally, the improved model maintained an FPS of 139/s, demonstrating excellent performance in detection tasks.
The introduction of the decoupled head, while substantially increasing the parameter count and computational load, thereby invisibly raising training costs, led to notable performance improvements. To address this challenge, a lightweight decoupled head was implemented, which reduced training time without negatively impacting defect detection rates. This indicates that the lightweight decoupled head successfully minimizes the model’s computational demands while preserving detection efficacy, rendering the model more adaptable for deployment in environments with limited resources.
To validate the effectiveness of the proposed algorithm, it was compared with mainstream object detection models such as SSD, Faster R-CNN, YOLOv5s, YOLOv7, YOLOv8s, and YOLOv9s on the aviation plug dataset. The experimental results are presented in Table 4 for comparison. Table 4 shows the mAP@0.5, parameters, and FPS values for different models on various defects. As shown in Table 4, SSD and Faster R-CNN algorithms exhibit slight differences in detection accuracy for aviation plug defects. Although Faster R-CNN may have slightly better detection performance, as a two-stage detection algorithm, it has a relatively high number of parameters and significantly slower detection speed. For small defect sizes, the detection performance of YOLOv8s and YOLOv7 is not satisfactory. YOLOv9s shows good detection performance but slower detection speed and a higher number of parameters. YOLOv5s is the fastest detection algorithm with relatively good detection performance. The improved YOLOv5 algorithm demonstrates an overall enhancement in detection performance, with only a slight decrease in detection speed. The number of parameters remains at a satisfactory level. Additionally, it shows significant improvement in detecting certain small defects. Based on these findings, the proposed algorithm outperforms other algorithms for aviation plug defect detection tasks, achieving better performance in accomplishing detection tasks.

Table 4.
Comparative analysis of different model performances.
The performance of the YOLOv5 model before and after improvements in detecting aviation plug defects is shown in Figure 12.
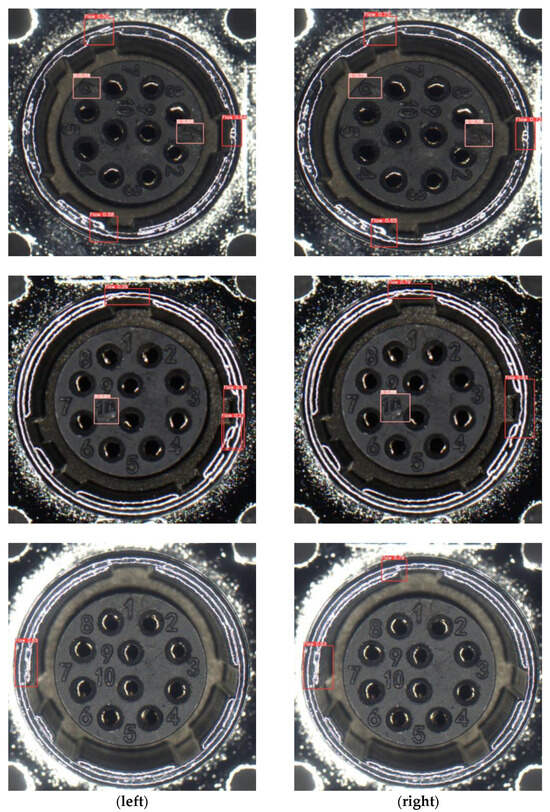
Figure 12.
Comparison of detection effect before (left) and after (right) network enhancement.
To verify the improved model’s robustness to lighting, we tested it on the aviation plug defect dataset under different lighting conditions. As shown in Figure 13, the model maintained high performance regardless of lighting changes, accurately detecting defects. The improved YOLOv5 is well suited for aviation plug defect detection and demonstrates excellent robustness to lighting variations, making it ideal for use in uncertain industrial and aerospace environments.
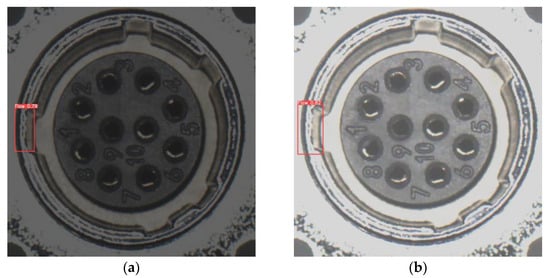
Figure 13.
Visual outcomes of our method across varied lighting conditions: (a) low light; (b) high light.
Given the inherent randomness in the outputs of deep learning algorithms, the improved algorithm underwent multiple training and testing iterations to validate the consistency and accuracy of its results. This methodological approach ensured a robust evaluation of the algorithm’s performance. The effectiveness of the enhancements was quantitatively assessed by averaging the results across these experiments, thereby providing a reliable measure of improvement. The detailed outcomes of this process are systematically presented in Table 5, which offers a clear and structured overview of the performance enhancements. The data indicate that the highest detection accuracy achieved is 78.5%, while the lowest is 77.8%, showing a marginal difference of 0.7% between the best and worst performances. This suggests some degree of variability in the network’s performance. The mean result from ten experiments stands at 78.1%, with a standard deviation of 0.258%. When disregarding the highest and lowest results, the majority of outcomes consistently exceed 78.1%, clustering mainly between 78.1% and 78.5%. The modifications in this study enhanced the network’s reliability and performance consistency. These improvements are particularly effective for detecting keyway defects in aviation plugs within aerospace manufacturing and maintenance. The model balances speed and accuracy, enabling near real-time image processing and detection, ideal for production line and safety inspection. It integrates easily into existing industrial vision systems, supporting various programming environments and hardware platforms.

Table 5.
Average experimental performance of the enhanced model.
To further demonstrate the improved YOLOv5’s generalization, we conducted similar experiments on another publicly available surface defect detection dataset called NEU-DET (1800 images). Using the same experimental settings, our results are shown in Figure 14 and Figure 15. The improved model showed enhancements in detecting most types of defects, with a 5.6% increase in mAP. Notably, crazing exhibited a significant improvement of 24.4%. However, the image preprocessing process used to improve the model may not fully satisfy the inclusion category, potentially leading to the loss of critical details and reduced results for that category. This experiment indicates that our proposed model not only achieved better performance on the aviation plug defect dataset but also showed significant improvement on the NEU-DET dataset, highlighting its strong generalization capability.
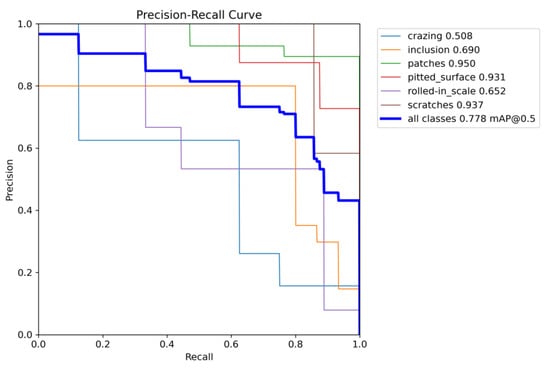
Figure 14.
YOLOv5 algorithm results.
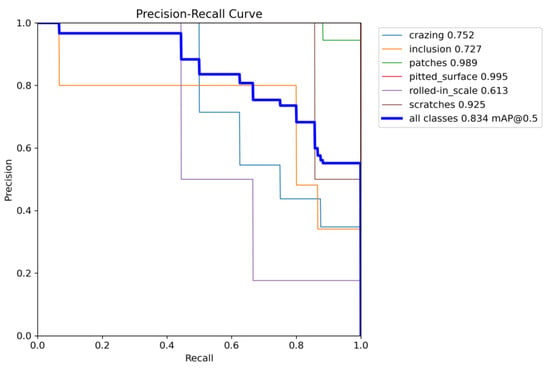
Figure 15.
Improved YOLOv5 algorithm results.
4. Conclusions
This paper introduces an enhanced YOLOv5 algorithm specifically tailored for detecting key slot and pin number defects in aviation plugs. Using a custom proprietary dataset designed for this study, the algorithm significantly improves detection accuracy over the traditional YOLOv5 network. Detailed analysis and refinement of the network architecture and training parameters were conducted. The inclusion of the Generalized Efficient Layer Aggregation Network (GELAN) replaces the traditional Convolutional Block Attention Module (CBAM), enhancing the model’s ability to tackle defect detection challenges. This change improves multi-scale and multi-layer feature aggregation, optimizing defect detection and task separation. The Focal EIOU loss function and lightweight decoupled head further balance precision and recall while reducing computational load. Experimental results show a detection probability of 78.5% with minimal increase in inference time, confirming both efficiency and accuracy. Future research can integrate YOLOv5 with other models to enhance accuracy through multi-stage processing and adaptive learning strategies. Techniques like oversampling and undersampling can address data imbalance. Integrating defect detection data with airline maintenance databases and operating systems can automate the logging and generation of repair tasks upon detecting defects. Additionally, analyzing the impact of defects on aircraft fuel efficiency can optimize fuel management strategies and reduce consumption. Integrating defect data into flight delay prediction models can improve the accuracy of delay forecasts. Regular performance evaluations of defect detection and prediction models ensure operational efficiency and cost reduction. Continuous optimization based on operational data and feedback will adapt to new insights and enhance safety. Advanced defect detection technology not only improves safety but also helps airlines reduce costs by minimizing unnecessary maintenance and optimizing operational processes.
Author Contributions
Conceptualization, C.H.; methodology, C.H.; software, C.H. and L.J.; validation, C.H. and L.J.; formal analysis, L.J.; investigation, C.H.; resources, L.J.; data curation, C.H. and L.J.; writing—original draft preparation, C.H.; writing—review and editing, L.J.; visualization, C.H.; supervision, L.J.; project administration, L.J.; funding acquisition, L.J. All authors have read and agreed to the published version of the manuscript.
Funding
This research was partially supported by the Aviation Fund under grant 20230009054001.
Data Availability Statement
The data presented in this study are available on request from the corresponding author. The data are not publicly available due to privacy.
Conflicts of Interest
The authors declare no conflicts of interest.
References
- Li, H.; Lyu, K.; Yong, Z.; Xiaolong, W.; Qiu, J.; Liu, G. Multichannel parallel testing of intermittent faults and reliability assessment for electronic equipment. IEEE Trans. Compon. Packag. Manuf. Technol. 2020, 10, 1636–1646. [Google Scholar] [CrossRef]
- Zhang, M.; Feng, J.; Niu, S.; Shen, Y. Aviation plug clustering based fault detection method using hyperspectral image. In Proceedings of the 2020 39th Chinese Control Conference (CCC), Shenyang, China, 27–29 July 2020; pp. 6018–6022. [Google Scholar]
- Luo, Q.; Fang, X.; Liu, L.; Yang, C.; Sun, Y. Automated visual defect detection for flat steel surface: A survey. IEEE Trans. Instrum. Meas. 2020, 69, 626–644. [Google Scholar] [CrossRef]
- Fang, X.; Luo, Q.; Zhou, B.; Li, C.; Tian, L. Research progress of automated visual surface defect detection for industrial metal planar materials. Sensors 2020, 20, 5136. [Google Scholar] [CrossRef]
- Chen, Y.; Ding, Y.; Zhao, F.; Zhang, E.; Wu, Z.; Shao, L. Surface defect detection methods for industrial products: A review. Appl. Sci. 2021, 11, 7657. [Google Scholar] [CrossRef]
- Aleshin, N.P.; Kozlov, D.M.; Mogilner, L.Y. Ultrasonic testing of welded joints in polyethylene pipe. Russ. Eng. Res. 2021, 41, 123–129. [Google Scholar] [CrossRef]
- Amiri, N.; Farrahi, G.H.; Kashyzadeh, K.R.; Chizari, M. Applications of ultrasonic testing and machine learning methods to predict the static & fatigue behavior of spot-welded joints. J. Manuf. Process. 2020, 52, 26–34. [Google Scholar]
- Sazonova, S.A.; Nikolenko, S.D.; Osipov, A.A.; Zyazina, T.V.; Venevitin, A.A. Weld defects and automation of methods for their detection. J. Phys. Conf. Ser. 2021, 1889, 022078. [Google Scholar] [CrossRef]
- Tang, Y.; Wang, C.; Zhang, X.; Zhou, Z.; Lu, X. Research on Intelligent Detection Method of Forging Magnetic Particle Flaw Detection Based on YOLOv4. In Advanced Manufacturing and Automation XII; Springer Nature: Singapore, 2023; pp. 129–134. [Google Scholar]
- Zolfaghari, A.; Zolfaghari, A.; Kolahan, F. Reliability and sensitivity of magnetic particle nondestructive testing in detecting the surface cracks of welded components. Nondestruct. Test. Eval. 2018, 33, 290–300. [Google Scholar] [CrossRef]
- Yu, H.; Li, X.; Song, K.; Shang, E.; Liu, H.; Yan, Y. Adaptive depth and receptive field selection network for defect semantic segmentation on castings X-rays. NDT E Int. 2020, 116, 102345. [Google Scholar] [CrossRef]
- Su, L.; Wang, L.Y.; Li, K.; Wu, J.; Liao, G.; Shi, T.; Lin, T. Automated X-ray recognition of solder bump defects based on ensemble-ELM. Sci. China Technol. Sci. 2019, 62, 1512–1519. [Google Scholar] [CrossRef]
- Zhang, K.; Shen, H. Solder joint defect detection in the connectors using improved faster-rcnn algorithm. Appl. Sci. 2021, 11, 576. [Google Scholar] [CrossRef]
- Zhang, K.; Shen, H. An Effective Multi-Scale Feature Network for Detecting Connector Solder Joint Defects. Machines 2022, 10, 94. [Google Scholar] [CrossRef]
- Sun, J.; Li, C.; Wu, X.J.; Palade, V.; Fang, W. An effective method of weld defect detection and classification based on machine vision. IEEE Trans. Ind. Inform. 2019, 15, 6322–6333. [Google Scholar] [CrossRef]
- Long, Z.; Zhou, X.; Zhang, X.; Wang, R.; Wu, X. Recognition and classification of wire bonding joint via image feature and SVM model. IEEE Trans. Compon. Packag. Manuf. Technol. 2019, 9, 998–1006. [Google Scholar] [CrossRef]
- Peng, Y.; Yan, Y.; Chen, G.; Feng, B. Automatic compact camera module solder joint inspection method based on machine vision. Meas. Sci. Technol. 2022, 33, 105114. [Google Scholar] [CrossRef]
- Wenjin, L.; Peng, X.; Xiaozhou, L.; Wenju, Z.; Minrui, F. Modified Fusion Enhancement Algorithm Based on Neighborhood Mean Color Variation Map for AOI Solder Joint Detection. In Proceedings of the 2022 41st Chinese Control Conference (CCC), Hefei, China, 25–27 July 2022; pp. 6521–6526. [Google Scholar]
- Zhang, M.; Lu, Y.; Li, X.; Shen, Y.; Wang, Q.; Li, D.; Jiang, Y. Aviation plug on-site measurement and fault detection method based on model matching. In Proceedings of the 2019 IEEE International Instrumentation and Measurement Technology Conference (I2MTC), Auckland, New Zealand, 20–23 May 2019; pp. 1–5. [Google Scholar]
- Shah, H.N.M.; Sulaiman, M.; Shukor, A.Z.; Kamis, Z.; Ab Rahman, A. Butt welding joints recognition and location identification by using local thresholding. Robot. Comput.-Integr. Manuf. 2018, 51, 181–188. [Google Scholar] [CrossRef]
- Fonseka, C.; Jayasinghe, J. Implementation of an automatic optical inspection system for solder quality classification of THT solder joints. IEEE Trans. Compon. Packag. Manuf. Technol. 2018, 9, 353–366. [Google Scholar] [CrossRef]
- Ieamsaard, J.; Muneesawang, P.; Sandnes, F. Automatic optical inspection of solder ball burn defects on head gimbal assembly. J. Fail. Anal. Prev. 2018, 18, 435–444. [Google Scholar] [CrossRef]
- Cai, N.; Ye, Q.; Liu, G.; Wang, H.; Yang, Z. IC solder joint inspection based on the Gaussian mixture model. Solder. Surf. Mt. Technol. 2016, 28, 207–214. [Google Scholar] [CrossRef]
- Sha, J.; Wang, J.; Hu, H.; Ye, Y.; Xu, G. Development of an accurate and automated quality inspection system for solder joints on aviation plugs using fine-tuned YOLOv5 models. Appl. Sci. 2023, 13, 5290. [Google Scholar] [CrossRef]
- Khan, W.A.; Chung, S.H.; Eltoukhy, A.E.; Khurshid, F. A novel parallel series data-driven model for IATA-coded flight delays prediction and features analysis. J. Air Transp. Manag. 2024, 114, 102488. [Google Scholar] [CrossRef]
- Khan, W.A.; Ma, H.L.; Chung, S.H.; Wen, X. Hierarchical integrated machine learning model for predicting flight departure delays and duration in series. Transp. Res. Part C Emerg. Technol. 2021, 129, 103225. [Google Scholar] [CrossRef]
- Krichen, M.; Lahami, M.; Al–Haija, Q.A. Formal Methods for the Verification of Smart Contracts: A Review. In Proceedings of the 2022 15th International Conference on Security of Information and Networks (SIN), Sousse, Tunisia, 11–13 November 2022; pp. 1–8. [Google Scholar]
- Lin, G.; Wen, S.; Han, Q.L.; Zhang, J.; Xiang, Y. Software vulnerability detection using deep neural networks: A survey. Proc. IEEE 2020, 108, 1825–1848. [Google Scholar] [CrossRef]
- Miller, A.; Cai, Z.; Jha, S. Smart contracts and opportunities for formal methods. In Leveraging Applications of Formal Methods, Verification and Validation. Industrial Practice: 8th International Symposium; Springer: Cham, Switzerland, 2018; pp. 280–299. [Google Scholar]
- Zhang, C.; Song, D.; Chen, Y.; Feng, X.; Lumezanu, C.; Cheng, W.; Ni, J.; Zong, B.; Chen, H.; Chawla, N.V. A deep neural network for unsupervised anomaly detection and diagnosis in multivariate time series data. Proc. AAAI Conf. Artif. Intell. 2019, 33, 1409–1416. [Google Scholar] [CrossRef]
- Farady, I.; Kuo, C.C.; Ng, H.F.; Lin, C.Y. Hierarchical Image Transformation and Multi-Level Features for Anomaly Defect Detection. Sensors 2023, 23, 988. [Google Scholar] [CrossRef]
- Wang, J.; Xu, G.; Yan, F.; Wang, J.; Wang, Z. Defect transformer: An efficient hybrid transformer architecture for surface defect detection. Measurement 2023, 211, 112614. [Google Scholar] [CrossRef]
- Wang, Y.; Chung, S.H.; Khan, W.A.; Wang, T.; Xu, D.J. ALADA: A lite automatic data augmentation framework for industrial defect detection. Adv. Eng. Inform. 2023, 58, 102205. [Google Scholar] [CrossRef]
- Ren, S.; He, K.; Girshick, R.; Sun, J. Faster r-cnn: Towards real-time object detection with region proposal networks. In Proceedings of the Advances in Neural Information Processing Systems 28 (NIPS 2015), Montreal, QC, Canada, 7–12 December 2015. [Google Scholar]
- Liu, W.; Anguelov, D.; Erhan, D.; Szegedy, C.; Reed, S.; Fu, C.Y.; Berg, A.C. SSD: Single shot multibox detector. In Computer Vision—ECCV 2016, Proceedings of the 14th European Conference, Amsterdam, The Netherlands, 11–14 October 2016; Springer International Publishing: Cham, Switzerland, 2016; Part I; pp. 21–37. [Google Scholar]
- Redmon, J.; Divvala, S.; Girshick, R.; Farhadi, A. You only look once: Unified, real-time object detection. In Proceedings of the IEEE Conference on Computer Vision and Pattern Recognition, Las Vegas, NV, USA, 27–30 June 2016; pp. 779–788. [Google Scholar]
- Redmon, J.; Farhadi, A. YOLO9000: Better, faster, stronger. In Proceedings of the IEEE Conference on Computer Vision and Pattern Recognition, Honolulu, HI, USA, 21–26 July 2017; pp. 7263–7271. [Google Scholar]
- Bochkovskiy, A.; Wang, C.Y.; Liao, H.Y.M. Yolov4: Optimal speed and accuracy of object detection. arXiv 2020, arXiv:2004.10934. [Google Scholar]
- Gao, Y.; Liu, W. Complex Labels Text Detection Algorithm Based on Improved YOLOv5. IAENG Int. J. Comput. Sci. 2023, 50, 30. [Google Scholar]
- Yuan, Z.; Ning, H.; Tang, X.; Yang, Z. GDCP-YOLO: Enhancing steel surface defect detection using lightweight machine learning approach. Electronics 2024, 13, 1388. [Google Scholar] [CrossRef]
- Wang, C.Y.; Bochkovskiy, A.; Liao, H.Y.M. YOLOv7: Trainable bag-of-freebies sets new state-of-the-art for real-time object detectors. In Proceedings of the IEEE/CVF Conference on Computer Vision and Pattern Recognition, Vancouver, BC, Canada, 17–24 June 2023; pp. 7464–7475. [Google Scholar]
- Wang, C.Y.; Yeh, I.H.; Liao, H.Y.M. YOLOv9: Learning What You Want to Learn Using Programmable Gradient Information. arXiv 2024, arXiv:2402.13616. [Google Scholar]
- Lin, T.Y.; Goyal, P.; Girshick, R.; He, K.; Dollár, P. Focal loss for dense object detection. In Proceedings of the IEEE International Conference on Computer Vision, Venice, Italy, 22–29 October 2017; pp. 2980–2988. [Google Scholar]
- Dlamini, S.; Kuo, C.F.J.; Chao, S.M. Developing a surface mount technology defect detection system for mounted devices on printed circuit boards using a MobileNetV2 with Feature Pyramid Network. Eng. Appl. Artif. Intell. 2023, 121, 105875. [Google Scholar] [CrossRef]
- Woo, S.; Park, J.; Lee, J.Y.; Kweon, I.S. CBAM: Convolutional block attention module. In Proceedings of the European Conference on Computer Vision (ECCV), Munich, Germany, 8–14 September 2018; pp. 3–19. [Google Scholar]
- Wang, C.Y.; Liao, H.Y.M.; Wu, Y.H.; Chen, P.Y.; Hsieh, J.W.; Yeh, I.H. CSPNet: A new backbone that can enhance learning capability of CNN. In Proceedings of the IEEE/CVF Conference on Computer Vision and Pattern Recognition Workshops (CVPRW), Seattle, WA, USA, 13–19 June 2020; pp. 390–391. [Google Scholar]
- Wang, C.Y.; Liao, H.Y.M.; Yeh, I.H. Designing network design strategies through gradient path analysis. J. Inf. Sci. Eng. 2023, 39, 975–995. [Google Scholar]
- Jiang, P.T.; Zhang, C.B.; Hou, Q.; Cheng, M.M.; Wei, Y. Layer CAM: Exploring Hierarchical Class Activation Maps for Localization. IEEE Trans. Image Process. 2021, 30, 5875–5888. [Google Scholar] [CrossRef]
- Selvaraju, R.R.; Cogswell, M.; Das, A.; Vedantam, R.; Parikh, D.; Batra, D. Grad-CAM: Visual Explanations from Deep Networks via Gradient-Based Localization. In Proceedings of the IEEE International Conference on Computer Vision, Venice, Italy, 22–29 October 2017; pp. 618–626. [Google Scholar]
- Ge, Z.; Liu, S.; Wang, F.; Li, Z.; Sun, J. Yolox: Exceeding yolo series in 2021. arXiv 2021, arXiv:2107.08430. [Google Scholar]
Disclaimer/Publisher’s Note: The statements, opinions and data contained in all publications are solely those of the individual author(s) and contributor(s) and not of MDPI and/or the editor(s). MDPI and/or the editor(s) disclaim responsibility for any injury to people or property resulting from any ideas, methods, instructions or products referred to in the content. |
© 2024 by the authors. Licensee MDPI, Basel, Switzerland. This article is an open access article distributed under the terms and conditions of the Creative Commons Attribution (CC BY) license (https://creativecommons.org/licenses/by/4.0/).