Abstract
This study investigates the impact of wind shear on the flight dynamics of commercial aircraft where C* and C*U control laws are employed during the approach phase. Given the high incidence of flight accidents during takeoff and landing attributed to wind shear, this research aims to enhance aviation safety by analyzing control law behavior under varying wind shear conditions. A nonlinear flight simulation model was developed, utilizing aerodynamic and engine data from a B737, to explore the aircraft’s response to different wind shear intensities. The simulation analysis was used to compare the response of the aircraft with C* and C*U controllers, respectively, under different wind shear, and to evaluate the effectiveness of its stability enhancement in wind shear. It was found that in most cases, the controller can achieve a good stabilization effect, but in some cases of wind fields, the aircraft suffered more significant oscillation.
1. Introduction
Many aircraft accidents are caused by low-altitude wind shear during takeoff and landing. According to the Statistical Summary of Commercial Jet Airplane Accidents from Boeing Company, 61% of flight accidents occur during takeoff and landing phases. Among these accidents, 66% are caused by wind shear or by the pilot’s improper manipulation induced by wind shear [1]. In order to ensure the safety of civil aviation flight and reduce accidents caused by wind shear, an analysis should be conducted from wind shear and control law.
There are a large number of studies in the research about aircraft control in wind shear. In early research, different types of feedback control are proposed. For instance, a robust feedback control strategy is designed to increase aircraft stability during takeoff, using the Lyapunov equation [2]. To stabilize the climb rate during the takeoff phase, a robust controller is established through feedback utilizing a relative angle of attack [3,4]. With the development of research about wind shear, some novel approaches are applied. Differential game theory is used to design feedback controls providing flight safety during takeoff [5,6,7] and landing [8]. Especially, a dynamic programming approach is used to solve a differential game problem in ref [7]. However, the majority of research on wind shear focuses on the control law design, which means that relatively less studies have been conducted on wind shear for control laws already widely implemented.
And in 2023, commercial aircraft equipped with Fly-By-Wire (FBW) technology account for 58% of the flights [9]. The longitudinal control laws widely used in these commercial aircraft include C* and C*U. There is relatively little research related to both C* and C*U controllers, mainly focusing on the impact of different controllers on the distribution of aircraft poles [10]. There is relatively more research on C* or C*U control laws, mainly focusing on enhancing the flight quality of aircraft by designing controllers through various methods [11,12,13,14]. Saussié designs a C* controller by comprehensively considering modal criteria, frequency criteria, and time-domain criteria [13]. Besides considering classical control techniques, Marcos uses the structured H-infinity control technique to design a C* controller with better robust performance and stability properties [14]. Some studies involving C* control law focus on using neural networks to detect or compensate for hardware failures during flight [15,16,17]. Certainly, Airbus has also conducted some analysis on the velocity stability of C* control [18]. There is relatively little research on C*/C*U with wind shear, but the research about it has a certain reference value for improving control law design.
In this paper, to investigate the effects of wind shear on aircraft with different longitudinal control laws during the approach phase, we established a nonlinear flight simulation model based on aerodynamic and engine data of Boeing 737. We designed C* and C*U controllers for the model. The initial state of the model was set to an approach state with a 3° glide slope. Finally, we analyze and compare the transient and steady-state control effects of C* and C*U controllers through simulation results.
2. Model
In this paper, we mainly focus on the influence of C* and C*U control laws under the influence of wind. Regarding control laws, we usually have two questions: what impact will different control laws have on steady state, and what are the differences in transient response between different control laws? In order to draw a conclusion, we apply simulation methods to analyze it. Firstly, we built a simulation model with a longitudinal aerodynamic model, engine model, controller model, and environment model, as shown in Figure 1. Before detailing these models, we made two assumptions:
- (1)
- The mass of the aircraft is a constant;
- (2)
- Flight takes place in a vertical plane.
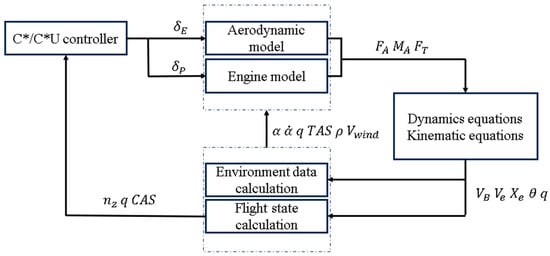
Figure 1.
Simulator architecture.
2.1. Aircraft Simulation Model
2.1.1. Aerodynamic Model
During normal flight, the aerodynamics and moments of the aircraft conform to the dynamic derivative model, which is applicable to aircraft with less significant changes in the angle of attack. Therefore, the dynamic derivative model is used to describe the aerodynamic parameters in this simulation model.
The lift of the aircraft and the composition of the lift coefficient in the dynamic derivative model are shown in (1),
where is the air density, S is a reference surface, V is the relative velocity, is angle of attack, q is pitch rate, is the angle of attack change rate, and is the Elevator deflection angle. The coefficients , , and are constants depending on the aerodynamic configuration. , is the dimensionless angular velocity. The relationship between and is in Figure 2.
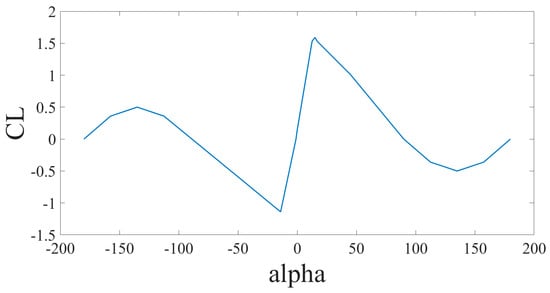
Figure 2.
Static lift coefficient varies with angle of attack.
The drag of the aircraft and the composition of the drag coefficient in the dynamic derivative model are shown in (2),
where the coefficient is the zero drag coefficient and A is the lift-induced drag factor. When there is little change in speed and altitude, and A can be considered as constants.
The pitch moment of the aircraft and the composition of the pitch moment coefficient in the dynamic derivative model are shown in (3),
where is the zero lift moment coefficient, and is the elevator trim angle. And the coefficients , , and are constants depending on the aerodynamic configurations. The relationship between and is as in Figure 3.
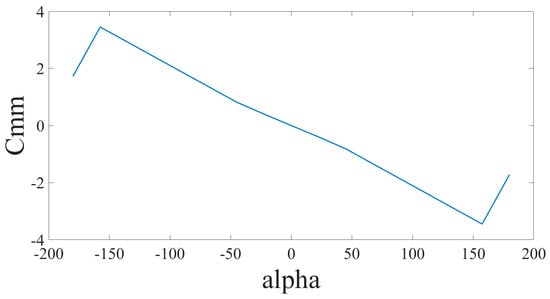
Figure 3.
Static pitch moment coefficient varies with angle of attack.
2.1.2. Engine Model
To simplify the engine model, only the thrust variations caused by throttle input and airspeed are considered here. The actual thrust curve is fitted, and the expression is shown in (4),
where are dependent on the velocity, altitude, and the ambient temperature [4].
2.1.3. Wind Shear Model
The core of this study is to compare the differences between the C* and C*U controllers. In reference [19], the author provides a simplified wind field model derived from the actual wind field. It is applicable to the situation described in this paper. This paper concentrates on the longitudinal response of the aircraft, and therefore ignores the y-axis input of the wind field model.
The model describes that the horizontal wind field is related to the horizontal displacement x of the aircraft, while the vertical wind field is related to both the horizontal displacement x and the vertical displacement h of the aircraft. k characterizes the maximum wind speed of wind shear and is a reference altitude. The specific model is as follows:
The wind field model changes are located at points a, b, d, e, f, g, i, and j, which are shown in Figure 4.
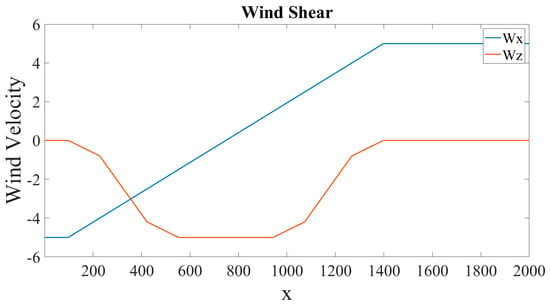
Figure 4.
The wind shear model.
2.1.4. Initial State
This paper mainly focuses on simulation analysis during the approach stage, so the initial state is the approach state with a 3° glide angle and a height of 300 m. According to FAA rules, the wind speed requirements for a Boeing 737 during the landing phase are a tailwind not exceeding 15 knots and a headwind not exceeding 25 knots. Therefore, the selected wind shear is , , and , corresponding to , , and . Among them, only considers the headwind situation. There are slight differences in the actual balance state under different horizontal wind velocities. Therefore, taking the horizontal wind shear of as an example, the initial state is set to the approach phase with a 3-degree glide slope with a horizontal wind velocity of and a vertical wind velocity of . The data from the aircraft and simulation are shown in Table 1, Table 2 and Table 3.

Table 1.
Simulation model parameters.
Here, S is the wing area, c is MAC, and m is the mass of the aircraft.

Table 2.
Simulation initialization parameters.
Table 2.
Simulation initialization parameters.
| Initialize Parameter | Value | Initialize Parameter | Value |
|---|---|---|---|
| TAS | α | 2.177° | |
| θ | −0.6208° | q | |
| H0 | 300 m | 0.1873 | |
| −0.0045 | 0 |
Here, is the pitch angle of the aircraft, is the throttle input, is the pitch input, and is the elevator trim input.

Table 3.
Wind model parameters.
Table 3.
Wind model parameters.
| Initialize Parameter | Value | Initialize Parameter | Value |
|---|---|---|---|
| a | 91.44 m | b | 1311 m |
| d | 213.4 m | e | 396.2 m |
| f | 518.2 m | g | 883.9 m |
| i | 1006 m | j | 1189 m |
| 300 m |
2.2. C* and C*U Controller
This paper primarily contrasts the proportional–integral feedback C* and C*U controllers. In this section, we design C* and C*U controllers for simulation models, followed by parameter tuning and modal analysis.
2.2.1. C* Control
C* is defined by the linear combination of pitch rate and vertical load factor. The controller achieves stability enhancement by providing feedback to C*. The model of the C* controller is shown in Figure 5. The parameter C* form is as follows:
where is the vertical load factor at the pilot’s location, q is the pitch rate, is the so-called “crossover” airspeed (), and g is the gravity constant [10].
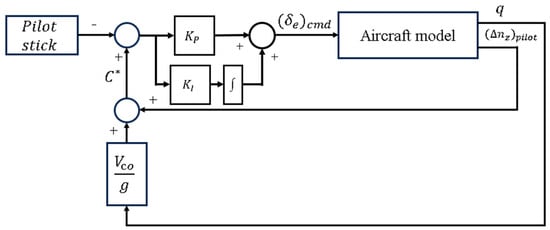
Figure 5.
Simplified C* controller structure.
2.2.2. C*U Control
C*U is defined around a core of C* and incorporates airspeed feedback to enhance speed stability. The controller is feedback on C*U. The model of the C*U controller is shown in Figure 6. The parameter C*U form is as follows:
where is the error between the airplane’s calibrated airspeed and the reference speed, and is the speed stability gain.
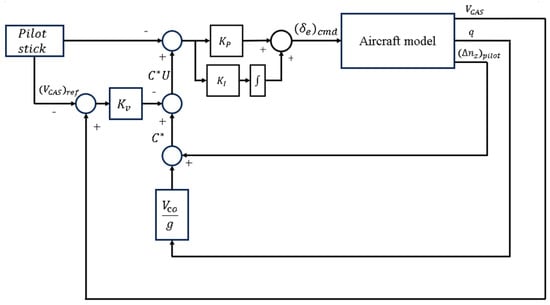
Figure 6.
Simplified C*U controller structure.
2.3. The Gain of Feedback
2.3.1. Small Disturbance Model
The model commonly used for calculating gains is linearized, and in this paper, we choose the small disturbance model for solving feedback gains. However, the output vector of a commonly used small disturbance model does not include the vertical load factor. We derive the expression for vertical load factor.
When the motion of the aircraft satisfies the assumptions made in Section 2.1, the expression for the vertical load factor is as follows:
where is the engine installation angle, and is the angle of climb. When the state changes, the change of the vertical load factor is
where * represents the reference motion. We linearize the L and T:
When studying the longitudinal motion and the changes in force and moment caused by altitude are not significant, , , , and are usually neglected. If the climb angle does not change much, then
Combining the expressions of (8) and (14), the small disturbance model is
where the state vector, input vector, and output vector are
The values of matrices A, B, C, and D at the initial statement are given as follows:
2.3.2. Flying Qualities Specifications
In this paper, the research focuses on the approach phase which is category B in MIL-STD-1797A. And the standard provides the phugoid specifications and short-period specifications, shown in Table 4 and Table 5 [20].

Table 4.
Phugoid modal damping ratio limits in MIL-STD-1797A.

Table 5.
Short-period modal damping ratio limits in MIL-STD-1797A.
Here, and are the damping ratio of the phugoid modal and short-period modal.
The short-period modal of an aircraft is not only related to the damping ratio but also to the natural frequency. Therefore, additional Control Anticipation Parameter (CAP) quality requirements are usually imposed. The requirement for CAP is shown in Table 6 [20].

Table 6.
Short-period modal CAP limits.
Here, , is the short-period natural frequency, is the trimming speed, g is the acceleration of gravity, and is the short-period numerator time constant in the transfer function.
2.3.3. Value and Analysis of Gain
The parameter selection process is also exemplified by the wind intensity of , and the steps for adjusting parameters in other states are basically the same. Based on the small disturbance model in Section 2.3.1, the open-loop parameters of the short-period modal and phugoid modal can be obtained which are shown in Table 7.

Table 7.
The short-period and phugoid parameters of the open-loop model.
In order to meet the ideal damping ratio of the short-period modal, , the gain of the C* controller is , . And the closed-loop modals of the aircraft are shown in Table 8.

Table 8.
The short-period and phugoid parameters of aircraft with a C* controller.
In order to compare the differences between C* and C*U controllers, we choose to use a C*U controller to adjust the short-period modal parameters of the aircraft to be the same as the C* controller, with , , and and the parameters are shown in Table 9.

Table 9.
The short-period and phugoid parameters of aircraft with a C*U controller.
According to the CAP calculation formula, , , and , which is shown in Figure 7. The short-period and phugoid modals of the open-loop aircraft are classified as level 3, and the aircraft where the C* and C*U control laws are employed are both classified as level 1.
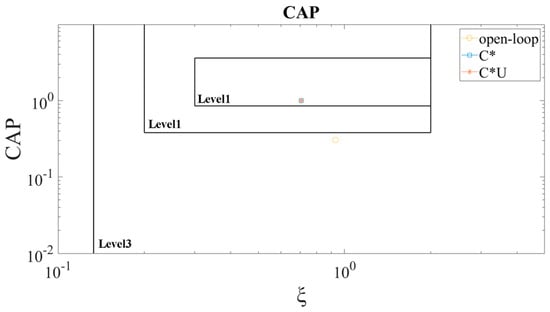
Figure 7.
CAP flight quality level of short-period modal.
3. Results and Discussion
In typical circumstances, civil aircraft that are equipped with FBW (Fly-By-Wire) technology typically activate longitudinal stability controllers during the approach phase. We simulated encounters with wind shear during this phase. In order to obtain the differences between control laws, the simulation distinguishes between the tailwind or headwind conditions and the intensities of wind fields. The figure of the wind shear model is in Figure 4. The change in wind direction only affects the horizontal wind field, and the vertical direction is a sinking wind field.
3.1. Transient Response of Aircraft with Different Controllers
To compare the transient responses of the aircraft with different controllers under wind shear conditions, the curves for the aircraft encountering wind shear over 200 s are shown in Figure 8 and Figure 9, with a wind speed of 10 knots as an example. The response curves for other wind speeds can be found in Figure A1, Figure A2 and Figure A3.
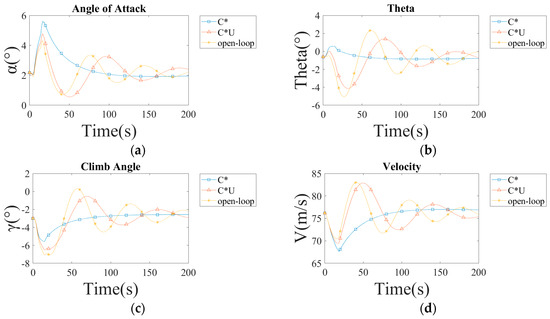
Figure 8.
The response of the aircraft with different controllers in a 10-knot tailwind shear: (a) the angle of attack response; (b) the angle of pitch; (c) the climb angle response; (d) the airspeed response.
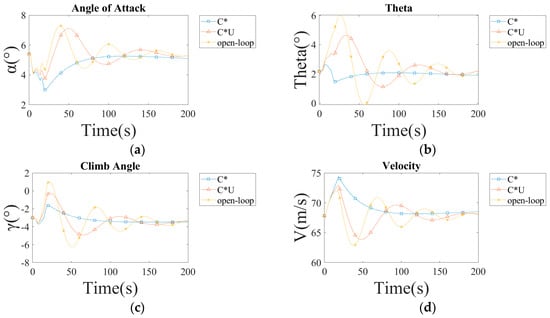
Figure 9.
The response of the aircraft with different controllers in a 10-knot headwind shear: (a) the angle of attack response; (b) the angle of pitch; (c) the climb angle response; (d) the airspeed response.
First, whether in tailwind or headwind conditions, the aircraft where the controllers are employed exhibits a significant stabilizing effect on the pitch angle, while the angle of attack and glide angle do not show such effects. Within the first 10 s of encountering wind shear, the changes in the angle of attack and glide angle of the aircraft with a C*/C*U controller are smaller in tailwind conditions compared to an aircraft without a controller, whereas in headwind conditions, the opposite is true. The reason for the result is the presence of a vertical downdraft. After encountering headwind shear, the aircraft with a C*/C*U controller experiences an increase in airspeed and load factor, prompting the controller to issue a push command. This command aligns with the effect of the downdraft, resulting in an increased initial response amplitude in headwind conditions.
Secondly, during the subsequent response process, the stabilizing effect of the C*U controller shows significant differences between headwind and tailwind conditions. The reason for this is the speed difference feedback loop of the C*U controller. For the aircraft, the two changes in the horizontal wind field can be viewed as inputs of two ramp functions, with the output oscillations potentially being in the same or opposite directions. In the simulation, the wind field settings result in opposite oscillation directions in tailwind conditions, causing the actual amplitudes to cancel each other out, thus showing a smaller response amplitude with the C*U controller. The opposite is true for headwind conditions.
For the aircraft where the C* control laws are employed, due to its significant attitude stability augmentation effect, speed changes caused by the wind field affect subsequent changes in speed and angle of attack. As a result, aircraft with a C* controller exhibit considerable changes in the angle of attack and speed during the response process after 10 s.
3.2. Steady-State Response of Aircraft with Different Controllers
After 500 s from the start of the simulation, both the aircraft without the controller and the aircraft with the C*U controller basically stabilize, and there is not much difference in their values. The steady-state values can be seen in Table 10 and Table 11.

Table 10.
State of aircraft in tailwind shear at the 500th second.

Table 11.
State of aircraft in headwind shear at the 500th second.
Among them, the values for the aircraft where the C* controller is employed represent the state at the 500th second. Because over time, the state of the aircraft equipped with the C* controller gradually diverges. This phenomenon can be explained by the model discussed earlier.
From Equation (17), the transfer function G(s) from the elevator deflection angle to C* can be obtained.
The controller model is
By connecting the two in series to establish a negative feedback loop, we obtain the feedback model, and then the and value is introduced. The zero–pole model of the final transfer function is shown in Equation (20).
Although there is a pair of zeros and poles that are nearly identical in magnitude, they are not exactly the same. Therefore, the entire system remains in a state of slow divergence, which is consistent with the simulation results
If the integral gain is set to zero, Equation (20) simplifies to the form of Equation (21).
The entire system tends to stabilize. Therefore, this unstable pole is introduced by the integrator in the C* feedback.
4. Conclusions
This paper simulates and analyzes the response of an aircraft equipped with C* and C*U controllers when encountering wind shear during the approach phase. The main focus of the study is on the differential responses of the C* and C*U proportional—integral controllers under different wind speeds and wind directions, leading to the following four findings:
For aircraft where the C* and C*U controllers are employed, their transient response can exhibit poor stability enhancement effects under tailwind and downdraft conditions.
For aircraft with a C*U controller, the stability enhancement effect varies with the length of the wind field or the time spent in the wind field.
Introducing integral control to the C* controller will cause the entire aircraft to exhibit slow divergence.
In general, both the C* and C*U controllers provide a certain degree of stability enhancement for the aircraft’s attitude.
Author Contributions
Conceptualization, L.S.; methodology, L.S.; software, Y.Y.; validation, Y.Y.; formal analysis, Y.Y.; investigation, Y.Y.; resources, Y.Y.; data curation, Y.Y.; writing—original draft preparation, Y.Y.; writing—review and editing, L.S.; visualization, Y.Y.; supervision, L.S.; project administration, L.S. All authors have read and agreed to the published version of the manuscript.
Funding
This research received no external funding.
Data Availability Statement
The results of the simulation result are available at https://github.com/yyf-424/C-and-C-U-simulation-result.git (accessed on 30 March 2024).
Acknowledgments
The authors would like to express their heartfelt gratitude to their advisor and senior colleagues for their unwavering support, guidance, and mentorship throughout this research journey.
Conflicts of Interest
The authors declare no conflicts of interest.
Appendix A


Figure A1.
The response of the aircraft with different controllers in a 15-knot tailwind shear: (a) the angle of attack response; (b) the angle of pitch; (c) the climb angle response; (d) the airspeed response.
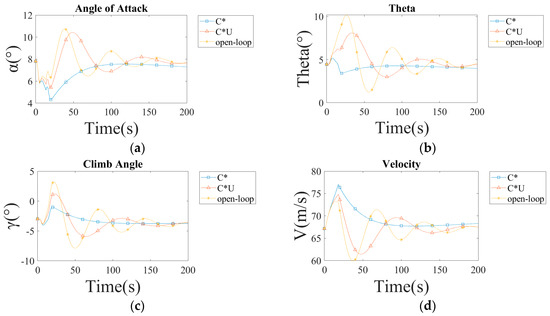
Figure A2.
The response of the aircraft with different controllers in a 15-knot headwind shear: (a) the angle of attack response; (b) the angle of pitch; (c) the climb angle response; (d) the airspeed response.
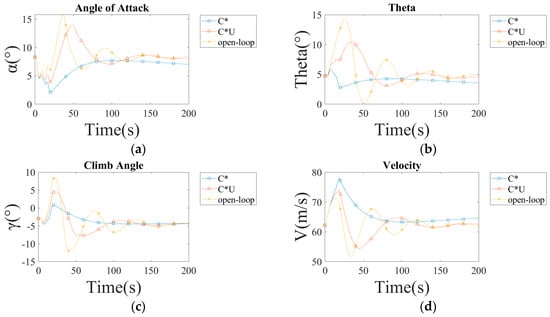
Figure A3.
The response of the aircraft with different controllers in a 25-knot headwind shear: (a) the angle of attack response; (b) the angle of pitch; (c) the climb angle response; (d) the airspeed response.
References
- Zhen, X.G.; Jun, F. Robust LPV modeling and control of aircraft flying through wind disturbance. Chin. J. Aeronaut. 2019, 32, 1588–1602. [Google Scholar]
- Chen, Y.H.; Pandey, S. Robust control strategy for take-off performance in a windshear. Optim. Control Appl. Methods 1989, 10, 65–79. [Google Scholar] [CrossRef]
- Leitmann, G.; Pandey, S. Aircraft control for flight in an uncertain environment: Takeoff in windshear. J. Optim. Theory Appl. 1991, 70, 25–55. [Google Scholar] [CrossRef]
- Leitmann, G.; Pandey, S.; Ryan, E. Adaptive control of aircraft in windshear. Int. J. Robust Nonlinear Control 1993, 3, 133–153. [Google Scholar] [CrossRef]
- Martynov, K.; Botkin, N.; Turova, V. Real-Time Control of Aircraft Take-Off in Windshear. Part I: Aircraft Model and Control Schemes. In Proceedings of the 25th Mediterranean Conference on Control and Automation (MED), Valletta, Malta, 3–6 July 2017. [Google Scholar]
- Martynov, K.; Botkin, N.; Turova, V. Real-Time Control of Aircraft Take-Off in Windshear. Part II: Simulations and Model Enhancement. In Proceedings of the 25th Mediterranean Conference on Control and Automation (MED), Valletta, Malta, 3–6 July 2017. [Google Scholar]
- Patsko, V.S.; Botkin, N.D.; Kein, V.M. Control of an aircraft landing in windshear. J. Optim. Theory Appl. 1994, 83, 237–267. [Google Scholar] [CrossRef]
- Botkin, N.D.; Turova, V.L. Application of Dynamic Programming Approach to Aircraft Take-Off in A Windshear. In Proceedings of the AIP Conference Proceedings, Kos, Greece, 19–25 September 2012. [Google Scholar]
- A Statistical Analysis of Commercial Aviation Accidents 1958–2023. Available online: https://accidentstats.airbus.com/wp-content/uploads/2024/02/20230873_A-Statistical-analysis-of-commercial-aviation-accidents-2024-version.pdf (accessed on 20 March 2024).
- Niedermeie, D.; Lambregts, A.A. Fly-by-Wire Augmented Manual Control-Basic Design Considerations. In Proceedings of the International Congress of the Aeronautical Sciences, Brisbane, Australia, 23–28 September 2012. [Google Scholar]
- Field, E. The Application of A C* Flight Control Law to Large Civil Transport Aircraft; College of Aeronautics, Cranfield Institute of Technology: Cranfield, UK, 1993; pp. 1–36. [Google Scholar]
- De Paula, J.V.D.; Paglione, P. Longitudinal Control Laws Based on C* Criterion. In Proceedings of the 19th International Congress of Mechanical Engineering, Brasilia, Brazil, 5–8 November 2007. [Google Scholar]
- Saussié, D.; Saydy, L.; Akhrif, O. Longitudinal flight control design with handling quality requirements. Aeronaut. J. 2006, 110, 627–637. [Google Scholar] [CrossRef]
- Marcos, A. Revisiting the Aircraft C Control Law: A Comparison between Classical and Structured H-Infinity Designs. In Proceedings of the 2017 IEEE Conference on Control Technology and Applications (CCTA), Maui, HI, USA, 27–30 August 2017. [Google Scholar]
- Singh, S.; Murthy, T.V.R. Neural network-based sensor fault accommodation in flight control system. J. Intell. Syst. 2013, 22, 317–333. [Google Scholar] [CrossRef]
- Singh, S.; Abhijit, M.; Pratham, B.S. Hardware Implementation of A Neural Network Based Robust Sensor Fault Accommodation System in Flight Control System. In Proceedings of the 2017 International Conference on Intelligent Computing and Control Systems (ICICCS), Madurai, India, 15–16 June 2017. [Google Scholar]
- Guilhem, P.; Jean-Marc, B. Application of robust antiwindup design to the longitudinal aircraft control to cover actuator loss. IFAC Proc. Vol. 2013, 46, 506–511. [Google Scholar] [CrossRef]
- Chatrenet, D. Les Qualités de vol des Avions de Transport Civil à Commandes de Vol Électriques. In Proceedings of the AGARD Conference Proceedings 560, Turin, Italy, 9–13 May 1994. [Google Scholar]
- Miele, A.; Wang, T. Optimal Abort Landing Trajectories in the Presence of Windshear. In Proceedings of the AIAA 26th Aerospace Sciences Meeting, Munich, Germany, 27–31 July 1987. [Google Scholar]
- MIL-STD-1797A; Military Standard-Flying Qualities of Piloted Aircraft. US Air Force Department: Washington, DC, USA, 1990.
Disclaimer/Publisher’s Note: The statements, opinions and data contained in all publications are solely those of the individual author(s) and contributor(s) and not of MDPI and/or the editor(s). MDPI and/or the editor(s) disclaim responsibility for any injury to people or property resulting from any ideas, methods, instructions or products referred to in the content. |
© 2024 by the authors. Licensee MDPI, Basel, Switzerland. This article is an open access article distributed under the terms and conditions of the Creative Commons Attribution (CC BY) license (https://creativecommons.org/licenses/by/4.0/).