Abstract
When designing situational maps, selecting distinct and visually comfortable movement speeds for dynamic elements is an ongoing challenge for designers. This study addresses this issue by conducting two experiments to measure the human eye’s ability to discern moving speeds on a screen and examines how symbol movement speeds within situational maps affect users’ subjective experiences, task performance, and visual comfort. The first experiment measured participants’ speed discrimination capabilities for Landolt Ring of varying sizes moving at 0–256°/s, yielding speed discrimination thresholds of 7–23% and a sensitive velocity range of 1–64°/s. The second experiment evaluated observers’ visual perceptions of moving elements within a cognitive task across the same range of 1–64°/s, identifying three significant benchmarks—8°/s, 16°/s, and 32°/s. These can be utilized to categorize slow-, moderate-, and fast-moving symbols in situational maps. The findings can aid in designing human–machine interface environments with improved viewer experience and visual comfort for both Air Traffic Control interfaces and situational maps.
1. Introduction
As a method of information visualization, dynamic situational maps can present events, scenarios, equipment, and personnel information within a single system; therefore, they have often been used to assist in the decision-making of system administrators. In recent years, with the advancement of sensing and display technologies, dynamic situational maps have been applied in numerous engineering fields for the real-time visualization of system statuses. For example, they have been used in aerospace scenarios for air traffic management to assist ATC operators in guiding and planning flight routes [1,2]; they have also been used by urban managers to monitor road incidents [3]; they have been commonly applied within an area to monitor network security information, such as various attacks, defenses, and intrusion events [4]; as well as utilized for the real-time monitoring of the operational status of production and cooling equipment in the control room of nuclear power plants [5]. Human monitoring of these dynamic situational displays has allowed personnel to promptly understand, analyze, and predict the outcomes of current situations and trends. Especially in the field of air traffic management, by observing situational maps, operators could enhance their overall real-time perception of events within the traffic system and increase situational awareness, thereby allowing them to make efficient and accurate decisions and take prompt action. Moreover, to avoid decision biases and cognition errors caused by situational interruptions, most monitoring tasks require operators to continuously observe dynamic images over extended periods. However, this demand presents two significant challenges.
Firstly, when designing situational maps, in order to facilitate the process by which observers distinguish moving objects through speed characteristics, different types of elements are usually assigned distinguishable speeds. However, there has been a lack of strict criteria for setting these speeds that can be perceptibly recognized by observers. Historically, such speed definitions have often been subjectively determined by designers. To address this issue, the current study incorporated the concept of Just Noticeable Difference in Speed (JNDS) from psychophysics—commonly used to assess an observer’s ability to discern differences in speed [6,7,8,9,10]. By establishing velocities according to the observer’s JNDS thresholds within the situational map, it could be ensured that sequences of movement can be effectively differentiated.
Previous research has reported measures of JNDS under varying experimental conditions [11,12,13]. Nonetheless, due to the specialized display mediums and imagery used in these studies, their conclusions could not be directly applied. Additionally, factors such as image clarity, brightness contrast ratio, texture richness and complexity, size, imaging techniques, and screen resolution have all been shown to impact the measurements of JNDS. Therefore, it was necessary to reassess the observer’s JNDS for moving objects under conventional human–computer interface environments. This would guide designers in selecting speeds for different moving elements within the interface that can be well distinguished. Additionally, it must be emphasized that considering the moving elements on situational maps are often presented in various sizes, in order to extend the applicability of experimental results, stimulus size was controlled and considered as an independent variable in this part of the experiment.
Secondly, prolonged viewing of dynamic images in a screen display environment has been proven to have negative effects on visual experience, such as decreased vision, dry eyes, and other ocular surface symptoms [14,15], as well as dizziness, nausea, fatigue and other extraocular symptoms [16,17]. Potential factors causing this phenomenon include the size of dynamic images, hardware parameters such as screen resolution [18,19], image and environmental brightness [20], image motion forms [21,22], etc. However, what plays a key role among them is the absolute value of speed. For instance, moving icons at speeds exceeding 32°/s can cause motion blur effects that lead to reduced dynamic visual acuity and cognitive errors, bringing about significant visual fatigue [23,24]; rotational graphics at speeds of 720°/s may induce the wagon wheel effect, leading to failure in speed discrimination [25]; and watching radial or rotating speed patterns on screens can cause noticeable dizzy spells in viewers [22,26]. More importantly, neuroscience research has also revealed differences in processing mechanisms for fast- and slow-moving stimuli within the visual system [27].
In light of these studies, it can be concluded that both slower and faster velocities are detrimental for prolonged observational tasks in a screen environment. Therefore, the secondary objective of this study was aimed at determining an optimal presentation velocity for the dynamic elements within situational maps—specifically at a level which could yield a better visual experience for observers during observation tasks. In this current research, evaluation of the users’ visual experiences was conducted by monitoring each user’s subjective perception of apparent velocity and visual comfort during the tasks. The rating of apparent speed was realized through a scale, which has often been used to quantify psychophysical quantities related to humans’ subjective perception, such as acoustic scales evaluating frequency or loudness [28,29], and VAS scales for assessing levels of pain [30]. Visual comfort was assessed using subjective questionnaires.
In summary, this study revolved around the research objective of selecting appropriate and distinguishable speeds for moving elements in situational maps and thus established two experiments. In Experiment I, observers’ speed discrimination thresholds for moving images of different sizes were measured, and on this basis, a series of distinguishable speeds with sufficient coverage was determined. In Experiment II, in an observation task oriented towards situational awareness maps, measurements were taken for apparent speed and visual comfort level using the speed series obtained from Experiment I; as a result, reasonable speed design ranges applicable to interface situational maps were identified. The conclusions of this experiment can be directly applied to the design of dynamic situational maps within the field of human–computer interfaces.
- Experiment I Measurement of Just Noticeable Difference in Speed
2. Method of Experiment I
2.1. Design
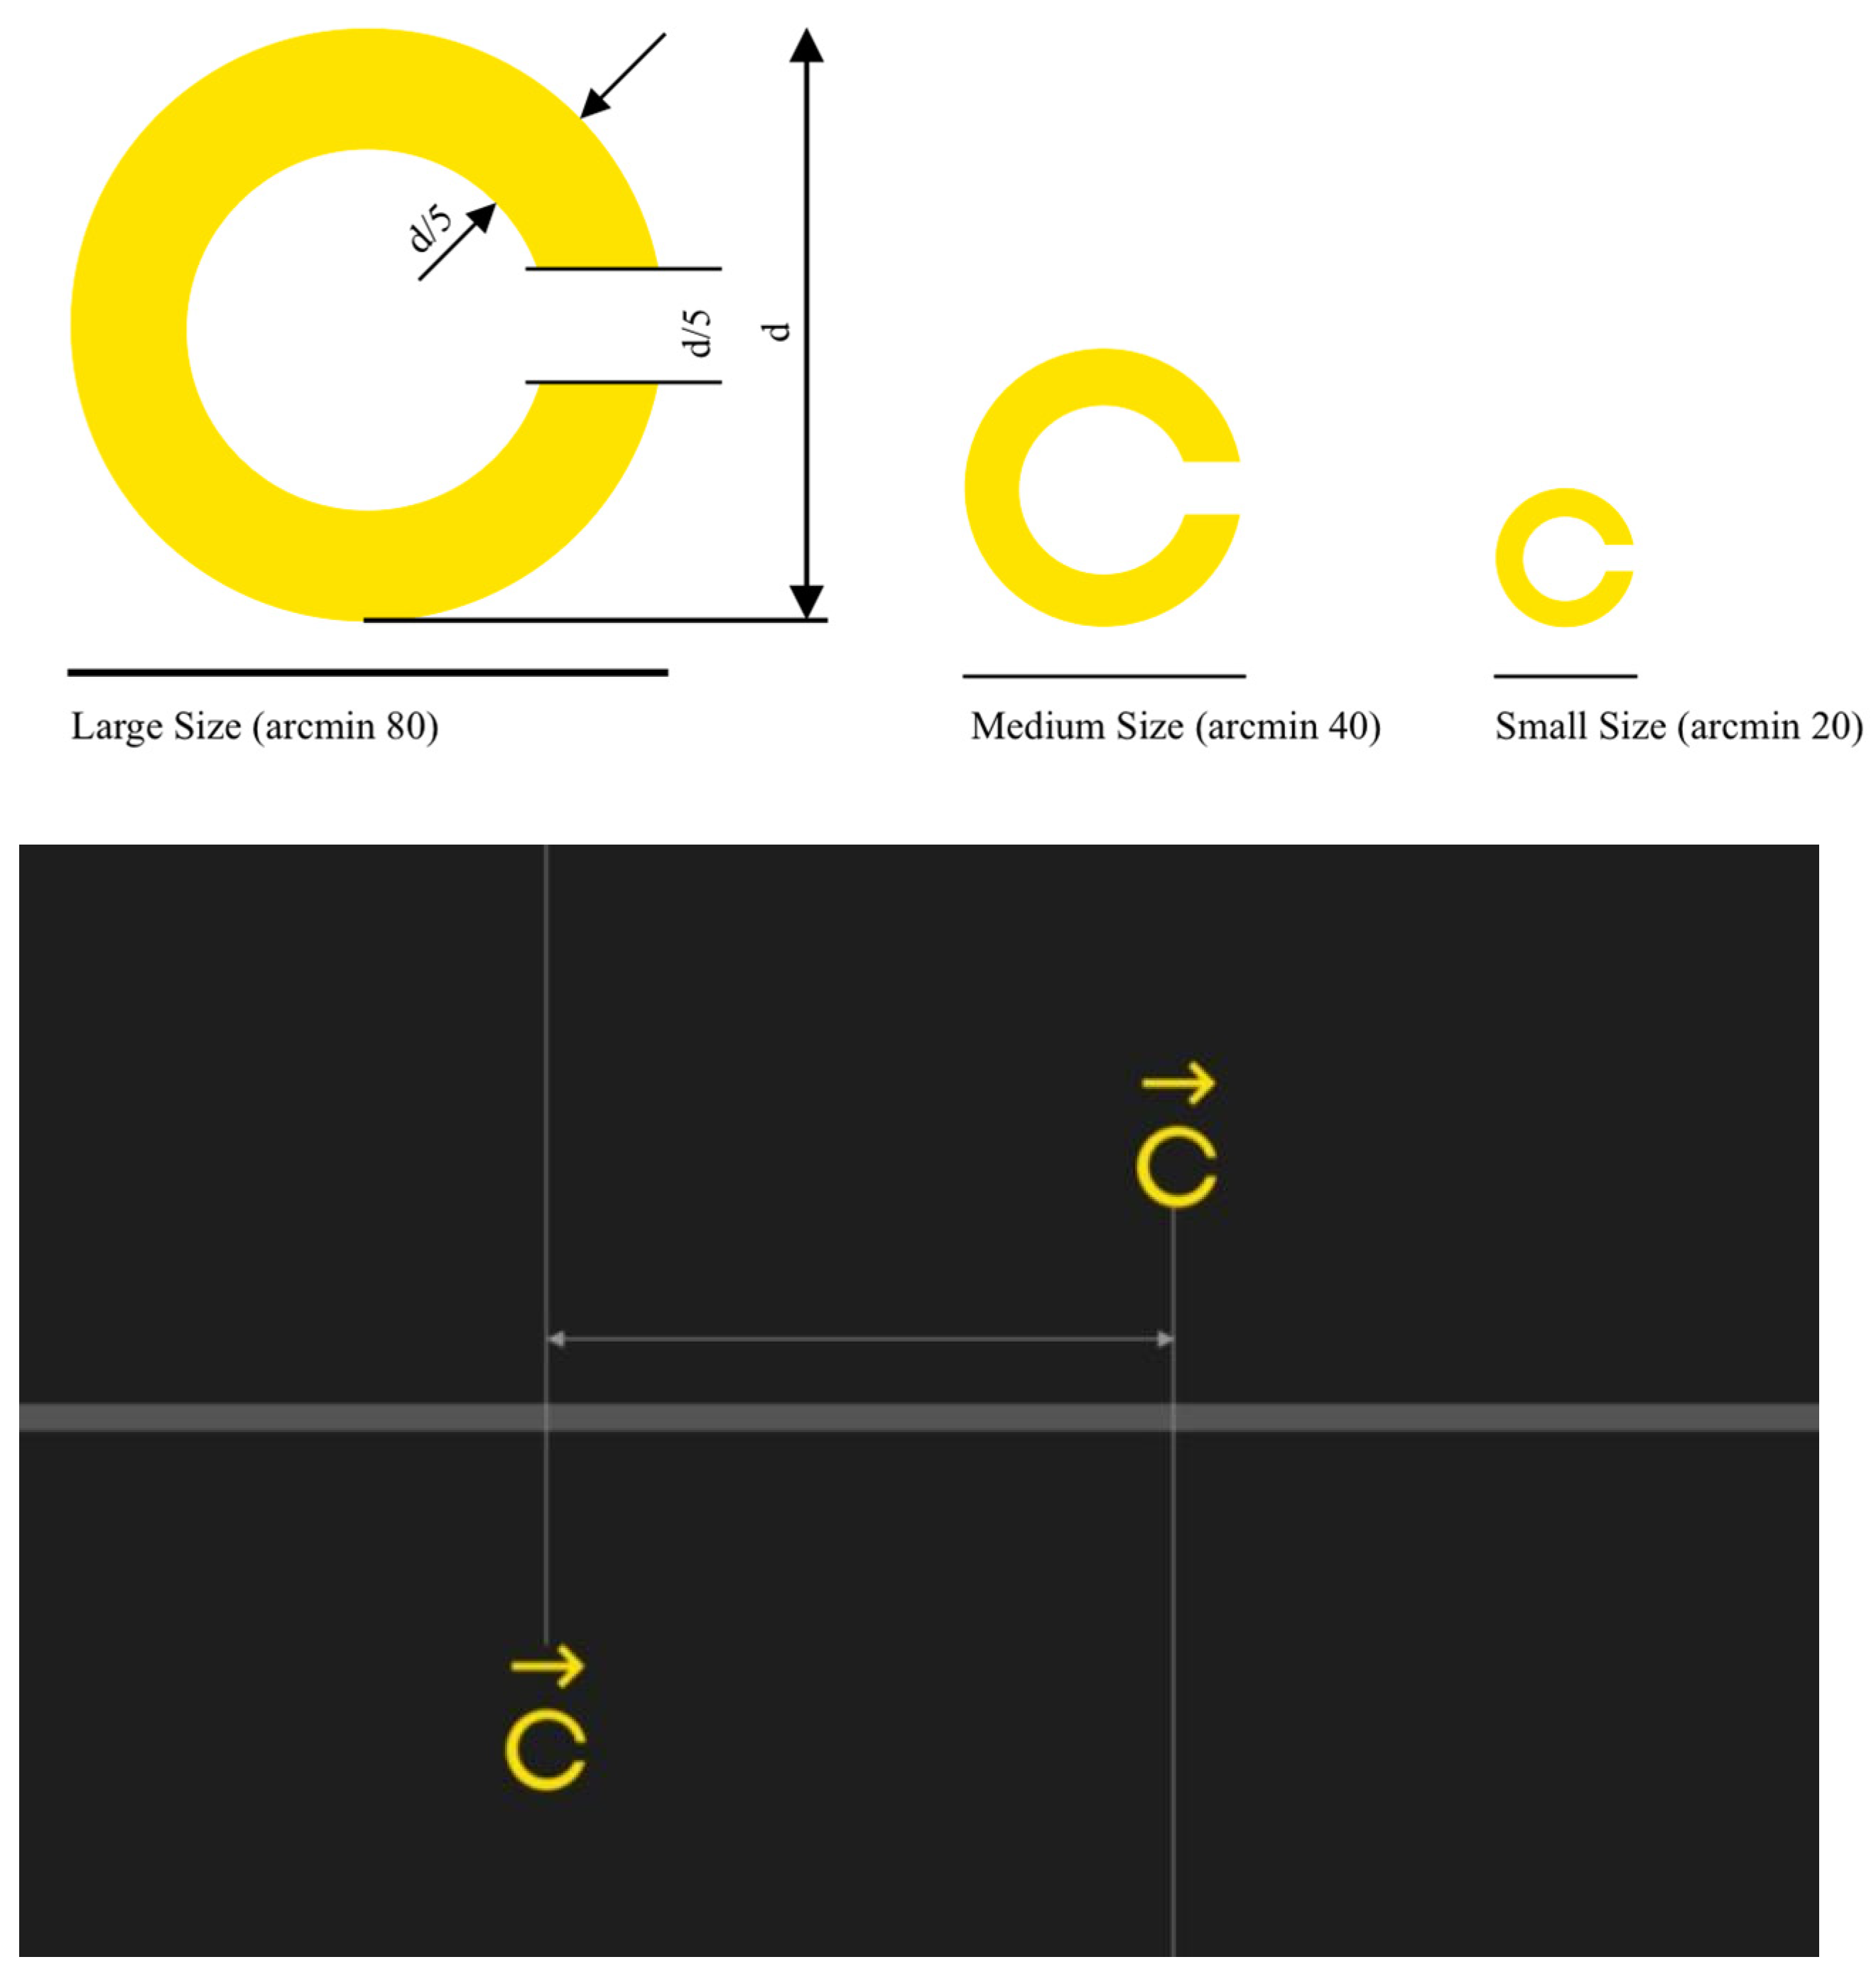
The experiment stimuli consisted of Landolt Rings with outer diameters of 20, 40, and 80 arcmin. These sizes were chosen based on previous research recommendations for moving objects in maps or interfaces [31]. A Landolt Ring is commonly used in dynamic vision studies [23,32] and adheres to ISO 8596 standards for their inner-to-outer ring ratio. Figure 1 provides specific details, showing the image background as pure black and the target object as uniformly yellow. This combination has been proven to optimize visual performance [31,33]. To ensure legibility in the interface, the contrast between the object and the background was set at 8.6, surpassing the requirement from the previous studies for a contrast ratio greater than 7:1 [34,35]. The screen brightness was adjusted to 150 cd/m2 without any reflections or glare present in an environment, with lighting measuring at 300 lux. The speed range for stimuli on the interface was from 0 to 256°/s. The available speeds were 0.25, 1, 4, 8, 16, 32, 48, 64, 88, 128 and 256°/s. This range covered most of the scenarios with moving objects in the situational map.
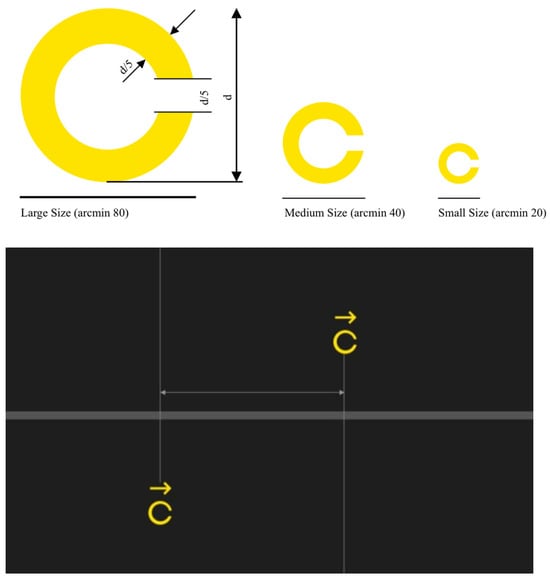
Figure 1.
Design of stimuli and description of their movement on the screen.
2.2. Participant
In this experiment, 10 graduate students from the Human–Computer Interaction Institute of Southeast University were recruited as participants (7 males and 3 females). All participants were between 23 and 31 years old (M = 27.2, SD = 0.8). The participants were professionals in human–machine interfaces with experience in both interface and dynamic image design. Their vision was either normal or corrected to normal. None of the participants had a history of mental illness or eye-related diseases. Prior to participating, all the participants read and signed a notice acknowledging their understanding of the experiment’s details. The research protocol received approval from the Ethics Review Committee at the Institute of Human–Computer Interaction, Southeast University, with the reference number 20230405002.
2.3. Procedure
The experiment was conducted using the 2-FAC (Two-Alternative Forced Choice) paradigm to measure the participants’ JNDS, and the values were expressed in Weber fractions. In the 2-FAC paradigm, participants were presented with two stimuli at a time and asked to choose which one appeared to be moving faster. This measurement method was based on previous studies [6,12]. Participants were required to select the one they perceived to be faster out of two moving stimuli presented on the screen, as shown in Figure 1. One of the stimuli was a standard stimulus. At the same time, the other was a comparison stimulus with seven equally spaced speeds that had been selected within a small range around the average value of the standard stimulus. The maximum intensity of the selected stimuli had a probability of being perceived as higher than 95%, while the minimum intensity had a probability of being perceived as not exceeding 5%. Each comparison stimulus was presented 20 times, resulting in 140 trials per standard stimulus (20 × 7). Depending on the level of the standard stimulus, the experiment was divided into 11 blocks, and the blocks were presented in a completely randomized manner. After each block, participants were required to take at least a 5 min break.
Practice sessions were set before the formal experiment, and each participant was required to practice 20 trials until they were proficient in the experimental procedure. The number of practice sessions could be increased based on the participant’s request. In the formal experiment, a fixation point appeared at the center of the screen. The investigation commenced by pressing any key. Subsequently, two stimuli emerged on the screen, moving in unison from left to right or right to left with seamless transitions. To prevent participants from deducing speed based on the distance travelled across the screen, both stimuli were initially positioned at different vertical levels, and their presentation times varied randomly between 2500 and 3500 ms. Participants indicated their perception of which stimulus was moving faster by pressing “A” for the upper stimulus or “L” for the lower stimulus. The program did not provide feedback regarding whether the answer was correct or incorrect.
2.4. Apparatus and Environment
The experimental program was developed using C# and executed on the Unity 2022 platform [36]. The stimulating images were presented in the form of vector graphics, with the frame rate set to 60 fps. The experiment was run on an HP workstation with a CPU frequency of 2.4 GHz, and the software system environment of the workstation was Windows 10. The display was 27 inches, with a screen resolution of 1920 × 1080, and a refresh rate of 120 Hz. The screen brightness was adjustable to a maximum of 300 cd/m2. Participants were seated on a height-adjustable seat 510 mm away from the screen, ensuring that the eye was centered on the screen. The screen’s brightness was measured directly by a luminance meter placed at the participant’s eye level and repeated three times, with the average value recorded as the final screen brightness. The brightness measurement manufacturer was Xinbao Keyi, model SM208.
3. Results of Experiment I
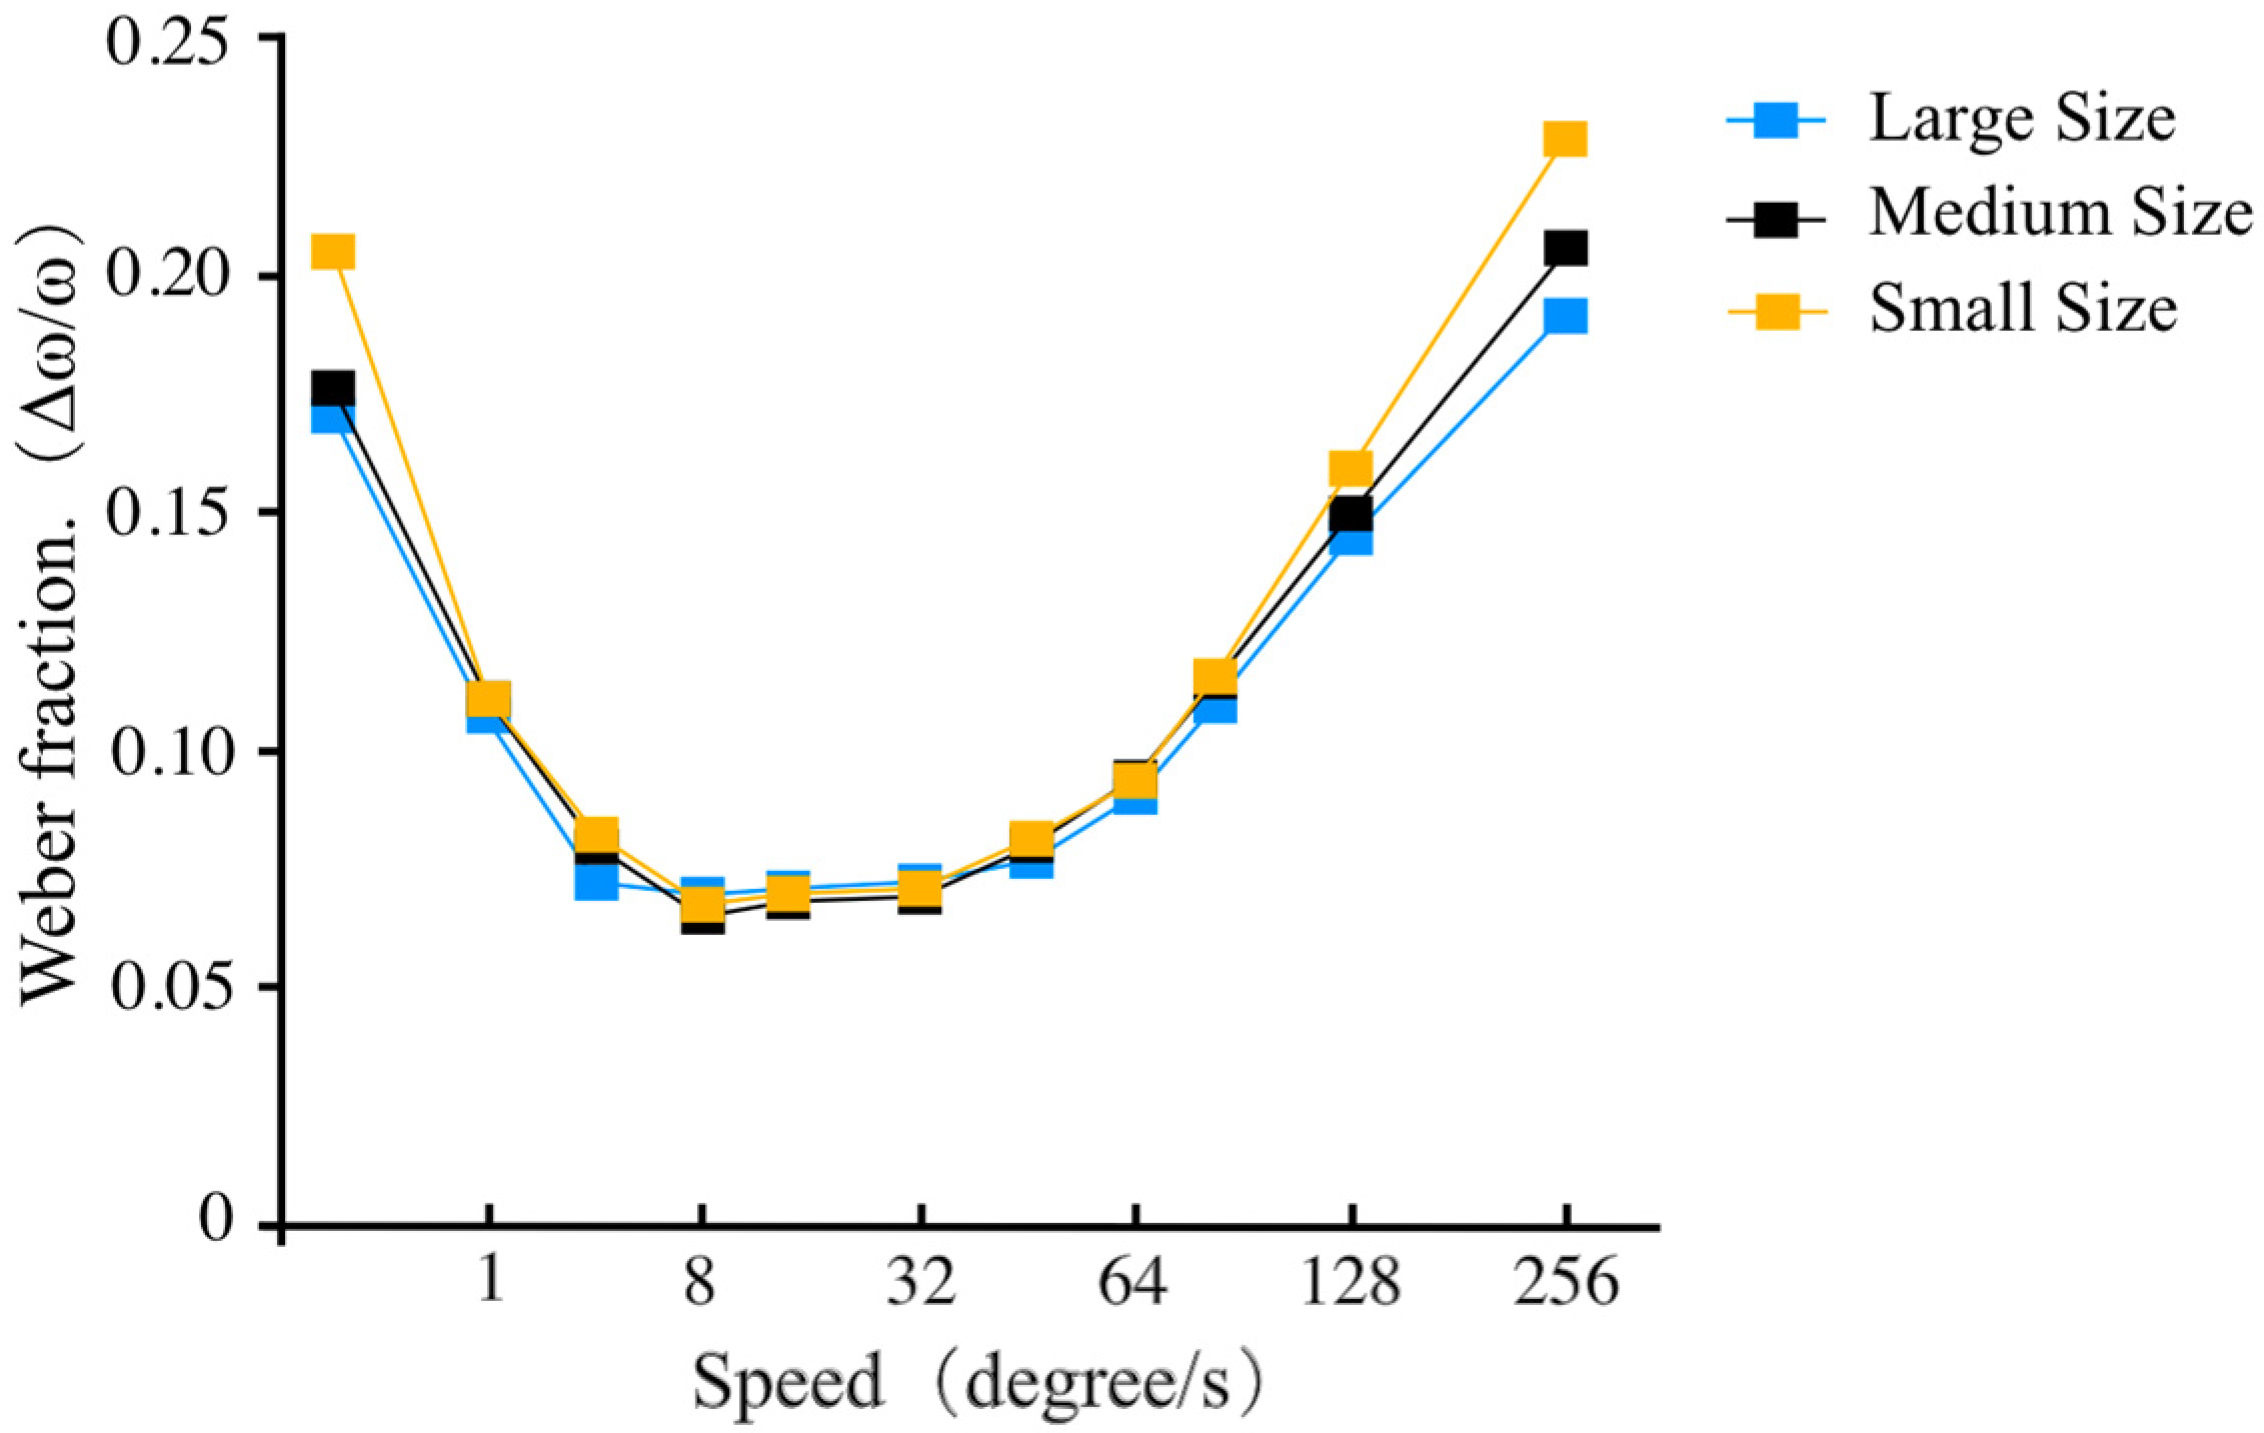
A total of 10 valid datasets were collected in the experiment. The linear interpolation method was used to calculate the value of JNDS, which was expressed using Weber fractions [37]. The average value of JNDS for different stimulus sizes at various speeds was calculated for each of the 10 participants, as shown in Table 1. Additionally, Figure 2 presents a line graph illustrating the relationship between image speed and JNDS. Upon analyzing the trend of JNDS, it could be observed that as the speed increased from 0.25 to 256°/s, there was an initial decrease in JNDS values until a minimum average value of 6.87% was achieved at a speed of 8°/s. However, when the speed continued to increase to 256°/s, JNDS would rise and reached its maximum value of 20.9%. Regarding the sensitivity to changes in speed, JNDS remained relatively high when speed was greater than 1 degree/s but less than 64°/s. This suggests that observers have stronger sensitivity to the changes in movement speed within this range.

Table 1.
Descriptive statistical results of JNDS.
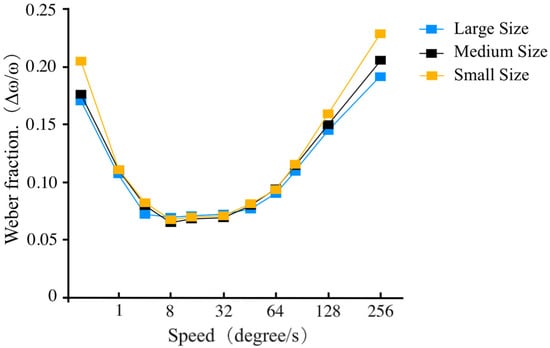
Figure 2.
The trend of JNDS changing with movement speed.
The ANOVA (Analysis of Variance) analysis of the above statistics indicated a significant main effect of speed on the JNDS (F = 108.561, p < 0.05). However, there was no significant main effect of size on the speed discrimination threshold (F = 0.975, p = 0.193). An interaction between the two factors was observed (F = 6.726, p < 0.05). Further analysis of this interaction revealed that at a speed of 128 degrees/s, the JNDS for large-sized stimuli (M = 18.69, SD = 8.96) was significantly lower than medium-sized (M = 19.203, SD = 7.69) and small-sized stimuli (M = 20.35, SD = 7.84), with all p-values < 0.001. Similarly, at a speed of 256°/s, the JNDS for large-sized stimuli (M = 49.41, SD = 16.13) was significantly lower than medium-sized (M = 52.74, SD = 17.58) and small-sized stimuli (M = 58.37, SD = 18.60), with all p-values < 0.001. This implied that when the speed was relatively fast, the stimuli size had a moderating effect on JNDS results.
4. Discussion of Experiment I
Experiment I measured the JNDS of observers for different sizes of the Landolt Ring with the movement speed in the range of 0.25–256°/s and obtained results in the field of 7–23%, which was higher than the previous outcomes of 5–6% [6,12], and closer to the findings of the Orban’s study [7]. The general trend of the JNDS within this velocity range was consistent with previous studies [7,11]. The differences in results could be attributed to various factors, including the use of different display devices, stimulus types, stimulus contrast, and ambient brightness in this experiment. Ultimately, these factors affected the participants’ ability to observe just noticeable differences (JNDS) by influencing the clarity of stimuli on the retina [24,38].
Overall, our findings demonstrated that observers’ performance in the JNDS task for moving stimuli was significantly influenced by speed. As speed increased within the measurement range, participants initially improved their ability to discriminate speed, followed by a weakening trend. The interval where participants performed well in speed discrimination ranged from 1 degree per second to 64 degrees per second. The results verify that the visual system had a variability in the processing of fast and slow speeds due to changes occurring in the neural pathways involved in speed computation at low and high speeds [24,27]. Size was also found to play a role in modulating speed discrimination, confirming previous research conclusions [39,40]. Particularly at high speeds, participants exhibited better discriminative abilities for larger stimuli than smaller ones. This could be attributed to the motion blur effect generated on the screen and the resource-limited theory of visual cognition. In the research environment of this experiment, the yellow stimuli that moved across the screen had a limited size, and a motion blur effect occurred whenever the speed was too high [32,41]; this increased the difficulty in perceiving movement speed for participants, especially when dealing with small sizes. Moreover, for small-sized stimuli moving at fast speeds, participants may have needed additional saccades to track them during motion, which consumes more cognitive resources. Conversely, larger stimuli were more noticeable and therefore captured the attention more effortlessly [42]; this allowed participants to devote extra cognitive resources to perceiving speed, leading to improved task performance.
Through the study of Experiment I, this research determined that the velocity discrimination threshold of observers for moving stimuli on the screen with a speed of 0–256°/s is 7–23%. At the same time, based on the JNDS value curves of different sized objects within the speed ranges shown in Figure 2, a sensitive range for speed perception at 1–64°/s could be determined. This provides a reference for designers to select significantly distinguishable sequences of speeds for situational maps.
Furthermore, considering the commonly used speed ranges in situational maps, Experiment II selected ten distinct levels within a speed range of 1–64°/s based on Experiment I. The observers’ visual experiences at different speed levels while performing the monitoring tasks were evaluated using psychometric scales and visual comfort ratings to assess which level of speed could offer observers the best visual experience in situational maps.
- Experiment II Evaluating and Selecting the Optimal Speed for Dynamic Symbols in Cognition Task
5. Method of Experiment II
5.1. Design
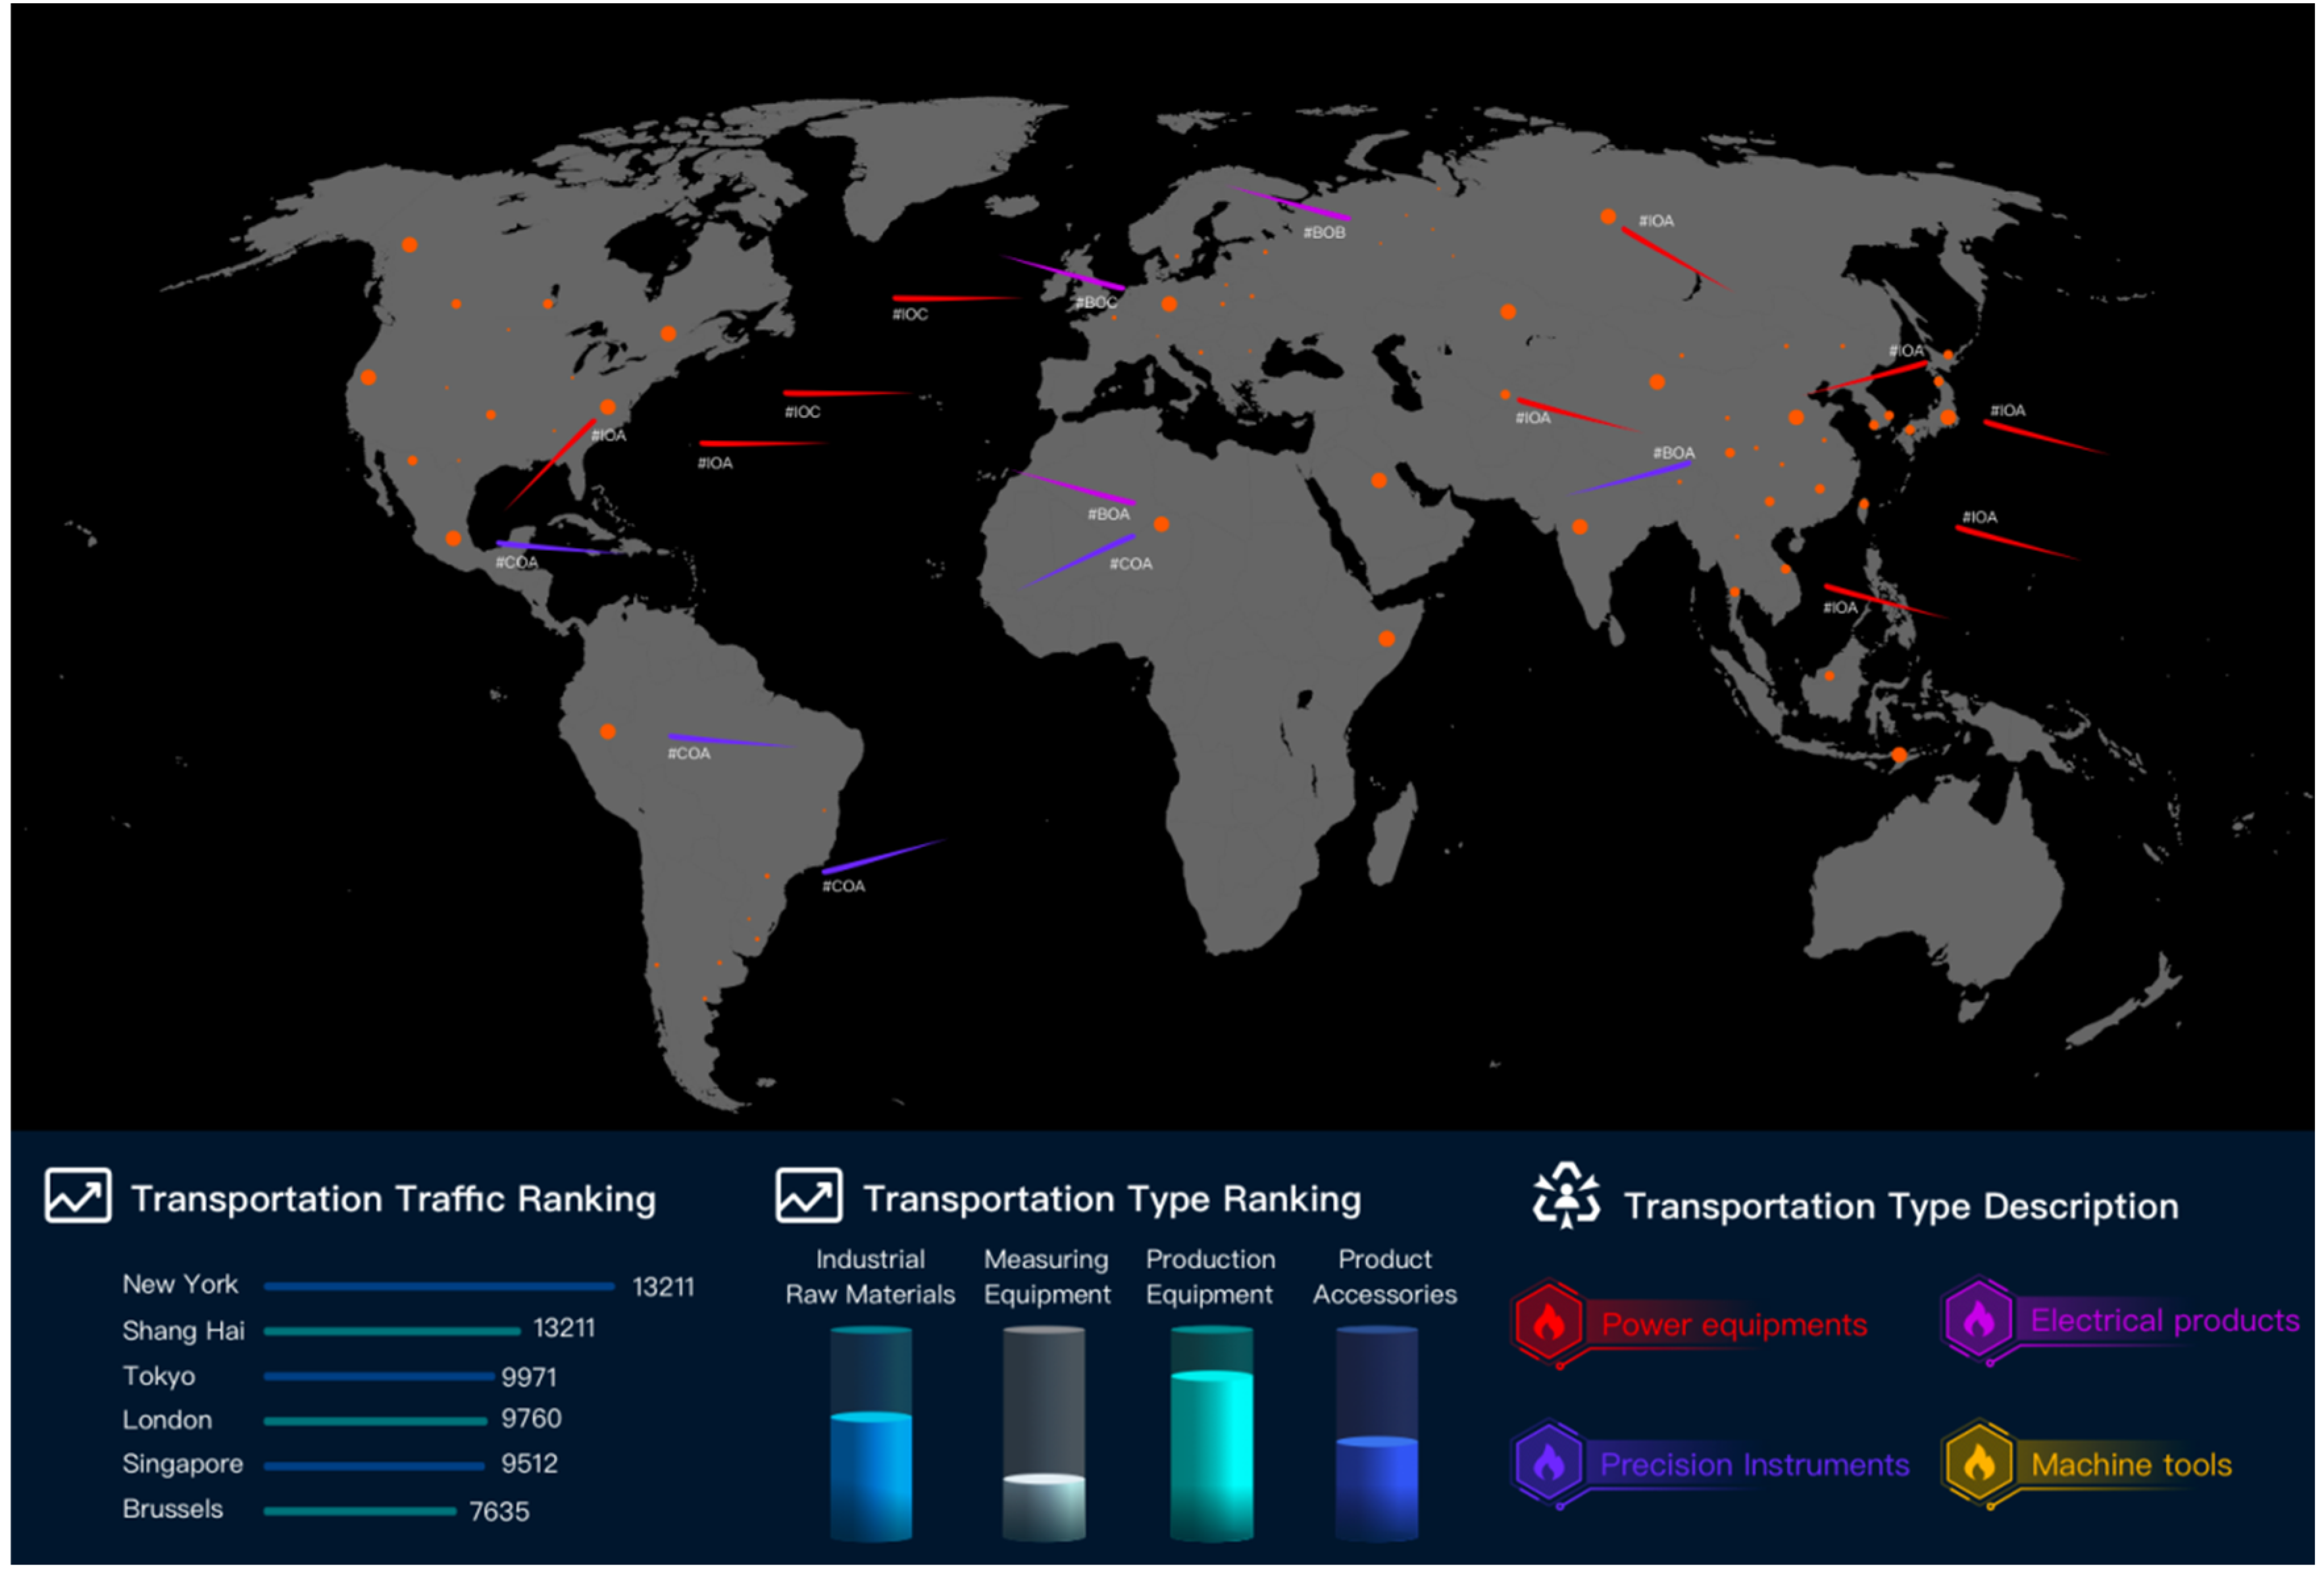
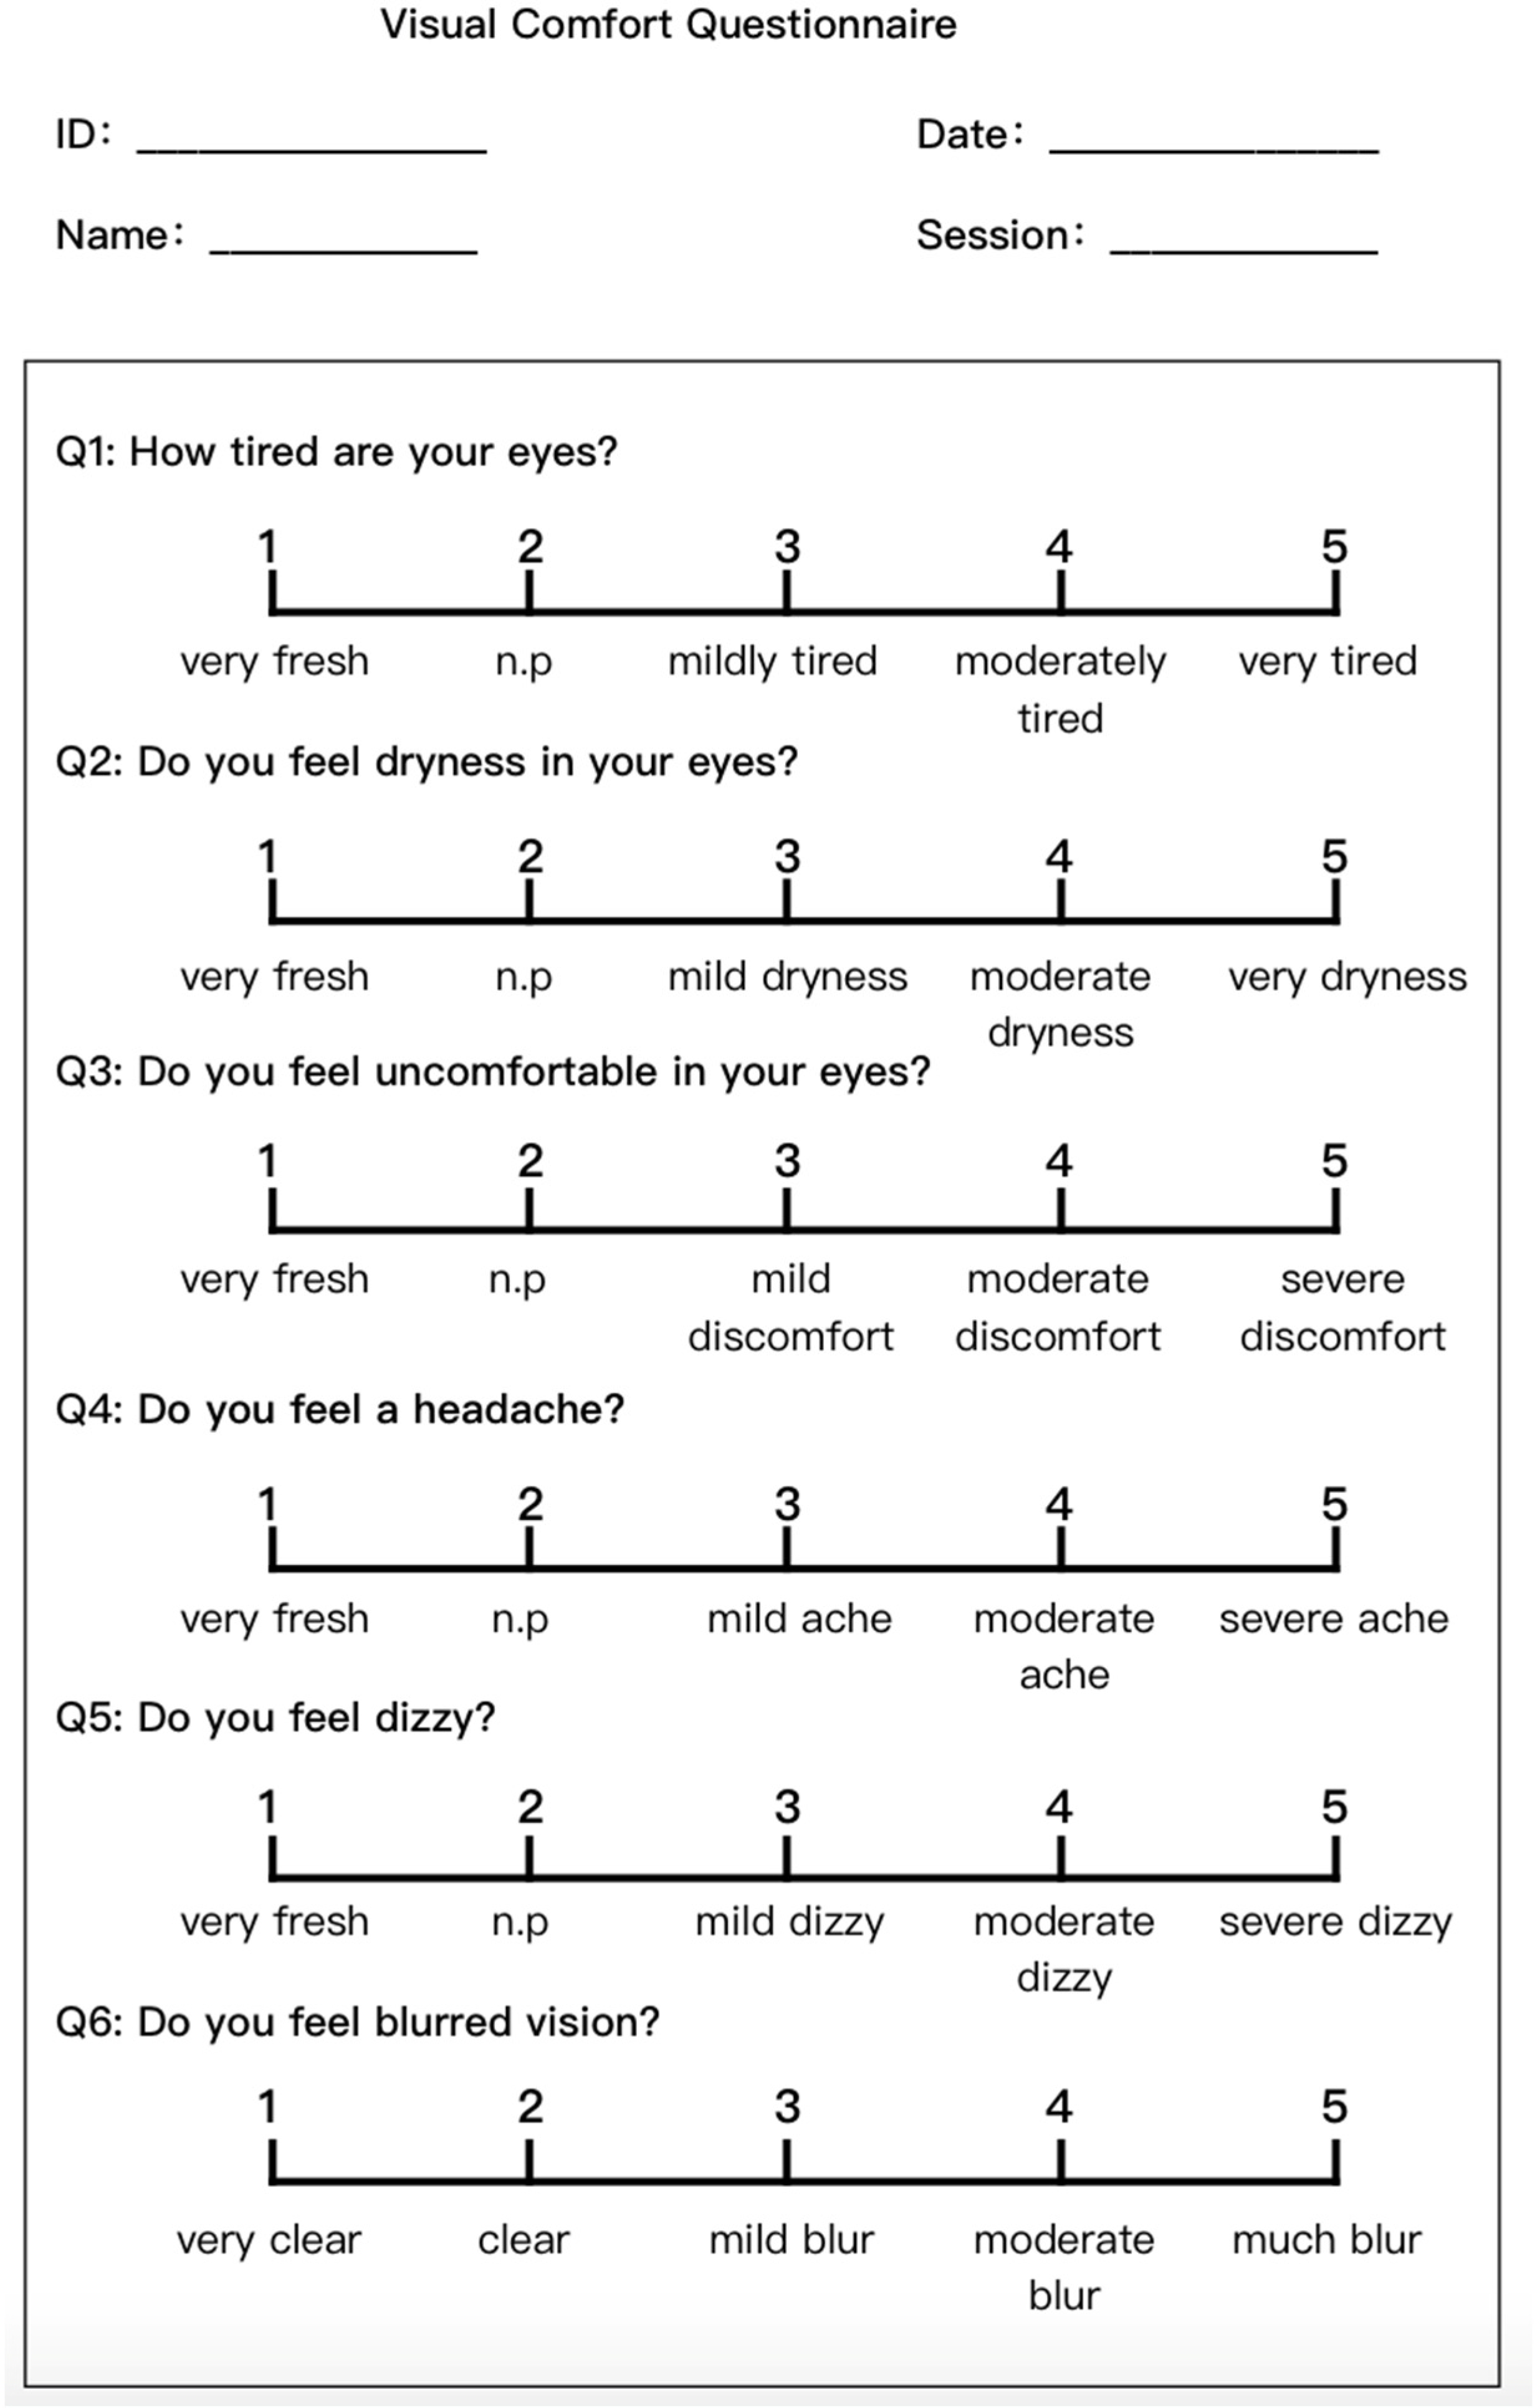
Experiment II involved the design of a situation map as shown in Figure 3. This situation map was used for monitoring the air transportation flow and types within a region, in which four dynamic strips of different colors represent four types of transported products; each strip was equipped with an identification code; The red dots on the map represent different cities. The width of the narrow edge of the strips was set to 40 arcmin. Based on the conclusions from Experiment I, ten significantly distinguishable speeds were selected for the stimulus movement—1, 2, 4, 8, 12, 16, 24, 32, 48, 64°/s. Multiple moving bar stimuli simultaneously moved from one city to another city on the map and were repeatedly displayed during an observation task. During the experiment, observers needed to follow task instructions to locate the city reached by the moving striped object where the target identification code was situated. The visual experience of movement speed was evaluated through apparent speed rating and a visual comfort questionnaire. The rating for apparent speed was conducted using a scoring scale with a range of 5, where the minimum scale value was 0.1. The assessment of visual comfort was based on a subjective questionnaire using a five-point Likert scale, containing 6 questions, as shown in Figure 4. Among these, issues related to visual fatigue reference questionnaires used in previous studies for assessing visual fatigue and Dry Eye Questionnaire (DEQ) [43]; parts of the motion-sickness-related questions were derived from the Simulator Sickness Questionnaire (SSQ) [44]. To ensure that observers participated earnestly in the experiment, their task response accuracy was also monitored.
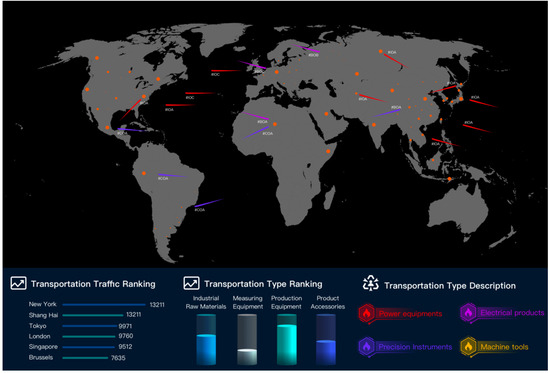
Figure 3.
Experimental material descriptions.
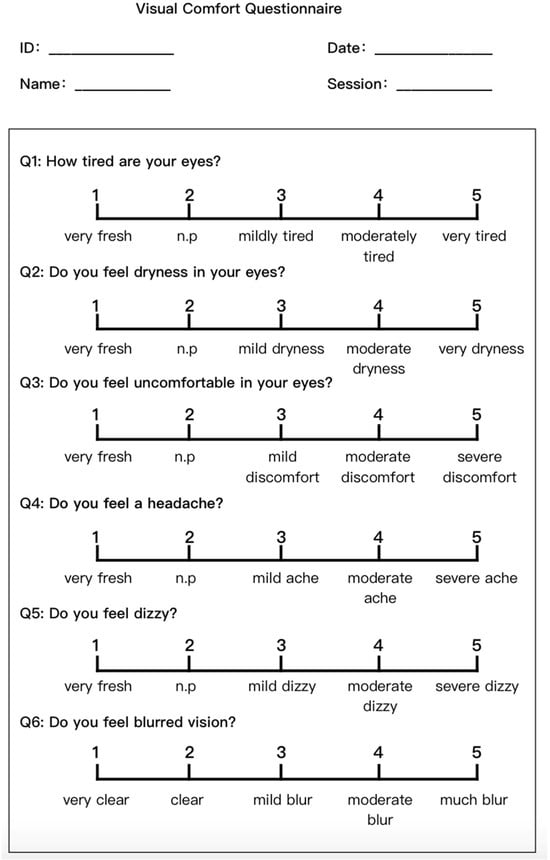
Figure 4.
Questionnaire for assessing visual comfort.
5.2. Participants
In Experiment II, 16 Master’s and Doctoral students from the Human–Computer Interaction Institute of Southeast University were recruited as participants (8 males and 8 females). They were all 23–33 years old (M = 25.6, SD = 0.8). The participants were professionals in human–machine interface with experience in both interface and dynamic image design. The eligibility assessment of the participants followed the same procedure as Experiment I. The research protocol was approved by the Ethics Review Committee of the Institute of Human–Computer Interaction, Southeast University, with the reference number 202403021220.
5.3. Procedure
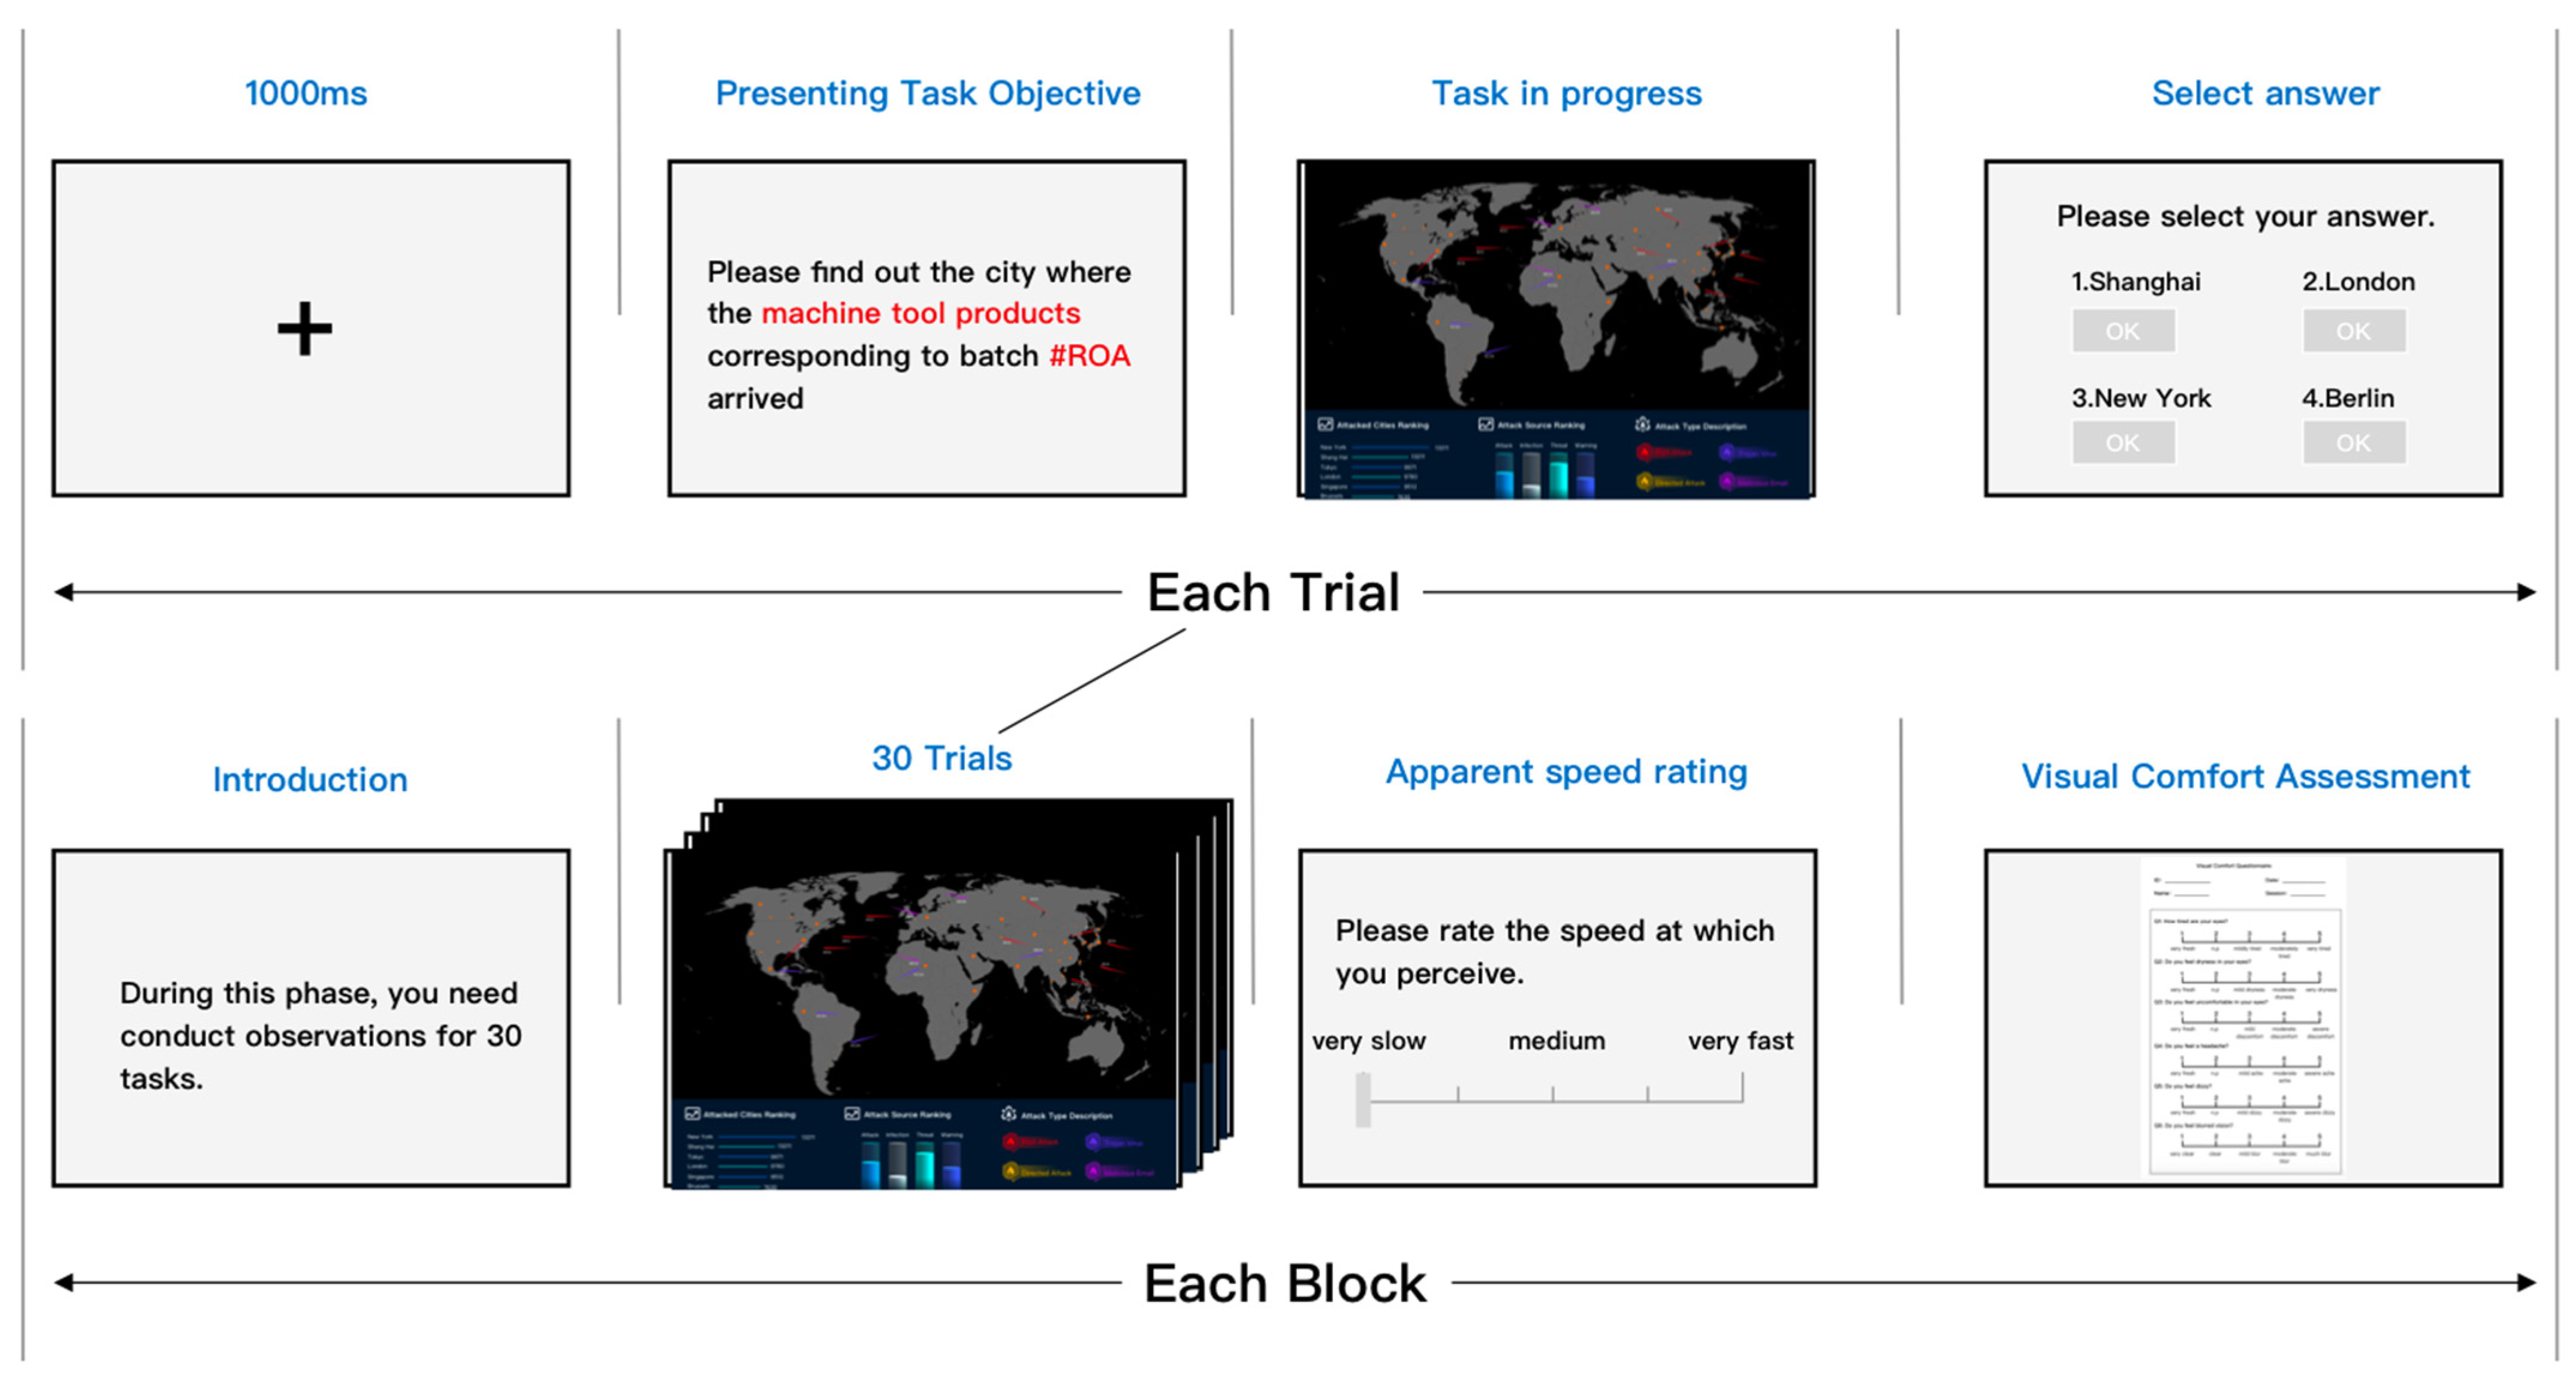
Firstly, participants were required to learn the process of the experiment, operational methods, and precautions. Before the formal experiment started, a practice section was set up where participants needed to complete 5 trials of practice. They could voluntarily increase the number of practice attempts until they verbally confirmed their understanding of the experimental operational methods. The process for Trial and Block is shown in Figure 5. During the task phase, observers were required to search the corresponding code and the target city reached by the strip object according to task prompts and memorize the information. Once the target was confirmed, observers could press any key to enter the answer page. The dynamic image playback process lasted for up to 60 s; upon exceeding 60 s, the program would automatically switch to the answer page.
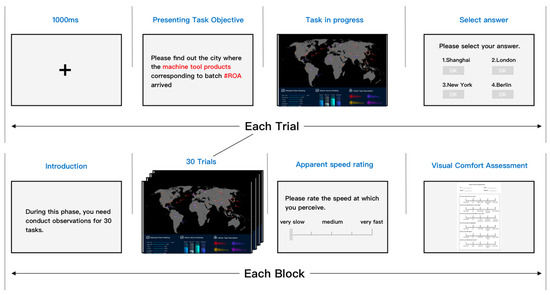
Figure 5.
Explanation of the experimental procedure.
Based on speed conditions settings, the experiment included a total of 10 blocks; each block comprised 30 trial observation tasks, with a single trial consisting of target instruction, target search, and three answering segments; after each block ended, an evaluation of apparent speed and visual comfort level was required. The presentation sequence of the blocks used a completely random method, and subjects were arranged to rest after completing one block. Each subject was required to complete 10 × 30 = 300 trials.
5.4. Apparatus and Environment
The experimental program was run on E-prime3.0 [45]. The video material of the dynamic map was used within the video module of E-prime 3.0 in bitmap format, with a frame rate of 30 fps. The experiment was conducted on an HP workstation with a CPU frequency of 2.4 GHz, and the software system environment of the workstation was Windows 10. The monitor size was 27 inches, screen resolution was 1920 × 1080, and refresh rate was 120 Hz; other conditions were consistent with Experiment I.
6. Results of Experiment II
The experiment collected a total of 16 sets of valid data, resulting in 4800 responses and 160 apparent speed rates as well as visual comfort level scores. The analysis of the experimental results was conducted through IBM SPSS 26 (Chicago, IL, USA) [46]. Descriptive statistics and repeated measures ANOVA were performed for the degree of apparent velocity, task accuracy rate, and visual comfort levels. Post hoc comparisons were carried out using the LSD method. The significance level for the experiment was set at 0.05.
6.1. Apparent Speed Rate
The descriptive statistical results for apparent speed were shown in Table 2. The ANOVA analysis results indicated that the main effect of speed on apparent speed was significant, F = 65.174, p < 0.05; post hoc comparison results showed that the scores for apparent speeds at higher velocities were consistently higher than those at lower velocities, all with p-values < 0.001. Overall, from the scores, it was found that 8°/s, 16°/s, and 32°/s were considered in the experiment to correspond to slower, medium, and faster scale values on a standard gauge, respectively.

Table 2.
Descriptive statistics results of Experiment II.
The data were fitted using the least squares method to determine the relationship between speed and perceived scale, as shown in Table 3. The adjusted R-squared values for the regression results was 0.784. These results indicate that within the independent variables set in this experiment, there is a cubic relationship between apparent speed and actual speed.

Table 3.
Data fitting results.
6.2. Accuracy Rate
The results of the variance analysis indicate that speed has a significant main effect on task accuracy, F = 11.628, p < 0.05, as shown in Table 4. Post hoc comparison of the results shows that when speed exceeds 12°/s, accuracy always decreases with increasing moving speed. When the speed is greater than 32°/s, the correct rate drops to a lower level. However, overall, under any condition, the answer correctness rate was higher than 90%, which indicates that observers were able to complete the experiments conscientiously throughout the experiment.

Table 4.
Analysis of variance results.
6.3. Visual Comfort Score
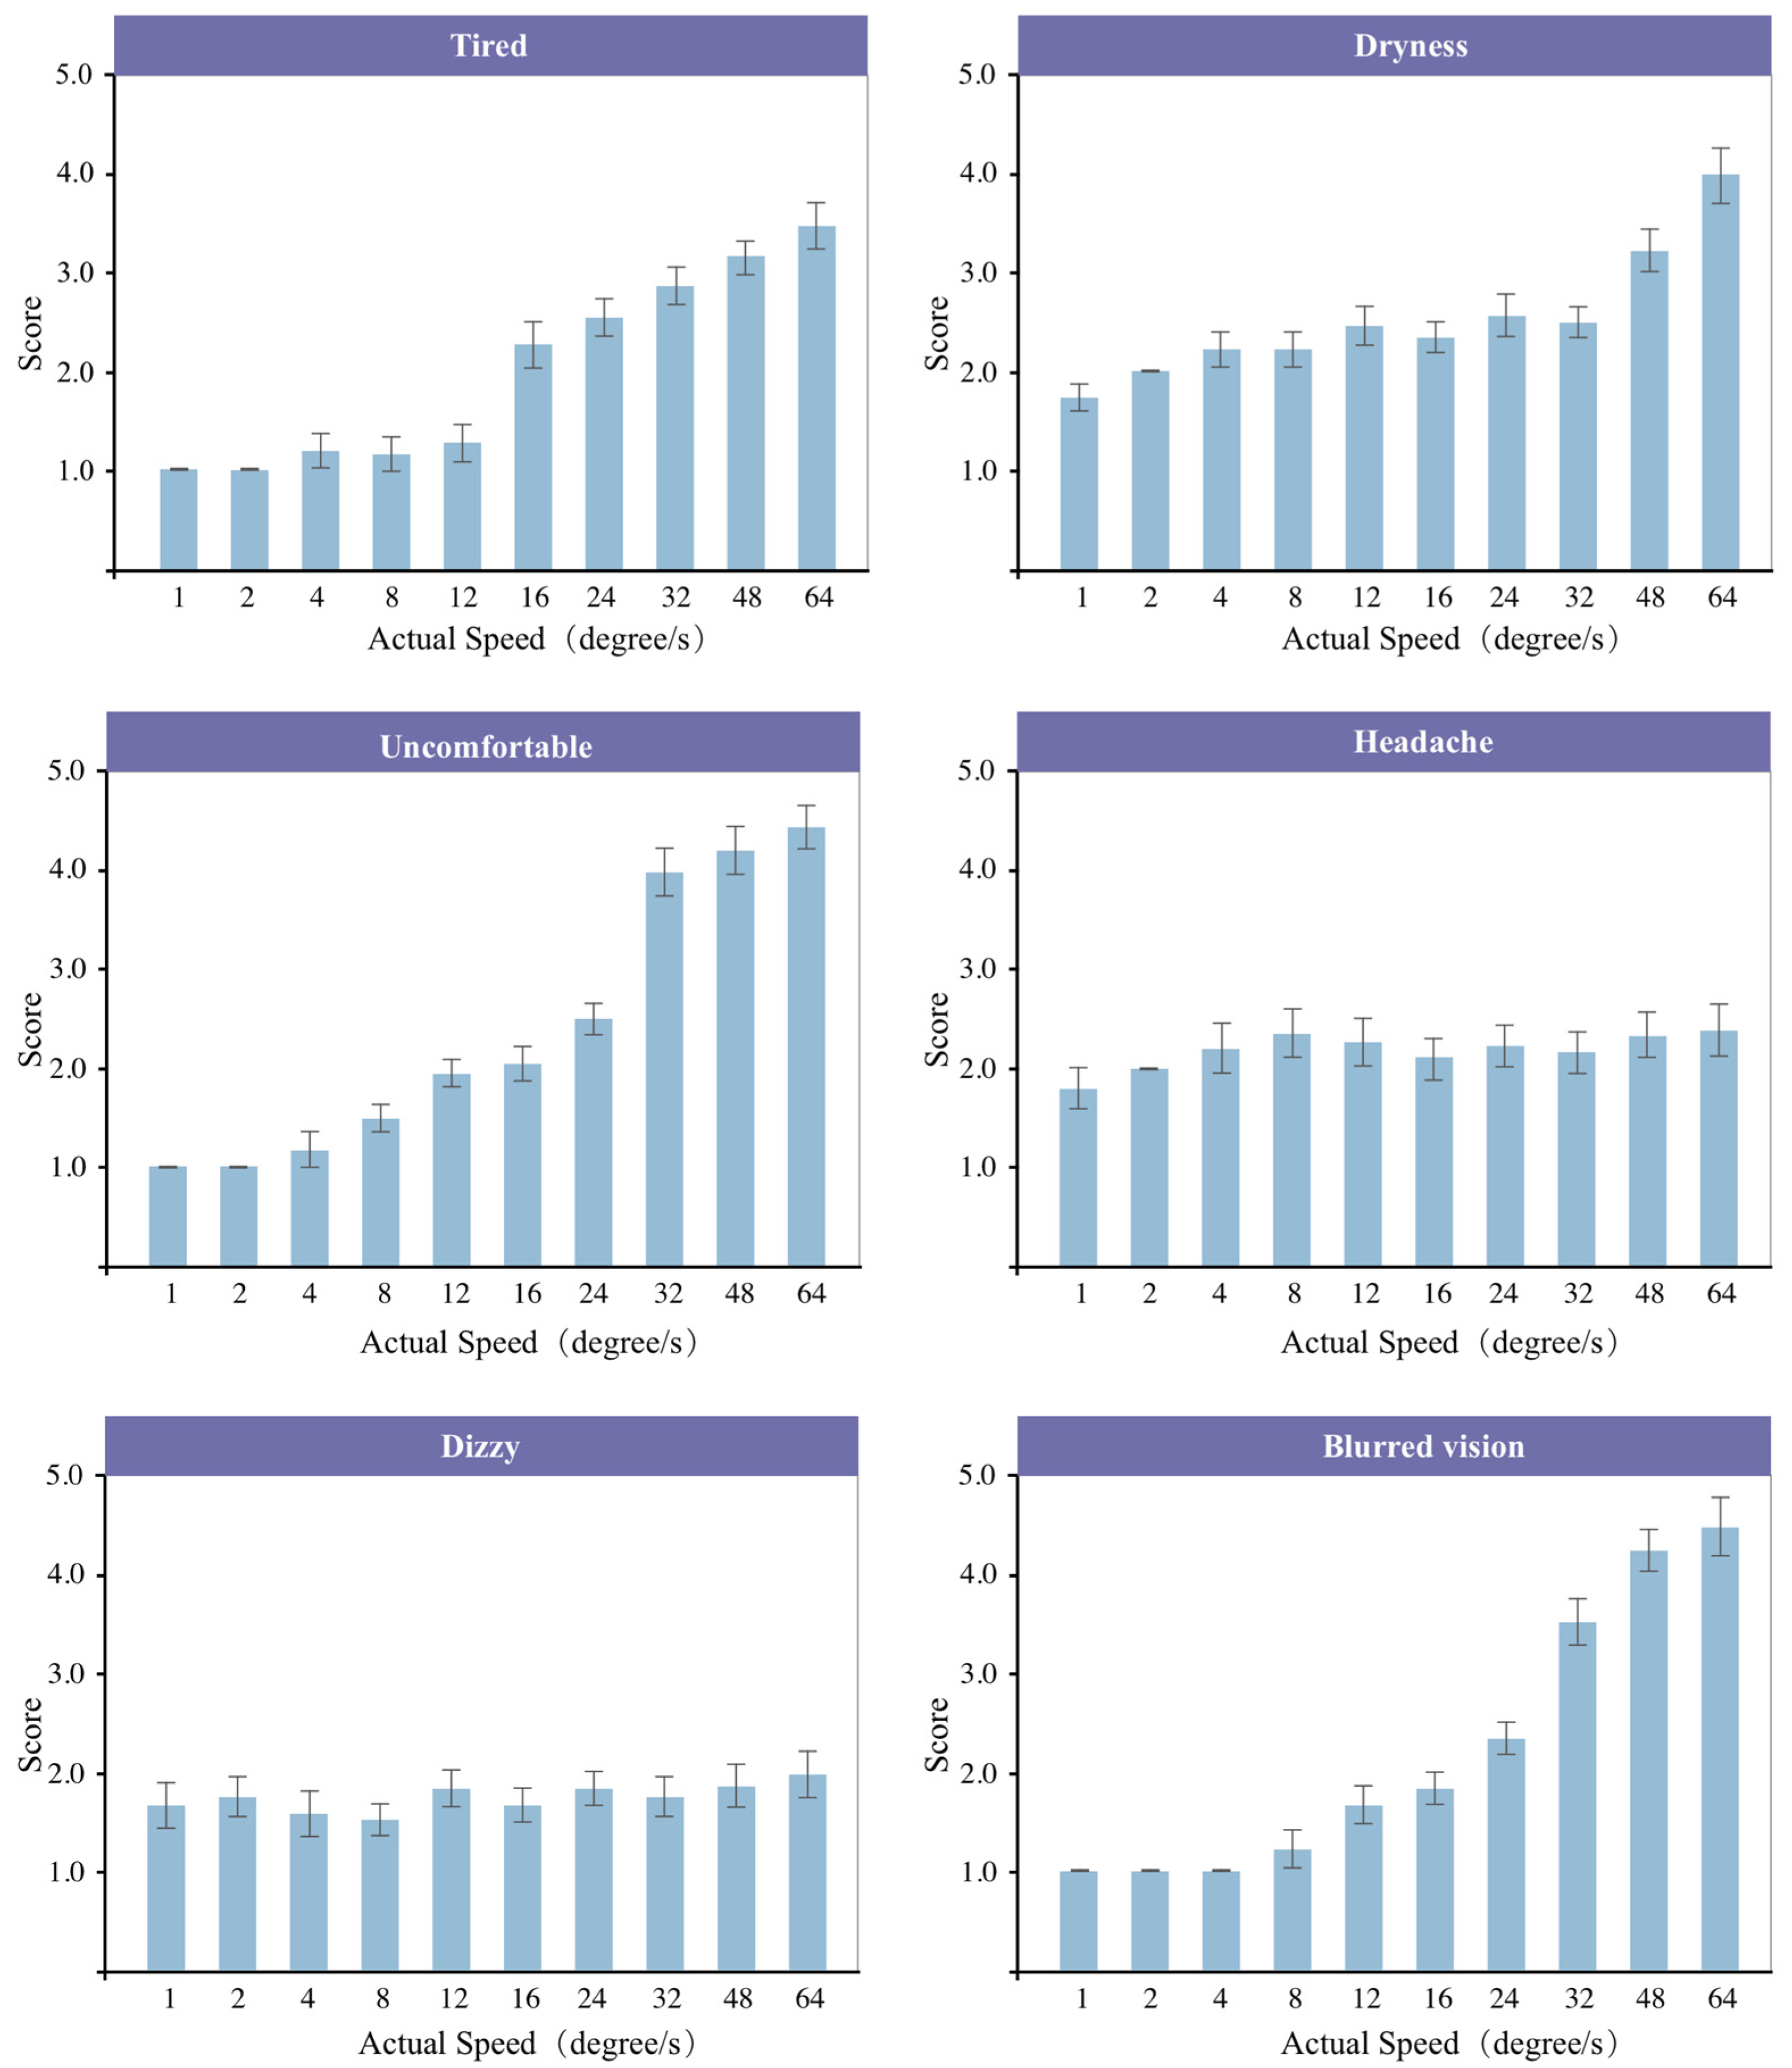
The results of the ANOVA analysis showed that there was a significant effect of movement speed on visual discomfort (F = 13.262, p < 0.05), blurred vision (F = 24.093, p < 0.05), visual fatigue (F = 11.285, p < 0.05), and dry eyes (F = 9.354, p < 0.05). However, there was no significant effect on headache (F = 0.528, p = 0.291) or dizziness (F = 0.929, p = 0.137). The average scores for different symptoms at each speed level are plotted in Figure 6. It could be observed from the graph that visual fatigue and blurred vision gradually increased with higher speeds. In contrast, dry eyes and visual discomfort showed more pronounced changes when the speed exceeded 32°/s. Additionally, from the results perspective, all symptoms were relatively mild at lower speeds (lower than 8°/s).
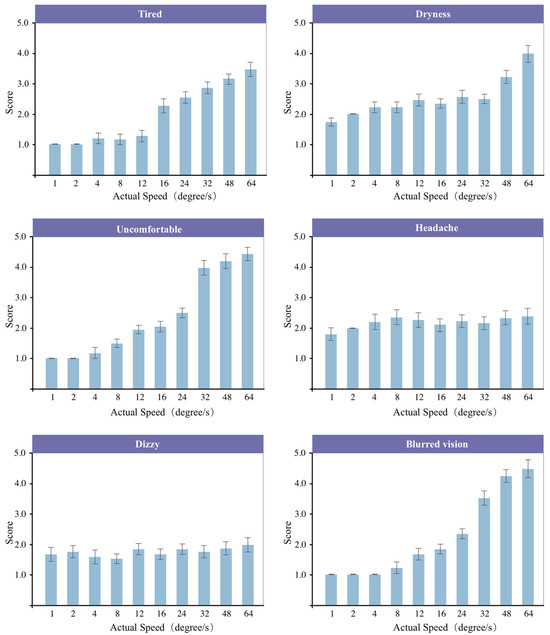
Figure 6.
The scores for visual comfort across various symptoms.
7. Discussion of Experiment II
Experiment II measured the apparent velocity and visual experience of dynamic elements within a range of 1–64°/s for 16 users. There was evidence that the increase in actual speed gives rise to apparent speed, which is consistent with the previous research [40,47]; it was also found that a cubic equation could be used to illustrate the quantitative relationship between actual speed and apparent speed. The study also discovered that higher speeds have a detrimental impact on the accuracy rate of response, which aligns with the previous research [23,48]. The emergence of this phenomenon can be attributed to the presence of motion blur effects, when movement speed exceeds 32°/s, the degree of motion blur could be more serious [23,32], which made it more difficult for observers to see the image clearly. Additionally, some evidence indicates that observers experienced more visual fatigue symptoms as the speed increased, including eye fatigue, dryness, and discomfort. This is believed to have been caused by the short duration of stimuli on the screen, which required participants to enhance their focus and pay more attention during observation tasks. Consequently, involuntary blinking decreased, which disrupted tear film stability and led to various visual fatigue symptoms [49,50]. Furthermore, no symptoms of motion sickness were observed. This may be due to the insufficient intensity of visual cues generated by the experimental stimulus to induce dizziness in the participants. Although blurred vision was typically associated with motion sickness and was found to occur with increasing speed in this study, it was more likely attributed to motion blur effects.
8. General Discussion
With the growing need for real-time monitoring, dynamic situational maps have become a vital tool in Air Traffic Control and other fields. Consequently, determining the appropriate movement speeds for moving elements within these maps has emerged as a significant challenge for researchers. This study revolved around the issues of speed discrimination and speed selection for moving symbols in situational maps, organizing observers to conduct behavioral experimental research. Firstly, it measured the speed discrimination threshold of the visual system for moving stimuli on interfaces, obtaining a result of 7–23%. Although this result was higher compared to previous studies, which reported a speed discrimination threshold of 5–6% [6,12], it could be attributed to differences in the stimulus types and display devices compared to our experiment. At the same time, the results show that the visual system’s ability to discern speed followed a pattern of initially increasing and then decreasing as the actual speed rose, which validates the previous research [7,11]. This phenomenon demonstrated mechanistic distinctions in how the visual system processes slow- and fast-moving objects. As mentioned earlier, these distinctions primarily arose from neural pathways that perceive and discriminate speed within the visual system. Specifically, it was believed that separate processing channels for slow and fast speeds are located in the ventral (V3, V4) and dorsal cortical streams (MT), respectively, within the human brain [27,51].
Subsequently, the study investigated participants’ apparent speed, behavioral performance, and subjective visual fatigue. Subjective evaluations of a set of speeds within the sensitivity range were obtained, revealing the relationship between perceived and actual speeds and quantifying it using a mathematical model, which indicated that in the interface environment, the visual system’s perception of apparent speed increment would gradually decline as the actual speed increases. This visual feature could guide designers in setting the speed of dynamic objects. Three key speed points on the perceptual speed scale were identified as 8°/s, 16°/s, and 32°/s. Speeds below 8°/s were considered low, while speeds above 32°/s were considered high; around 16°/s was deemed a relatively moderate speed range. These speed points have been shown in previous studies to correspond to abrupt changes in visual cognitive performance [23,48].
Additionally, it was found that observing images at these speed levels in a screen environment led to visual fatigue but not visual dizziness. High-speed motion images did result in lower visual satisfaction; specifically, stimuli exceeding 32°/s significantly caused discomfort in vision and eye strain, while speeds below 8°/s were confirmed not to cause significant visual discomfort for observers. Therefore, this study suggested limiting the recommended range of stimulus movement speeds on interfaces to within 32°/s for higher performance and with an optimal range below 8°/s for subjective comfortability purposes.
9. Conclusions
This study explored the issue of speed settings in dynamic situation map design from a novel perspective, focusing on the observers’ visual capabilities, task performance, and subjective experiences. It uncovered the relationships among the observers’ sensitivity to moving image speeds, apparent speed, and visual comfort. Overall, when observing moving stimuli on screens, participants exhibited a Just Noticeable Difference in speed within a range of 7–23%. Their ability to discriminate speeds displayed a U-shaped trend with increasing velocities. The critical sensitivity range for speed discrimination was identified as between 1°/s and 64°/s. Therefore, when visualizing the design of the air traffic control map, priority should be given to the speed within the speed-sensitive range. At the same time, the choice of adjacent speeds needs to be greater than the observer’s JNDS value.
In addition, by implementing cognitive tasks on the aviation transportation situation monitoring map, the study has determined the relationship between observers’ perceived speed and actual speed. When designing the situational map, speeds of 8°/s, 16°/s, and 32°/s were considered critical markers for classifying slow, moderate, and fast motion ranges, respectively. To enhance the visual comfort and task accuracy of users such as air traffic controllers, speeds faster than 32°/s should be avoided. It is more recommended to use speeds below 8°/s because it can provide operators with a better visual experience. The conclusions of this experiment can be used to guide the design of air traffic control maps and other types of situational maps.
In the future, subsequent work would focus on adding data collection and analysis methods, such as eye-tracking devices or EEG equipment, to further investigate other motion characteristics of dynamic elements in interfaces and their relationships with eye movement preferences, responses of visual pathways, and visual comfort level. This could enhance the applicability and depth of the research findings.
Author Contributions
Conceptualization, M.T.; methodology, M.T.; software, X.W.; validation, M.T.; formal analysis, M.T.; investigation, M.T.; resources, S.C.; data curation, M.T.; writing—original draft preparation, M.T.; writing—review and editing, M.T.; visualization, M.T.; supervision, C.X.; project administration, S.C.; funding acquisition, S.C. All authors have read and agreed to the published version of the manuscript.
Funding
This study was supported by Major Program of the National Natural Science Foundation of China. (grant no. T2192933).
Data Availability Statement
Data are contained within the article.
Conflicts of Interest
The authors declare no conflicts of interest.
References
- Hoekstra, J.M.; van Gent, R.N.H.W.; Ruigrok, R.C.J. Designing for safety: The ‘free flight’ air traffic management concept. Reliab. Eng. Syst. Saf. 2002, 75, 215–232. [Google Scholar] [CrossRef]
- Research on Road Traffic Situation Awareness System Based on Image Big Data|IEEE Journals & Magazine|IEEE Xplore. Available online: https://ieeexplore.ieee.org/abstract/document/8848403 (accessed on 8 April 2024).
- Eräranta, S.; Staffans, A. From Situation Awareness to Smart City Planning and Decision Making. In Proceedings of the 14th International Conference on Computers in Urban Planning and Urban Management, Cambridge, MA, USA, 7–10 July 2015. [Google Scholar]
- Crouser, R.J.; Fukuda, E.; Sridhar, S. Retrospective on a decade of research in visualization for cybersecurity. In Proceedings of the 2017 IEEE International Symposium on Technologies for Homeland Security (HST), Waltham, MA, USA, 25–26 April 2017; pp. 1–5. [Google Scholar]
- Lu, C.; Lyu, J.; Zhang, L.; Gong, A.; Fan, Y.; Yan, J.; Li, X. Nuclear Power Plants with Artificial Intelligence in Industry 4.0 Era: Top-Level Design and Current Applications—A Systemic Review. IEEE Access 2020, 8, 194315–194332. [Google Scholar] [CrossRef]
- McKee, S.P. A local mechanism for differential velocity detection. Vis. Res. 1981, 21, 491–500. [Google Scholar] [CrossRef] [PubMed]
- de Bruyn, B.; Orban, G.A. Human velocity and direction discrimination measured with random dot patterns. Vis. Res. 1988, 28, 1323–1335. [Google Scholar] [CrossRef] [PubMed]
- Snowden, R.J.; Braddick, O.J. The temporal integration and resolution of velocity signals. Vis. Res. 1991, 31, 907–914. [Google Scholar] [CrossRef] [PubMed]
- Sudkamp, J.; Bocian, M.; Souto, D. The role of eye movements in perceiving vehicle speed and time-to-arrival at the roadside. Sci. Rep. 2021, 11, 23312. [Google Scholar] [CrossRef] [PubMed]
- Strasburger, H.; Rentschler, I.; Jüttner, M. Peripheral vision and pattern recognition: A review. J. Vis. 2011, 11, 13. [Google Scholar] [CrossRef] [PubMed]
- Orban, G.A.; De Wolf, J.; Maes, H. Factors influencing velocity coding in the human visual system. Vis. Res. 1984, 24, 33–39. [Google Scholar] [CrossRef] [PubMed]
- Mckee, S.P.; Nakayama, K. The detection of motion in the peripheral visual field. Vis. Res. 1984, 24, 25–32. [Google Scholar] [CrossRef]
- Thompson, P.; Brooks, K.; Hammett, S.T. Speed can go up as well as down at low contrast: Implications for models of motion perception. Vis. Res. 2006, 46, 782–786. [Google Scholar] [CrossRef]
- Wolffsohn, J.S.; Lingham, G.; Downie, L.E.; Huntjens, B.; Inomata, T.; Jivraj, S.; Kobia-Acquah, E.; Muntz, A.; Mohamed-Noriega, K.; Plainis, S.; et al. TFOS Lifestyle: Impact of the digital environment on the ocular surface. Ocul. Surf. 2023, 28, 213–252. [Google Scholar] [CrossRef] [PubMed]
- Wee, S.W.; Moon, N.J. Clinical evaluation of accommodation and ocular surface stability relavant to visual asthenopia with 3D displays. BMC Ophthalmol. 2014, 14, 29. [Google Scholar] [CrossRef] [PubMed]
- Kuze, J.; Ukai, K. Subjective evaluation of visual fatigue caused by motion images. Displays 2008, 29, 159–166. [Google Scholar] [CrossRef]
- Bando, T.; Iijima, A.; Yano, S. Visual fatigue caused by stereoscopic images and the search for the requirement to prevent them: A review. Displays 2012, 33, 76–83. [Google Scholar] [CrossRef]
- Jaschinski, W.; Bonacker, M.; Alshuth, E. Accommodation, convergence, pupil diameter and eye blinks at a CRT display flickering near fusion limit. Ergonomics 1996, 39, 152–164. [Google Scholar] [CrossRef] [PubMed]
- Blehm, C.; Vishnu, S.; Khattak, A.; Mitra, S.; Yee, R.W. Computer Vision Syndrome: A Review. Surv. Ophthalmol. 2005, 50, 253–262. [Google Scholar] [CrossRef] [PubMed]
- Goodwin, P.E. Evaluation of Methodology for Evaluating Lighting for Offices with VDTs. J. Illum. Eng. Soc. 1987, 16, 39–51. [Google Scholar] [CrossRef]
- Smith, S.P.; Nesbitt, K.; Blackmore, K. Using optical flow as an objective metric of cybersickness in virtual environments. In Proceedings of the Australasian Simulation Congress 2017, Sydney, Australia, 28–31 August 2017. [Google Scholar]
- Terenzi, L.; Zaal, P. Rotational and Translational Velocity and Acceleration Thresholds for the Onset of Cybersickness in Virtual Reality. In AIAA Scitech 2020 Forum; American Institute of Aeronautics and Astronautics: Reston, VA, USA, 2020. [Google Scholar]
- Tong, M.; Chen, S.; Niu, Y.; Wu, J.; Tian, J.; Xue, C. Visual search during dynamic displays: Effects of velocity and motion direction. J. Soc. Inf. Disp. 2022, 30, 635–647. [Google Scholar] [CrossRef]
- Burr, D.; Thompson, P. Motion psychophysics: 1985–2010. Vis. Res. 2011, 51, 1431–1456. [Google Scholar] [CrossRef]
- Finlay, D.; Dodwell, P.C.; Caelli, T. The waggon-wheel effect. Perception 1984, 13, 237–248. [Google Scholar] [CrossRef]
- Davis, S.; Nesbitt, K.; Nalivaiko, E. A Systematic Review of Cybersickness. In Proceedings of the 2014 Conference on Interactive Entertainment, Association for Computing Machinery, New York, NY, USA, 2–3 December 2014; pp. 1–9. [Google Scholar] [CrossRef]
- Gegenfurtner, K.R.; Hawken, M.J. Interaction of motion and color in the visual pathways. Trends Neurosci. 1996, 19, 394–401. [Google Scholar] [CrossRef]
- Fitting the Mel Scale|IEEE Conference Publication|IEEE Xplore. Available online: https://ieeexplore.ieee.org/abstract/document/758101 (accessed on 12 July 2023).
- Jacobsen, F.; de Bree, H.-E. A comparison of two different sound intensity measurement principles. J. Acoust. Soc. Am. 2005, 118, 1510–1517. [Google Scholar] [CrossRef]
- Langley, G.B.; Sheppeard, H. The visual analogue scale: Its use in pain measurement. Rheumatol. Int. 1985, 5, 145–148. [Google Scholar] [CrossRef]
- Tong, M.; Chen, S.; Niu, Y.; Xue, C. Effects of speed, motion type, and stimulus size on dynamic visual search: A study of radar human–machine interface. Displays 2023, 77, 102374. [Google Scholar] [CrossRef]
- Yang, L.; Yu, R.; Lin, X.; Liu, N. Shape representation modulating the effect of motion on visual search performance. Sci. Rep. 2017, 7, 14921. [Google Scholar] [CrossRef]
- Ko, Y.-H. The effects of luminance contrast, colour combinations, font, and search time on brand icon legibility. Appl. Ergon. 2017, 65, 33–40. [Google Scholar] [CrossRef]
- Initiative (WAI) WWA. Web Accessibility Initiative (WAI). Cognitive Accessibility at W3C. Available online: https://www.w3.org/WAI/cognitive/ (accessed on 13 November 2023).
- Law Insider [Internet]. ANSI/HFES 100-2007 Standards Definition. Available online: https://www.lawinsider.com/dictionary/ansihfes-100-2007-standards (accessed on 11 November 2023).
- Bond, J.G. Introduction to Game Design, Prototyping, and Development: From Concept to Playable Game with Unity and C#; Addison-Wesley Professional: New York, NY, USA, 2014; 944p. [Google Scholar]
- Farell, B.; Pelli, D.G. Psychophysical methods, or how to measure a threshold, and why. In Vision Research: A Practical Guide to Laboratory Methods; Carpenter, R., Robson, J., Eds.; Oxford University Press: Oxford, UK, 1998. [Google Scholar] [CrossRef]
- Nishida, S. Advancement of motion psychophysics: Review 2001–2010. J. Vis. 2011, 11, 11. [Google Scholar] [CrossRef] [PubMed]
- McKee, S.P.; Smallman, H.S. Size and speed constancy. In Perceptual Constancy: Why Things Look as They Do; Cambridge University Press: New York, NY, USA, 1998; pp. 373–408. [Google Scholar]
- Yong, Z.; Hsieh, P.-J. Speed–size illusion correlates with retinal-level motion statistics. J. Vis. 2017, 17, 1. [Google Scholar] [CrossRef] [PubMed]
- Burr, D. Motion smear. Nature 1980, 284, 164–165. [Google Scholar] [CrossRef]
- Peschel, A.; Orquin, J. A review of the findings and theories on surface size effects on visual attention. Front. Psychol. 2013, 4, 70924. [Google Scholar] [CrossRef]
- Rajabi-Vardanjani, H.; Habibi, E.; Pourabdian, S.; Dehghan, H.; Maracy, M.R. Designing and Validation a Visual Fatigue Questionnaire for Video Display Terminals Operators. Int. J. Prev. Med. 2014, 5, 841–848. [Google Scholar] [PubMed]
- Kennedy, R.S.; Lane, N.E.; Berbaum, K.S.; Lilienthal, M.G. Simulator Sickness Questionnaire: An enhanced method for quantifying simulator sickness. Int. J. Aviat. Psychol. 1993, 3, 203–220. [Google Scholar] [CrossRef]
- E-Prime, Version 3.0. Experimental Implementation Software. Psychology Software Tools, Inc.: Pittsburgh, PA, USA, 2016.
- IBM SPSS Statistics for Windows, Version 26.0. Software for Technical Computation. IBM Cor: Yorktown Heights, NY, USA, 2019.
- Hussain, Q.; Alhajyaseen, W.K.M.; Pirdavani, A.; Reinolsmann, N.; Brijs, K.; Brijs, T. Speed perception and actual speed in a driving simulator and real-world: A validation study. Transp. Res. Part F Traffic Psychol. Behav. 2019, 62, 637–650. [Google Scholar] [CrossRef]
- Yu, R.; Chan, A.H.S. Display Movement Velocity and Dynamic Visual Search Performance: Dynamic Visual Search Performance. Hum. Factors Man. 2015, 25, 269–278. [Google Scholar] [CrossRef]
- Gowrisankaran, S.; Nahar, N.K.; Hayes, J.R.; Sheedy, J.E. Asthenopia and Blink Rate Under Visual and Cognitive Loads. Optom. Vis. Sci. 2012, 89, 97. [Google Scholar] [CrossRef] [PubMed]
- Wang, M.T.M.; Tien, L.; Han, A.; Lee, J.M.; Kim, D.; Markoulli, M.; Craig, J.P. Impact of blinking on ocular surface and tear film parameters. Ocul. Surf. 2018, 16, 424–429. [Google Scholar] [CrossRef]
- Hubel, D.H.; Livingstone, M.S. Segregation of form, color, and stereopsis in primate area 18. J. Neurosci. 1987, 7, 3378–3415. [Google Scholar] [CrossRef]
Disclaimer/Publisher’s Note: The statements, opinions and data contained in all publications are solely those of the individual author(s) and contributor(s) and not of MDPI and/or the editor(s). MDPI and/or the editor(s) disclaim responsibility for any injury to people or property resulting from any ideas, methods, instructions or products referred to in the content. |
© 2024 by the authors. Licensee MDPI, Basel, Switzerland. This article is an open access article distributed under the terms and conditions of the Creative Commons Attribution (CC BY) license (https://creativecommons.org/licenses/by/4.0/).

