Article

The Possibility of Powering a Light Aircraft by Releasing the Energy Stored in Hydrogen within a Fuel Cell Stack

School of Mechanical and Manufacturing Engineering, The University of New South Wales, Sydney, NSW 2052, Australia
Aerospace 2024, 11(6), 469; https://doi.org/10.3390/aerospace11060469
Submission received: 21 March 2024 / Revised: 24 May 2024 / Accepted: 6 June 2024 / Published: 12 June 2024
(This article belongs to the Special Issue Electric Power Systems and Components for All-Electric Aircraft)

Abstract

:
In this work, we examine the possibility of converting a light propeller-driven aircraft, powered by a spark-ignition, reciprocating piston, and internal combustion engine running on AVGAS, into one powered by an electric motor driven by a proton exchange membrane fuel cell stack running on hydrogen. Our studies suggest that storing hydrogen cryogenically is a better option than storing hydrogen under pressure. In comparison to cryogenic tanks, high-pressure tanks are extremely heavy and unacceptable for light aircraft. We show that the modified aircraft (including batteries) is no heavier than the original, and that the layout of the major components results in lower movement of the aircraft center-of-gravity as the aircraft consumes hydrogen. However, we acknowledge that our fuel cell aircraft cannot store the same amount of energy as the original running on AVGAS. Therefore, despite the fact that the fuel cell stack is markedly more efficient than an internal combustion engine, there is a reduction in the range of the fuel cell aircraft. One of our most important findings is that the quantity of energy that we need to dissipate to the surroundings via heat transfer is significantly greater from a fuel cell stack than from an internal combustion engine. This is particularly the case when we attempt to run the fuel cell stack at high current densities. To control this problem, our strategy during the cruise phase is to run the fuel cell stack at its maximum efficiency, where the current density is low. We size the fuel cell stack to produce at least enough power for cruise, and when we require excess power, we add the energy stored in batteries to make up the difference.

1. Introduction

Aerospace and electrical engineers need to collaborate to produce a state-of-the-art fuel cell-powered aircraft. One of the main goals of the present work is to break down the barriers between the two disciplines so that:
(a)
aerospace engineers understand how a fuel cell stack can drive a propeller via a boost controller and electric motor, and
(b)
electrical engineers understand the specific demands of aircraft propulsion engineering.
In this work, our intention is to carry out a theoretical study to assess whether it is feasible to retrofit an existing light aircraft rather than design an aircraft from scratch. We have chosen the Diamond DA40, as we here at UNSW have years of experience with this aircraft. Our aim is to convert, on paper, the DA40 aircraft, which consumes AVGAS, into an aircraft that consumes hydrogen. To do so, we will remove the Lycoming IO-306-M1A engine (Williamsport, PA, USA), constant speed propeller, and AVGAS tanks and replace them with a proton exchange membrane (PEM) fuel cell stack supplying electrical power to a brushless electric motor via a boost controller turning a variable pitch propeller. Ideally, we would like to maintain the range and endurance of the original aircraft as well as the maximum climb angle and climb rate, but we will discuss the impact of the changes on these performance figures throughout this paper.
There have been a small number of publications that have looked at this problem over the years, but none really look at retrofitting an existing light aircraft in the same class as the Diamond DA40. Ref. [1] carried out a retrofit to a HK36 Superdimona motor gilder from Diamond. The project was a great success, with the aircraft actually flying for the first time in 2008. The authors concluded that there was considerable room for improvement which could be met by the fast-moving progress in research on fuel cells, electric motors, etc., in the future. This was an excellent practical piece of engineering, but the paper is a little short on information regarding the details of the electrical system. Although the aerospace and electrical engineers did a fantastic job, it is not clear what the aerospace engineers learnt from the electrical engineers and vice versa. It is our view that aerospace engineers will ultimately need to know as much about electrical propulsion systems as they do today about internal combustion engines and gas turbine engines. Ref. [2] looked at the characteristics and performance of an unmanned fuel cell-powered aircraft. Their aircraft was powered by a 0.5   k W fuel cell. Ref. [3] fitted hydrogen fuel cells to an aircraft described as an evolution of the Pipistrel Taurus G4 double fuselage glider. Ref. [4] carried out a performance and failure analysis of a retrofitted Cessna 208 Caravan. Their aircraft was intended to cruise at 10,000   f t ( 3048   m ). It required a combustion device to produce exhaust gases that were hot enough to drive the turbine required to compress the air required by the fuel cell at this altitude. As will be seen, our aircraft operates somewhere in between these extremes.
To be clear, the purpose of this work is not to give the modified aircraft a final specification. Until we have the actual components, we will never know the exact specifications of the modified aircraft. In this paper, we are trying to establish, by using the best estimates we can, whether further developing the actual bespoke components required for such an aircraft is worthwhile. Even specifying tolerances on these items is practically impossible. It is our experience that aerospace engineers have little knowledge of electrical engineering. It has taken a considerable amount of time for us to come to terms with state-of-the-art permanent magnet brushless direct current motors, boost controllers, and rechargeable lithium-ion batteries. There are many pitfalls that the inexperienced can fall into; therefore the most important goal of this work is to address these items, so as to reduce the work others in aerospace new to the field have to do to gain a basic understanding of the electrification of aircraft. We hope to convince the reader that this type of aircraft is viable.
Our fuel cell stack will operate on hydrogen. Our main decision is whether to use pressurized hydrogen at around 700   b a r , as Toyota does ( 350   b a r does not given us the mass storage we require) with their Mirai in the automotive industry, or to use cryogenic hydrogen at 20.3 K as certain rocket engines do. In Section 2, we will argue in favor of cryogenic hydrogen. In doing so, we will assume that cryogenic hydrogen is readily available and not discuss its production or handling.
The Lycoming IO-306-M1A engine is capable of producing 134   k W at 2700   r / m i n . As we will be removing this item along with others from the aircraft and replacing them with others, we need to estimate the change in weight and the change in the location of the center-of-gravity of the retrofitted aircraft. We need to ensure that the center-of-gravity remains within permissible limits, irrespective of the quantity of hydrogen we store on the aircraft. We will see that these constraints will lower the amount of hydrogen we can store, thus reducing the aircraft’s range and endurance.
It is appropriate that we offer brief explanations on the operation of fuel cells and fuel cell stacks, boost controllers, and brushless direct current motors throughout this paper so that the reader can see how these items relate to one another. Together, they will constitute the aircraft’s new drivetrain. As our retrofitted aircraft will require batteries, we will also briefly discuss rechargeable battery packs. At this stage in our research, we will not discuss multi-input, multi-output (MIMO) control systems that control the detailed operation of the drivetrain. That is for a later paper. We will, however, show two simple relationships between the fuel cell stack and the electric motor, i.e., one for cruise flight and the other for full-powered flight.
For our retrofitted aircraft, we have chosen a variable pitch propeller designed to operate at a constant rotational speed of 2400   r / m i n . The electric motor will turn at a constant speed, irrespective of the torque load placed on the propeller blades caused by varying the blade geometric pitch. As we have made this choice, we will need to implement sinusoidal motor control.
The biggest obstacle to retrofitting the Diamond DA40 is the fact that the high thermal efficiency of the fuel cell stack causes the aircraft to reject more energy as heat transfer to the aircraft surroundings. For example, if the fuel cell stack produces 100   k W of power at a thermal efficiency of 50 % , then the aircraft must reject energy to the surroundings at a rate of 100   k W . This is a fairly substantial rate of heat transfer. We therefore need to operate our fuel cell stack at low current densities where the thermal efficiency of the fuel cell stack is high.
The major consequence of this is that while we can produce enough power for our aircraft to cruise, producing enough power from our fuel cell stack to enable our aircraft to climb was not possible. Therefore, we have had to resort to using rechargeable lithium-ion batteries carried onboard the aircraft to provide “excess” power. Through careful operation of the fuel cell stack, we should be able to recharge our batteries in-flight.

2. Arguments for Cryogenic Hydrogen Storage over High-Pressure Storage

At standard pressure and temperature, the density of hydrogen is 8400 times lower than AVGAS. As a consequence, its volumetric specific energy is 3500 times less than AVGAS. This makes hydrogen difficult to store.
Given that the conventionally powered Diamond DA40 uses two 76-liter fuel tanks, the mass of AVGAS the aircraft can store is m = ρ V = 717 2 × 0.076 = 109   k g , where ρ is the density of AVGAS and V is the volume. As the specific enthalpy of AVGAS is h = 43.7   M J / k g , the energy stored by the aircraft when the fuel tanks are full is 4.76   G J . As the specific enthalpy of hydrogen is 120   M J / k g , we require a mass of 39.7   k g of hydrogen to equal the amount of energy stored in the actual AVGAS fuel.
Using hydrogen stored at a pressure of 700   b a r , as is the case in the automotive industry, is too heavy for a light aircraft. Modern state-of-the-art, high-pressure storage tanks have a specification of 5.7   w t . % , which means that for every 5.7   k g ( 55.9   N ) of hydrogen stored, the mass of the tank is 100   k g ( 981   N ). Therefore, the mass of the tank required to store 39.7   k g ( 389   N ) of hydrogen at 700   b a r is 696.5   k g ( 6.83   k N ). As the maximum take-off weight (MTOW) of the Diamond DA40 is 1200   k g ( 11.8   k N ), a tank this heavy would raise the MTOW to an unacceptable value.
At standard pressure, hydrogen becomes a saturated liquid with a density of 71.0   k g / m 3 if cryogenically cooled to a temperature of 20.3   K . This density is approximately 10 times lower than AVGAS, which is a significant improvement on pressurized hydrogen, which is approximately 18 times lower than AVGAS. Raising the pressure of this hydrogen results in an increase in the saturation temperature and a decrease in the density of the hydrogen. For example, at 5   b a r , the saturation temperature of hydrogen is 27.1   K , and its density is 60.5   k g / m 3 (see [5]). However, if further cooled in an isobaric process, this saturated liquid hydrogen at 5   b a r becomes a subcooled liquid when its temperature reaches 20.3   K . The density of the resulting liquid hydrogen ( L H 2 ) is still around 71.0   k g / m 3 owing to the close relationship between the 5   b a r isobar and saturated liquid curve.
To store 39.7   k g of L H 2 at a slightly higher pressure than atmospheric pressure, we will need to know the mass and volume of the multi-layered insulated tank required. Ref. [3] suggest the following relationship:
η g = W L H 2 W L H 2 + W t a n k ,
where W L H 2 is the maximum weight of the L H 2 stored, W t a n k is the weight of the tank, and η g is the gravimetric storage density. For a single multi-layered insulated tank [6], we suggest a value of η g = 0.675 . Therefore, we require a tank of 19.3   k g ( 189   N ) to store the 39.7   k g of L H 2 . This is much more acceptable. Therefore, we will employ cryogenic hydrogen onboard our aircraft.

3. Note on the Layout of the Retrofitted Aircraft

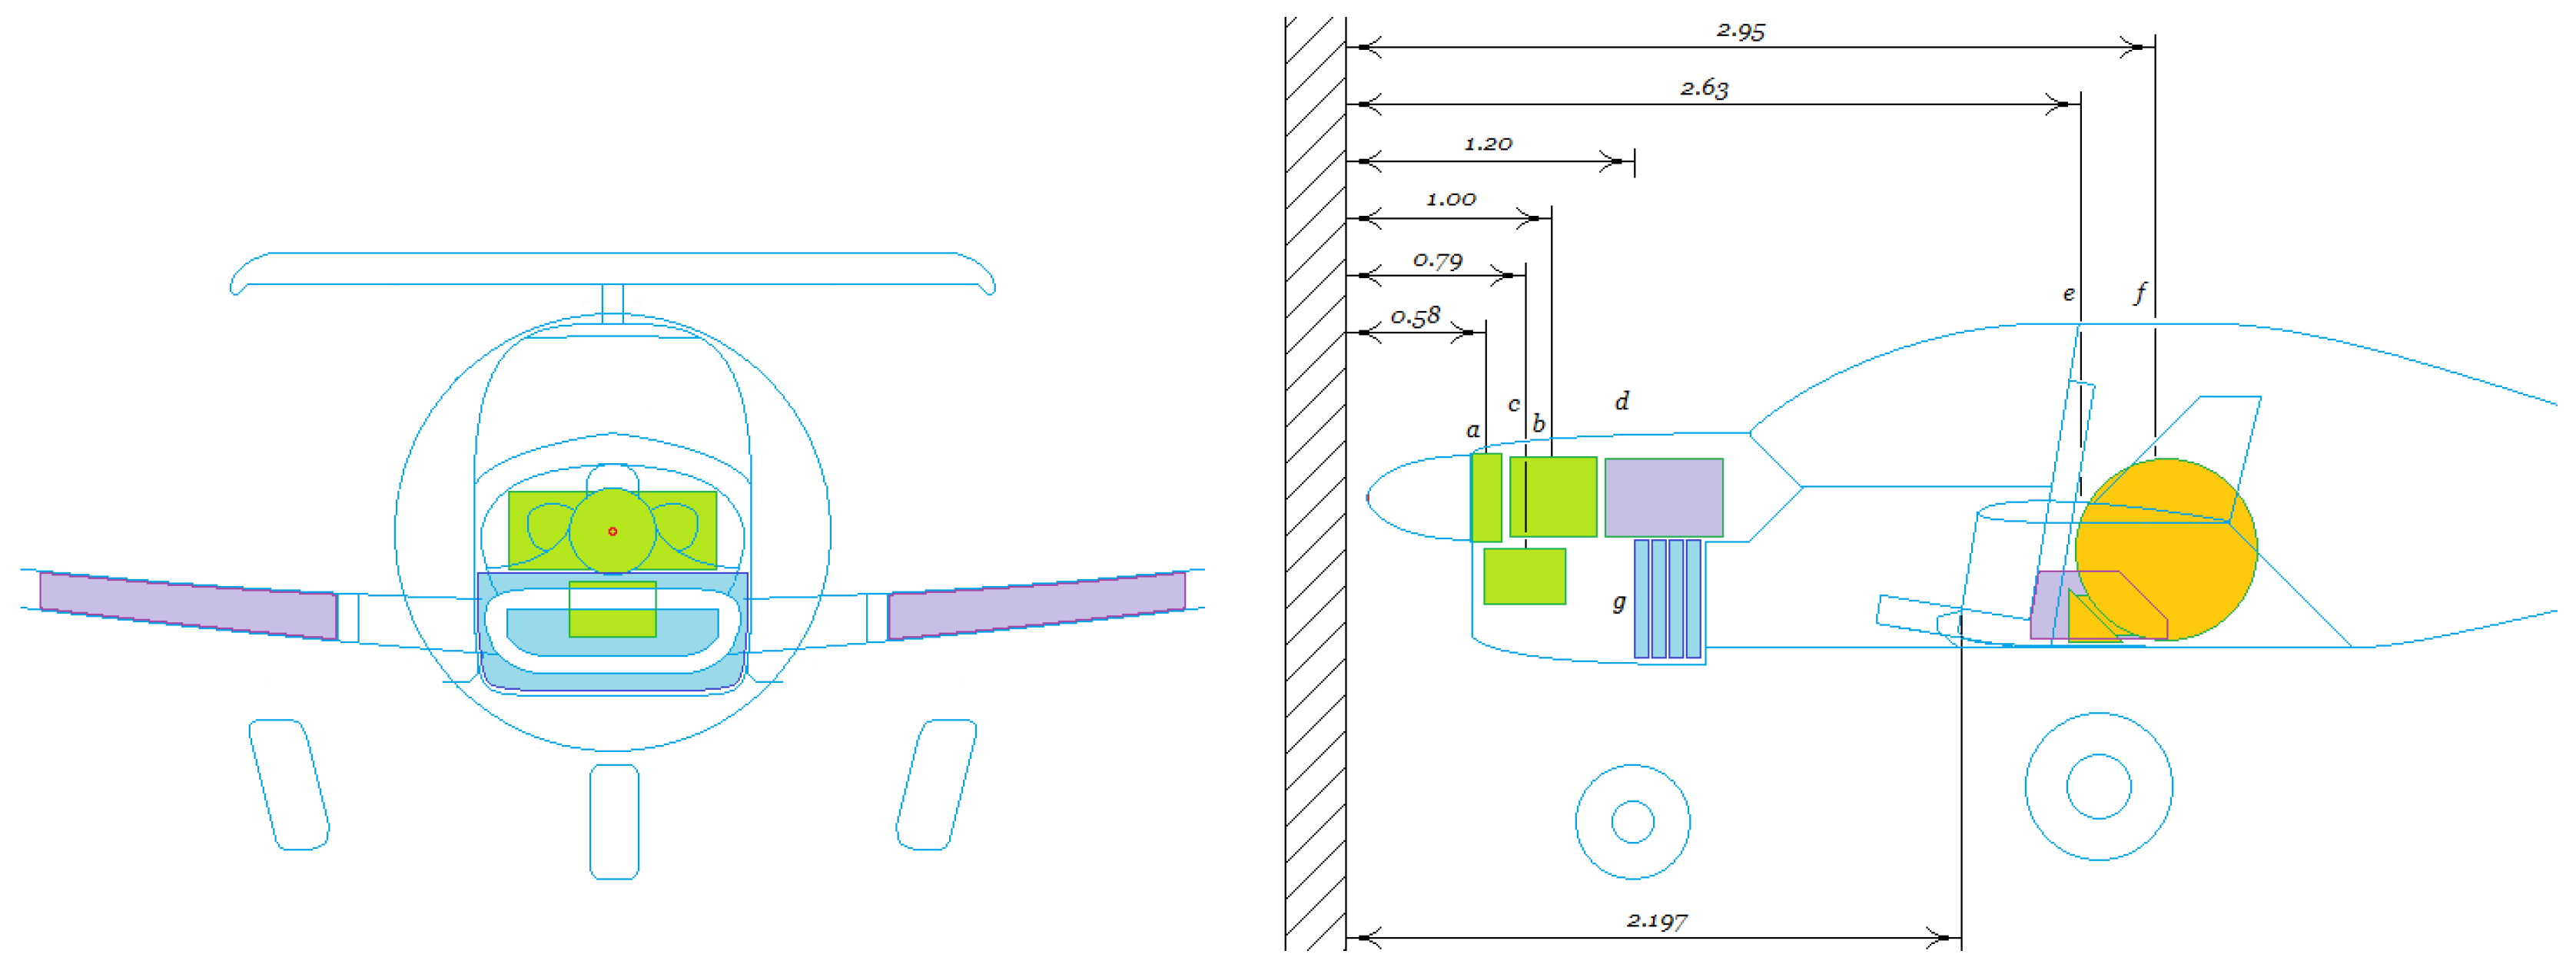
In the retrofitted aircraft, we replace the Lycoming IO-360 internal combustion engine and the AVGAS fuel tanks with a fuel cell stack, boost controller, two battery packs, electric motor, and cryogenic hydrogen tank. Figure 1 shows the placement of the major components required to replace the Lycoming IO-360 internal combustion engine and the AVGAS fuel tanks with respect to the specified datum surface.
The Lycoming IO-360 internal combustion engine has a dry weight of 117   k g . The dry weight of an engine is the weight of an engine carrying all the equipment necessary for it to operate, but without liquids such as oil, coolant, or fuel. Therefore, if we remove this air-cooled engine, the overall weight removed will be the dry weight of the engine plus the eight liters of engine oil that the engine carries in-flight. The density of Aeroshell W100 engine oil is 0.886   k g / L , so the mass of the oil will be 7.1   k g . Therefore, removing the engine means that we will reduce the aircraft’s weight by 124   k g . Although we will remove the wing AVGAS fuel tanks, we will consider their weight to be negligible.
Table 1 shows the mass, volume, density, power, gravimetric power density, and volumetric power density of the major components removed from the original aircraft, namely the engine and the AVGAS fuel (we have neglected the weight of the AVGAS fuel tanks). Table 1 also shows the mass, volume, density, power, gravimetric power density, and volumetric power density of the major components added to the aircraft, namely the fuel cell stack, the battery packs, the boost controller, the brushless electric motor (BLDC motor), and the hydrogen tank (full) make up the fuel cell-powered aircraft.
The table shows that the total mass of the fuel cell aircraft when fully charged with LH2 is less than the total mass of the original aircraft when full of AVGAS by 56.1   k g . This corresponds to a weight reduction of 4.68 % . When we say ‘full of LH2’, we mean that the aircraft is carrying 14   k g of cryogenic hydrogen in an 11   k g tank structure. This is because we need to mount the hydrogen tank behind the front seats of the aircraft to achieve balance, and the small size of the tank will reduce the range/endurance of the aircraft by approximately 30 % .
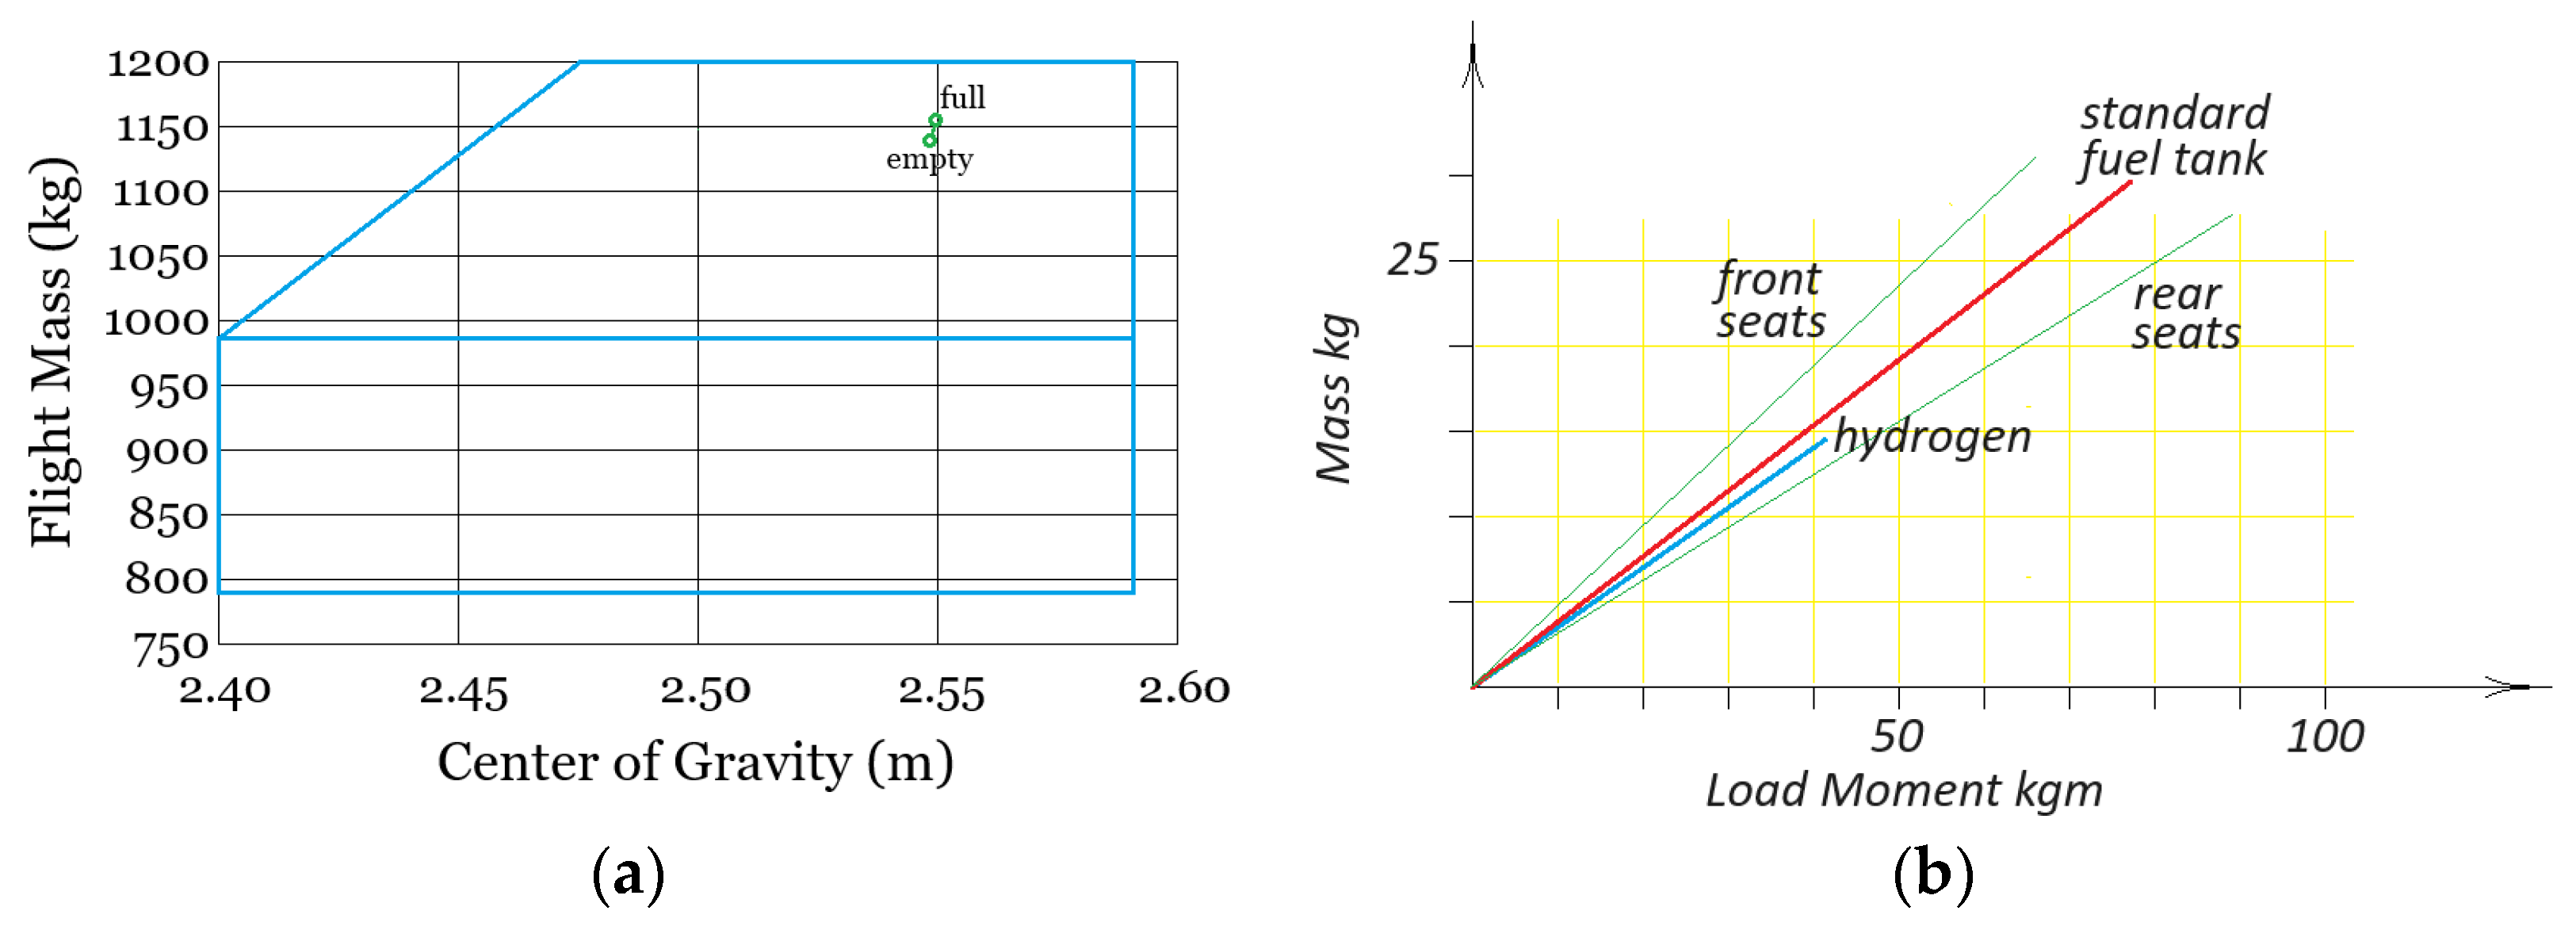
Table 2 shows the effects of removing the old components and then the effects of adding the new components on the position of the aircraft’s center of gravity for the case when the LH2 tank is full and for when it is empty. The center of gravity of the original aircraft is 2.54   m from the datum plane. The center of gravity of the fuel cell aircraft is 2.550   m when full of LH2 and 2.545   m when empty. This movement is approximately 5   m m forwards. Figure 2a shows that this movement is well within the permissible limits for the range of the center of gravity for Diamond DA40, while Figure 2a shows that this movement is well within the permissible limits for the range of the center of gravity for Diamond DA40 while Figure 2b depicts the mass versus load moment diagram, which suggests there is little difference impact on fuel burn on dynamic stability.

4. Powertrain

4.1. Overview of Fuel Cell Powertrain

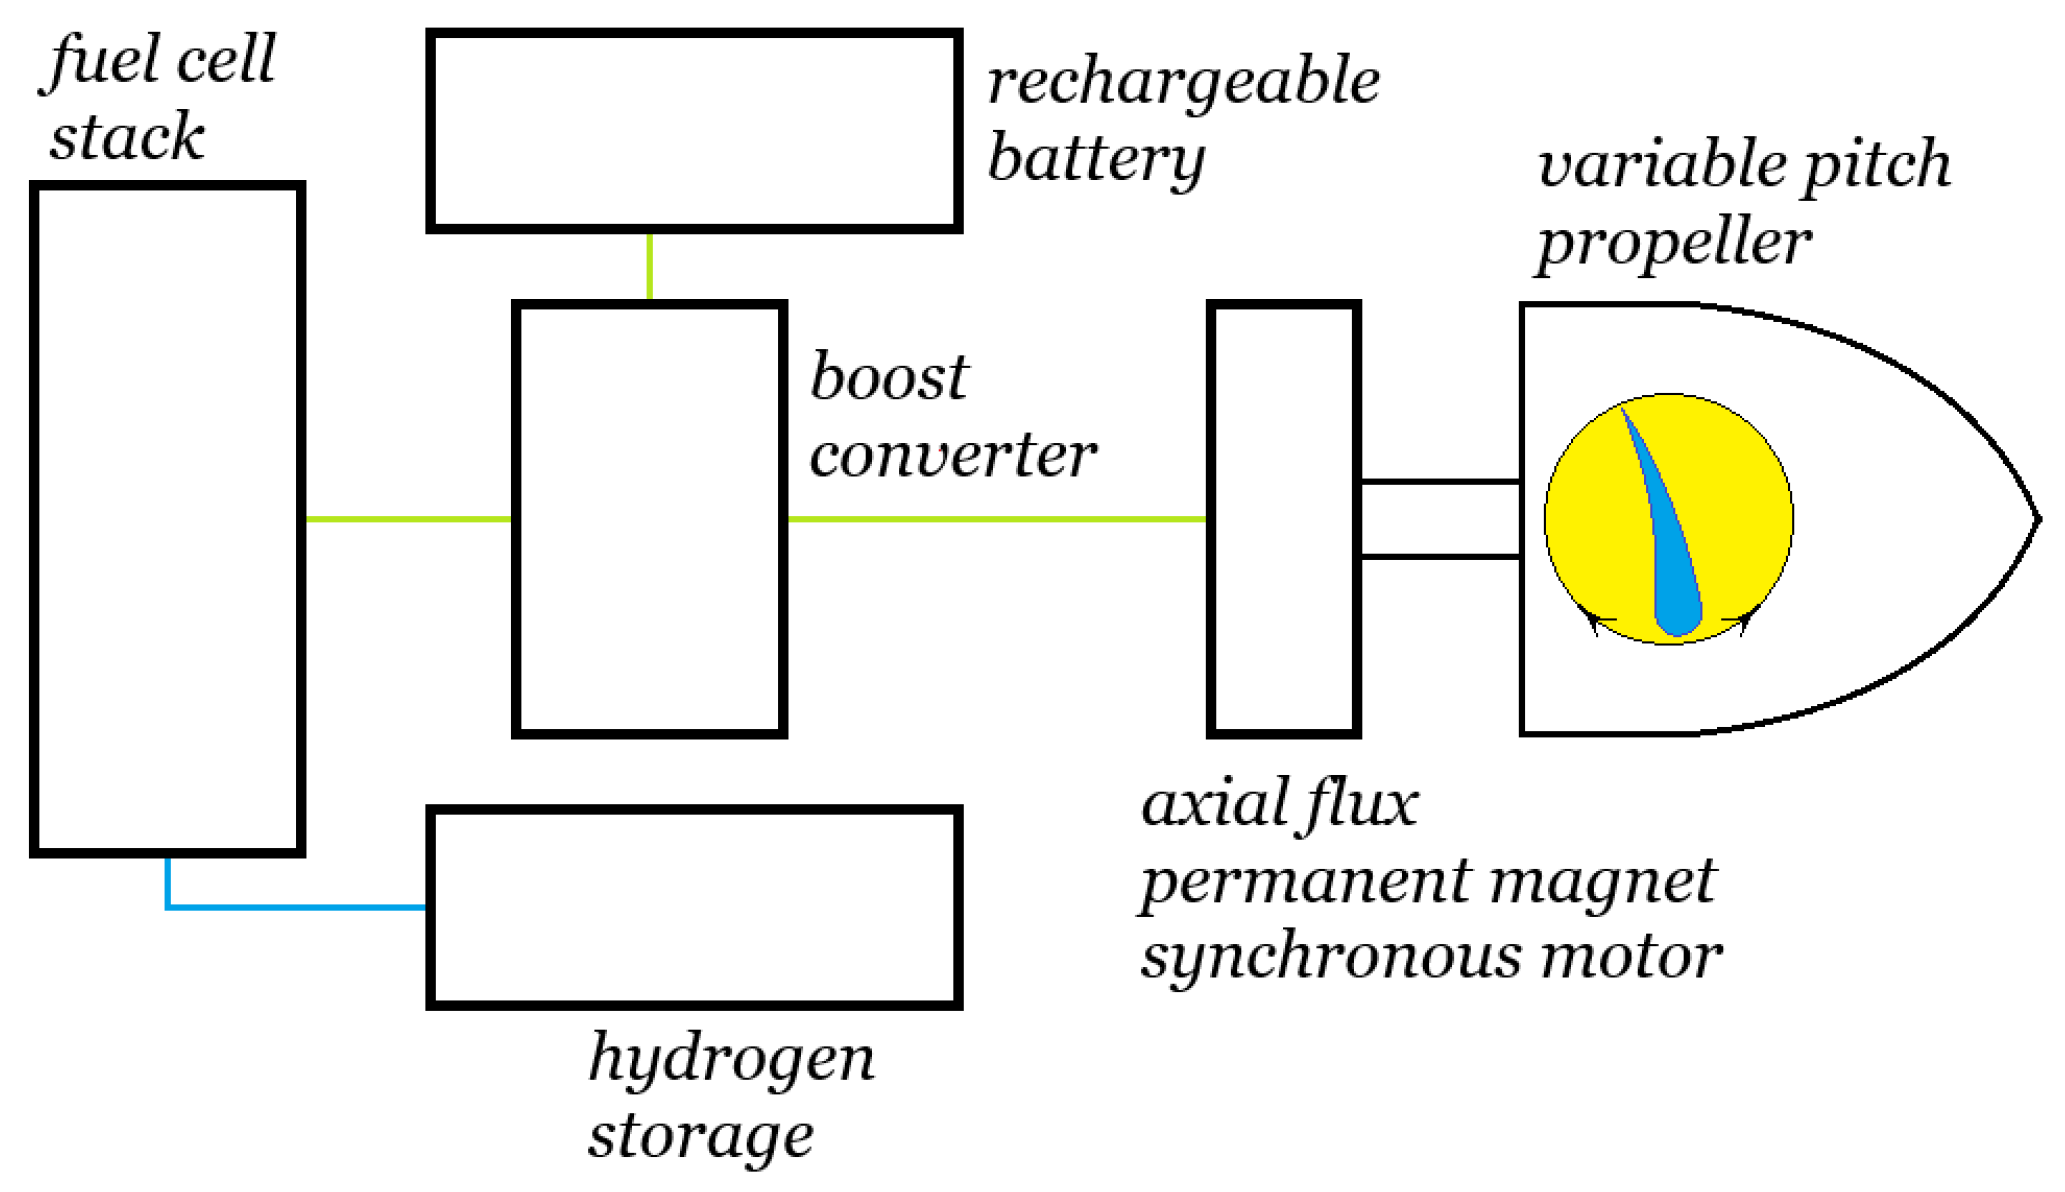
The retrofitted aircraft powertrain consists of a cryogenic hydrogen tank, a fuel cell stack, a boost converter, rechargeable battery packs, a BLDC electric motor, and a variable pitch propeller. Figure 3 shows the basic layout of the fuel cell powertrain. The fuel cell stack releases the energy bound in the hydrogen. A flow of direct current (DC) electricity carries this energy through the boost controller and on to the electric motor.
We will find that there is a significant mismatch between the voltage required by the electric motor and the voltage generated by the fuel cell stack. We therefore require a DC/DC boost converter to step the fuel cell stack voltage to the motor voltage.
The type of motor required will need to have a high power density, high efficiency, high heat dissipation characteristics, and negligible torque ripple. We will discuss the merits of both radial flux and axial flux permanent magnet synchronous machines to see which one is best suited.

4.2. Fuel Cell and Fuel Cell Stack

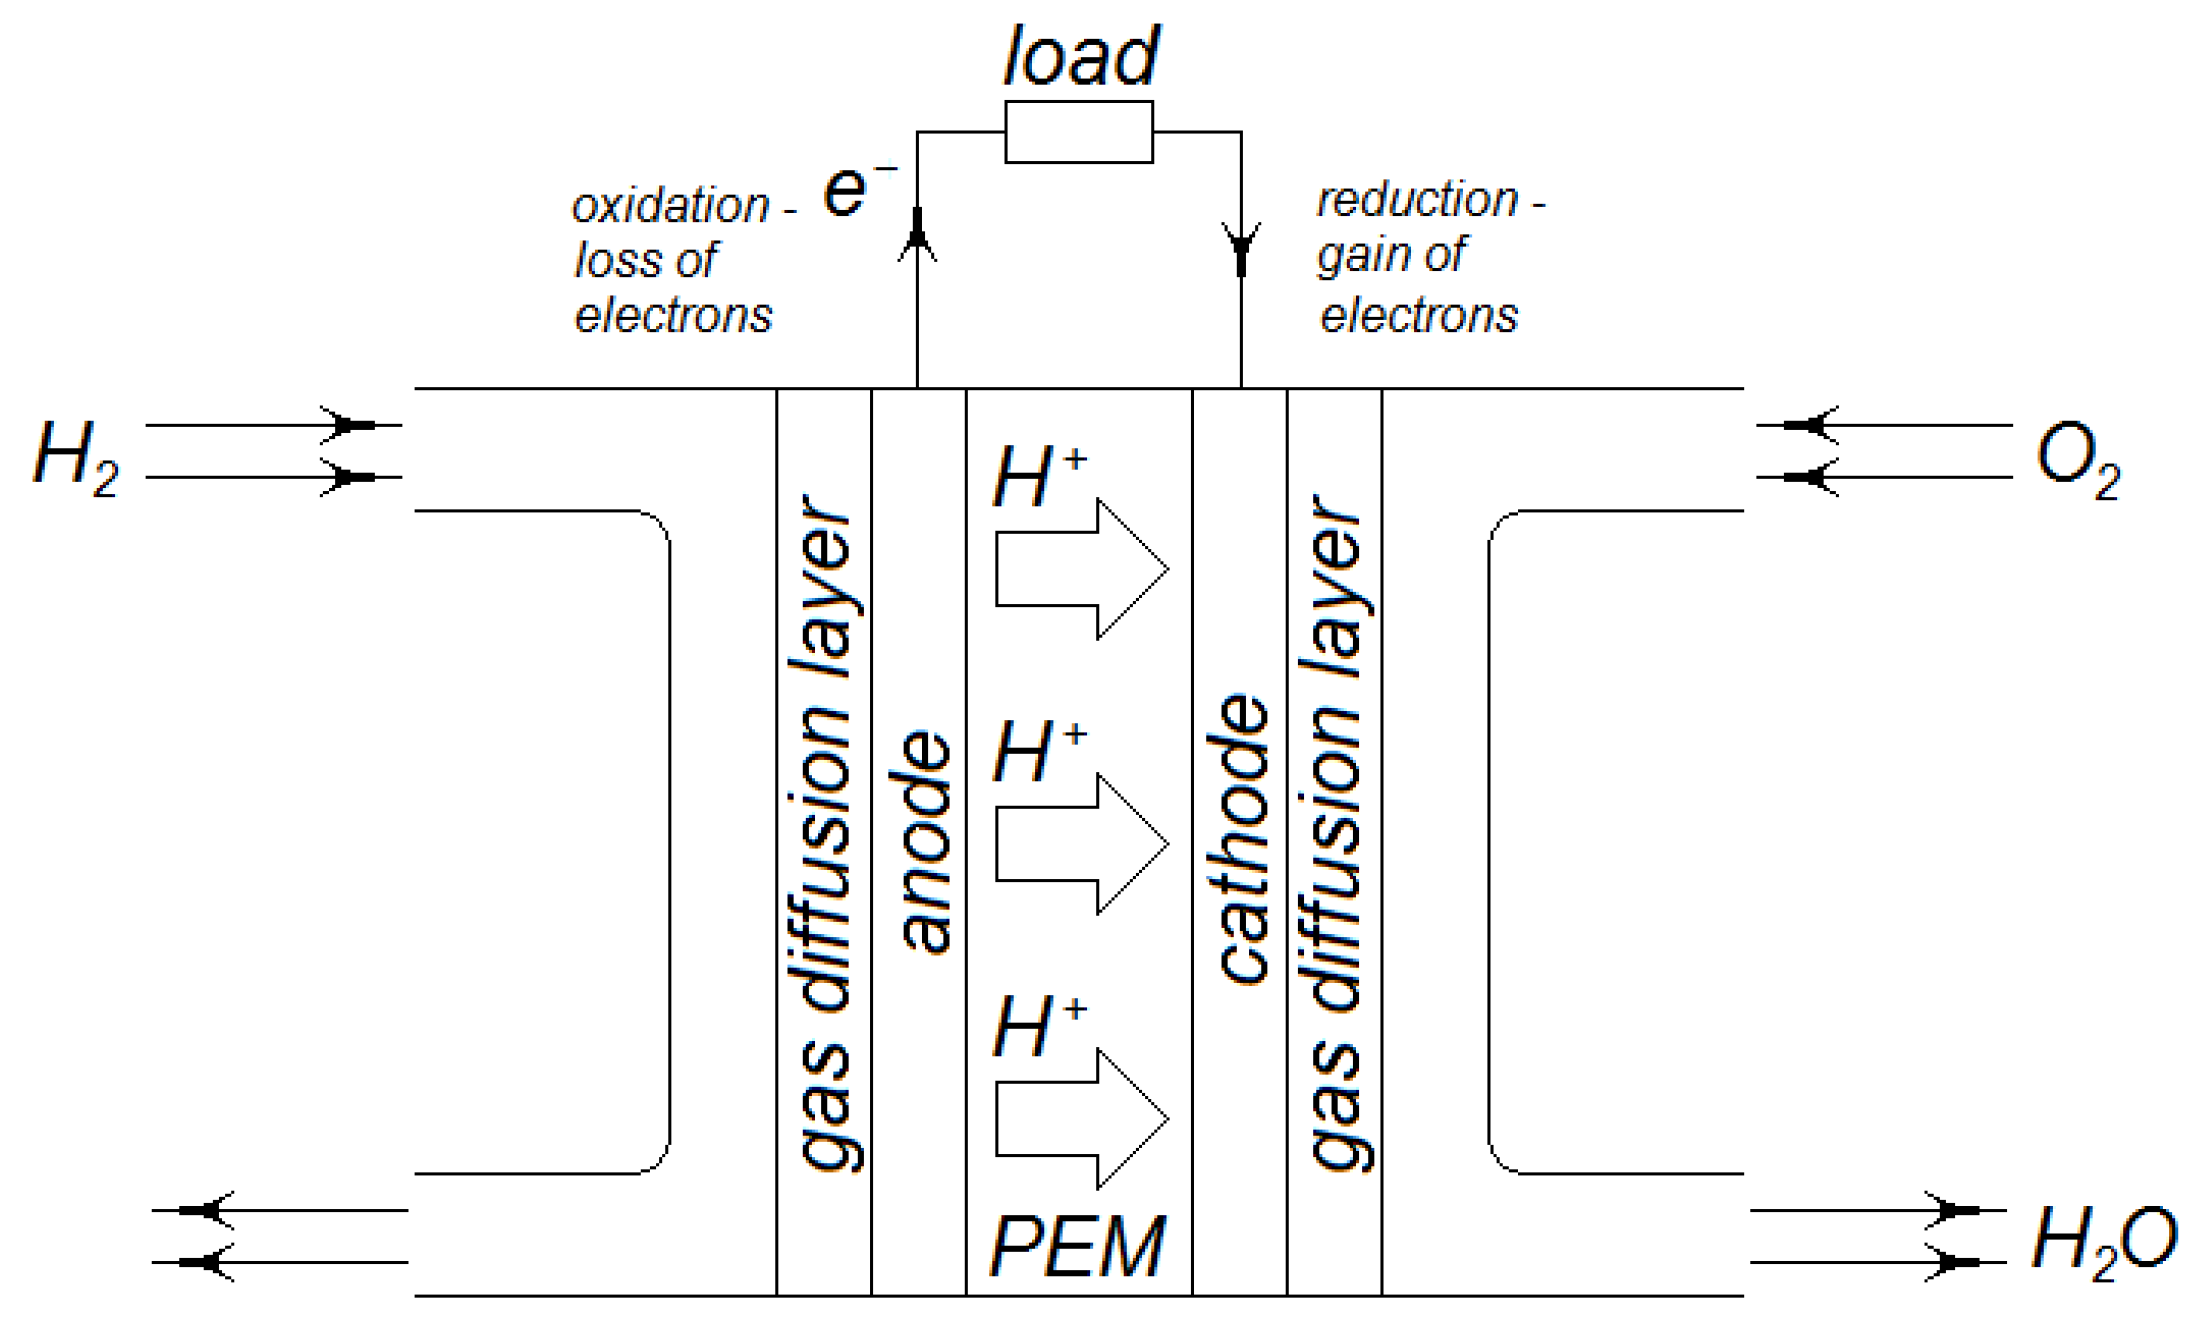
Figure 4 shows the layout of a basic individual proton exchange membrane (PEM) fuel cell. Hydrogen gas, H 2 ( g ) enters on the anode side of the cell, while compressed air at pressure P enters on the cathode side. Air consists of 21 % oxygen gas O 2 ( g ) and 79 % nitrogen gas N 2 ( g ) expressed as mole fractions. Therefore, the partial pressure of the atmospheric oxygen is 0.21   P . A compressor controls the pressure of oxygen at the cathode, which can change the shape of the polarity curve and also compensate for variations in aircraft altitude. As the fuel cell operates at a temperature of approximately 80   ° C , the nitrogen remains essentially inert, which means no oxide of nitrogen emissions. Liquid water H 2 O ( l ) and the nitrogen gas N 2 ( g ) exit the cell on the cathode side.
Hydrogen molecules flow through a gas diffusion layer to the activation layer of the anode, which may contain platinum. This platinum acts as a catalyst, forming a triple-phase boundary (see ref. [8]) which facilitates the breakup of hydrogen molecules into individual hydrogen atoms and then aids the hydrogen atoms in ionizing, becoming individual protons, H + . The resulting free electrons are free to enter the anode. Therefore, at the anode, the following half-cell reaction occurs:
H 2 2 H + + 2 e
This reaction is an oxidization reaction (loss of electrons).
The protons migrate under the influence of an electrostatic force (see ref. [9]) through the proton exchange membrane to the cathode. Oxygen molecules flow through a gas diffusion layer to the activation layer of the cathode, which may contain nickel. This nickel acts as a catalyst, again forming a triple-phase boundary, which facilitates the breakup of oxygen molecules into individual oxygen atoms, then aids the oxygen atoms, hydrogen ions, and electrons to form water. Therefore, at the cathode, another half-cell reaction occurs:
1 2 O 2 + 2 H + + 2 e H 2 O
This reaction involves a reduction (gain of electrons).
The total chemical reaction taking place across the fuel cell is therefore as follows:
H 2 + 1 2 O 2 H 2 O .
However, given that we induce air into the fuel cell stack rather than pure oxygen, our stoichiometric chemical reaction is as follows:
H 2 + 1 2 O 2 + 3.76 N 2 H 2 O + 1.88 N 2 .
The stoichiometric air-to-fuel ratio for this reaction is A F m a s s = 7.18 .
During steady-state operation, as mentioned, hydrogen ions (protons) migrate from the anode under the influence of an electrochemical potential field through the membrane to the cathode. The polymer electrolyte membrane allows for the transportation of H + ions (protons) but does not allow for the transportation of hydrogen or electrons. When a conductor establishes an external bridge between the anode and the cathode, we meet the last requirement of the cathode half-cell reaction. This conductor allows the electrons produced by the oxidation of hydrogen to travel from the anode to the cathode, thus establishing an electric circuit. The resulting voltage between the anode and cathode can drive an electrical load.
The molar specific electrical work w ¯ that a polymer (proton) exchange membrane fuel cell can produce is g 0 ¯ :
w ¯ = g 0 ¯ = h f 0 ¯ T s 0 ¯ ,
where the change in the molar Gibb’s function is the difference between the specific heat input to the cell and the change in the specific heat output of the cell. Note that h f 0 ¯ represents the change in the molar enthalpy for formation at standard conditions, T represents the absolute temperature, and s 0 ¯ represents the change in molar entropy at standard conditions. For our reaction, the fact that g 0 ¯ is negative indicates that the total chemical reaction taking place across the fuel cell (see above) has a strong driving force to proceed in the direction indicated by the arrow, i.e., to produce water.
The reversible potential difference E r e v between the anode and the cathode as a voltage (remembering that voltage has the units of J / C ) is the change in the molar Gibb’s function divided by both n , which represents the multiple of the number of electrons transferred for each mole of hydrogen (in this case n = 2 ), and F , which represents Faraday’s constant, which is the charge of one mole of electrons.
E r e v = g 0 ¯ n F = 237,133.16 2 9.648533289 × 10 4 = 1.229 V ~ J m o l / C m o l ~ J C ~ V .
The open cell voltage E o c is as follows:
E o c = E r e v R ¯ T f c n F ln 1 P H 2 y O 2 P a i r 1 2 + S 0 n F T f c T o ,
where T o is the local atmospheric pressure. Note that P H 2 is the pressure of the hydrogen, P a i r is the pressure of the air, and y O 2 is the mole fraction of the oxygen in the air (see ref. [7] for more details).
Figure 5 shows the open cell voltage. It is constant, independent of the ionic current density. The cell voltage is, however, not independent of the ionic current density. It is subject to losses called overvoltages (see ref. [9]), namely the activation overvoltage η a , the ohmic overvoltage η Ω , and the concentration overvoltage η c . Figure 5 also shows these overvoltages as a function of the ionic current density.
The activation overvoltage occurs at low current densities. In any reaction, we require a certain activation energy to break existing chemical bonds before the chemical bonds of the final product/s release energy. It is the energy required to break the existing bonds that absorbs energy, which is therefore the source of the activation overvoltage. Ref. [10] writes an equation for this overvoltage as a function of not just the current density but also as a function of the fuel cell temperature, the Faraday constant, the universal gas constant, the multiple of the number of electrons transferred for each mole of hydrogen, the oxygen partial pressure, and the vapor saturation pressure. We can therefore adjust the shape of the activation overvoltage by changing the pressure of the air entering the cathode side of the fuel cell.
The proton exchange membrane provides an electrical resistance to the flow of protons (or ionic current), which causes the voltage across the membrane to increase linearly with the current density.
Finally, when the current density is high, the concentration of reactants decreases. This reduces the voltage across the fuel cell at high current densities and can terminate the production of voltage. We sometimes call the concentration overvoltage the mass transport overvoltage. Like the activation overvoltage, [10] also writes this equation as a function of the oxygen partial pressure. We can therefore adjust the shape of the concentration overvoltage by changing the pressure of the air entering the cathode side of the fuel cell.
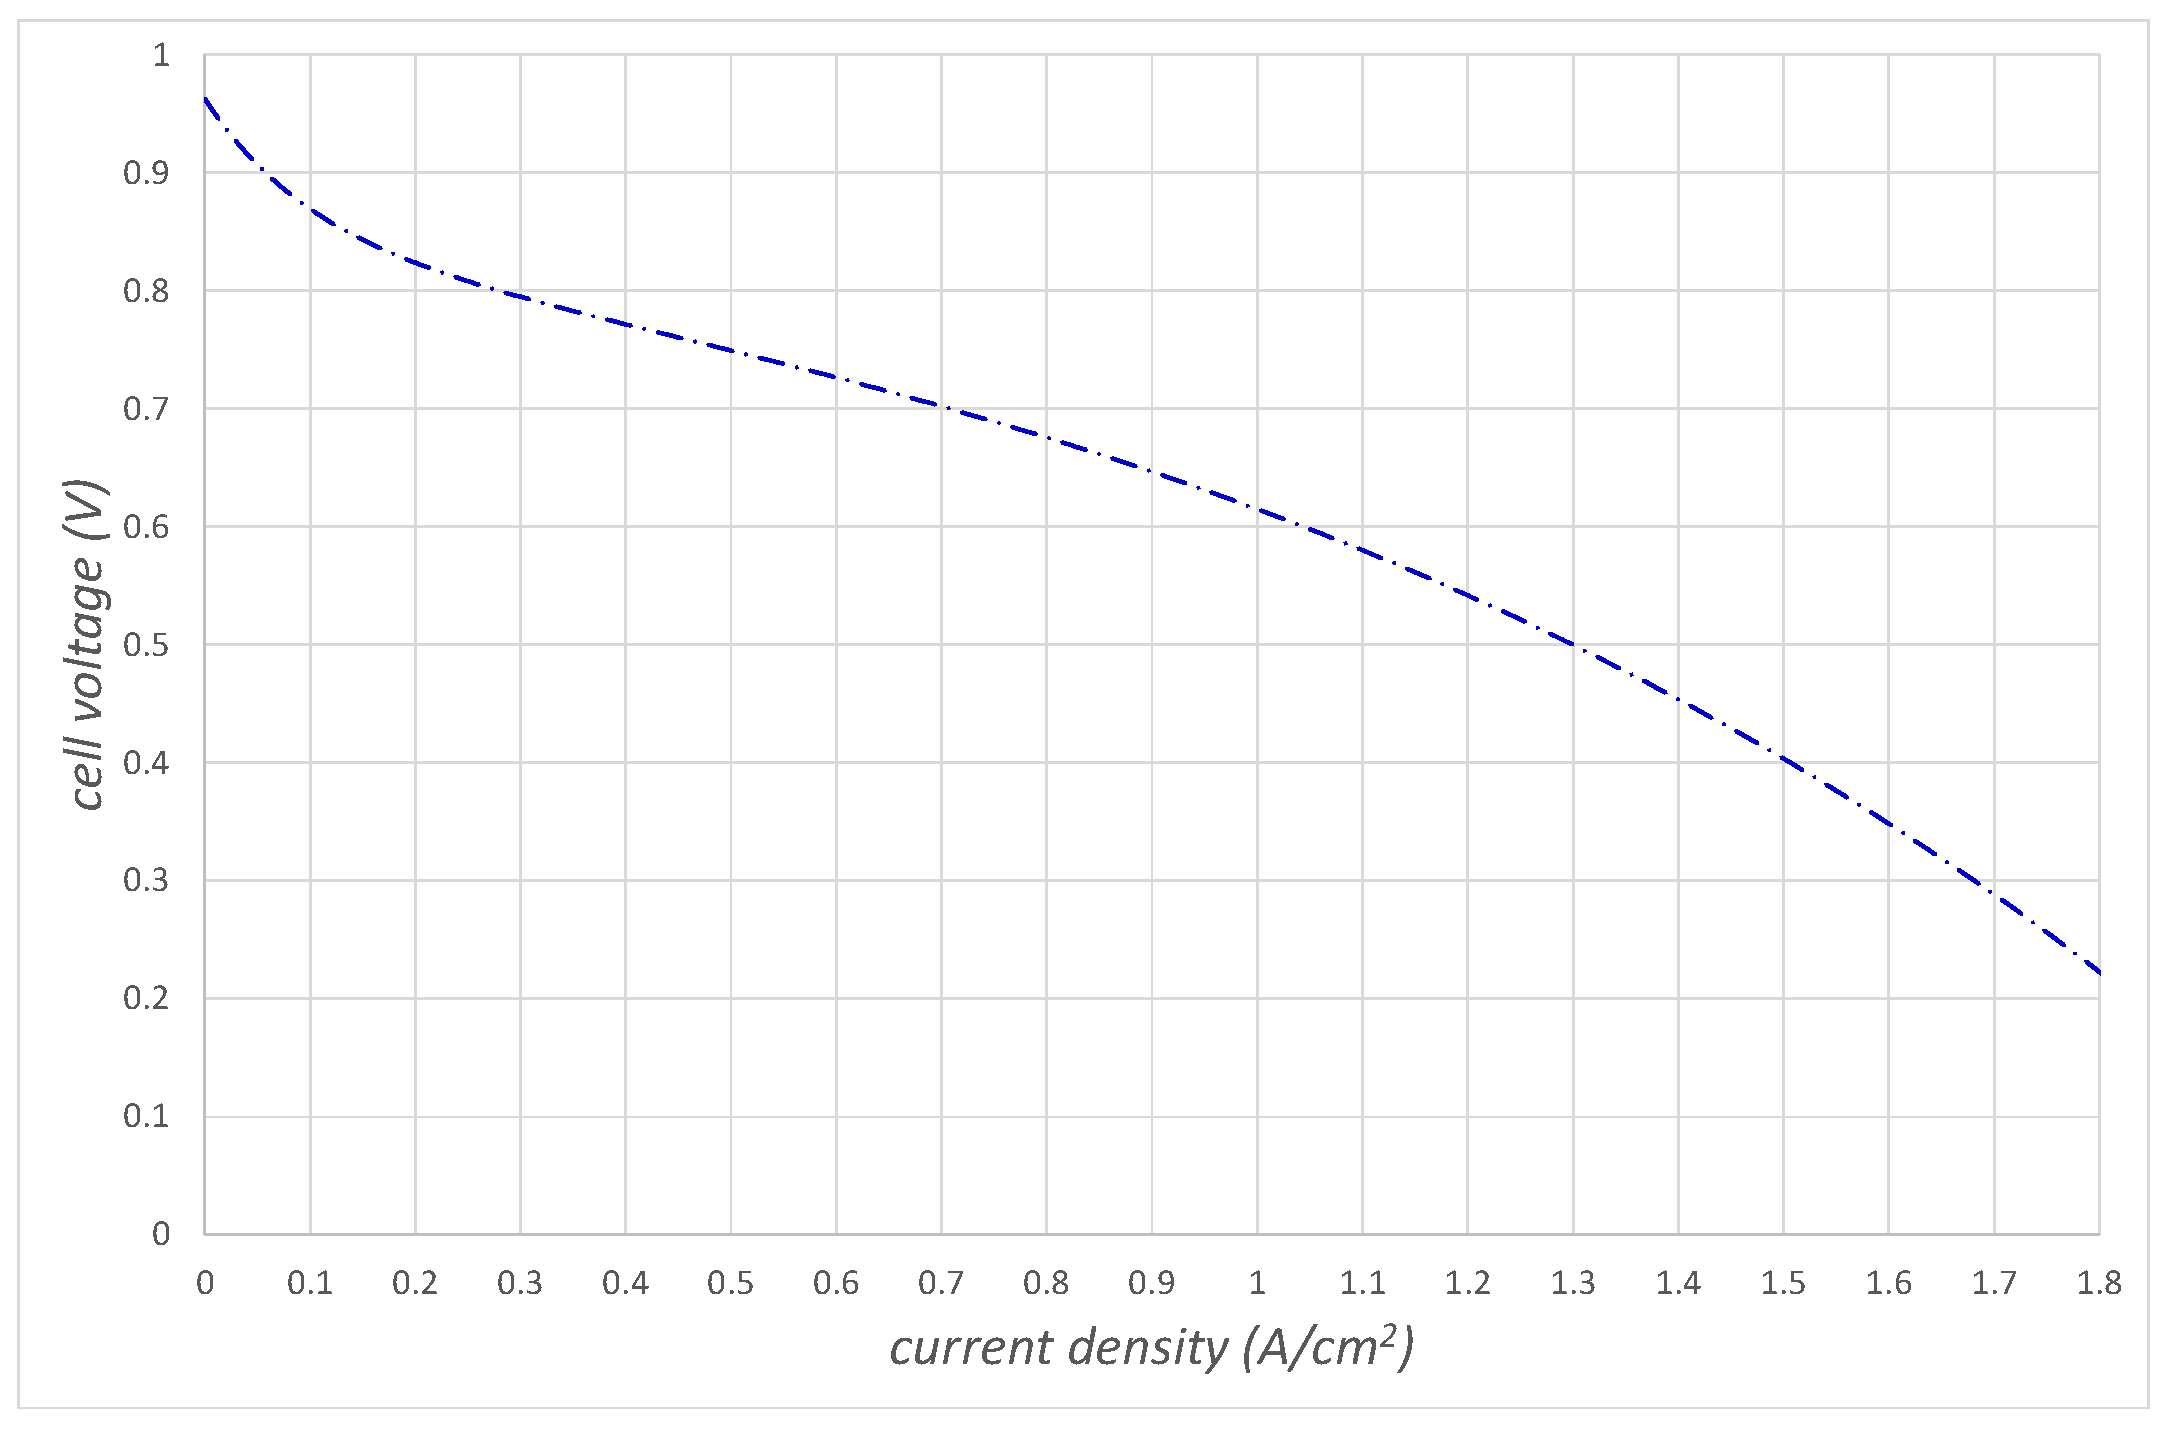
Figure 6 shows the cell voltage E f c as a function of the ionic current density, which we call the polarization curve, when we subtract these losses from the open cell voltage:
E f c = E o c η a η Ω η c .
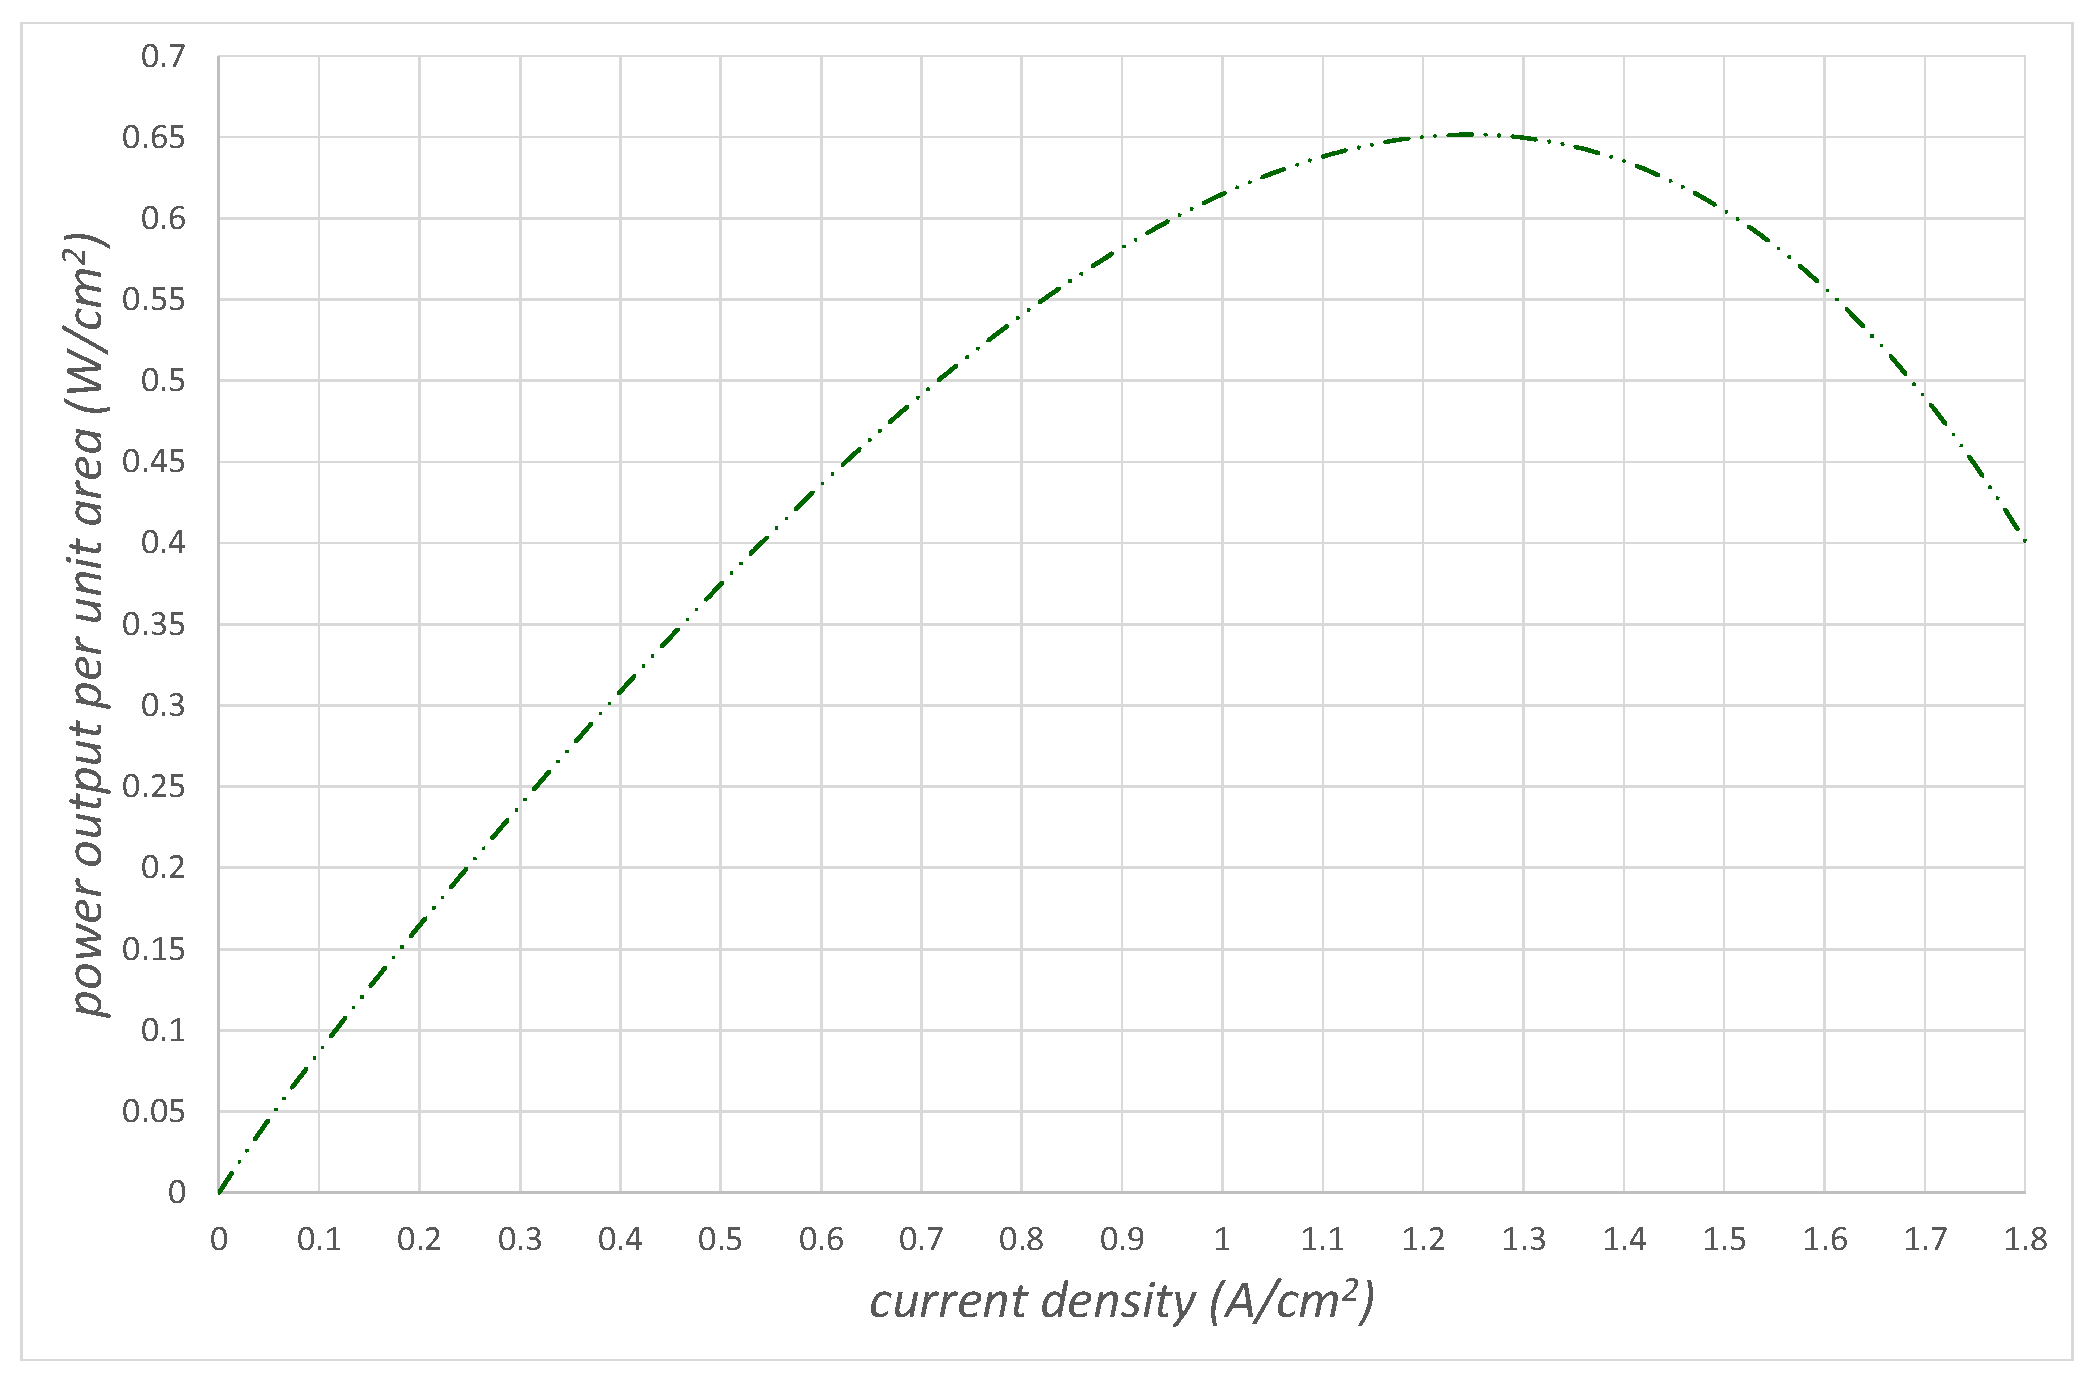
To generate these detailed curves, in this work, we have used the expressions for E o c , η a , η Ω , and η c found in [10]. Figure 7 shows the power produced by the fuel cell P f c , which is the product of E and j , again as a function of the ionic current density. The power climbs to a maximum when the ionic current density is j 1.25   A / c m 2 before dropping off.
It is important to realize that we can change the shape of the activation and concentration overvoltages by changing the pressure of the air entering the cathode side of the fuel cell. This can have a significant effect on the shape of the polarization curve (see Figure 6) and the power produced curve (see Figure 7).
Figure 8 shows the fuel cell stack as the heart of the powertrain. It typically operates at a temperature of around 80   ° C . Our fuel cell stack consists of 350 individual proton exchange membrane (PEM) fuel cells stacked side by side. The fuel cell stack’s voltage output V f c s is the sum of the voltages across each of the individual fuel cell voltages. The flow of electrons through the external circuit I ( ~ A ) is the product of the current density across the cell j ( ~ A / c m 2 ) (due to the flow of protons across the polymer membrane) and the cross-sectional area A ( ~ c m 2 ) of the proton exchange membrane, i.e., I = j A , to balance the net charge entering the cathode.
To estimate the mass flow rate of hydrogen, we note that there are Avogadro’s number of molecules in a mole of H 2 , while there are two protons and two electrons in a hydrogen molecule. There are therefore 1.20 × 10 24 electrons in a mole of hydrogen. If we multiply this by the charge on each electron, we obtain the charge liberated by a mole of H 2 at 192,971   C / m o l . This is twice the value of the Faraday constant.
If our fuel cell operates at a current density of j = 0.65   A / c m 2 in cruise and A p e m = 640   c m 2 , then the current it produces is 416   A or C / s . We can find the molar flow rate of H 2 by dividing this current by the charge liberated by a mole of H 2 . If we multiply this value by the molecular mass of H 2 , we obtain the mass flow rate of H 2 per cell. As there are 350 cells, the mass flow rate of H 2 is 1.521   g / s or 5.48   k g / h :
m ˙ H 2 = M H 2 N c 1000 n F j A p e m = 3.66 × 10 6 j A p e m .
As our aircraft can initially store 14   k g of hydrogen, its endurance is just over 2.5 h.
The mass flow rate of air required for stoichiometric conditions is therefore as follows:
m ˙ a i r s = A F m a s s m ˙ H 2 = 0.0109 k g s .
The power required to compress this air from 0.540 bar at the service ceiling up to 2.5 bar is therefore as follows:
W ˙ c o m = m ˙ a i r s c p T 2 a T 1 = m ˙ a i r s c p T 1 η c r p k 1 k 1 = 2.20   k W .
At 4   b a r , this power goes up to 3.10   k W .
Figure 9 shows the efficiency of the fuel cell stack system η f c s , which is equal to:
η f c s = V f c s j A p e m N s E r e v j A p e m N s + P c o m ,
where P c o m is the external battery power that drives the air compressor (see [11]). The power that the battery provides to the compressor and the heat exchanger determines the extent to which we reduce the efficiency of the fuel cell stack system. These maxima occur at higher current densities as the battery power requirement increases.
In practice, we would like to run the fuel cell stack close to these maxima when the aircraft cruises near its design point. In doing so, it might be possible for the fuel cell system to operate when the aircraft cruises at an efficiency more than double that of an internal combustion engine running of AVGAS.
We can use the energy lost from both the fuel cell stack to promote the evaporation and subsequent heating of the cryogenic LH2, as its temperature needs to be the same as that of the fuel cell stack prior to entering the stack. At full power conditions for cruise, we estimate (see Table 3) that the power required will be 145.6   k W . The efficiency of the fuel cell stack under these conditions is 42.5 % . Therefore, the energy lost from the fuel cell stack is 197.0   k W . We estimate that the mass flow rate of hydrogen is 0.00286   k g / s ( 0.0205   k g / s   a i r ).
For hydrogen at 1.0   bar of pressure, the change in specific enthalpy required to change the hydrogen from a saturated liquid to a saturated vapor is h f g H 2 = 449   k J / k g . Therefore, the rate at which we transfer heat to the saturated liquid to change it to saturated vapor is as follows:
Q ˙ f g = m ˙ H 2 h f g H 2 = 0.683   k W .
To further raise the temperature of the hydrogen to 350   K ( 76.9   ° C ), we estimate from the data on the specific heat capacity of normal hydrogen (NIST) that the change in enthalpy of the hydrogen is 4231   k J / k g .
Q ˙ T = m ˙ H 2 h T H 2 = 6.44   k W .
The energy required through heat transfer to the cryogenic hydrogen to raise it to a suitable temperature to enter the fuel cell stack is therefore 7.12   k W . This represents a 9 % of the waste energy that we need to remove from the fuel cell stack.
Note also that we must keep the proton exchange membranes of each individual fuel cell humid to prevent permanent damage to the membranes, so a humidifier to humidify the hydrogen and air is a necessary component. Figure 8 shows that we supply the humidifier with the water that is a product of the hydrogen–oxygen reaction in the fuel cell stack. Our water tank can be located so that it is passively heated by waste heat from the stack to prevent icing.

4.3. Thermal Efficiency and Heat Dissipation

At cruise, the powertrain needs to transfer P = 100   k W of shaft power to the electric motor. The current density of the fuel cell stack will be set to j = 0.65   A / c m 2 , so the efficiency of the fuel cell stack will be η f c s = 0.56 (we ignore the boost controller efficiency). Therefore, we need to dissipate P Q = P / η f c s P s = 78.6   k W of heat to the surroundings. We have already determined that we will require 7.12   k W of power to evaporate saturated liquid hydrogen and heat it to 80     ° C . Therefore, we will need a radiator to dissipate the remaining 71.5   k W at cruise.
We will demonstrate at the end of this section that this is possible. However, if we can only dissipate this amount of power, we should limit the operation of the fuel cell to a current density of less than j = 0.65   A / c m 2 . This means that we cannot use the fuel cell to produce the “excess power” required for climb/maneuver. However, we can use the energy stored in the batteries to provide the “excess power” required for climb/maneuver.
Rechargeable lithium-ion batteries packs (as distinct from battery cells) currently have a gravimetric specific power of 0.45   k W / k g [12,13] and a gravimetric specific energy of 0.175   k W h / k g or 630   k J / k g . As we are carrying 80   k g of lithium-ion batteries, our batteries should be able to supply 36   k W of power to the system for 1400   s or 23 min and 20 s. Therefore, battery power will save us from having to run the fuel cell stack too hard.
Ideally, our aircraft can operate anywhere between sea-level at 0   m and the service ceiling at 5000   m . Compared to their sea-level values, at the service ceiling, the local temperature can drop by nearly 20   ° C , while the local atmospheric static pressure can drop by 47.3   k P a . The local air density will drop from 1.225   k g / m 3 to 0.7361   k g / m 3 , which means that at a given airspeed, the mass flow rate of a duct of fixed area (and hence the cooling power of the air) will drop by 40 % at the service ceiling. The saturation temperature of water is 99.6   ° C at sea-level and 83.2   ° C at the service ceiling.
Now, our fuel cell stack should not operate above 80     ° C , as the materials involved cannot cope with higher temperatures. Therefore, the water produced by the fuel cell stack always exits the fuel cell stack as a condensed liquid, even at the service ceiling. We can use this product water to humidify the fuel cell stack. However, our ability to cool the fuel cell stack with this product water is limited, owing to the fact that it cannot reach its saturation temperature.
The mass flow rate of the product water will be as follows:
m ˙ H 2 O = j   A p e m M H 2 O N c 1000 n F = 0.816 l m i n .
A small battery-powered pump could spray this water to aid the cooling process in short bursts when deemed necessary. Note that the cooling effect of this water is m ˙ H 2 O   h f g = 31.4   k W . For our fuel cell stack, we need to cool the coolant water, the air entering the fuel cell stack and coolant from the electrical motor, and if necessary, the boost controller.
Ref. [14] examined five different configurations of radiators used in the side pods of Formula One cars. These radiators cool water, oil, and charge air (from the turbocharger). The results of [14] suggest that at a mass flow rate of air at 1.73   k g / s , these radiator configurations dissipate between 90   k W and 125   k W of power from the best configuration (con 1) to the worst configuration (con 2). The cooling demands of fuel cell aircraft are similar to the demands of a Formula One car.
The cross-sectional area of a Formula One radiator is approximately A r a d = 0.15   m 2 . If we utilize a radiator of this size and divide the radiator in two to form a vee, we have an area for each radiator of 0.075   m 2 . The size of the radiator inlet is 0.125   m 2 . Dividing by two, we obtain an inlet area for each radiator of 0.0625   m 2 , so the area ratio for each duct will be 1.20 . Please note that this radiator size was already considered in Section 3 above.
Negating the effects of the propeller wake, the mass flow rate of air approaching each radiator inlet at cruise speed of V = 38   m / s and at an altitude corresponding to the service ceiling of 5000   m ( ρ = 0.7361   k g / m 3 ) is m ˙ r a d = ρ A V = 1.73   k g / s . Given that we need to dissipate 71.5   k W under these conditions, our radiators should be sufficient. To reduce the load on the coolant, we will place fins on all the fuel cell stack surfaces to increase the dissipation of energy to the surrounding air. To reduce the size of the radiator, one approach is to run the coolant through a heat pump. The heat pump compressor raises the pressure of the coolant. The coolant flows through the condenser radiator, which causes the refrigerant to condense first to a saturated vapor and then to a saturated liquid. We throttle the coolant in an isenthalpic process until it reaches the fuel cell stack (or evaporator) temperature and pressure. The azeotropic coolant causes the temperature of the fuel cell stack to remain constant 353.15   K   ( 80     ° C ) , while the temperature of the refrigerant drops by a small amount before the phase of the refrigerant changes from liquid to saturated vapor. This approach is heavy, but a more detailed analysis will be required to assess this.

4.4. DC/DC Boost Converter

The design propeller speed for our light aircraft is set at 2400   r / m i n , which is normal for this class of aircraft. The back electromotive force is likely to be in around 500   V , which means that the motor voltage must be greater than 500   V . The problem is that V f c s is often lower than half of this voltage depending on the operating point of the fuel cell stack.
Transformers step-up and step-down the voltages of alternating currents. An inverter can convert the direct current into an alternating current, the transformer can step-up the voltage, and a rectifier can convert the output alternating current into a direct current. We call such a converter an isolated DC/DC boost converter. Such a boost controller is likely to be very heavy [15], so a non-isolated DC/DC boost converter is a better option. Figure 10 shows the most basic type.
The MOSFET shown in Figure 10 is a very high-speed switch. A pulse width modulator (PWM) gate driver controlled by a feedback mechanism activates this switch. The MOSFET has a cycle time denoted as t c y c . The time period over which the signal switches the MOSFET “on” is t o n . The time period over which the signal switches the MOSFET “off” is t o f f . We define the duty cycle as β = t o n / t c y c l e .
Neglecting losses, in steady-state operation:
V o u t = 1 1 β V i n ,
and:
I o u t = V i n V o u t I i n = 1 β I i n ,
so that the power exiting the circuit is equal to the power entering the circuit. The longer the duty cycle, the greater the voltage gain, but the longer the MOSFET has to cope with the input current.
The simple DC/DC boost converter circuit contains an inductor and a capacitor. Inductors store energy within a magnetic field, and capacitors store energy within an electric field. In steady-state operation, the rate at which the capacitor transfers energy to the electric motor is equal to the rate at which the inductor transfers energy to the capacitor.
What follows refers to steady-state operation. After start-up, V m increases with respect to V f c s until V m / V f c s = G , where G is a specified gain. This happens quickly in practice. Note that the higher the gain, the higher the value of V m that can be applied to the electric motor for a given V f c s , or the lower the value of V f c s for a given value of V m . This could lead to a reduction in the number of fuel cells required in the stack.
When the MOSFET is on, the inductor’s magnetic field stores energy. Meanwhile, the energy stored within the capacitor’s electric field drives the electric motor. For our aircraft, as G   2.5, the voltage on the cathode side of the diode is very much higher than on the anode side, so no current flows across the diode. When the MOSFET is off, the collapse of the inductor’s magnetic field induces a high voltage across the inductor. In steady-state operation, the voltage across the inductor is approximately V e m V f c s . The collapse of the inductor’s magnetic field produces a high voltage, which allows current to flow through the diode, thus enabling its energy transfer to the capacitor.
Figure 11 shows a more sophisticated two-phase interleaved boost controller. An interleaved boost controller can have multiple phases. The Toyota Mirai uses a four-phase interleaved boost controller [15]. The advantage of interleaving is that it reduces the time period over which the input current passes through any individual MOSFET.

4.5. Battery Pack

Lithium-ion battery packs suitable for aircraft (and for automotive applications) can contain hundreds or thousands of individual lithium-ion cells. They also require a container, electrical conductors to connect all the cells, an electrical management system, and a thermal management system. As a consequence of all this extra weight, the gravimetric specific power of lithium-ion battery packs is around 27 % of lithium-ion cells (see [12]).
We require a thermal management system to ensure that the battery pack remains between 15     ° C and 35     ° C and that the temperature difference between the highest and lowest temperature cell does not exceed 5     ° C [16]. These tight temperature limits promote battery life and sustainability. If the thermodynamic management system fails completely then thermal runaway can cause an exponential increase in battery cell temperature and a catastrophic failure of the battery pack.
In 2012, [13] suggested that the gravimetric specific energy of lithium-ion batteries would reach 150   W h / k g by 2015 and 200   W h / k g by 2025. By comparison, Formula E (Gen2) (2018–2021) battery packs have a gravimetric specific energy 141   W h / k g . Ref. [13] also suggested that the gravimetric specific power of lithium-ion batteries would reach 400   W / k g by 2015 and 500   W / k g by 2025. By comparison, Formula E (Gen2) (2018–2021) battery packs have a gravimetric specific power 520   W / k g . These values for gravimetric specific energy and gravimetric specific power are low.

4.6. The Electric Motor

Old-fashioned brushed DC motors rely on mechanical commutation, whereas brushless DC motors use electronic commutation. The brushless DC motor is therefore more dependable than the brushed DC motor, as the brushes wear over time. Wilson & Trickey invented the brushless DC motor in the early 1960s [17] after the invention of the transistor in the late 1940s made high-speed switching of electrical currents possible.
The brushless DC motor consists of a rotor incorporating permanent magnets and a stator which holds multiple coils (sometimes interconnected), which we call stator windings. The rotor is responsible for the transfer of rotational work from the machine, while the stator is attached to the motor’s frame.
Most brushless DC motors employ three-phase inverter systems and make use of three half-bridge circuits. We can connect the three windings in star or delta arrangements, but most prefer the star arrangement as it allows for lower currents. Each half-bridge contains two high-speed switches, one on the high side and the other on the low side of the electrical input. In Figure 12, we show these switches as metal oxide silicon field effect transistors (MOSFETs), as they can manage higher currents than transistors.
Most brushless DC motors use Hall-effect sensors to enable the controller to know the rotational position of the rotor. Based on this knowledge, the controller signals the correct high and low-side MOSFET drivers to direct current to the appropriate stator windings. As the rotor turns, the sensors continually update the controller on the rotor position so that it can change which of the high and low-side MOSFET drivers to signal. By doing this, the stator windings create a magnetic field that rotates around the axis of the machine.
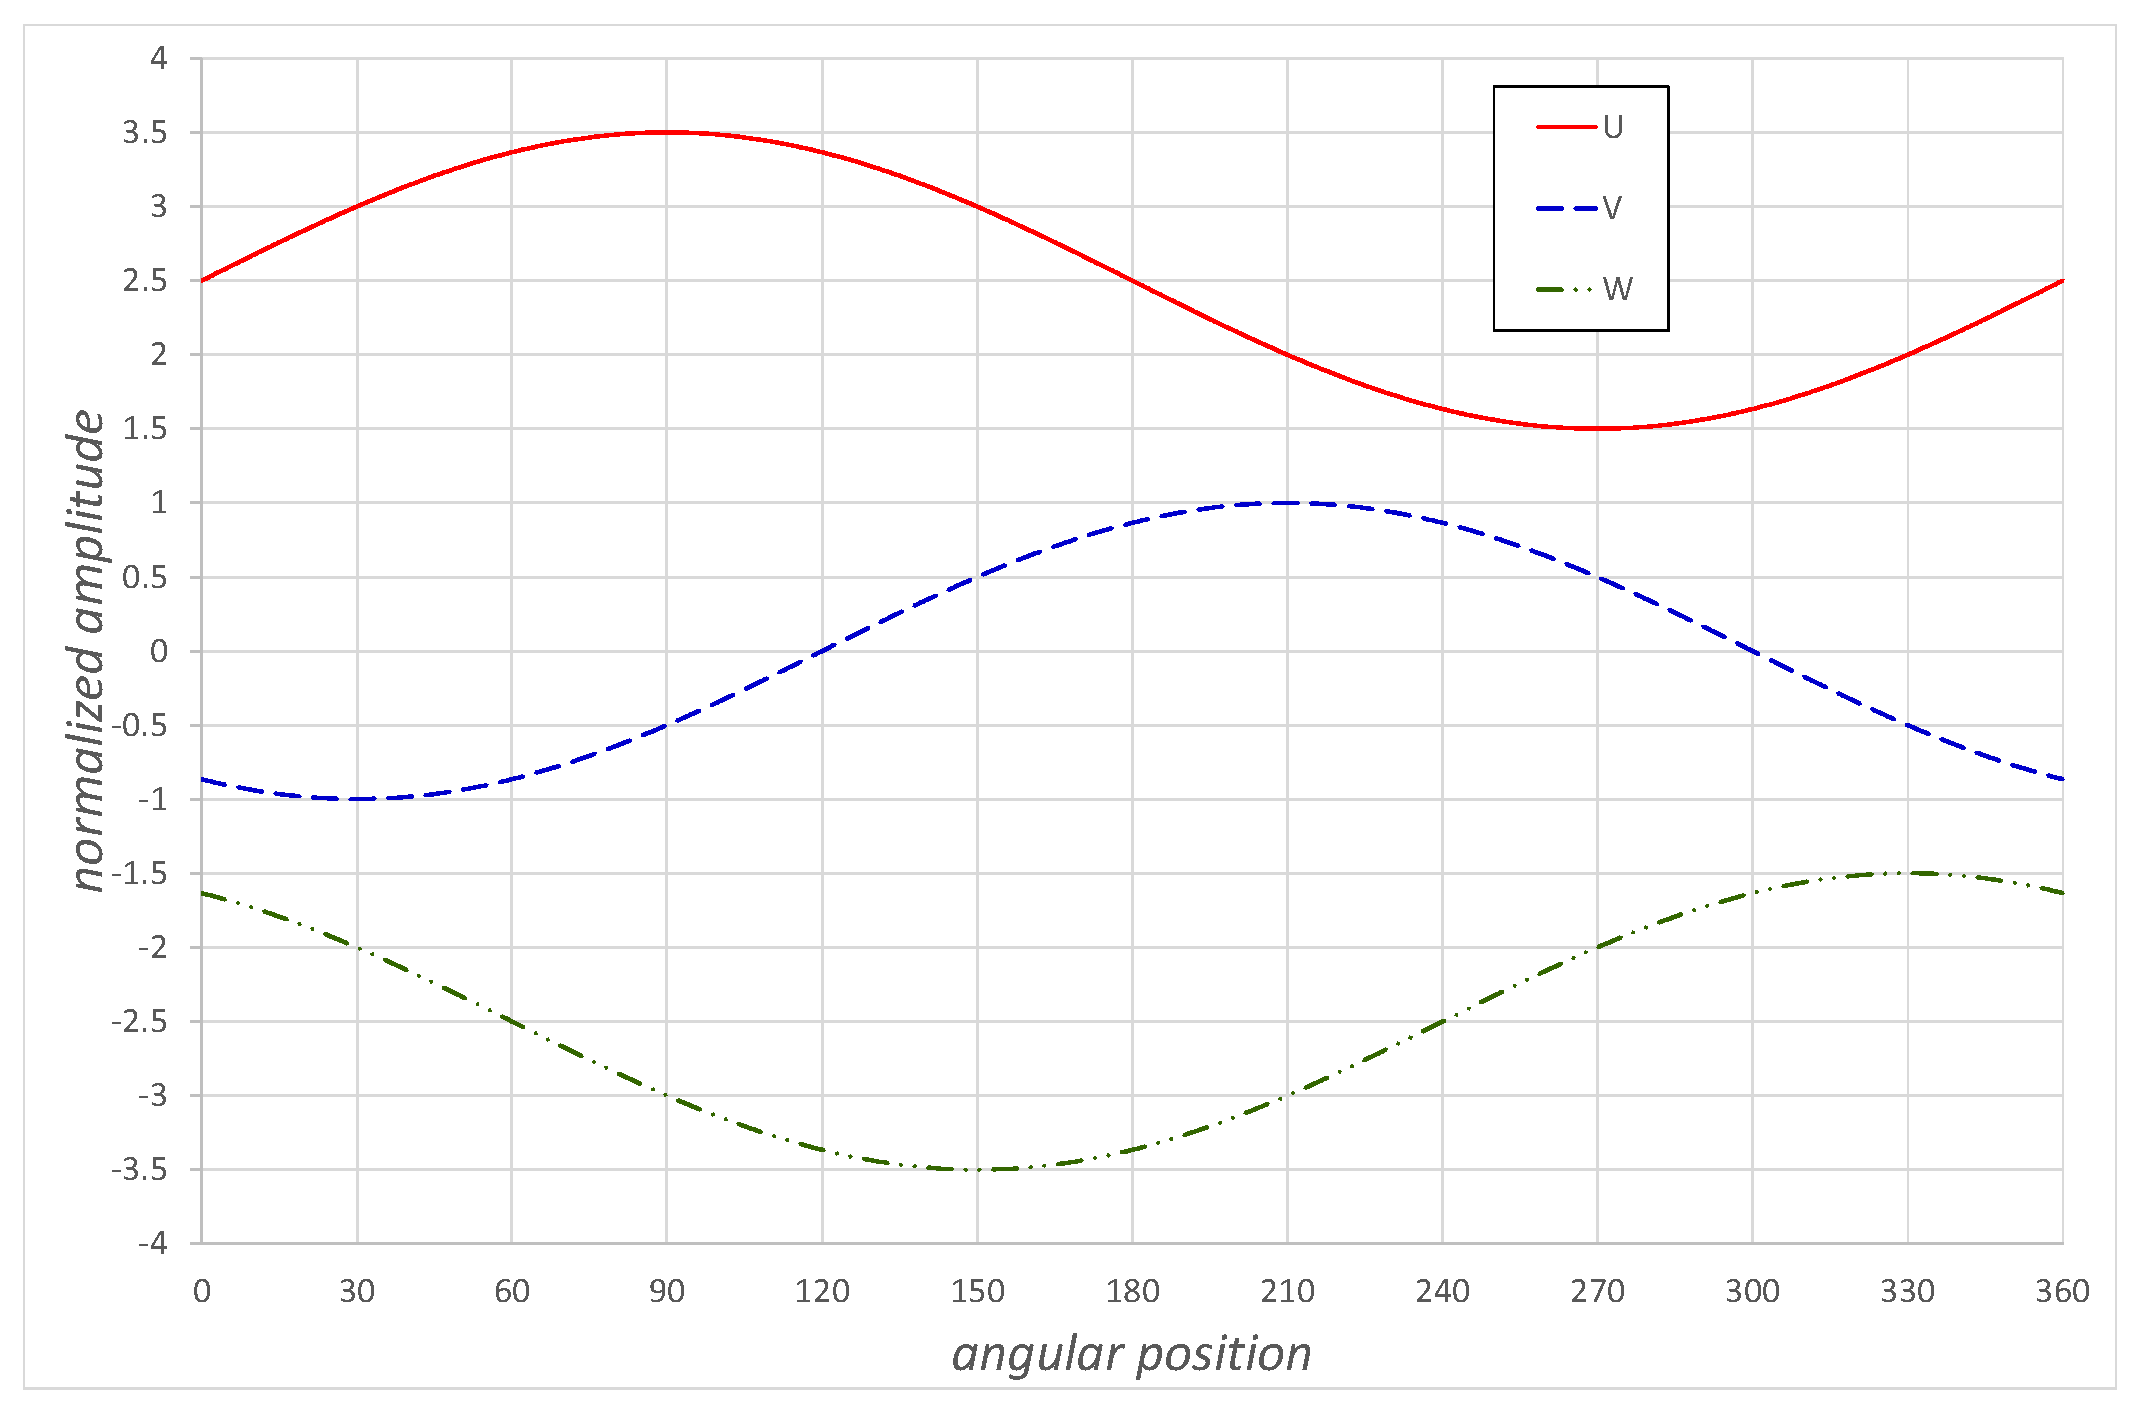
If we opt for trapezoidal control (see Figure 13), the rotation of the magnetic field is not continuous but discreetly jumps. It is associated with torque output ripple, which may be detrimental when driving a propeller. If the propeller has a high rotational inertia, it may not affect the airflow in the vicinity of the blades but could cause propeller shaft fatigue problems. If the propeller has a low rotational inertia, it could cause the airflow to separate multiple times during each revolution. Pulse width modulation can reduce the voltage applied to the stator windings from that applied between the high-side and low-side voltages and is often employed to the high-side MOSFETs.
If we opt for sinusoidal control (see Figure 14), we can expect negligible torque ripple, thus overcoming these problems. However, we need to know the spatial resolution rotor to a much greater extent for the triangular wave. This is also a form of pulse width modulation (see ref. [18]).
Forces of attraction between “unlike” magnetic poles across the rotor and stator and forces of repulsion between “like” poles across the rotor and stator create a turning force that enables the rotor to synchronize with the rotating magnetic field. We maximize this turning force when the rotating poles of the magnetic field and the permanent magnetic field are perpendicular. Thus, the timing currents fed to the stator windings are such that they initiate 60 degrees before these fields become perpendicular.
The synchronous (or rotor shaft) speed of a brushless DC motor (in r / m i n ) is:
N s = 120 f p ,
where p is the number of poles on the rotor and f is the frequency of the alternating current supplied to the stator windings (or electromagnets). Alternatively, we can write:
N s = 60 f p p ,
where p p is the number of pole pairs on the rotor. Therefore, for example, if the stator windings operate at a frequency of f = 40   H z , a two-pole machine, i.e., p = 2 ( p p = 1 ) will turn at N s = 2400   r / m i n . Similarly, if the stator windings operate at a frequency of f = 80   H z , a six-pole machine, i.e., p = 4 ( p p = 2 ) will also turn at N s = 2400   r / m i n .
The ideal type of brushless electric motor required for our aircraft is one that has a high power density, high efficiency, high heat dissipation characteristics, and negligible torque ripple. The main candidates are the radial flux, brushless direct current motor, and the axial flux brushless direct current motor. The direction of the magnetic flux lines differentiates these two machines. In the radial flux variant, the magnetic flux lines point in the radial direction with respect to the rotational axis of the machine, whereas in the axial flux machine, the magnetic flux lines point perpendicular to the axis of the machine.
Ref. [19] compares both radial flux and axial flux brushless direct current motors. They compare two types of radial flux brushless DC motors, namely slotted and unslotted. They also compare six types of axial flux brushless DC motors, namely single-stator, single-rotor, single-stator, double-rotor (SSDR or TORUS), double-stator, single-rotor (DSSR), slotted, and unslotted. They do not mention the multi-stator, multi-rotor (MSMR) machines, but they are outside the scope of this work and are meant more for a high-speed aircraft like the Rolls Royce “Spirit of Innovation” [20].
Ref. [19] rates the single-stator, double-rotor (SSDR) axial flux BLDC machine “highest” under the categories of power density, efficiency, and torque ripple and “normal” for heat dissipation. It is the best type of motor for our aircraft.
Note that the power output of an electrical motor is independent of the local air density and hence altitude, unlike a reciprocating-piston, spark-ignition, internal combustion engine, which struggles to breathe at high altitudes. This is a major advantage of electrical motors, which has the potential to significantly increase the aircraft’s flight ceiling, or in our case, increase the power available at the existing flight ceiling. The air density at altitude limits cooling.

4.7. The Variable Pitch Propeller

Our aircraft will be propelled by a variable-pitch propeller that rotates at a constant angular velocity, namely ω = 251.3 r a d s , which corresponds to n = 2400   r / m i n under all flight conditions, e.g., take-off, climb, cruise, turn, descend, and landing. The electric motor provides this constant rotational speed. The advance ratio J = V / n D , where V represents airspeed and D is the propeller tip diameter, specifies these different flight conditions.
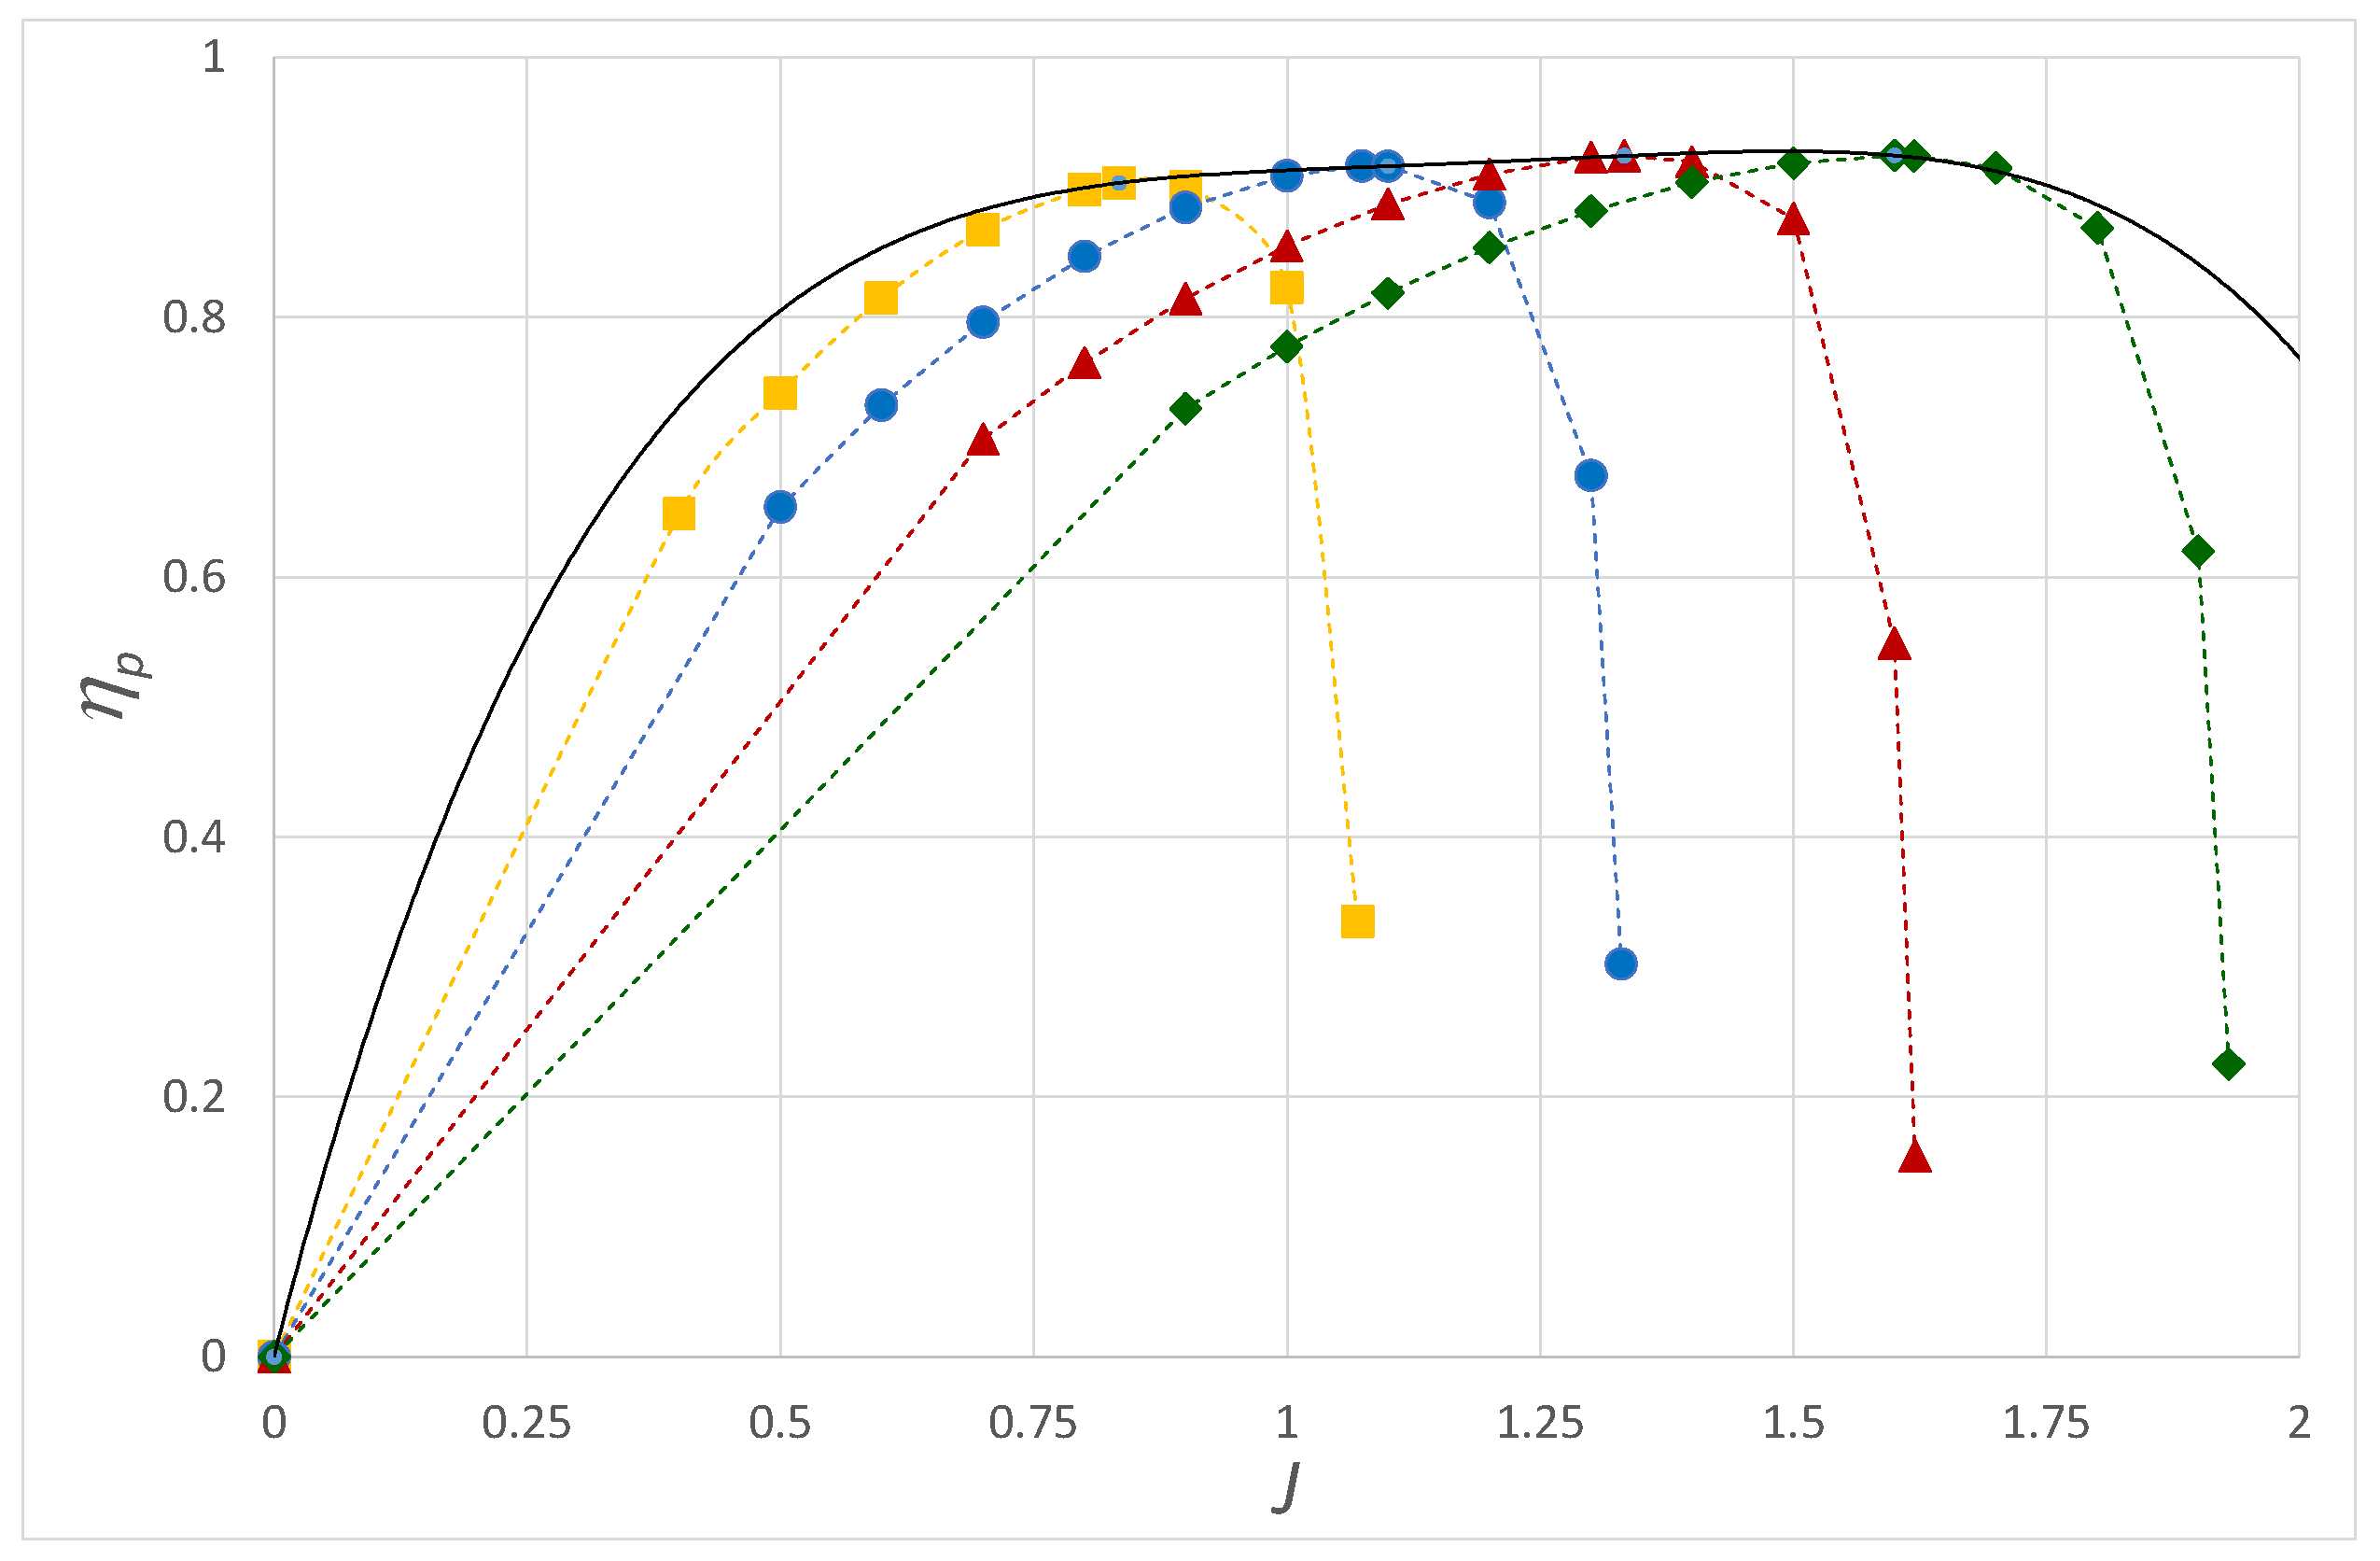
Figure 15 shows that the propulsive efficiency of a propeller blade with a fixed geometric pitch angle is a function of J . As J increases, the propulsive efficiency increases, reaching a maximum and then rapidly decreasing. J changes during flight, which means that if we use a fixed-pitch propeller, we are not always maximizing our propulsive efficiency η p .
The figure shows four fixed geometric propeller pitch angles, i.e., 20 ° , 25 ° , 30 ° , and 35 ° , measured at 75 % of the blade radius. There is a locus of points for each geometric blade angle β which connects each geometric blade angle’s η p ,   m a x with the advance ratio J . Typically, a sixth-order polynomial is sufficient to connect this locus of points, giving us an equation which expresses η p ,   m a x as the subject of J and hence V . If we can vary the geometric pitch of our propeller blades by rotating them during flight, we can maximize our propulsive efficiency η p for any chosen advance ratio.
The power made available at the propeller P a v to match the power required by the aircraft is equal to the product of the power absorbed by the propeller P p (or the motor output shaft power P m , o u t ) and the propulsive efficiency.
P a v = η p P p = η p P m , o u t = η p η m   P m , i = η p η m V I .
Once we specify the number B and geometry of the propeller blades, we can calculate the power absorbed by the propeller for a given geometric blade angle β . And as we will know J and η p , we can calculate the power available at the propeller (see [21]).

4.8. Connecting Together

The power available at the propeller must match the power required by the flight conditions. The DC voltage applied to our motor V m is the sum of the back electromotive force E and the voltage drop due to resistance in the motor, which is equal to the product of the current flowing through the motor and the motor resistance, i.e., I m R . Therefore:
V m = E + I m R .
The electromotive force is the product of the angular velocity ω of the rotor and the motor constant k :
E = k ω .
The power produced by the motor P m , o u t is:
E I m = V m I m I m 2 R .
where P m , o u t = E I m = τ ω , where τ is the torque load placed on the machine. The torque load is the product of the current flowing through the motor and the motor constant k :
τ = k I m .
The power applied to the motor is P m , i = V I m , and power dissipated to the surroundings by the motor is P d i s s = I m 2 R . The efficiency of the motor η m is as follows:
η m = E V m = E I m V m I m = V m I m I m 2 R V m I m = 1 I m R V m = 1 1 + R k ω I m .
We will examine two operating conditions, the maximum power for take-off/climb and the cruise power. Table 3 shows this examination. We have set the fuel cell operating conditions (see Figure 7). We are not trying to control the fuel cell, but instead, we show how we can use it to achieve the desired results. The control problem will be for a later publication.

5. Conclusions

In this work, we have endeavored to explain the workings of a fuel cell aircraft operating on cryogenic hydrogen to non-electrical engineering specialists and to non-aerospace engineering specialists.
This work is our first attempt at retrofitting (at least on paper) an existing light aircraft powered by an internal combustion engine as a fuel-cell aircraft.
This work indicates that this retrofitted fuel cell aircraft has a lower weight than the original aircraft by 4.68 % .
The movement of the center-of-gravity of the retrofitted fuel cell aircraft is very small ( 5   m m forwards), as all the hydrogen fuel is consumed.
The power made available to the propeller at sea-level is the same for both aircraft, but as the power output of the electrical motor is independent of altitude (which is not the case for an internal combustion engine whose shaft power drops off with altitude) suggests that the performance of the retrofitted aircraft is superior.
The range and endurance of the retrofitted aircraft is acceptable, at approximately 70 % of the original aircraft, due to the lower amount of energy stored in the hydrogen cylinder. However, further work could reduce this difference.
Finally, it was found that ensuring that enough heat could be transferred from the fuel cell stack was probably the most difficult aspect of the retrofit. The reduction in the local air density at altitude limits the ability of the radiators to transfer heat from the fuel cell stack to the surroundings, so the service ceiling has not been increased.

Funding

This research received no external funding.

Data Availability Statement

The original contributions presented in the study are included in the article, further inquiries can be directed to the author.

Conflicts of Interest

The author declares no conflicts of interest.

References

  1. Lapeña-Rey, N.; Mosquera, J.; Bataller, E.; Ortí, F. First Fuel-Cell Manned Aircraft. J. Aircr. 2010, 47, 1825–1835. [Google Scholar] [CrossRef]
  2. Bradley, T.H.; Blake, A.H.; Mavris, D.N.; Parekh, D.E. Development and Experimental Characterization of a Fuel cell Powered Aircraft. J. Power Sources 2007, 171, 793–801. [Google Scholar] [CrossRef]
  3. Trainelli, L.; Perkon, I. MAHEPA—A Milestone-Setting Project in Hybrid-Electric Aircraft Technology Development. In Proceedings of the MEA2019—More Electric Aircraft, Toulouse, France, 6–7 February 2019. [Google Scholar]
  4. Abu Kasim, A.F.B.; Chan, M.S.C.; Marek, E.J. Performance and Failure Analysis of a Retrofitted Cessna Aircraft with a Fuel Cell Power System Fueled with Liquid Hydrogen. J. Power Sources 2022, 521, 230987. [Google Scholar] [CrossRef]
  5. Klell, M. Storage of Hydrogen in Pure Form. In Handbook of Hydrogen Storage; Hirscher, M., Ed.; WILEY-VCH Verlag GmbH & Co. KGaA: Weinheim, Germany, 2010. [Google Scholar]
  6. Verstraete, D.; Hendrick, P.; Pilidis, P.; Ramsden, K. Hydrogen fuel tanks for subsonic transport aircraft. Int. J. Hydrog. Energy 2010, 35, 11085–11098. [Google Scholar] [CrossRef]
  7. Airplane Flight Manual DA40; Diamond Aircraft Industries GMBH: Neustadt, Austria, 2000.
  8. Bethoux, O. Hydrogen Fuel Cell Road Vehicles: State of the Art and Perspectives. Energies 2020, 13, 5843. [Google Scholar] [CrossRef]
  9. Petrovic, S. Electrochemistry Crash Course for Engineers; Springer Nature: Cham, Switzerland, 2021. [Google Scholar]
  10. Pukrushpan, J.T.; Peng, H.; Stefanopoulou, A.G. Control-Orientated Modeling and Analysis for Automotive Fuel cell Systems. J. Dyn. Syst. Meas. Control. 2004, 126, 14–25. [Google Scholar] [CrossRef]
  11. Bosch Yellow Jacket, Hybrid Drives, Fuel Cells and Alternative Fuels; Robert Bosch GmbH: Plochingen, Germany, 2008.
  12. Petrovic, S. Battery Technology Crash Course. A Concise Introduction; Springer Nature: Cham, Switzerland, 2021. [Google Scholar]
  13. Gerssen-Gondelach, S.J.; Faaij, A.P.C. Performance of batteries for electric vehicles on short and longer term. J. Power Sources 2012, 212, 111–129. [Google Scholar] [CrossRef]
  14. Salmon, P.; Könözsy, L.; Temple, C.; Grove, S. Numerical Investigation on Various Heat Exchanger Performances to Determine and Optimum Configuration for Charge Air Cooler, Oil and Water Radiators in F1 Sidepods. Appl. Therm. Eng. 2017, 117, 235–244. [Google Scholar] [CrossRef]
  15. Wang, H.; Gaillard, A.; Hissel, D. A Review of DC/DC Converter-Based Electrochemical Impedance Spectroscopy for Fuel Cell Electric Vehicles. Renew. Energy 2019, 141, 124–138. [Google Scholar] [CrossRef]
  16. Falcone, M.; Palka Bayard De Volo, E.; Hellany, A.; Rossi, C.; Pulvirenti, B. Lithium-Ion Battery Thermal Management Systems: A Survey and New CFD Results. Batteries 2021, 7, 86. [Google Scholar] [CrossRef]
  17. Mohanraj, D.; Aruldavid, R.; Verma, R.; Sathiyasekar, K.; Barnawi, A.B.; Chokkalingam, B.; Mihet-Popa, L. A Review of BLDC Motor: State of Art, Advanced Control Techniques, and Applications. IEEE Access 2022, 10, 54833–54869. [Google Scholar] [CrossRef]
  18. Hughes, A.; Drury, B. Electric Motors and Drives. Fundamentals, Types, and Applications, 4th ed.; Elsevier: Oxford, UK, 2013. [Google Scholar]
  19. Shao, L.; Navaratne, R.; Popescu, M.; Liu, G. Design and Construction of Axial-Flux Permanent Magnet Motors for Electric Propulsion Applications—A Review. IEEE Access 2021, 9, 158998. [Google Scholar] [CrossRef]
  20. Phillips, S. Rolls-Royce Breaks All-Electric Aircraft Speed Record. Autocar Magazine, 25 November 2021. Available online: https://www.autocar.co.uk/car-news/move-electric/rolls-royce-breaks-all-electric-aircraft-speed-record (accessed on 16 March 2024).
  21. Torenbeek, E.; Wittenberg, H. Flight Physics. Essential of Aeronautical Disciplines and Technology, with Historical Notes; Springer: Dordrecht, The Netherlands; Heidelberg, Germany; London, UK; New York, NY, USA, 2009. [Google Scholar]
Figure 1. Diagram adapted similar diagram found in the Diamond Aircraft, Airplane Flight Manual DA40 [7]. (a) motor (in green), (b) fuel cell stack (in green), (c) boost controller (in green), (d) battery 1 (in purple), (e) battery 2 (in purple), (f) hydrogen tank (in orange) and (g) radiators (blue). (The red dot is the tip of the propeller spinner).
Aerospace 11 00469 g001
Figure 2. (a) Permissible limits for the movement of the aircraft center of gravity represented by the blue lines and (b) mass versus load moment diagram [4].
Aerospace 11 00469 g002
Figure 3. Layout of powertrain.
Aerospace 11 00469 g003
Figure 4. The individual fuel cell.
Aerospace 11 00469 g004
Figure 5. The open cell voltage E o c and the three overvoltages η a , η Ω , and η c resulting from the irreversibility plotted against the cell’s current density.
Aerospace 11 00469 g005
Figure 6. The fuel cell voltage E f c output as a function of the fuel cell’s current density or polarization curve.
Aerospace 11 00469 g006
Figure 7. Fuel cell’s power density plotted against the cell’s current density.
Aerospace 11 00469 g007
Figure 8. Note that HX represents heat exchanger, R represents the regulator, C represents the air compressor, MOT represents the motor, HYD represents hydrogen, and EM represents the electric motor. The dash/dot line represents the open system boundary of the fuel cell/boost controller system.
Aerospace 11 00469 g008
Figure 9. The efficiency of the fuel cell and fuel cell system plotted against the current density.
Aerospace 11 00469 g009
Figure 10. Simple DC/DC boost controller.
Aerospace 11 00469 g010
Figure 11. A n = 2 phase interleaved boost converter (IBC). Toyota use a n = 4 phase IBC.
Aerospace 11 00469 g011
Figure 12. Schematic of brushless DC motor control.
Aerospace 11 00469 g012
Figure 13. Trapezoidal control power input.
Aerospace 11 00469 g013
Figure 14. Sinusoidal control power input.
Aerospace 11 00469 g014
Figure 15. Propeller efficiency η p vs. advance ratio J for four geometric blade angles, namely, squares, 20 ° ; circles, 25 ° ; triangles, 30 ° ; diamonds, 35 ° . We measure these at 75 % of the blade radius. The unbroken curve represents the maximum propulsive efficiency of the propeller at any chosen advance ratio.
Aerospace 11 00469 g015
Table 1. Aircraft component masses, volume, density, power, gravimetric power density and volumetric power density (where applicable). If the component is taken from the aircraft, there is a minus sign before the component. If the component is added from the aircraft, there is a plus sign before the component.
ComponentMassVolumeDensityPowerGravimetric Power DensityVolumetric Power Density
k g m 3 k g / m 3 k W k W / k g k W / m 3
− Engine 124 0.374 332 134 1.081 358
− AVGAS 109 0.152 717
Total removed 233 0.526
+ Fuel cell stack 65.7 0.0432 1520 134 2.04 3100
+ Battery pack 60 0.0230 2610 27 0.45 5800
+ Boost controller 15.9 0.0112 1420
+ BLDC motor 10.3 0.020 515 134 13.0 6700
+ Hydrogen tank and fuel 25 0.20070
+ Coolant system200.125160
Total added 176.9
Table 2. The center of gravity of the new aircraft with empty and full LH2 tanks. If the component is taken from the aircraft, there is a minus sign before the component. If the component is added from the aircraft, there is a plus sign before the component.
Component Mass   × Datum DistanceFull of LH2Result Mass   × Datum DistanceEmpty of LH2Result
k g . m k g . m
Existing C of G 1198 × 2.54 3042.92 1198 × 2.54 3042.92
− Engine 124 × 0.74 91.76 124 × 0.74 91.76
− AVGAS 109 × 2.63 286.67 109 × 2.63 286.67
+ Fuel cell stack 65.7 × 1.00 65.70 65.7 × 1.00 65.70
+ Battery pack 1 30 × 2.63 78.90 30 × 2.63 78.90
+ Battery pack 2 30 × 1.20 36.00 30 × 1.20 36.00
+ Boost controller 15.9 × 0.79 12.56 15.9 × 0.79 12.56
+ BLDC motor 10.3 × 0.58 5.97 10.3 × 0.58 5.97
+ Hydrogen tank and fuel 25 × 2.957 73.93 11 × 2.957 32.53
+ Coolant system 20 × 1.25 25.00 20 × 1.25 25.00
Fuel cell aircraft 1161.9 × 2.550 2962.55 1141.9 × 2.545 2921.15
Table 3. Basic data: n c = 350 , A p e m = 640   c m 2 , R e m = 0.12   Ω ~ 0.12 k g m 2 s 3 A 2 , k = 2.00   N m / A .
Maximum Power for Take-Off/ClimbCruise Power
At fuel cell V f c = 0.52   V and j = 1.25 A c m 2 V f c = 0.72   V and j = 0.65 A c m 2
From fuel cell stack V f c s = V f c   n c = 0.52 350 = 182   V V f c s = V f c   n c = 0.72 350 = 252   V
I f c s = j   A p e m = 1.25 640 = 800   A I f c s = j   A p e m = 0.65 640 = 416   A
P f c s = V f c s   I f c s = 182 800 = 145,600   W P f c s = V f c s   I f c s = 252 416 = 104,832   W
From boost controller β = 0.66 β = 0.5214
V e m = 1 1 β V f c s = 182 1 0.66 = 535.3   V V e m = 1 1 β V f c s = 252 1 0.5214188 = 526.5   V
I e m = 1 β I f c s = 1 0.66 800 = 272   A I e m = 1 β I f c s = 1 0.5214 416 = 199.1   A
At PMSM E e m = V e m I e m R e m = 535.3 272 0.12 = 502.7   V E e m = V e m I e m R e m = 526.5 199.1 0.12 = 502.7   V
ω = E e m k = 502.7 2 = 251.3 r a d s = 2400   r m i n ω = E e m k = 502.7 2 = 251.3 r a d s = 2400   r m i n
τ = k   I e m = 2 272 = 544.0   N m τ = k   I e m = 2 199.1 = 398.2   N m
To propeller P p = τ   ω = 544.0 251.3 = 136,722   W P p = τ   ω = 398.2 251.3 = 100,075   W
η e m = P p P e m = 136,722 145,600 = 0.939 . η e m = P p P e m = 100,075 104,832 = 0.955
Disclaimer/Publisher’s Note: The statements, opinions and data contained in all publications are solely those of the individual author(s) and contributor(s) and not of MDPI and/or the editor(s). MDPI and/or the editor(s) disclaim responsibility for any injury to people or property resulting from any ideas, methods, instructions or products referred to in the content.