Article

Activity Modeling and Characterization for Airport Bird Situation Awareness Using Avian Radar Datasets

1
School of Electronic Information Engineering, Beihang University, Beijing 100191, China
2
Research Institute of Civil Aviation Law, Regulation and Standardization, China Academy of Civil Aviation Science and Technology, Beijing 100028, China
3
School of Electronic and Information Engineering, Guangxi Normal University, Guilin 541004, China
4
Airport Research Institute, China Academy of Civil Aviation Science and Technology, Beijing 100028, China
*
Author to whom correspondence should be addressed.
Aerospace 2024, 11(6), 442; https://doi.org/10.3390/aerospace11060442
Submission received: 25 March 2024 / Revised: 20 May 2024 / Accepted: 27 May 2024 / Published: 30 May 2024

Abstract

:
Birds in airport airspaces are critical threats to aviation safety. Avian radar systems are effective for long-range bird monitoring and hazard warning, but their functionalities are confined to a short-term temporal scale. Spatial–temporal activity modeling and characterization for birds are not studied comprehensively from historical radar datasets. This paper proposes a radar data analysis framework to characterize bird activities as a long-term functionality complement. Spatial domain modeling initializes data mining by extracting reference spots for data filtering. Bird activities are quantified in the temporal domain. Activity degrees are utilized for periodicity extraction with the daily segment random permutation strategy. Categorical probabilities are calculated to interpret bird activity periodicity characters. Historical radar datasets collected from an avian radar system are adopted for validation. The extracted activity periodicity trends for diurnal birds present prominent consistency with artificial observation records. Migratory bird periodicity trends present a good match with ornithology understandings. A preliminary experiment is presented to indicate the possibility of predicting bird activity levels, especially for migratory birds.

1. Introduction

Developments of various airborne wildlife remote sensing solutions and systems have motivated the new field of aeroecology [1,2]. It characterizes the presence, behavior, and ecology of wildlife like birds, bats, and other fauna in low altitude airspaces. Radar is a representative sensor type in airborne wildlife remote sensing for its long-range detection and tracking, as well as all-weather working advantages. Radar systems could generate massive target detection and tracking datasets which contain abundant wildlife activity data. However, preliminary radar data analysis approaches like target counting, tracking, and identification are insufficient to generate intuitive and useful wildlife activity interpretations. Radar data modeling and mining methods within deeper layers [3,4,5] are necessary to maximize the application significance of radar datasets.
Birds are predominant noncooperative targets in low altitude airspaces. Bird strikes are representative aviation safety threats for their critical effect on the economy and human life loss [6,7,8,9]. Increasing bird strike accidents have motivated the development of avian radar systems and technologies. Representative avian radar systems like Merlin, Accipter, Robin, and CAST (China Academy of Civil Aviation Science and Technology) [10,11,12,13] were developed and validated for years in worldwide airports. These systems are based on real-time target tracking as well as bird strike hazard evaluations and provide bird location and biomass information in airport vicinities. These are considered short-term radar functionalities for bird situation awareness.
Short-term functionalities are unable to characterize bird activities and distributions in larger spatial–temporal contexts. These are considered as long-term radar functionalities which are helpful to elevate bird situation awareness capabilities. Existing avian radar datasets from many years of accumulation are not well utilized to characterize long-term bird activities [14,15,16]. New technologies are needed to explore latent bird activity trends and complement avian radar functionalities. Extracted bird activity information is useful for airport management staff to make timely and optimum management strategies. Moreover, comprehensive bird situation awareness is favorable for noncooperative intruder detections such as unauthorized drones. Drones have similar radar signatures to birds. It is challenging for avian radars to perform target identification. However, bird activity characters might provide references for drone identification since unauthorized drones could hardly imitate bird activities in the spatial–temporal domain. The “abnormal” presence of information of an unknown target could be utilized to assign other surveillance resources for further confirmation. Similar approaches are also applicable for other types of targets like bat swarms, which are still challenging in radar identification. Therefore, long-term functionalities from historical radar datasets are not only applicable for bird characterization but also constructive in airport airspace situation awareness for other types of unknown presences.
Some existing works attempt to model and characterize bird activities using avian radar datasets [17,18]. However, these methods are confined within independent spatial or temporal domains. For example, density heatmaps only utilize bird quantity information to interpret bird spatial distribution trends within a specific time window. Bird activity trends within the spatial–temporal domain are not reflected in an intuitive manner. Time-variant bird density heatmaps are not comprehensive enough to quantity bird activity variation patterns. Temporal variations in bird counts could interpret daily or seasonal bird activity patterns intuitively, but the description accuracy is adversely impacted by radar data quality, false targets, and bird activity uncertainties. Moreover, existing temporal variation depiction solutions are also confined within a specific spatial confinement. Bird quantity variation patterns among different regions could hardly be integrated to interpret bird activity trends at larger spatial scales.
The aim of our research is to characterize bird activities jointly in the spatial–temporal domain. Considering the importance of activity periodicity, this study is focused on bird activity periodicity modeling [19]. Spatial domain modeling is carried out by extracting reference spots. Bird activities are quantified by introducing activity degrees. Temporal periodicity characters are extracted from daily activity degree segments using fast Fourier transforms (FFTs). The categorical probability is derived from daily periodicity to quantify activities more precisely. Historical datasets from an avian radar system are taken to verify the proposed method. Reference spots are extracted within airport airspace to interpret diurnal and nocturnal bird activities. Artificial observation records and ornithology expert understanding are used to verify the extracted information. Good consistencies indicate the reasonability of the proposed data analysis model. A preliminary study about bird activity prediction is discussed with promising feedback.
This study is organized as follows. Section 2 introduces the experimental setup and bird activity characterization methods. Section 3 presents the bird activity periodicity extraction results and discussions for diurnal and nocturnal birds, respectively. Section 4 discusses the feasibility of bird-activity-level prediction based on a preliminary experiment. The conclusions are given in Section 5.

2. Materials and Methods

2.1. Experiment Setup

Radar data come from historical observation records of an avian radar system, as presented in Figure 1. The radar system works at the S band. The mechanical horizontal scanning antenna is mounted on a tower with adjustable heights. The vertical scanning antenna is mounted on the other tower at a fixed height. The system adopts solid-state amplifiers with a 0.4 KW peak power. Bird tracks are updated at a rate of 2.4 s. Bird detection, tracking, and collision risk evaluation models are integrated within the system to provide real-time visualization functionality.
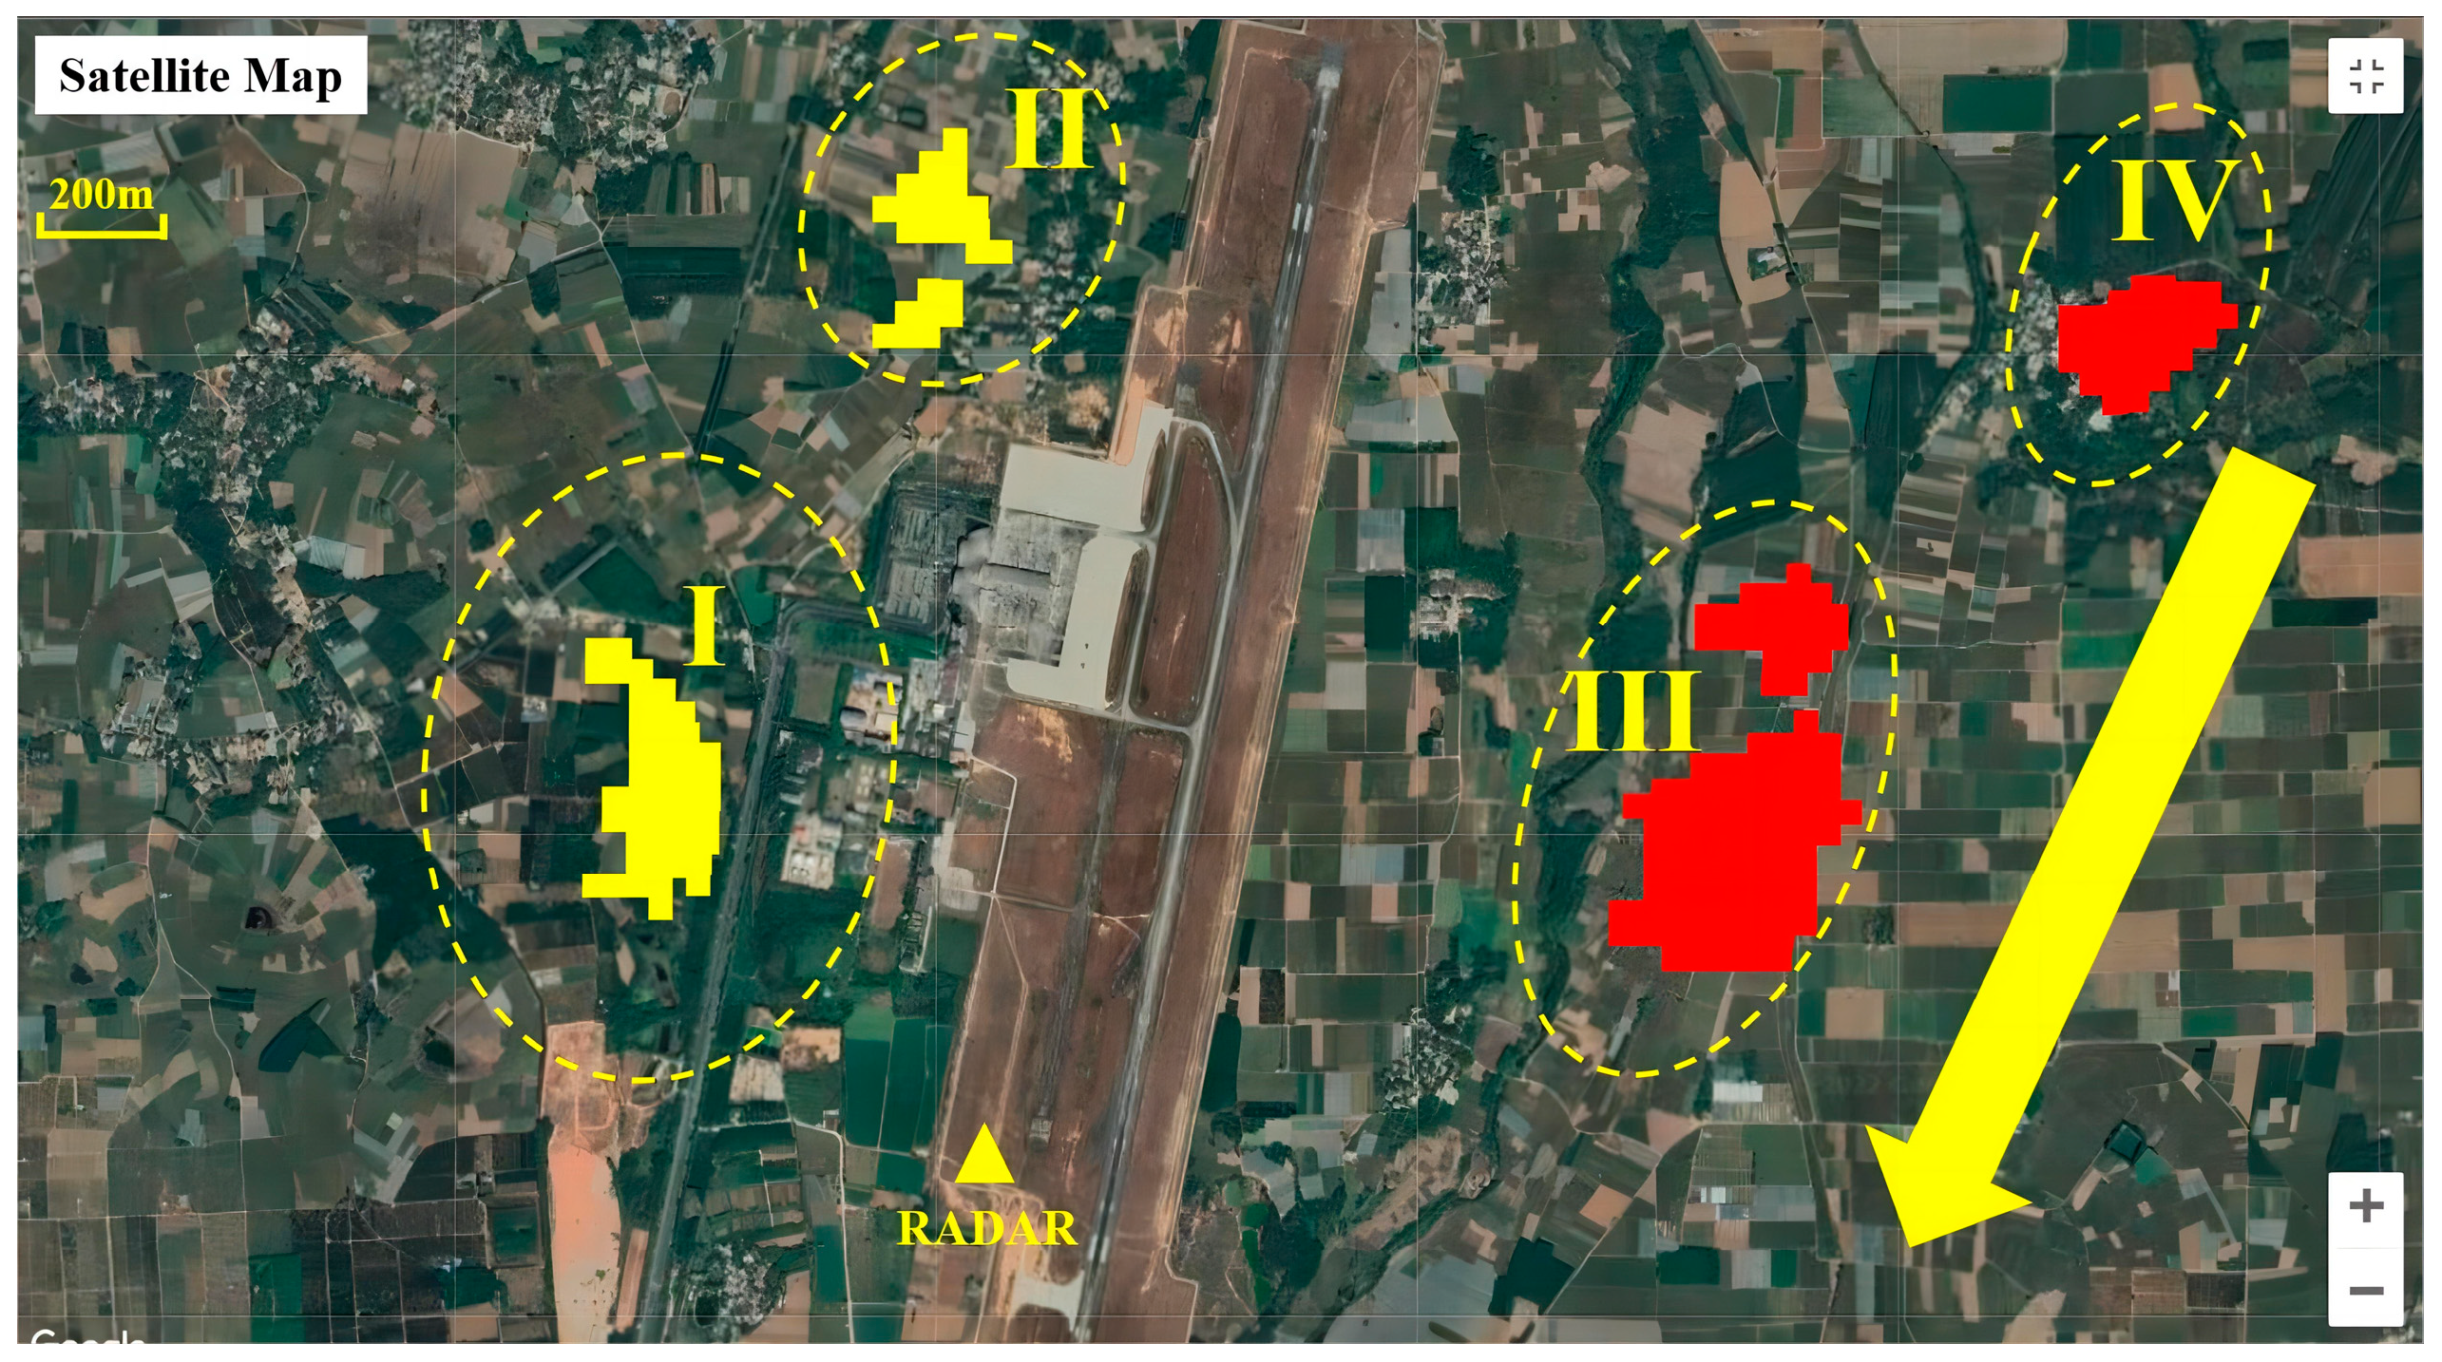
The system is deployed at Fucheng Airport in Beihai, Guanxi Province of China. The geographical distribution of the airport and bird situation are illustrated in Figure 2. The radar position is marked by a triangle. Artificial observation records indicate that regions I and II present frequent diurnal bird activities. Nocturnal bird activities are mainly distributed in regions III and IV. Cross-validation experiments are conducted between radar tracks and artificial observation records. The marked arrow indicates the principal flight direction according to statistical analysis of bird tracks in regions III and IV. Considering the non-negligible impact of weather conditions on bird activity trends, a conditional parameter vector, σ, is defined for data filtering to guarantee the activity consistency of the selected radar data. The vector σ contains multiple environmental parameters like temperature range, season, wind speed, etc. Filtered datasets are Ω = { Ω ( d 1 | σ ) , Ω ( d 2 | σ ) , , Ω ( d K | σ ) } . Ω ( d k | σ ) denotes datasets containing filtered radar data at date dk.

2.2. Bird Activity Modeling and Characterization in Spatial and Temporal Domains

In avian radar systems, a radar target track is the fundamental unit for target description. Speed and flight direction information is deduced from the spatial–temporal information of track plots. Diurnal and nocturnal bird activity patterns are hidden within collected radar target tracks. Compared with artificial observation records, more accurate and abundant radar tracks are favorable for bird activity characterization using data mining solutions.
The framework of bird activity characterization starts from data modeling in the spatial domain. Data are filtered using reference spots to support bird activity periodicity extraction and interpretation. A bird activity modeling framework is proposed to analyze avian radar datasets, as illustrated in Figure 3. The framework starts from spatial domain modeling. Radar sub-datasets are filtered out from reference spots for respective periodicity extraction. Periodicity trends are extracted and interpreted based on quantitative bird activity descriptors.

2.2.1. Spatial Domain Modeling

Spatial domain modeling utilizes the concept of reference spots, which are defined as regions with higher visiting frequencies [19,20]. The first step is discretizing airspace into two-dimensional uniform grids, as illustrated in Figure 4. Bird track data in height dimension are integrated within each grid in horizontal dimension. Bird densities within each grid are calculated using the following kernel density algorithm [21]:
f ( c ) = 1 n γ 2 i = 1 n 1 2 π e x p ( | c l ¯ ( i ) | 2 γ 2 ) ,
l ¯ is the vector including all track plot locations within the grid, c ¯ is the center position of the grid, and n is the plot number. The smoothing parameter γ is as follows:
γ = 1 2 ( σ x 2 + σ y 2 ) 1 2 n 1 6 ,
Parameters σ x and σ y are standard deviations of coordinates in the x and y directions from n track locations.
A density heat map comprises grid densities. Reference spots are extracted from the density heatmap based on grid extent and percentage parameter configurations. As birds fly across landscapes within large space contexts, a range of flexible landscape scenarios and parameters are explored for the extraction of proper reference spots. This paper defines parameter p as the percentage of the largest included densities. Grids of 75 × 75, 100 × 100, and 125 × 125 are studied with p ranging from 0.01% to 25%. The optimal configuration is the one that generates discrete reference spots over the landscape without over-painting, which is evaluated through visual observation. The recommended p of 15% [19] for single-organism tracking data is not adopted since massive bird tracks present larger spatial variety and uncertainty. Artificial evaluations determine the optimum parameter is p = 8%, with a 100 × 100 grid area.
Figure 5 presents reference spot distributions for a specific dataset. Spots I and II present frequent diurnal bird activities. In contrast, most bird activities in reference spots III and IV are during the night. Arrows indicate the predominant track directions for birds in III and IV. The heights and directions of nocturnal bird tracks indicates a high probability of migratory birds. Sub-datasets are extracted from reference spots to follow the temporal domain analysis.

2.2.2. Temporal Domain Modeling

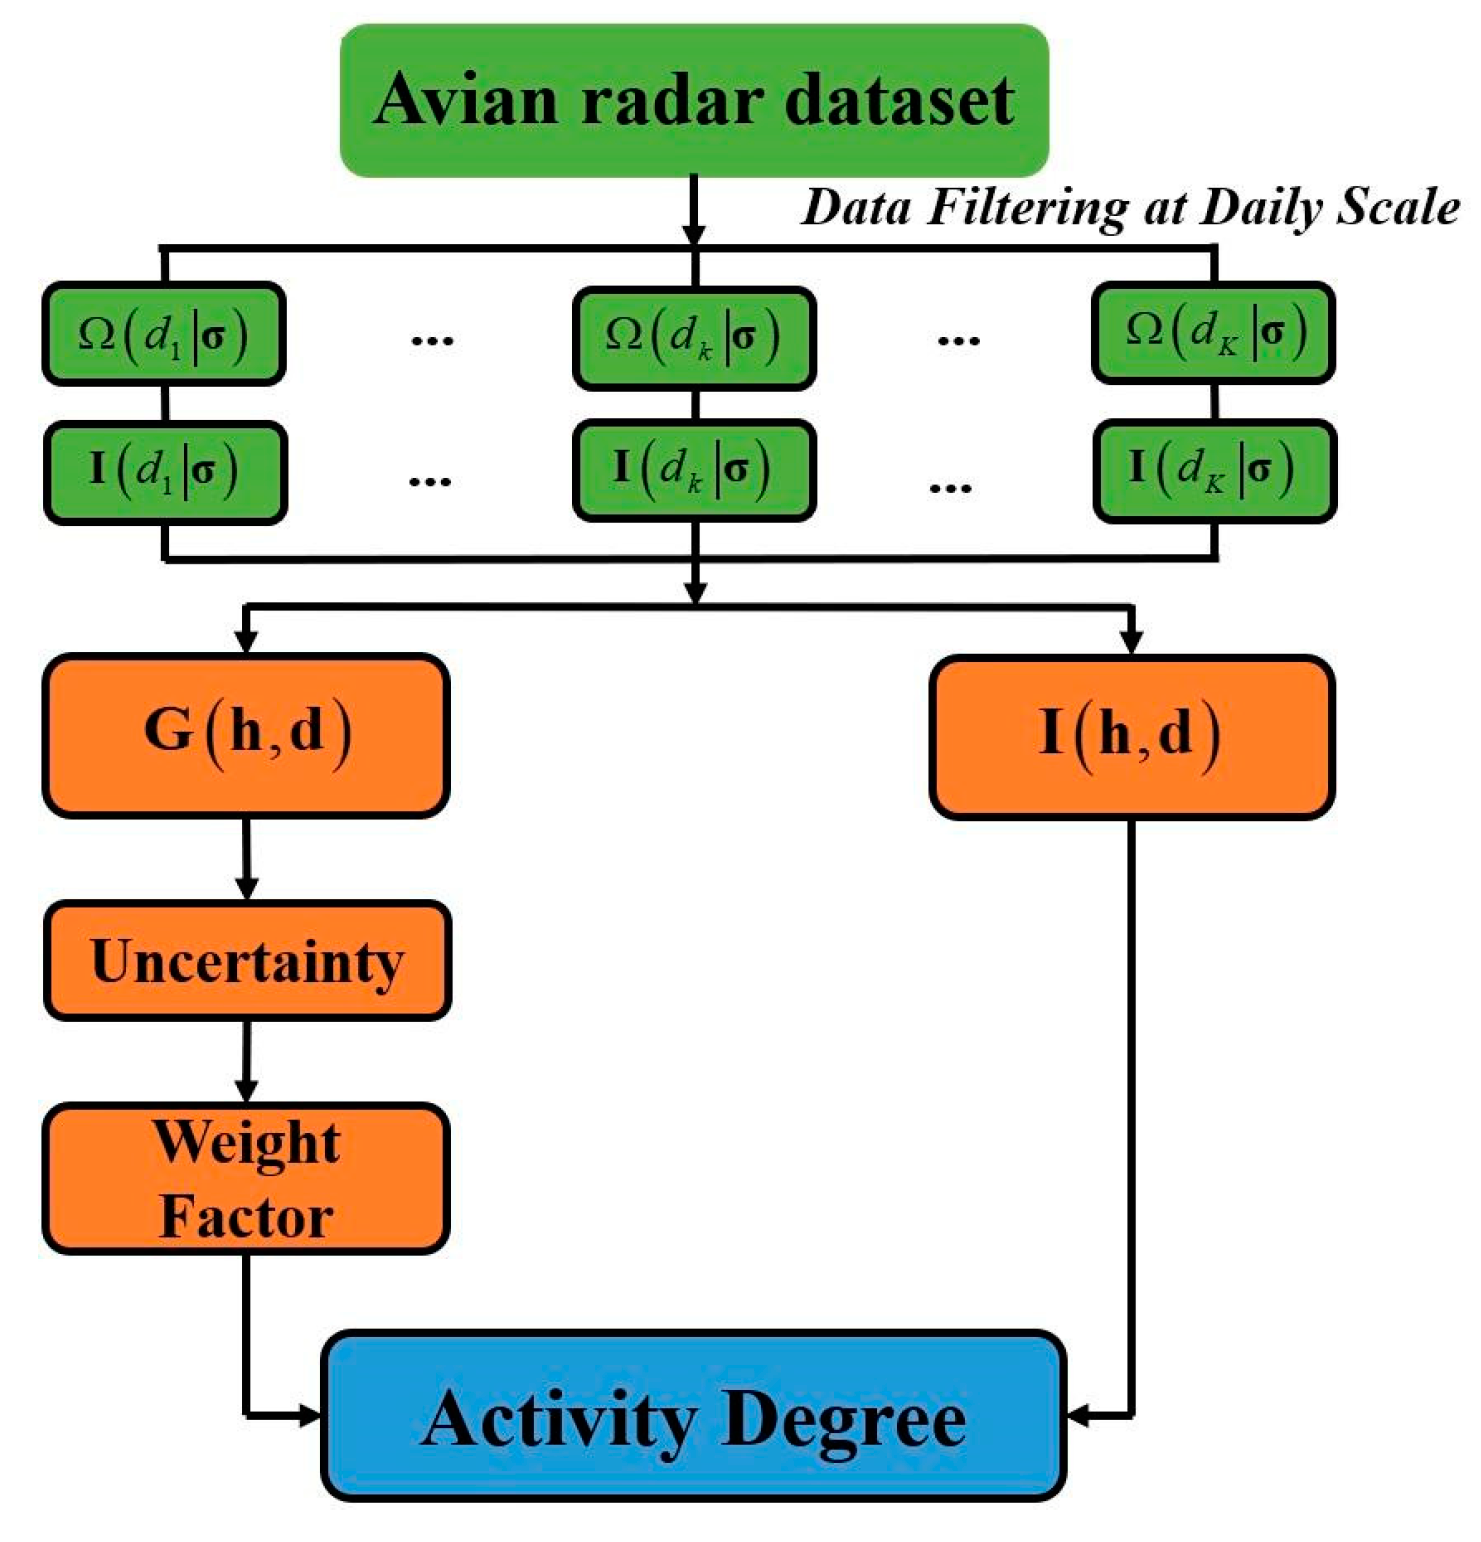
Temporal domain modeling takes one hour as the most fundamental time unit. The track count within a one-hour span is taken as the quantitative descriptor. It should be noted that all hours in this study are local time (LT). This study utilizes the concept of activity degree [22] to quantify bird activities and extract periodicity trends. The activity degree is extracted from four steps.
STEP 1: Intensity calculation. Activity intensities are calculated by the min–max normalization procedure within the temporal window of one day. The intensity of date dk is I = { I ( 1 | d k ) , I ( 2 | d k ) , , I ( 24 | d k ) } . The numerical range of intensity is scaled between 20 and 100. The lower bound is 20 rather than 0 because it is unreasonable to indicate the minimum number of tracks as no bird activity.
STEP 2: Grade mapping. The intensity vector is integrated by involving data from more selected dates. All selected dates are denoted as vector d, and the corresponding dataset for hour hk is I(hk,d). Track count variations might result in intensity fluctuations, which is misleading for behavior interpretation. To reduce the interference from intensity fluctuation, normalized intensities are transformed into 10 grades according to the mapping in Table 1. A new dataset containing all grades information is G(hk,d).
STEP 3: Uncertainty quantification. The uncertainty is extracted from activity grades to interpret bird activities from another viewpoint. The α-quadratic entropy [23] is taken as a metric for uncertainty quantification as follows:
E n α ( G ( h , d ) ) = 1 2 2 α j = 1 10 ( P j ( G ) ) α · ( 1 P j ( G ) ) α ,
P j ( G ( h , d ) ) indicates a probability of G(h,d) at grade j. The term α is the enlargement parameter. Its selected value of 0.7 is larger than the commonly recommended value of 0.5 for maintaining entropy sensitivity [24,25]. To choose the proper α, the airport staff with rich avian radar observation experience is invited to visually categorize 200 groups of datasets into “smaller uncertainties” and “larger uncertainties”. The behavior characterization model is adopted to calculate their weighing factors by increasing α gradually from 0.5. When over 90% of the “larger uncertainties” datasets have weighing factors larger than 1.2, the corresponding α is considered as the selected one.
STEP 4: Activity degree calculation. Activity degrees integrate intensity and uncertainty metrics based on a weighing strategy. The weighing factor for an α-quadratic entropy is defined as follows [26]:
w ( E n α ( h , d ) ) = 1 + ( 2 2 α ) · e x p ( E n α ( h , d ) T e ) ,
The parameter Te is the entropy threshold to determine the uncertainty contribution enlargement pattern. The threshold selection is based on predefined entropy histograms which are artificially categorized as large and smooth degree variations. The optimum Te is a value minimizing the overlapping probability between large and smooth variations. In this paper, selected avian radar datasets result in the threshold Te of 1.63. The activity degree is modeled as an integration of intensity and uncertainty. For an hour window h, its behavior index is expressed as follows:
C ( h k , d ) = I ( h k , d ) × w ( E n α ( G ( h k , d ) ) ) ,
Figure 6 demonstrates the overall framework of the activity degree extraction procedure.

2.3. Periodicity Extraction and Interpretation

To characterize and interpret bird activity periodicity, each sub-dataset for a specific reference spot is reorganized in the hour–day–month–year advancing order as L = {l1, l2, …}, in which li contains all track information at the ith hour window. For example, {l1, l2, …, l24} indicates 24 h radar data for the first selected date within a specific reference spot, and {l25, l26, …, l48} represents data of the second selected date.
Activity degrees are extracted from L for periodicity extraction. As periodicity trends could not be extracted from one day’s worth of data, the data integration of multiple days is necessary. This study assumes that birds within the same month have similar periodicity trends. Therefore, radar data of the same month from multiple years is integrated for analysis. For example, the bird activity periodicity data for September is studied by integrating all radar data in September. The new integrated dataset within reference spot II is denoted as follows:
B ( I I , S E P ) = { b 1 , b 2 , , b 24 ; b 25 , , b 48 ; } ,
The term { b 1 , b 2 , , b 24 } denotes activity degrees at the first selected day of September within reference spot II.

2.3.1. Periodicity Extraction

This study focuses on daily periodicity characterization. Longer periodicities like several days or weeks are out of the scope of this study. Therefore, the maximum periodicity is 24 h. B is considered as a composition of several daily activity segments, and bird daily periodicities among days are independent. This assumption means the rearrangement of daily segments does not influence activity periodicity. Therefore, activity periodicities from reorganized datasets with random daily segment permutation should be the same or similar. This study takes a random segment permutation strategy to generate multiple reorganized datasets for periodicity mining. For a dataset B, its reorganized formulation at the jth random permutation is denoted as Bj (j = 1, 2, …, J), and the original dataset is labeled as B0. The fast Fourier transform (FFT) is applied on each reorganized dataset Bj, and the spectrum is denoted as follows:
F j = D F T { B j } = { x 1 j , x 2 j , , x K j } ,
The term Fj is re-sorted with | x k j | 2 in descending order. First K’ components are extracted as follows:
k = 1 K | x k j | 2 > 90 % × k = 1 K | x k j | 2 ,
Selected spectrum components are considered as period component candidates. For all reorganized segments Bj (j = 1, 2, …, J), period component candidates are collected within the subset D. As the length of all daily segments and FFT points K are fixed, periods within the spectrums of J random permutations are consistent. Frequency component counts are calculated from the number of the same frequency component indices. The quantity of kth component xk within D is denoted as C(xk). Considering the frequency component shift from minor period variation, the component count is calculated as follows:
C ( x k ) = C ( x k 1 ) + C ( x k ) + C ( x k + 1 ) ,
All frequency component counts are sorted in descending order, and the first K′ components are extracted as follows:
k = 1 K C ( x k ) > 90 % × k = 1 K C ( x k ) ,
The selected spectrum component xk is transformed back to the temporal domain for period recovery. The length of B is defined as N, and the period range of x k is [N/k, N/(k − 1)]. The period is calculated using the following circular autocorrelation function:
R ( τ ) = i = 1 N b τ b i + τ ,
where τ is the difference lag. The range [N/k, N/(k − 1)] is written as [ l , r ] . The maximum value from { R ( l ) , R ( l + 1 ) , R ( l + 2 ) , , R ( r 1 ) } is denoted as follows:
t * = argmax t [ l , r ] { R ( t ) } ,
The term t * is considered as the extracted period.

2.3.2. Periodicity Interpretation

Periodicity extraction takes activity degree information from the temporal domain. However, the numerical property of activity degrees is not proper for periodicity interpretation. Activity degrees are further mapped into three activity levels to model categorical probabilities of bird activities. The mapping relationship is presented in Table 2.
The original radar dataset L is transformed into activity level segments. The extracted activity level segment at reference spot II in September is formulated as follows:
S ( I I , S E P ) = { s 1 , s 2 , , s 24 ; s 25 , , s 48 ; } ,
S is composed of M daily segments. I k j is defined as the activity level of the jth element at hour k. The categorical probability for high activity level is defined as follows:
P h i g h ( k ) = j δ h i g h ( I k j ) M ,
δ h i g h ( I k j ) is an indicator for I k j , as shown in the following:
δ h i g h ( I k j ) = { 1 I k j = h i g h 0 I k j h i g h ,
Categorical probability definitions for medium and low levels are similar. The sum of three levels’ categorical probabilities satisfies the following:
P h i g h ( k ) + P m e d i u m ( k ) + P l o w ( k ) = 1 ,
Each period corresponds to a unique group of categorical probabilities at three levels. Figure 7 exemplifies a probability distribution using subset S(II,SEP). The diurnal activity pattern is prominent. However, the probability distribution is limited in information presentation and not favorable for mutual comparison.
All daily data segments have the same length, and it is reasonable to integrate their categorical probabilities. Behavior and uncertainty indices are defined using the categorical probabilities of high and medium levels for periodicity interpretation. The behavior index B i n d is defined as follows:
B i n d = P h i g h 100 + 0.2 × ( 1 U i n d ) ,
The uncertainty index U i n d interprets activity ambiguity, and it is defined from probabilities of medium level as follows:
U i n d = { 0.5 P M > 33 % 0.5 × P M 0.33 P M < 33 % ,
The threshold of 33% is from the assumption that when the probability proportion of the medium level is larger than other two levels, bird activities have maximum uncertainty. Otherwise, its uncertainty is limited. The parameter 0.2 in [17] is empirical to prevent uncertainty impact on behavior index.
Two indices compose a bird activity periodicity interpretation. They are plotted in one figure using double y-axis formulation, as shown in Figure 8. More information could be presented compared with probability plotting, which is favorable for comparison between different spatial–temporal windows. It could be observed that larger behavior indices are usually accompanied with lower uncertainty, which proves periodicity credibility.

3. Results

3.1. Dataset Construction

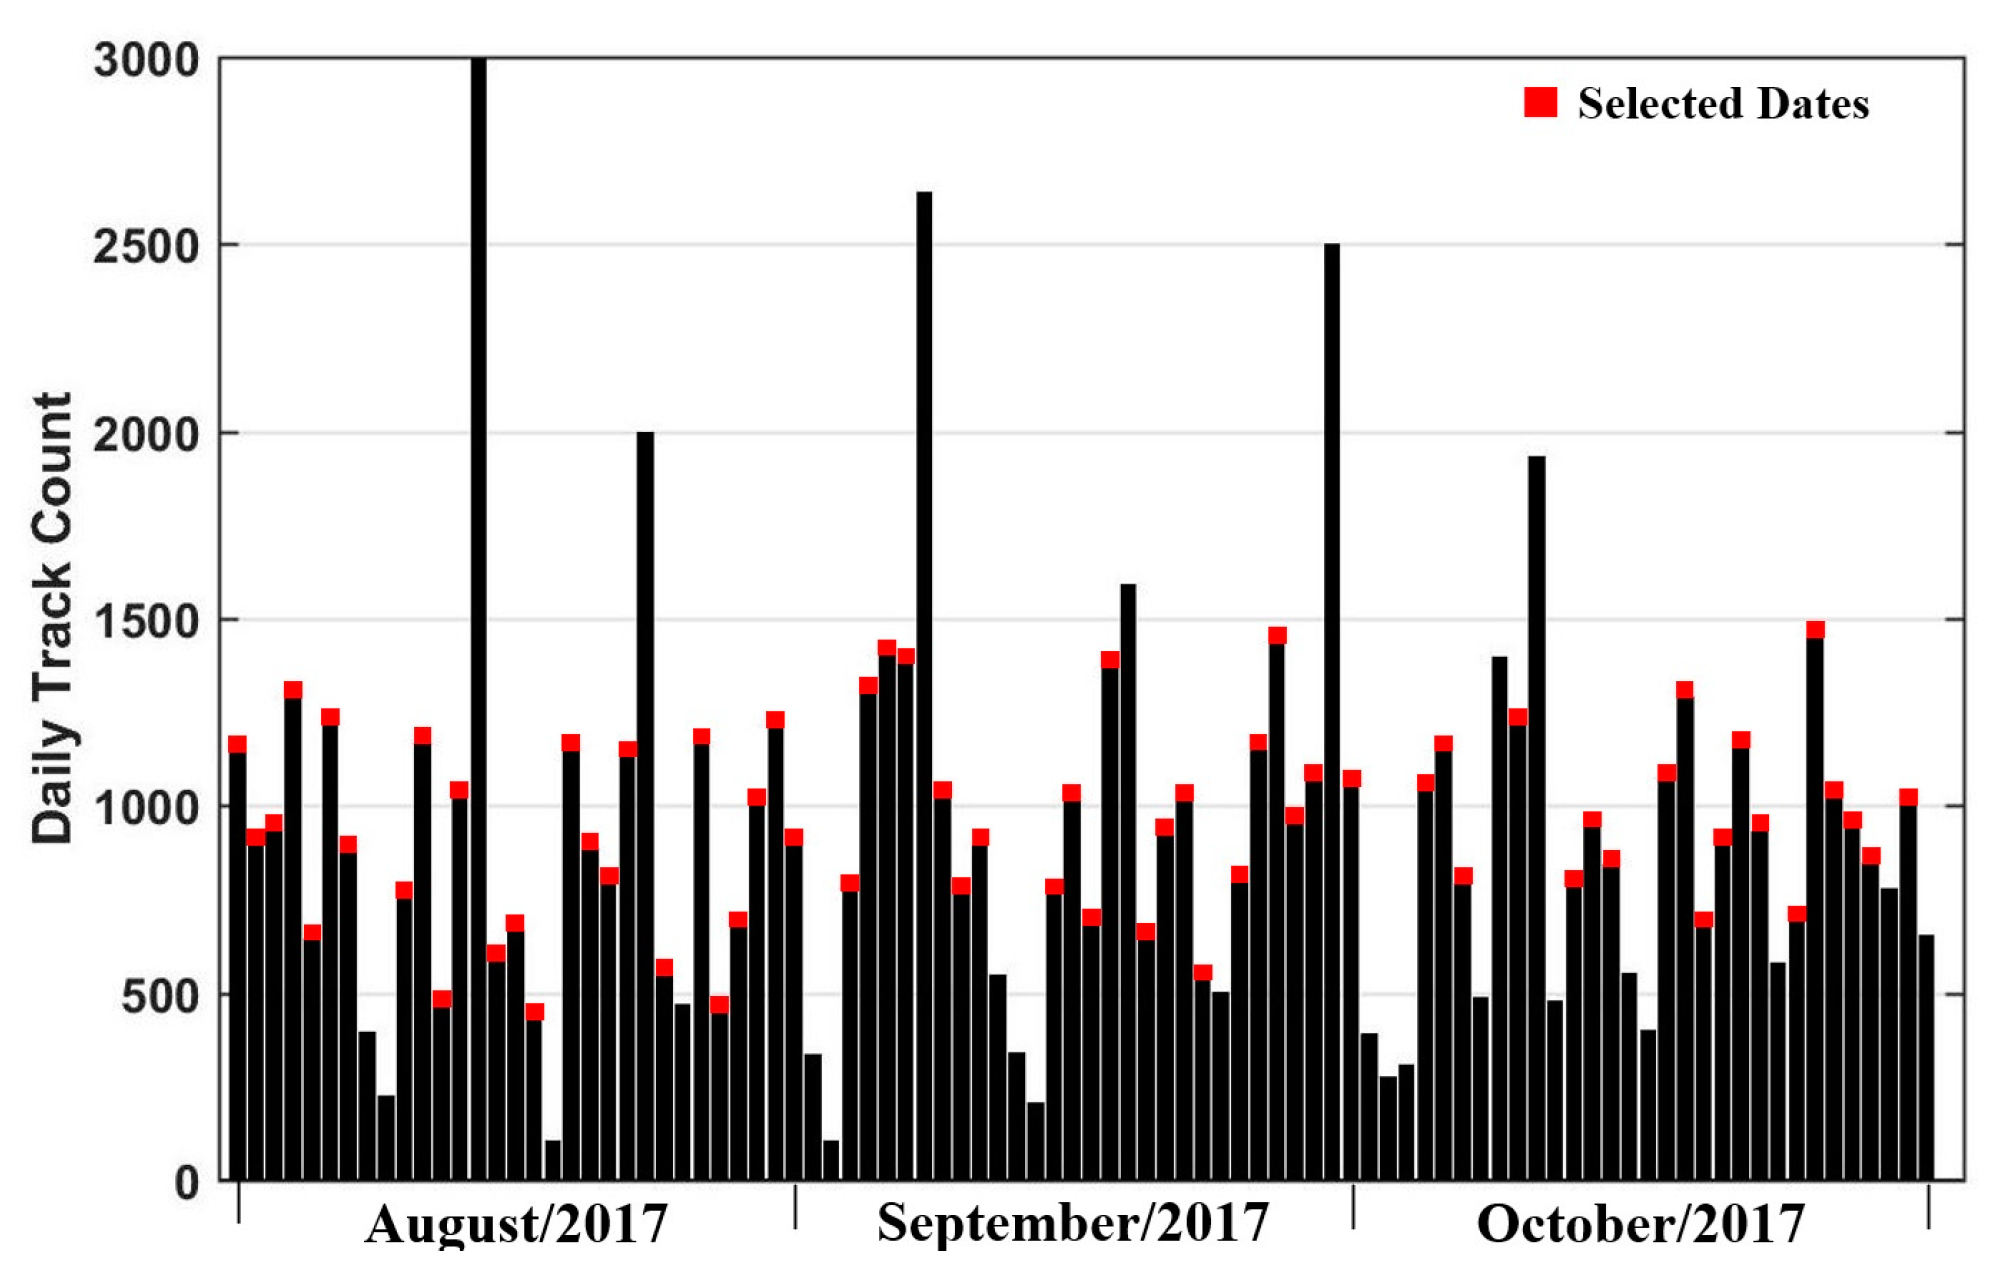
Avian radar data from August, September, and October from 2016 to 2019 are collected for the experiments. Figure 9 exemplifies the daily track counts and selected dates in spots I and II. Days with extremely large track counts are commonly excluded since radar data are interfered with by dynamic clutter signals with massive false bird tracks. The conditional parameter σ is set to normal weather excluding weather conditions like strong gusts, precipitation, fogs, and radar malfunction. Representative weather parameters under normal weather conditions construct multiple sub-datasets. For example, a temperature sub-dataset defines its lower and upper bounds by extracting 20% and 80% percentile values. Due to the weather condition difference between the diurnal and nocturnal hour windows, conditional parameters are constructed, respectively. For diurnal bird behavior analysis, the numerical range in the hour window for temperature, air pressure, humidity, and wind speed are [60,86] °F, [980,1030] hPa, [67,81] %, and [3.2,9.1] m/s, respectively.

3.2. Periodicity Trends for Diurnal Activity

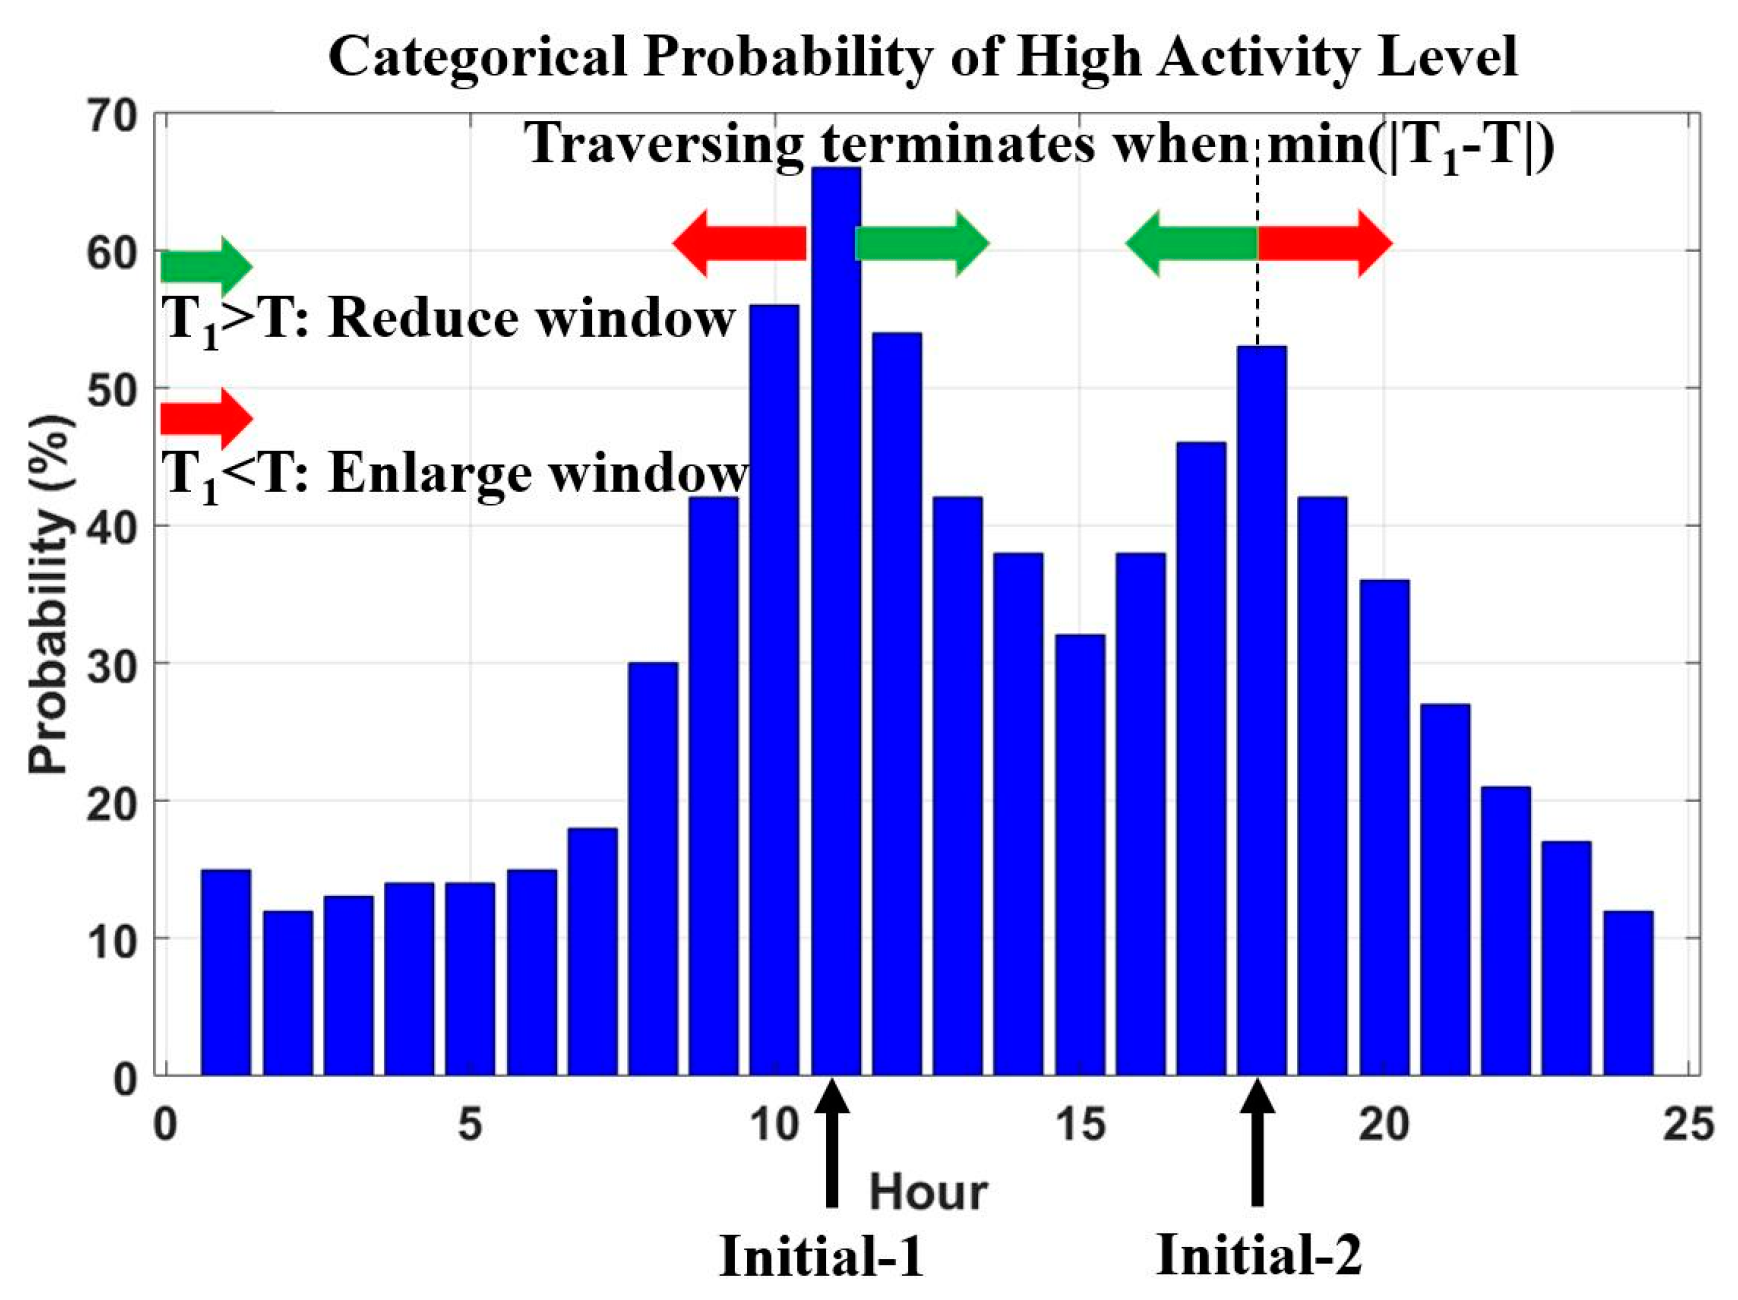
The periodicity extraction gives an accurate period quantity, but it does not indicate the hour window for the period. This paper introduces an hour window extraction method based on high activity levels of categorical probability. Figure 10 gives a graphical example of hour window location. The procedure starts from the hours of the first two largest probabilities. Their interval is an initial period T1. The ideal situation is T1 = T, but this chance is usually low. If T1 < T, an hour traversing procedure is activated from the two initial hours, and the traversing direction is along the enlargement direction marked by red arrows in Figure 10. In contrast, the traversing direction is inversed for the case of T1 > T. The procedure stops when the interval of two traversing hours has the minimum deviation with the extracted period.
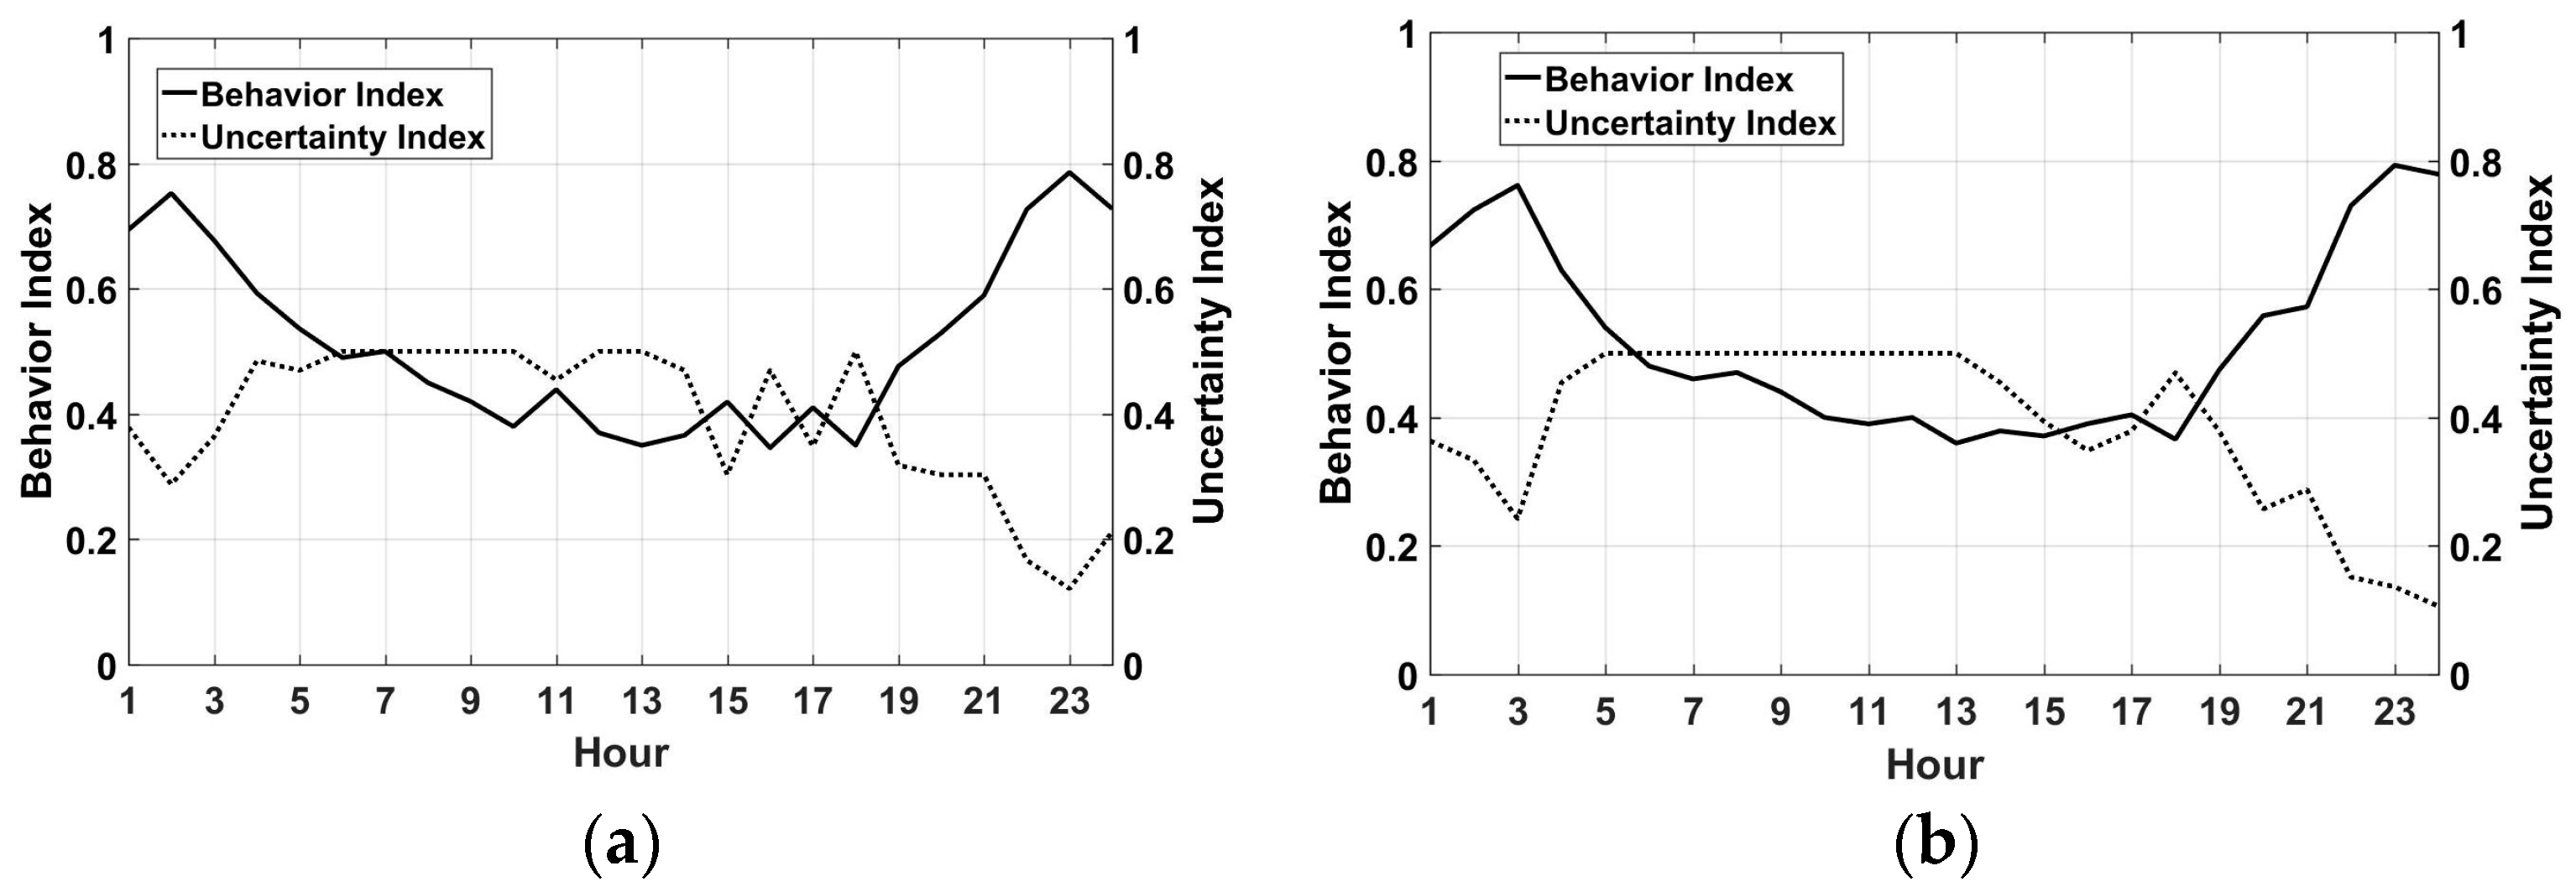
Figure 11 presents periodicity indices for August at reference spot I. The hour windows of two extracted periods are [05:00,19:00] and [20:00,05:00], which are complementary to each other. Behavior indices distributions for two periods in Figure 11a and Figure 11b are very similar. This presents a classical diurnal bird activity character and is consistent with the environment configuration in spot I. Spot I is filled with dense wood areas for bird nesting and residence with distinctive commuting and roosting activities. The uncertainty indices are mostly lower for hours with larger behavior indices around sunrise and sunset hours. The large uncertainty around noon is caused by the diurnal bird activity variety. Night activity uncertainty is due to limited bird track samples since most diurnal birds are resting. Insufficient samples limit the accuracy of categorical probabilities.
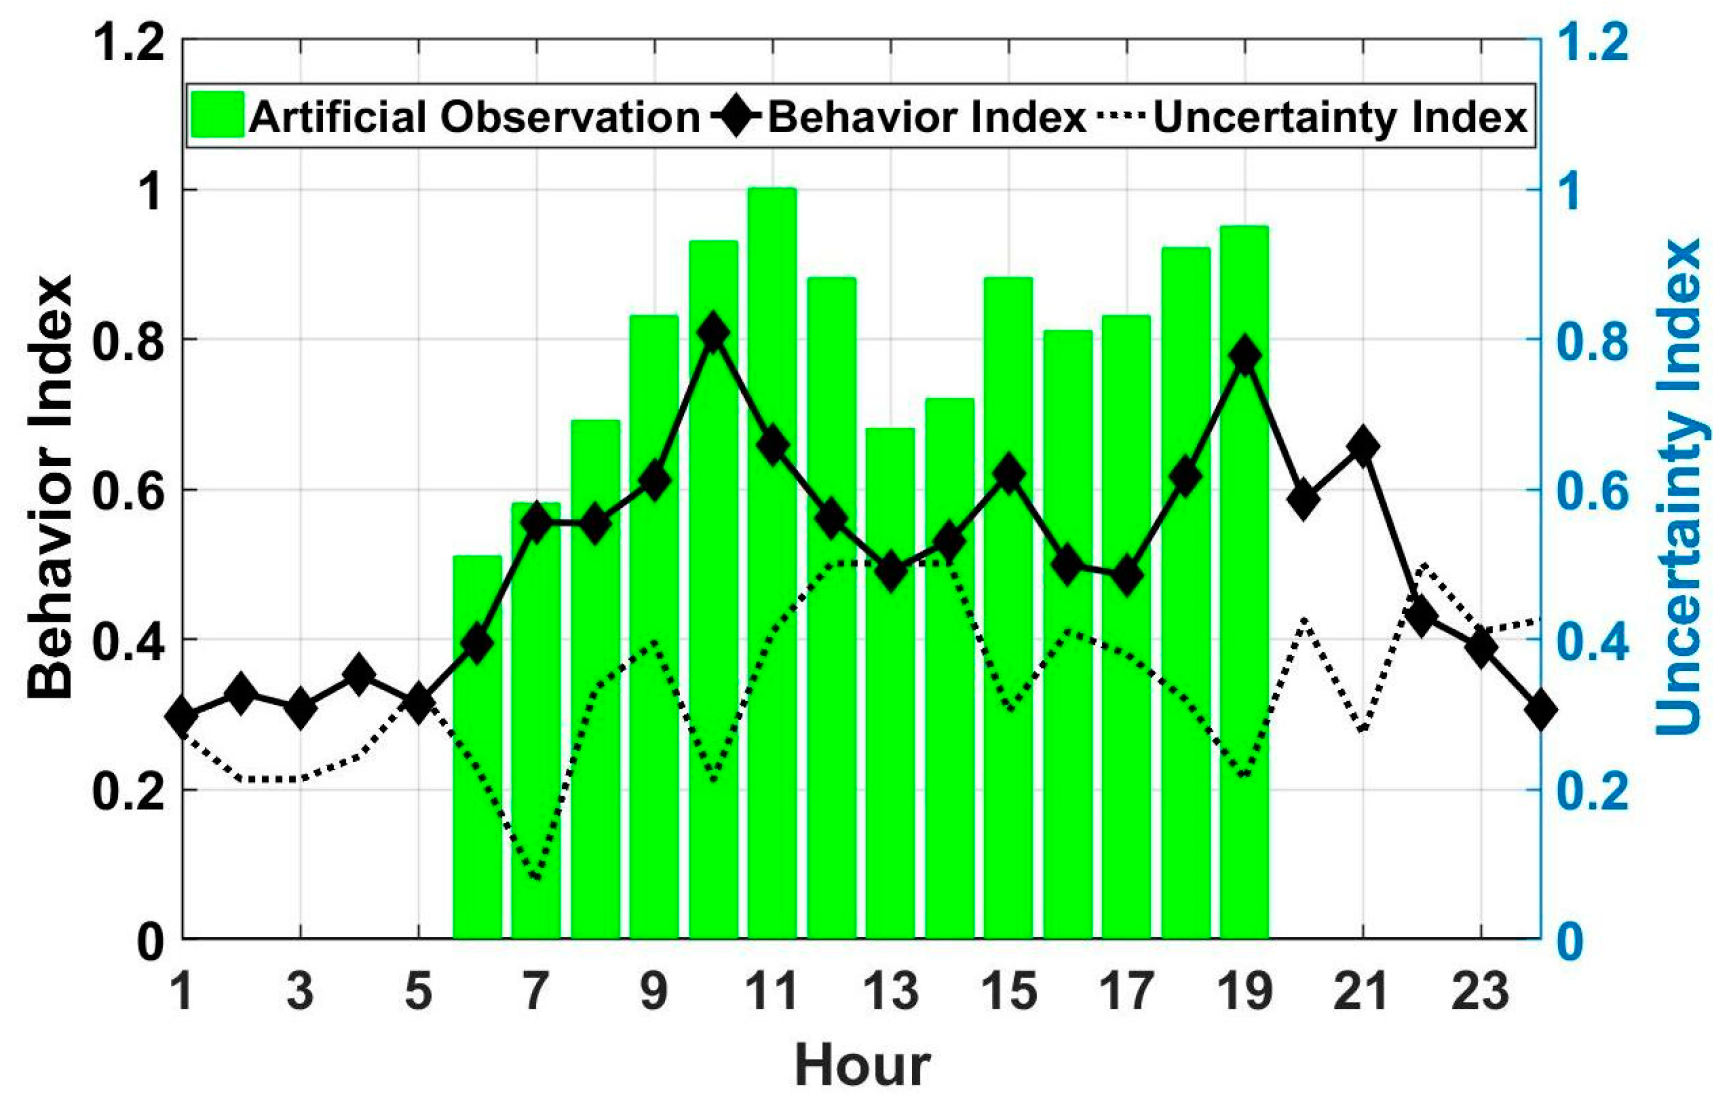
Artificial observation records are used to verify the extracted periodicity. These records are from airport staff with experienced bird observation skills. They use ground mounted binoculars to observe birds at different locations within the airport. With professional training, they could identify bird species and estimate their locations and flight directions. Bird modalities (single or flocks) are also observable with rough bird quantity estimation. These trends are recorded with time and uploaded into the airport database every two days. Since there is no infrared optical telescope in the airport, there are no nocturnal bird observation records. There is a total of six years of artificial records available for analysis. Artificial records usually give rough bird quantity estimation, and they could be utilized as quantitative reference. The min–max normalization is applied on records to quantify artificial evaluations within [0.5,1], which is consistent with periodicity indices for mutual comparison. Most hours reflect a good consistency between artificial observation and periodicity results. Prominent numerical deviations in afternoon hours are due to artificial bird estimation errors.
The periodicity results from September and October present similar complementary periodicity between two periods. Therefore, only one periodicity is presented for September and October. Figure 12 illustrates the periodicity characters for September in spot I. The hour window is [09:00,19:00]. Birds are more active around 10:00 and 19:00, which corresponds to their roosting and commuting activities. Hours with larger behavior indices also present less activity uncertainties. Artificial observation records reflect good consistency with activity periodicity. Larger deviations in afternoon hours are caused by ambiguous artificial quantification information. Uncertainty differences in other hours are consequences of activity variety or insufficient sample support.
The monthly difference in periodicity becomes prominent from October, as illustrated in Figure 13. The period reduces to 9 h, and the hour window is [09:00,18:00]. The most active hour is shifted to 11:00. Compared with August and September, the intensities of bird activities present smaller variations in diurnal hours, which means a higher degree of bird activities. The other dominant active hour is around 19:00 in sunset hours. An interesting phenomenon is activity hours around 15:00, which becomes more prominent in October. According to the analysis of the artificial observation records, bird activities at this hour are not daily commuting or roosting. Similar phenomenon also exists in reference spot II.
Reference spots II presents more complicated periodicity. Three periods (3, 7, and 17 h) are extracted in August with hour windows [12:00,15:00], [09:00,16:00], and [16:00,09:00] as in Figure 14. Behavior and uncertainty indices are plotted separately for clarity. Hour windows [09:00,16:00] and [16:00,09:00] are complementary to each other with a classical diurnal activity pattern. The hour window [12:00,15:00] corresponding to a 3 h period is worthy of further discussion. According to artificial observation records, most birds during these hours fly toward a residence area in the northwest end of reference spot II. An outdoor garbage yard is positioned within that area, and birds are probably there for food. This residence area is out of the radar coverage and visual observation so that not all birds that fly in a back-and-forth manner are recorded. This unusual periodicity is related to the one in reference spot I. Uncertainty indices in nocturnal hours are larger than diurnal ones due to limited samples.
Periodicity indices for September in Figure 15 still present complementary hour spans between [09:00,17:00] and [17:00,10:00]. The noon food hunting activity in September is shifted to [12:00,16:00]. Bird flight directions are concentrated in the northwest and southeast directions, which indicates a back-and-forth manner of bird activities during food hunting.
The periodicity windows in October are [10:00,18:00], [12:00,17:00], and [19:00,08:00], as presented in Figure 16. Similar to spot I, hour window shifts are consistent with seasonal weather and sunrise/sunset time variations. Bird activities in October present greater uncertainty. In contrast, food hunting activities during noon hours grow longer. This trend has received positive feedback from ornithologists since they believe diurnal birds in the airport area are more active for food collection to accommodate the coming winter. Even though winter in Fucheng Airport is warm, and this instinct is preserved for most diurnal local birds.

3.3. Periodicity Characters for Nocturnal Activity

Most bird activities in spots III and IV are during the nocturnal hours. Figure 17 presents the periodicity indices for reference spots III and IV in August. Differences with spots I and II are distinctive. Artificial observation records are not provided since nocturnal observation in spots III and IV are difficult. Limited diurnal observation records are improper for effective periodicity interpretation. Spots III and IV present high periodicity similarities, which indicates activity consistency between two spots. One possible explanation is that spots III and IV might be on the same migration route, and birds might fly across two spots sequentially. This periodicity consistency character is promising for other sensor types like weather radars and distributed sensor networks.
Weather radars are suitable for migratory bird detection at large spatial scales, and their networks could further extend surveillance areas. However, these networks could hardly provide migratory bird information with high updating rates as avian radars. Reference spots and their periodicity trends complement this functionality insufficiency. Large scale migratory activity trends in the spatial–temporal domains could be modeled and interpreted by integrating periodicity data from neighboring reference spots. These periodicity data are also applicable for the cross-validations of migratory activities between avian and weather radars. Moreover, these trends are also promising for migratory route deductions.
Migratory characters are more distinctive in September in Figure 18. The hour windows for spots III and IV are [22:00,02:00] and [21:00,03:00]. Dominant migratory activities are clustered within the nocturnal hours with lower uncertainty indices. In contrast, diurnal activities have greater uncertainties due to data insufficiency. This insufficiency is due to the environmental transformation before airport construction for bird interference reduction. Original woods and bushes in this region were removed and replaced with vegetations which are not suitable for diurnal bird residence or roosting. This strategy has a minor impact on migratory birds, and their nocturnal activities are still prominent.
The hour windows for two spots in October are all [21:00, 03:00], as shown in Figure 19. Compared with August and September, diurnal activity hour shifts are due to seasonal variations. Lower uncertainty indices in nocturnal hours indicate more distinctive night migration activity. The behavior index increments of around [13:00,14:00] are caused by occasional diurnal activities from a smaller sample group. Therefore, existing periodicity index definitions might be misleading under imbalanced track counts. This has inspired us to integrate track counts in our future works to optimize periodicity indices.

4. Discussion

The existing results indicate the feasibility of the proposed method for bird activity periodicity characterization. The behavior indices depict activity intensity variation and periodicity, and uncertainty indices quantify activity complexities. Their close relevance in the temporal domain hints at a possibility of activity pattern prediction.
A preliminary experiment was carried out by constructing temporal activity trends using datasets from 2016 to 2018 as “historical” data. The data of 2019 are used as “future” data. The level with the maximum categorical probability is considered as the activity indicator. The consistency of activity levels between the “historical” and “future” datasets verifies the feasibility of activity prediction. Experiments are conducted in spots I/II and III/IV, respectively. The prediction accuracy is quantified by the rate of level consistency. The accuracies for I/II and III/IV are 67% and 81%, respectively.
This accuracy difference is due to different bird activity motivations at two spots. Diurnal birds usually present daily commuting and roosting behaviors with greater activity uncertainties. In contrast, nocturnal migration activities possess stronger periodicity with less uncertainties. The ecological managements in III and IV further reduces local diurnal bird activities, and the nocturnal migratory periodicity is more distinctive with higher prediction accuracy.
This experiment indicates that bird activity prediction using periodicity trends is more appropriate for migratory activities. It could be utilized inversely to identify abnormal targets within specific hour windows. More works about feature space construction and machine learning model [27,28,29] selections are needed to elevate prediction accuracy and robustness.

5. Conclusions

Avian radar systems are proper for wide-area bird surveillance. However, the functionalities of existing avian radar systems are based on real-time bird monitoring and hazard warning as short-term references. Long-term activity modeling and characterization from historical avian radar datasets are promising in providing more comprehensive bird activity interpretations in the spatial–temporal domain. This paper proposes a framework for the long-term bird activity characterization method, including activity quantification, periodicity extraction, and interpretation. Reference spots are generated for data filtering in the spatial domain. Temporal activity modeling is carried out by introducing activity degrees. Periodicity trends are extracted with daily segment random permutation and frequency domain solutions. The categorical probabilities of three activity levels are taken to interpret bird activity periodicity. Four years of datasets collected from an avian radar system are taken for verification. Four reference spots are extracted around an airport to depict diurnal and nocturnal bird activities. The periodicity trends present good consistencies with artificial observation records and existing ornithology understanding. Experiments of activity-level predictions will enrich the potential of long-term functionalities. Targets with abnormal temporal presences could also be revealed as reference for noncooperative intruder detection. In the future, periodicity fusion from multiple neighboring reference spots will be carried out to support bird type identification and migration route deduction problems.

Author Contributions

Conceptualization, J.L. and W.C.; methodology, J.L. and Q.X.; software, J.L. and M.S.; validation, W.C.; formal analysis, M.S. and W.C.; data curation, Q.X.; writing—original draft preparation, J.L.; writing—review and editing, W.C.; visualization, M.S.; supervision, W.C.; project administration, J.L.; funding acquisition, J.L., M.S. and W.C. All authors have read and agreed to the published version of the manuscript.

Funding

This paper is supported by National Natural Science Foundation of China (NSFC) under Grants 62371018 and 62361006, Guangxi Natural Science Foundation under Grant 2020GXNSFBA297119, Guangxi Science and Technology Plan Project under Grant GuiKe-AD20238025, the National Natural Science Foundation of China (NSFC) and Civil Aviation Administration of China (CAAC) (U2133216), National Key Research and Development Program (2023YFB2604103).

Data Availability Statement

No new data were created or analyzed in this study. Data sharing is not applicable to this article.

Conflicts of Interest

The authors declare no conflicts of interest.

References

  1. Kunz, T.H.; Gauthreaux, S.A., Jr.; Hristov, N.I.; Horn, J.W.; Jones, G.; Kalko, E.K.; Larkin, R.P.; McCracken, G.F.; Swartz, S.M.; Srygley, R.B.; et al. Aeroecology: Probing and modeling the aerosphere. Integr. Comp. Biol. 2008, 48, 1–11. [Google Scholar] [CrossRef]
  2. Phillip, B.C.; Eli, B.; Winifred, F.F.; Jason, W.C.; Jeffrey, F.K. Radar aeroecology: Exploring the movements of aerial fauna through radio-wave remote sensing. Biol. Lett. 2012, 8, 698–701. [Google Scholar] [CrossRef]
  3. Robinson, W.D.; Bowlin, M.S.; Bisson, I.; Shamoun-Baranes, J.; Thorup, K.; Diehl, R.H.; Kunz, T.H.; Mabey, S.; Winkler, D.W. Integrating concepts and technologies to advance the study of bird migration. Front. Ecol. Environ. 2010, 8, 354–361. [Google Scholar] [CrossRef]
  4. Stepanian, P.M.; Chilson, P.B.; Kelly, J.F. An introduction to radar image processing in ecology. Methods Ecol. Evol. 2014, 5, 730–738. [Google Scholar] [CrossRef]
  5. Metz, I.C.; Ellerbroek, J.; Muhlhausen, T.; Kugler, D.; Hoekstra, J.M. Simulating the Risk of Bird Strikes. In Proceedings of the SIDs 2017, 7th SESAR Innovation Days, Belgrade, Serbia, 28–30 November 2017. [Google Scholar]
  6. Dolbeer, R.A. Increasing Trend of Damaging Bird Strikes with Aircraft Outside the Airport Boundary: Implications for Mitigation Measures. Hum.-Wildl. Interact. 2011, 5, 12. [Google Scholar]
  7. Allan, J.R. The costs of bird strikes and bird strike prevention. In Human Conflicts with Wildlife: Economic Considerations; US Department of Agriculture: Fort Collins, CO, USA, 2002; Volume 18, pp. 147–153. [Google Scholar]
  8. Allan, J.R.; Orosz, A.P. The costs of bird strikes to commercial aviation. In Proceedings of the Bird Strike Committee–USA/Canada, Bird Strike Committee Proceedings, University of Nebraska, Calgary, AB, USA, 27 August 2001; pp. 217–226. [Google Scholar]
  9. Marra, P.P.; Dove, C.J.; Dolbeer, R.; Dahlan, N.F.; Heacker, M.; Whatton, J.F.; Diggs, N.E.; France, C.; Henkes, G.A. Migratory Canada geese cause crash of US Airways flight 1549. Front. Ecol. Environ. 2009, 7, 297–301. [Google Scholar] [CrossRef]
  10. Avian Radar Systems; DeTect Inc.: Bay County, FL, USA, 2007.
  11. Nohara, T.J.; Beason, R.C.; Weber, P. Using Radar Cross-Section to Enhance Situational Awareness Tools for Airport Avian Radars. Hum.-Wildl. Interact. 2011, 5, 210–217. [Google Scholar] [CrossRef]
  12. Chen, W.S.; Huang, Y.F.; Lu, X.F.; Zhang, J. Analysis of bird situation around airports using avian radar. Aeronaut. J. 2021, 125, 2149–2168. [Google Scholar] [CrossRef]
  13. Chen, W.S.; Liu, J.; Li, J. Classification of UAV and bird target in low-altitude airspace with surveillance radar data. Aeronaut. J. 2019, 123, 191–211. [Google Scholar] [CrossRef]
  14. Schmaljohann, H.; Liechti, F.; Bächler, E.; Steuri, T.; Bruderer, B. Quantification of bird migration by radar—A detection probability problem. Ibis 2008, 150, 342–355. [Google Scholar] [CrossRef]
  15. Gauthreaux, S.A.; Livingston, J.W. Monitoring bird migration with a fixed-beam radar and a thermal-imaging camera. J. Field Ornith. 2006, 77, 319–328. [Google Scholar] [CrossRef]
  16. Gauthreaux, S.A.; Schmidt, P.M. Application of radar technology to monitor hazardous birds at airports. In Wildlife in Airport Environments: Preventing Animal–Aircraft Collisions through Science-Based Management; Johns Hopkins University Press: Baltimore, MD, USA, 2013; pp. 141–151. [Google Scholar]
  17. Dokter, A.M.; Baptist, M.J.; Ens, B.J.; Krijgsveld, K.L.; van Loon, E.E. Bird radar validation in the field by time-referencing line-transect surveys. PLoS ONE 2013, 8, e74129. [Google Scholar] [CrossRef]
  18. Jenkins, A.R.; Reid, T.; Plessis, J.; Colyn, R.; Benn, G.; Millikin, R. Combining radar and direct observation to estimate pelican collision risk at a proposed wind farm on the Cape west coast, South Africa. PLoS ONE 2018, 13, e0192515. [Google Scholar] [CrossRef]
  19. Chen, W.S. Interactive processing of radar target detection and tracking. Aircr. Eng. Aerosp. Technol. 2018, 90, 1337–1345. [Google Scholar] [CrossRef]
  20. Li, Z.; Ding, B.; Han, J.; Kays, R.; Nye, P. Mining Periodic Behaviors for Moving Objects. In Proceedings of the KDD’10—Proceedings of the 16th ACM SIGKDD International Conference on Knowledge Discovery and Data, Washington, DC, USA, 25–28 July 2010; pp. 1099–1108. [Google Scholar]
  21. Worton, B.J. Kernel methods for estimating the utilization distribution in home-range studies. Ecology 1989, 70, 164–168. [Google Scholar] [CrossRef]
  22. Xu, Q.; Liu, J.; Su, M.; Chen, W.S. Multi-scale temporal characters mining for bird activities based on historical avian radar system datasets. Aeronaut. J. 2023, 127, 1452–1472. [Google Scholar] [CrossRef]
  23. Fauvel, M.; Chanussot, J.; Benediktsson, J.A. Decision Fusion for the Classification of Urban Remote Sensing Images. IEEE Trans. Geosci. Remote Sens. 2006, 44, 2828–2838. [Google Scholar] [CrossRef]
  24. Pal, B. Measuring fuzzy uncertainty. IEEE Trans. Fuzzy Syst. 1994, 2, 107–118. [Google Scholar] [CrossRef]
  25. Dai, W. Quadratic entropy of uncertain variables. Soft Comput. 2018, 22, 5699–5706. [Google Scholar] [CrossRef]
  26. Xu, Q.; Liu, J.; Su, M.; Chen, W. Quantitative Bird Activity Characterization and Prediction Using Multivariable Weather Parameters and Avian Radar Datasets. Aerospace 2023, 10, 462. [Google Scholar] [CrossRef]
  27. Zabalza, J.; Clemente, C.; Di Caterina, G.; Ren, J.; Soraghan, J.J.; Marshall, S. Robust PCA micro-doppler classification using SVM on embedded systems. IEEE Trans. Aerosp. Electron. Syst. 2014, 50, 2304–2310. [Google Scholar] [CrossRef]
  28. Taha, B.; Shoufan, A. Machine Learning-Based Drone Detection and Classification: State-of-the-Art in Research. IEEE Access 2019, 7, 138669–138682. [Google Scholar] [CrossRef]
  29. Liu, J.; Xu, Q.Y.; Chen, W.S. Classification of Bird and Drone Targets Based on Motion Characteristics and Random Forest Model Using Surveillance Radar Data. IEEE Access 2021, 9, 160135–160144. [Google Scholar] [CrossRef]
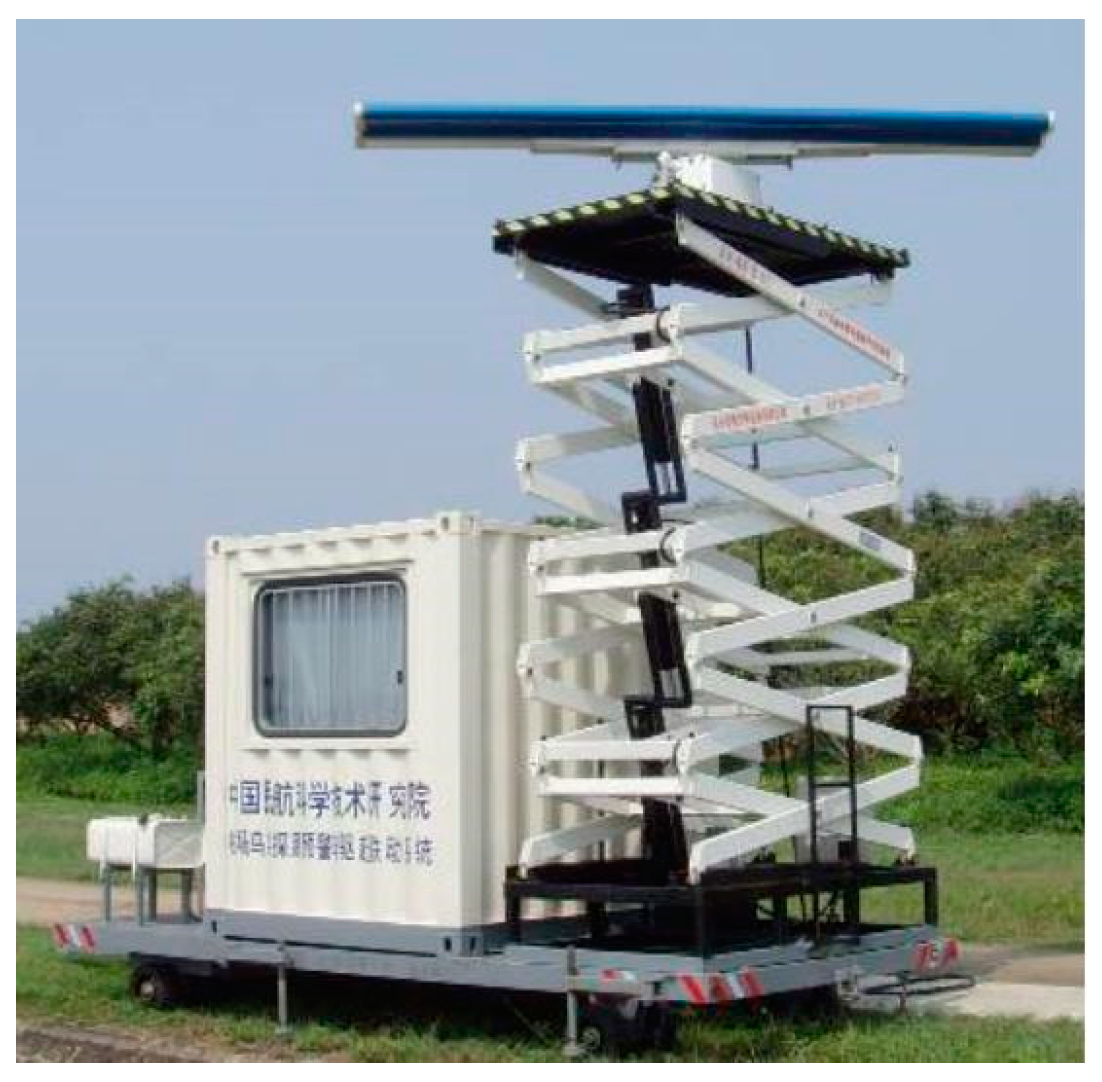
Figure 1. Avian radar system developed by CAST.
Aerospace 11 00442 g001
Figure 2. Geographical demonstration of Fucheng Airport and bird situation.
Aerospace 11 00442 g002
Figure 3. Framework of bird activity modeling and periodicity character extraction.
Aerospace 11 00442 g003
Figure 4. Graphical illustration for airspace grid discretization.
Aerospace 11 00442 g004
Figure 5. Reference spot distribution within airport airspace.
Aerospace 11 00442 g005
Figure 6. Framework of bird activity degree extraction.
Aerospace 11 00442 g006
Figure 7. Categorical probability distribution for datasets in September at reference spot II.
Aerospace 11 00442 g007
Figure 8. Periodicity indices distribution for datasets in September at reference spot II.
Aerospace 11 00442 g008
Figure 9. Daily track count presentation and data selection.
Aerospace 11 00442 g009
Figure 10. Hour span extraction for a specific period.
Aerospace 11 00442 g010
Figure 11. Periodicity indices in spot I for August: (a) 14 h period and (b) 9 h period.
Aerospace 11 00442 g011
Figure 12. Periodicity indices in spot I for September.
Aerospace 11 00442 g012
Figure 13. Periodicity indices in spot I for October.
Aerospace 11 00442 g013
Figure 14. Periodicity indices in spot II for August: (a) behavior index and (b) uncertainty index.
Aerospace 11 00442 g014
Figure 15. Periodicity indices in spot II for September: (a) behavior index and (b) uncertainty index.
Aerospace 11 00442 g015
Figure 16. Periodicity indices in spot II for October: (a) behavior index and (b) uncertainty index.
Aerospace 11 00442 g016
Figure 17. Distribution of periodicity indices for August: (a) spot III and (b) spot IV.
Aerospace 11 00442 g017
Figure 18. Periodicity indices for September: (a) spot III and (b) spot IV.
Aerospace 11 00442 g018
Figure 19. Periodicity indices for October: (a) spot III and (b) spot IV.
Aerospace 11 00442 g019
Table 1. Activity grade definition from intensity.
Activity GradeActivity IntensityActivity GradeActivity Intensity
120–28661–68
229–36769–76
337–44877–84
445–52985–92
553–601093–100
Table 2. Bird-activity-level definition from activity degree.
Activity LevelHighMediumLow
Activity Degree97+54–9620–96
Disclaimer/Publisher’s Note: The statements, opinions and data contained in all publications are solely those of the individual author(s) and contributor(s) and not of MDPI and/or the editor(s). MDPI and/or the editor(s) disclaim responsibility for any injury to people or property resulting from any ideas, methods, instructions or products referred to in the content.