1. Introduction
The aviation industry is undergoing a constant transformation, spurred by an unceasing drive for technological innovation and the escalating demands for operational efficiency, safety, and environmental sustainability. In this evolving landscape, the development and integration of autonomous navigation systems in airport environments have captured significant interest due to their potential for resource optimization and reduction in the ecological footprint of airport operations.
The integration of artificial intelligence (AI) in automating airport navigation tasks needs to address the complex challenges arising from the increasing traffic and the diversification of air fleets. This diversification includes not only traditional crewed aircraft but also unmanned aerial systems (UAS) and emerging urban air mobility (UAM) vehicles. Automated taxiing, the process of guiding aircraft autonomously on the ground between hangars or designated aircraft stands and runways, has already been identified as a relevant but still poorly explored area that could benefit from further research, according to the European RPAS Steering Group [
1]. The seamless integration of these varied vehicles into the existing airport infrastructure needs innovative AI-driven methodologies, tools, and systems. These are essential for capturing and interpreting environmental data to make efficient autonomous decisions. Furthermore, the automation of ground support vehicles, such as passenger, cargo, and maintenance vehicles, would benefit significantly from AI integration, thereby improving the efficiency and safety of airport ground operations, minimizing human errors, and optimizing resource allocation. Indeed, over 26% of aviation incidents occur on the ground, underscoring the operational complexities and associated risks [
2]. These incidents have an estimated annual economic impact of approximately eleven million euros. Thus, automation is poised, not only to improve the flexibility and execution of tasks but also to yield considerable savings in time and operational costs.
Despite the strong practical and commercial interest, the fulfillment of autonomous airport navigation faces two significant obstacles: the scarcity of publicly available and adequately labeled datasets for machine learning applications, and the challenges associated with accessing heavily regulated airport facilities for capturing data and validating models. These hurdles significantly hamper research efforts, explaining the small number of publications addressing the development of robust and accurate models for navigating the complex and dynamic airport environment.
This paper aims to evaluate whether vision-based object detection models, trained on synthetic data from the Asobo video game flight simulator [
3], known for its advanced rendering technology and high-resolution data integration, can be effectively generalized for real-world scenarios. This innovative approach not only addresses the issues of data scarcity and limited access but also facilitates the safe and realistic validation of autonomous navigation systems within a controlled simulation environment. A comparative analysis of object detection models trained on synthetic, real, and hybrid datasets is conducted, employing various performance metrics to assess the equivalence of simulated and real datasets for perception tasks, and the efficacy of algorithms trained on these mixed datasets.
The paper is organized as follows:
Section 2 reviews related work in the field of autonomous navigation in airports and synthetic datasets.
Section 3 details the methodology used for dataset acquisition, preparation, and preliminary comparison.
Section 4 presents the experimental setup, evaluation metrics, and model training and discusses the findings. The
Section 5 concludes the paper with a summary of the results and future research directions.
It is believed that this research bridges the gap between computer-based and real-world data. As the threshold of widespread adoption of autonomous vehicles is approached, the findings of this study are poised to play a crucial role in shaping the future of airport operations, illustrating the interplay between technological innovation, regulatory frameworks, and the practical challenges of implementation.
2. Related Work
2.1. Airport Autonomous Navigation
Over the last decade, the capabilities of AI-based systems have made autonomous systems increasingly attractive across various fields, including aviation. However, despite the potential for this technology to significantly enhance autonomy in airports, which are more controlled environments than urban traffic, there has been less interest than in other areas. Airport autonomous navigation is a growing field of research, focused on the integration of crewed airplanes, UAVs (Unmanned Aerial Vehicles), and ground support vehicles with the existing infrastructure of civil aerodromes. Recent contributions from various researchers have begun to address these unique challenges, aiming to enhance operational safety and efficiency.
Safe transit requires two main conditions: knowing the vehicle’s correct position and preventing any collisions during maneuvers. In 2013, ref. [
4] already delved into the automated identification of airport markings by employing Hough transform methods to support self-guided taxiing. Their strategy, aimed at rectifying inaccuracies in GNSS signals via image analysis, highlighted the feasibility of merging visual indicators with GNSS information to enhance the precision of UAV navigation. However, navigating the complex and dynamic airport environments needs advanced sensing and autonomous technologies for improved situational awareness and adaptability. Suder et al. [
5] further improved automating taxi operations by enhancing the reliability of lane detection across various environmental conditions, utilizing light photometry systems to detect multi-colored lines and navigational aids. The integration of additional sensors, like LiDAR and camera sensors, also improves object detection and classification, thereby facilitating safer operations of autonomous baggage tractors on airport ramps [
6]. However, adding extra sensors to flying vehicles could increase weight, power consumption, and certification challenges, which is why Coombes et al. [
7] advocated for a machine vision-only approach as the most practical solution for enabling automated taxiing. Their solution was based on semantic segmentation combined with a Bayesian Network classifier using a single monocular camera, an instrument that nearly all vehicles possess, thereby representing a streamlined and efficient way to reach the direct sensing capabilities necessary for autonomous navigation.
Lu et al. [
8] established a precedent by incorporating self-learning techniques into lane detection. Deep learning has also been used as an effective method to improve object detection and recognition as demonstrated by [
9], who showed that CNNs effectively identify four categories of relevant horizontal signs within the airport environment, using high-resolution aerial and satellite imagery. Further contributions have been made by [
10], who developed a novel dataset captured by cameras mounted on an actual support vehicle to enhance the autonomy of logistics vehicles and improve their ability to identify both static and dynamic objects, such as other vehicles, equipment, and personnel. Self-supervised learning techniques and collision avoidance have also provided significant contributions. For instance, ref. [
11] discussed the use of autoencoders to detect anomalies, addressing critical challenges such as aircraft separation through the integration of computer vision and millimeter-wave radar technologies.
Finally, ref. [
12] identified both the challenges and inherent advantages of the safety and efficiency of an autonomous aircraft taxiing system and proposed a software architecture tailored to derive a low-level list of taxiways from high-level air traffic control instructions. They emphasized the critical need for robustness in such systems, especially those using adaptive algorithms. They detail the implementation of a route planner and controller, validated within the X-Plane® flight simulator. Although their current work does not incorporate vision-based control and relies solely on simulated GNSS data, the authors pinpointed vision technology as a promising avenue for future exploration.
2.2. Synthetic Dataset
Accessing high-quality, large-scale datasets is crucial for developing vision-based deep learning models. In recent years, the evolution of computer vision technologies has underscored the growing importance of synthetic datasets. Although simulations offer numerous advantages, their applicability to real-world scenarios is not always fully assured due to differences in sensor behavior, including noise and failure patterns, compared to actual applications. Furthermore, replicating the precise color reproduction, as well as the quantity and distribution of objects in simulations, poses significant challenges. Nevertheless, simulators and synthetic datasets are invaluable tools, both as alternatives and complements to real-world data across various fields [
13,
14]. This is especially evident in the self-driving car sector, in which simulation platforms, like CARLA [
15], SYNTHIA [
16], and LGSVL [
17], are extensively used.
These collections are frequently evaluated against real-world data to determine their effectiveness in enhancing algorithmic outcomes. Talwar et al. [
18] explore the use of these simulated datasets for perception tasks in self-driving vehicles, investigating how models trained on these resources fare in real-life conditions. Their findings underscore the critical importance of dataset diversity, suggesting that while synthetic data presents numerous advantages, particularly in situations in which real data are scarce, it cannot completely replace the need to use real data to guarantee the effectiveness of perception models in such applications.
In the aviation domain, synthetic data and simulation technologies offer a promising field for the safe and sustainable development and testing of machine learning algorithms. A notable press release by Airbus Defense and Security [
19] highlights how computer-generated data has enhanced the precision of machine learning algorithms in satellite imagery-based aircraft detection and identification by 20%. These observations correlate with the results obtained by [
20] in their work RarePlanes, a dataset that merges real images with those crafted through simulation. Their findings reveal that a mix of 90% generated images and 10% real data can generate results comparable to those based entirely on real datasets in aerial surveillance tasks.
Ducoffe et al. [
21] introduced LARD, a dataset that primarily consists of synthetic images generated via Google Earth Studio®, supplemented with manually labeled images from actual videos for autonomous aviation landings. This approach not only addresses the shortage of open datasets for specific aerial image-based runway detection but also facilitates automated annotation generation for the images.
The automotive industry has integrated synthetic data and readily accessible simulators to bridge gaps in real-world data collection, particularly for modeling rare or hazardous scenarios. In contrast, in the aerospace field, there remains a notable absence of large-scale public datasets and easily accessible simulation tools specifically tailored for autonomous airport navigation. This gap underscores a critical area for future development, which could facilitate more sophisticated, efficient, and reliable AI-driven solutions in airport operations and beyond.
3. Methodology
Following dataset generation, annotation, and initial quality assessment using the online tool Roboflow [
22], a comparative analysis of seven deep learning object detection models, all based on YOLOv8 [
23], was conducted. This analysis was performed against a synthetic and a real test set, each containing entirely unseen images. Each model was trained on a unique dataset type, including purely synthetic, purely real, and hybrid datasets that blend different proportions of both. The use of Roboflow facilitated the tagging process and provided a comprehensive health check of the datasets, ensuring the robustness and reliability of the data prior to model training.
3.1. Dataset Acquisition and Instance Annotation
The cornerstone of any robust machine learning model is the quality and diversity of its training data. This section outlines the methodology for collecting and refining both real-world and synthetic datasets—essential for developing precise object detection models.
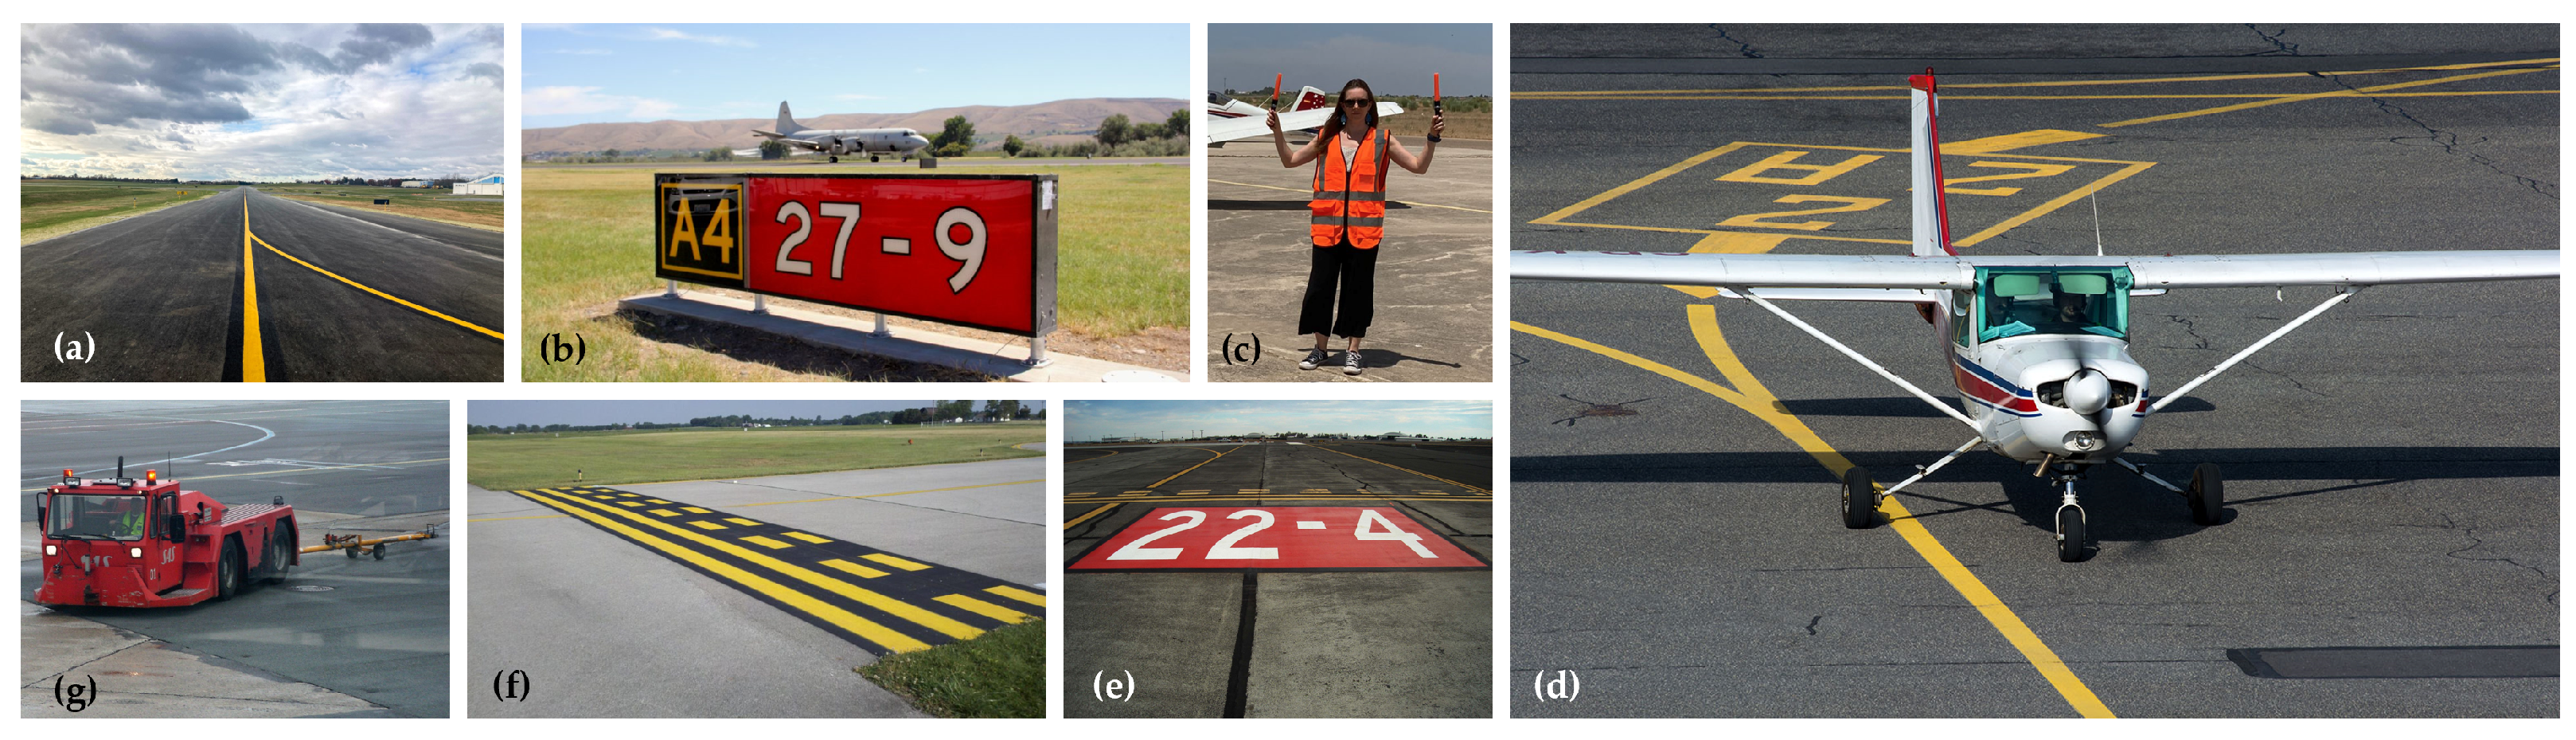
Most airports adhere to the International Civil Aviation Organization (ICAO) standards for safety and operational efficiency, which dictate signage and movement protocols for aircraft and vehicles. In alignment with these standards, and as depicted in
Figure 1, seven key classes for detection and classification have been identified, all essential for encapsulating airport operations and navigational aids: “Taxiway Lane”, to guide aircraft movement; “Vertical Sign”, providing navigational guidance; “Person”, to detect individuals and assure their safety; “Airplane”, to detect both moving and stationary aircraft; “Horizontal Sign”, providing navigational guidance; “Runway Limit”, marking safety boundaries; and “Ground Vehicle”, to represent the diversity of vehicles in airport logistics.
The dataset includes roughly 10% of images as background or null examples to minimize false positives. Label consistency has been ensured with manual and semi-automated annotation, accurately identifying and classifying all relevant instances, including those that are distant, small, or partially obscured. Strict verification of labeling enhances annotation precision, which is crucial for object detection and the effectiveness of the models.
3.1.1. Real Dataset: Acquisition and Characteristics
Acquiring real-world airport imagery posed significant challenges. However, a dataset was assembled that, although not exhaustive, fulfills the research needs. A substantial part of the real dataset is composed of a limited collection of pilot’s perspective air-crew-shared cockpit footage during taxiing, offering a rich variety of operational conditions, while adhering to ethical and legal standards. A smaller proportion, which enriches the understanding of ground vehicle dynamics in airport aprons and enhances category breadth, has been obtained from [
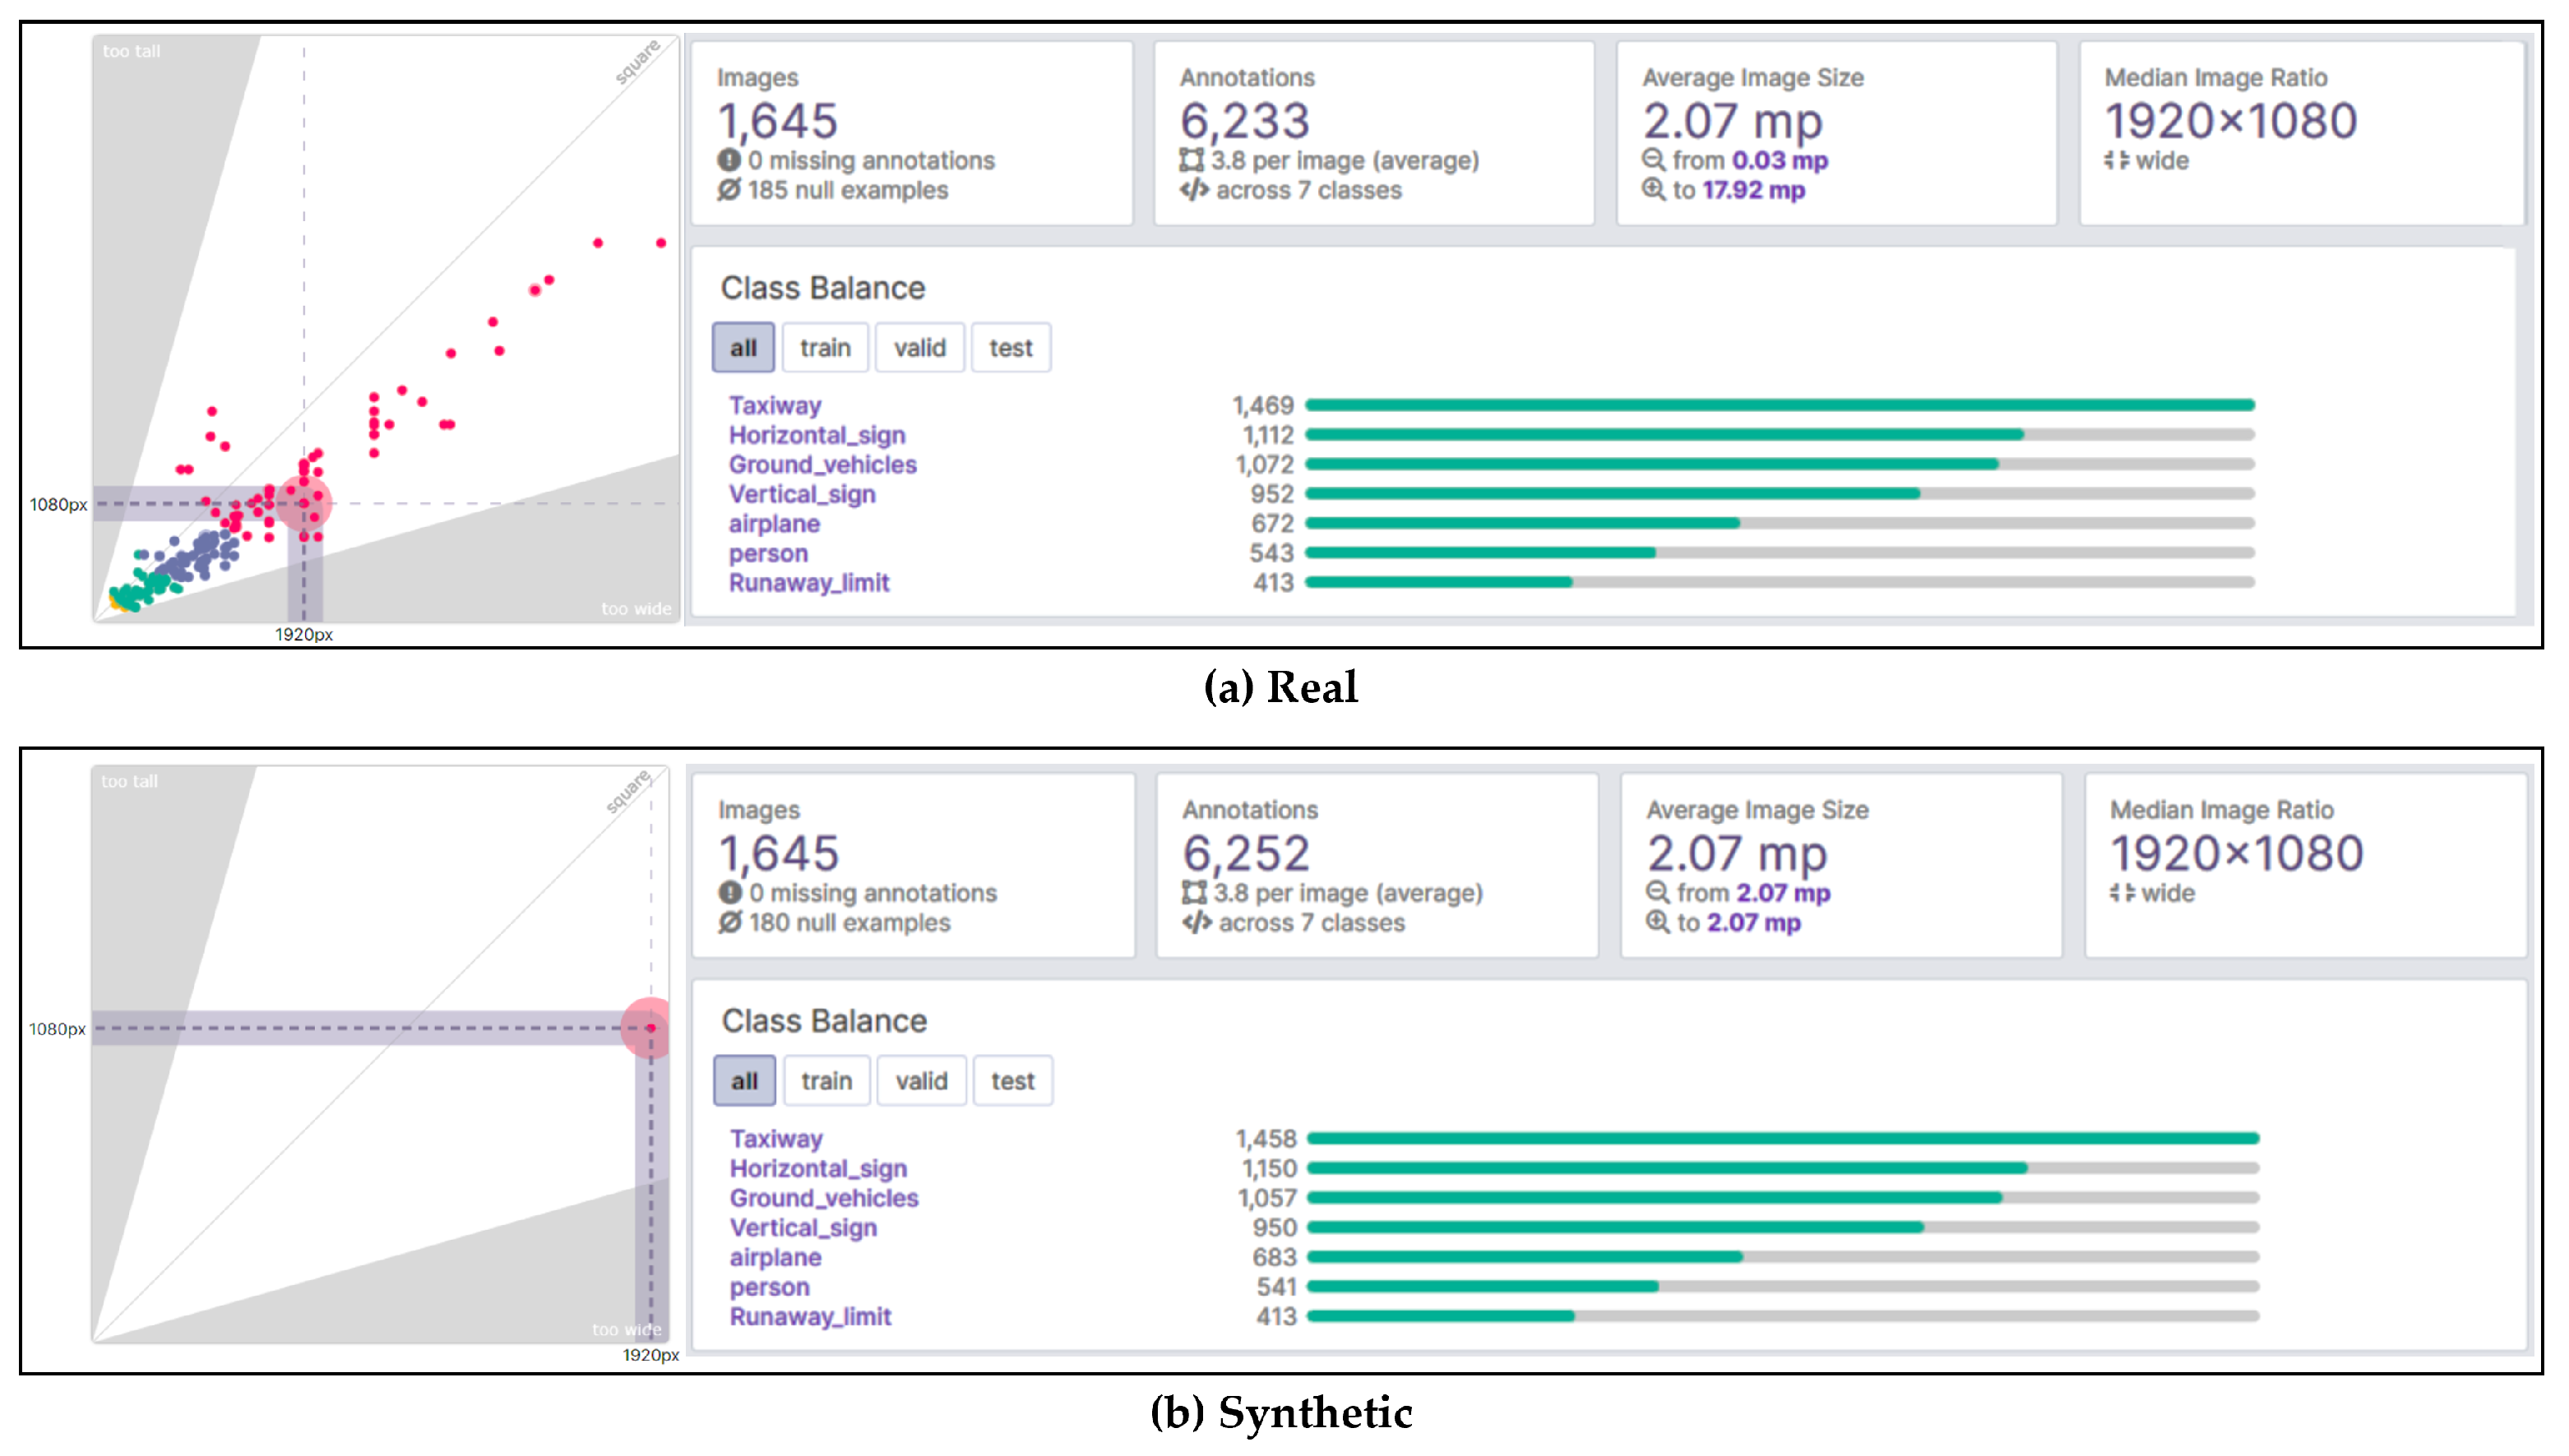
10] and from online sources. Variability in image dimensions within datasets is critical, as many neural networks require square images to meet the architectural demands of fully connected layers. Images that are nearly square can be easily adjusted, whereas excessively elongated images (“too tall” or “too wide”) may need to be removed to prevent biases in model training.
Figure 2 clearly illustrates this image size dispersion. The shaded areas on the left side of the figure emphasize the extreme cases where images are disproportionately tall or wide, which could lead to significant distortion if resized to a square format. The median image size, depicted as a purple rectangle, indicates the central trend of image dimensions, guiding the resizing strategy to be applied across the dataset. As depicted in
Figure 2a, the dataset includes 1645 images, with 185 as null examples to ensure diversity, and contains 6233 annotations over seven classes, showing a skewed distribution that reflects typical airport scenarios. Despite size variations of online images, an average resolution consistent with benchmarks was maintained, ensuring dataset uniformity.
3.1.2. Synthetic Dataset: Generation and Features
The synthetic dataset, crafted for accurate comparison with the real dataset, leverages Microsoft Flight Simulator 2020
®’s (MSFS2020) advanced rendering to simulate a wide range of airport environments. Developed by Asobo Studio and distributed by Xbox Game Studios
®, MSFS2020 uses photorealistic 3D modeling to capture the essence of global landscapes, infrastructure, and weather conditions, supported by an SDK for tailored environment modeling. This dataset comprises 1645 images, manually captured using the video game, including 180 null examples to enhance diversity, and features 6252 annotations across seven key classes, ensuring uniform class representation and image size consistency with the real dataset. Detailed insights into the dataset’s main characteristics and image size variance are presented in
Figure 2b.
3.2. Dataset Quality Analysis
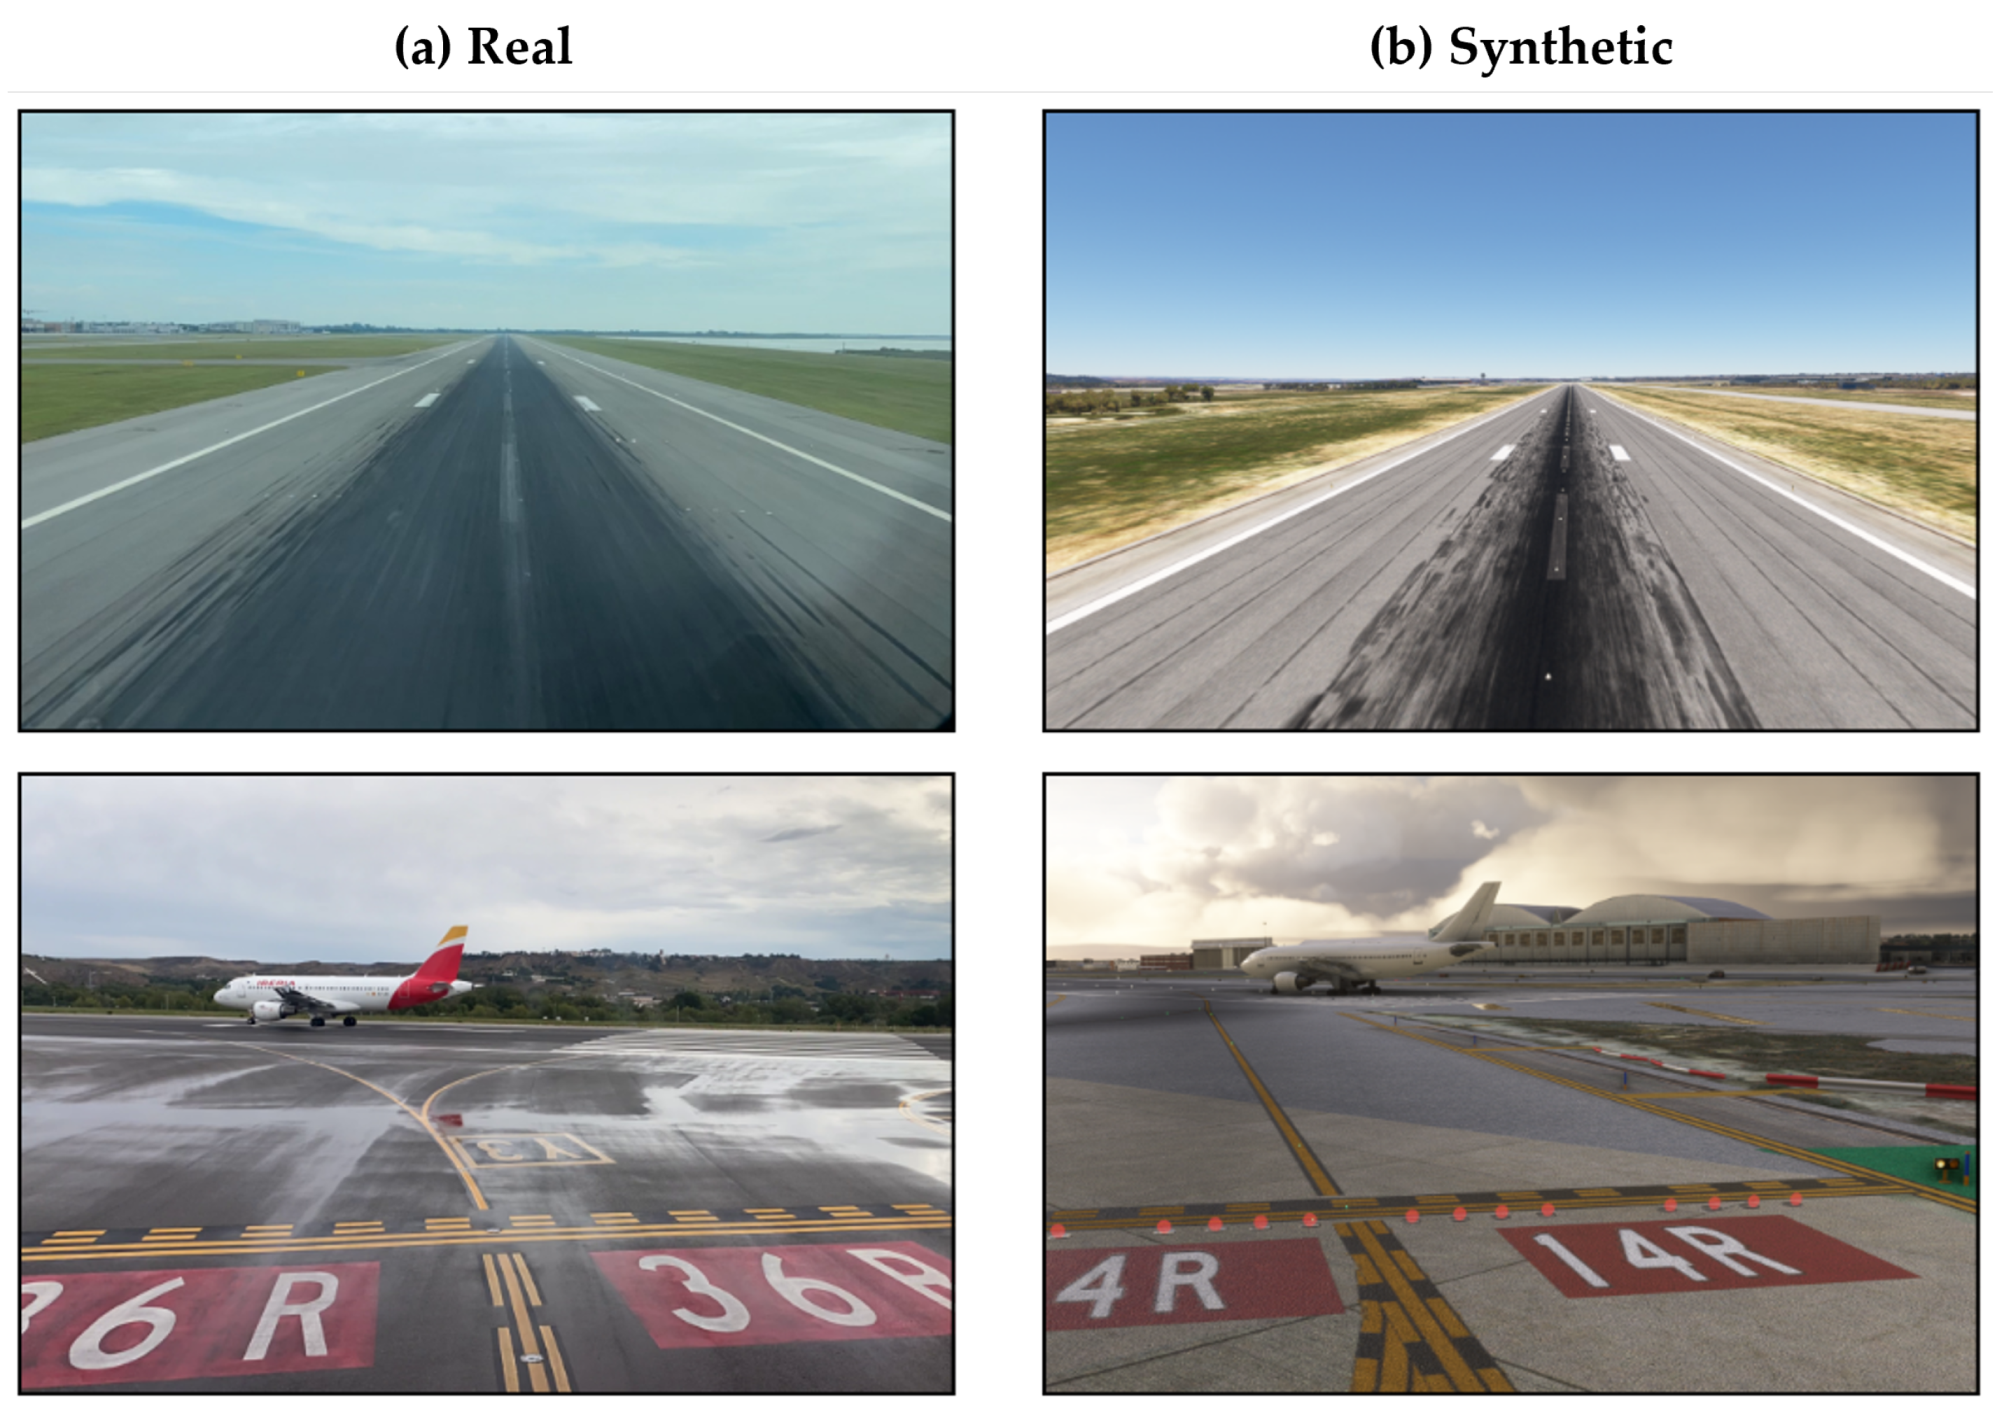
A direct visual comparison, as depicted in
Figure 3, showcases the remarkable realism of synthetic images, closely mirroring real-world scenarios. However, a deeper study by a quantitative analysis could identify intricate details that might influence neural network perceptions, potentially unnoticed by the human eye.
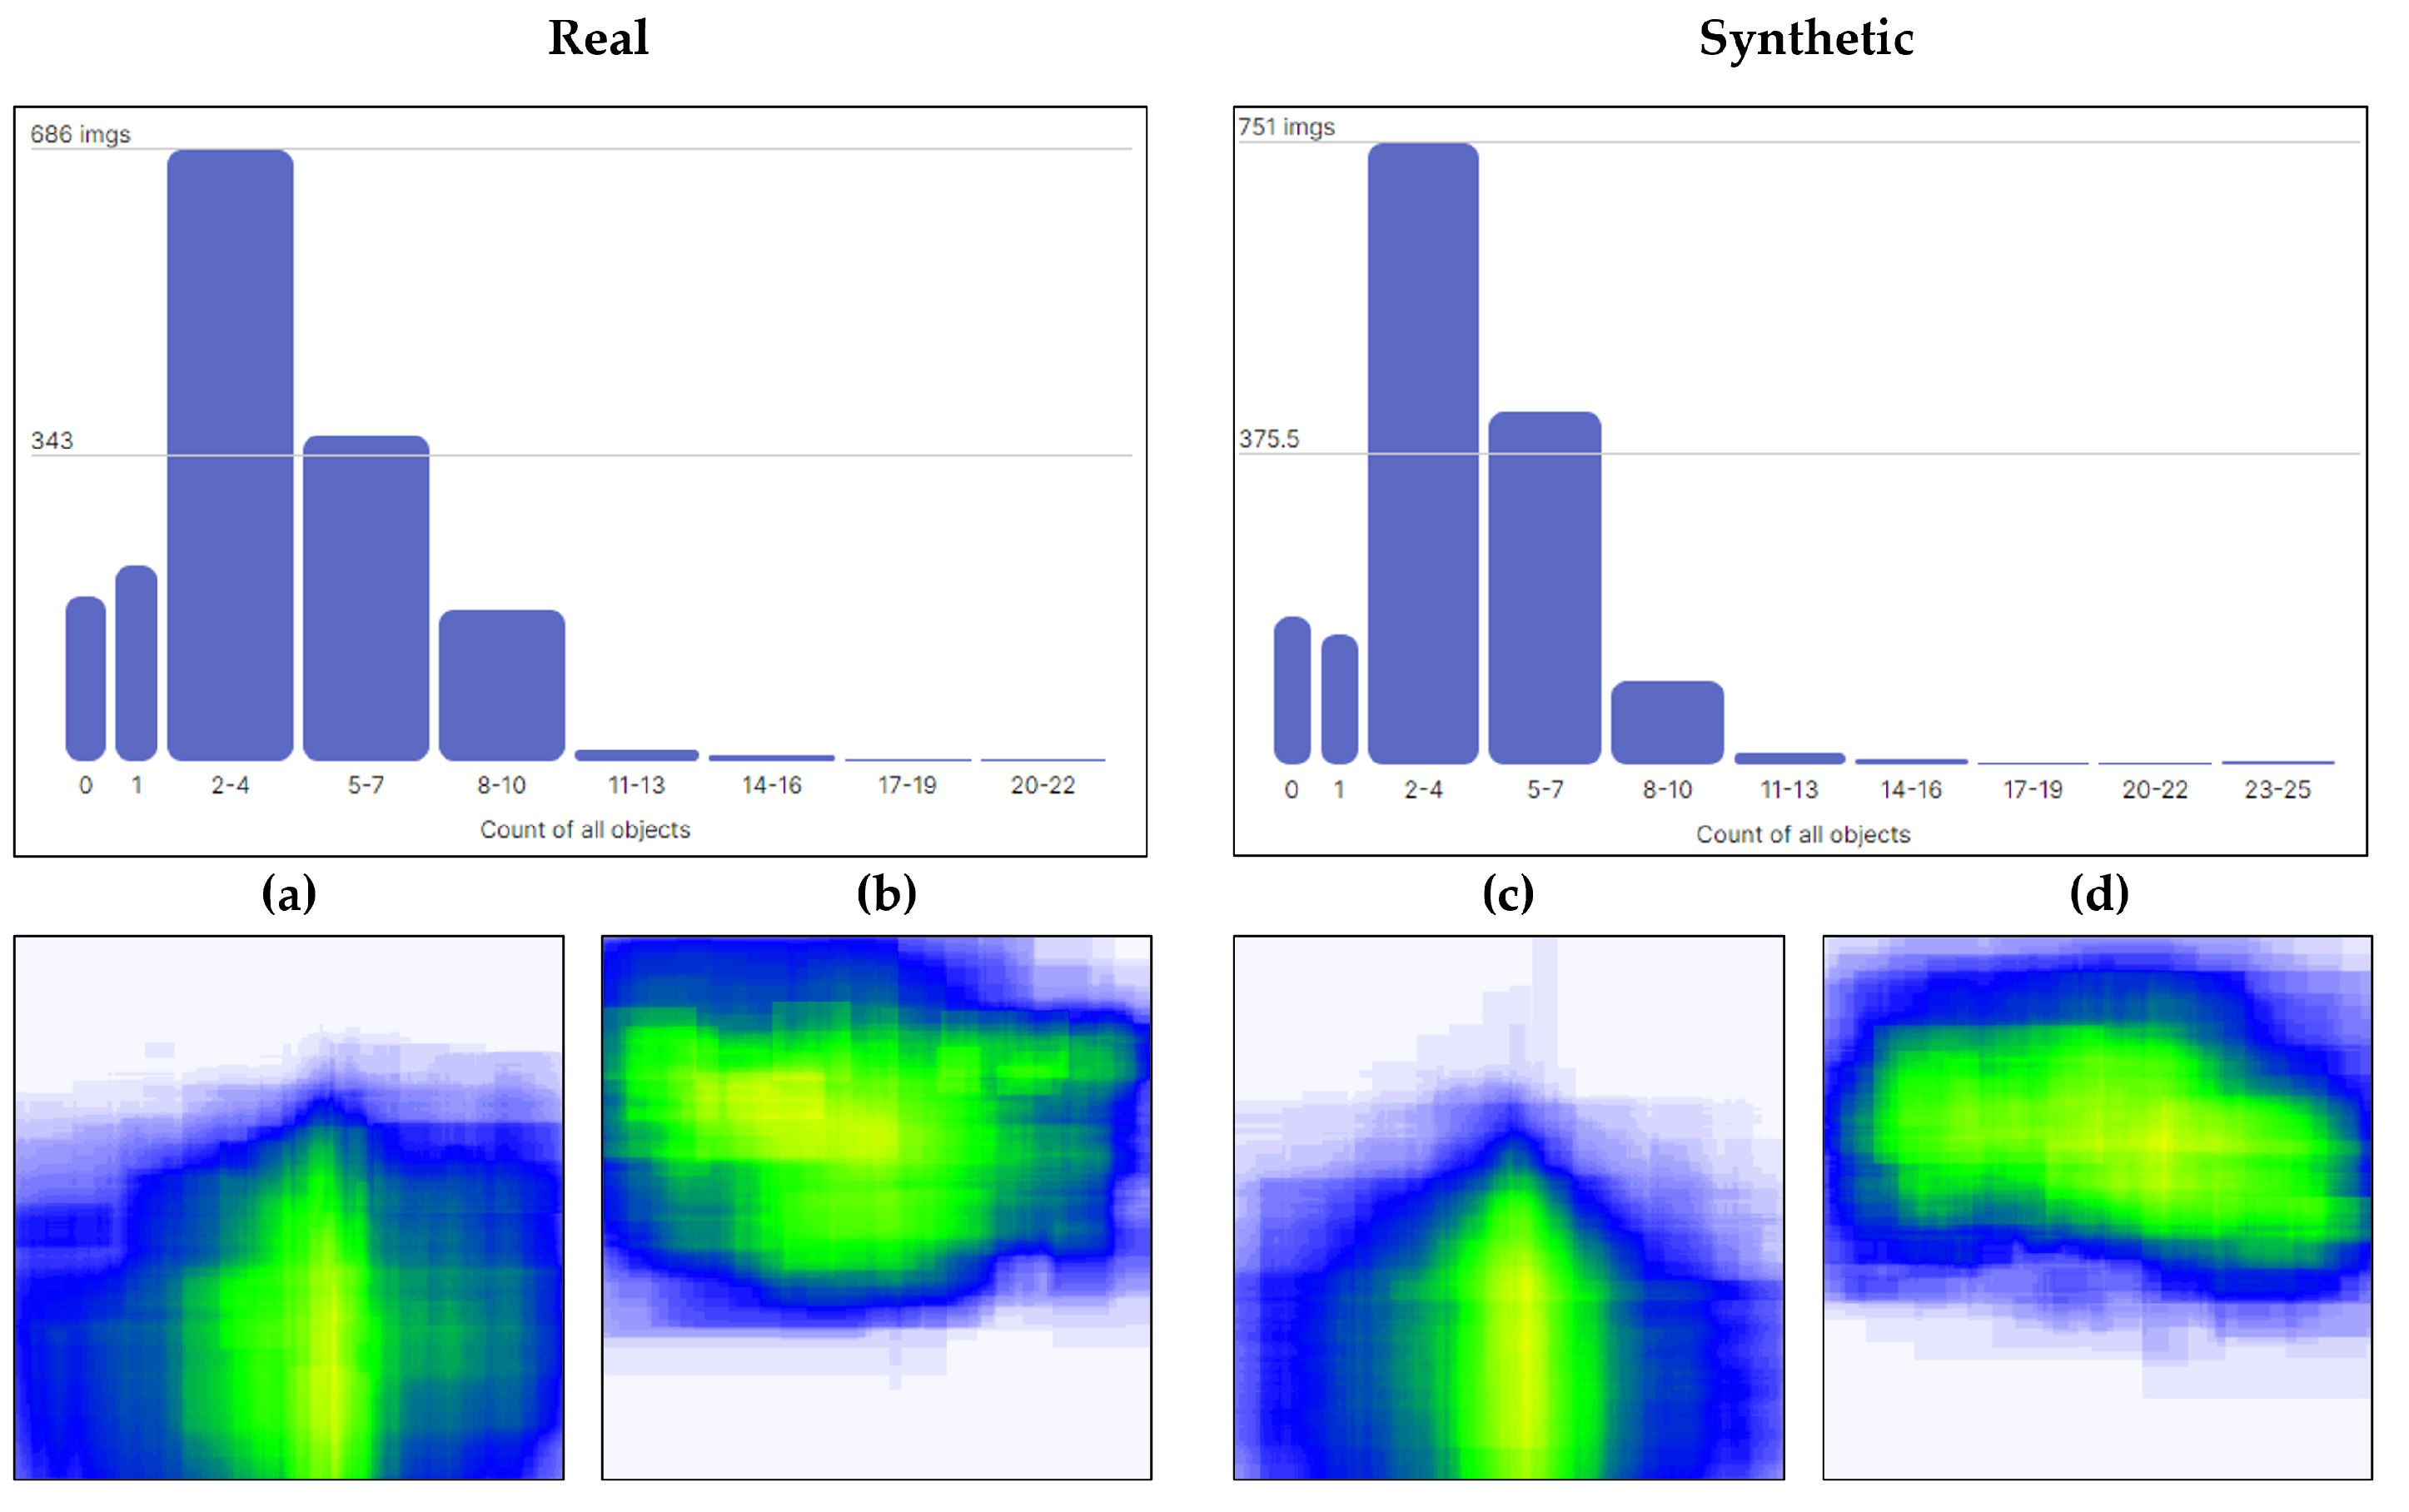
An example of this quantitative analysis is shown in
Figure 4, where histograms at the top of the figure measure the occurrence of all classes across both datasets, showing similar distributions. Below these histograms, heatmaps for two of the classes from each dataset illustrate the spatial distribution of annotations. This visualization is crucial as it influences the predictive capabilities of the neural network. Properly designed datasets that reflect true environmental conditions—where certain classes (e.g., horizontal signs) appear only in specific locations—enhance accurate identification. Conversely, datasets that fail to account for class instances appearing in alternative locations could lead to misclassification errors.
In the heatmaps, color coding qualitatively depicts the dispersion of class instances across the dataset. Yellow areas highlight regions with a higher frequency of annotations, indicating common locations for class instances, while blue areas indicate comparatively fewer annotations, and uncolored zones show the absence of annotations for that class in those areas.
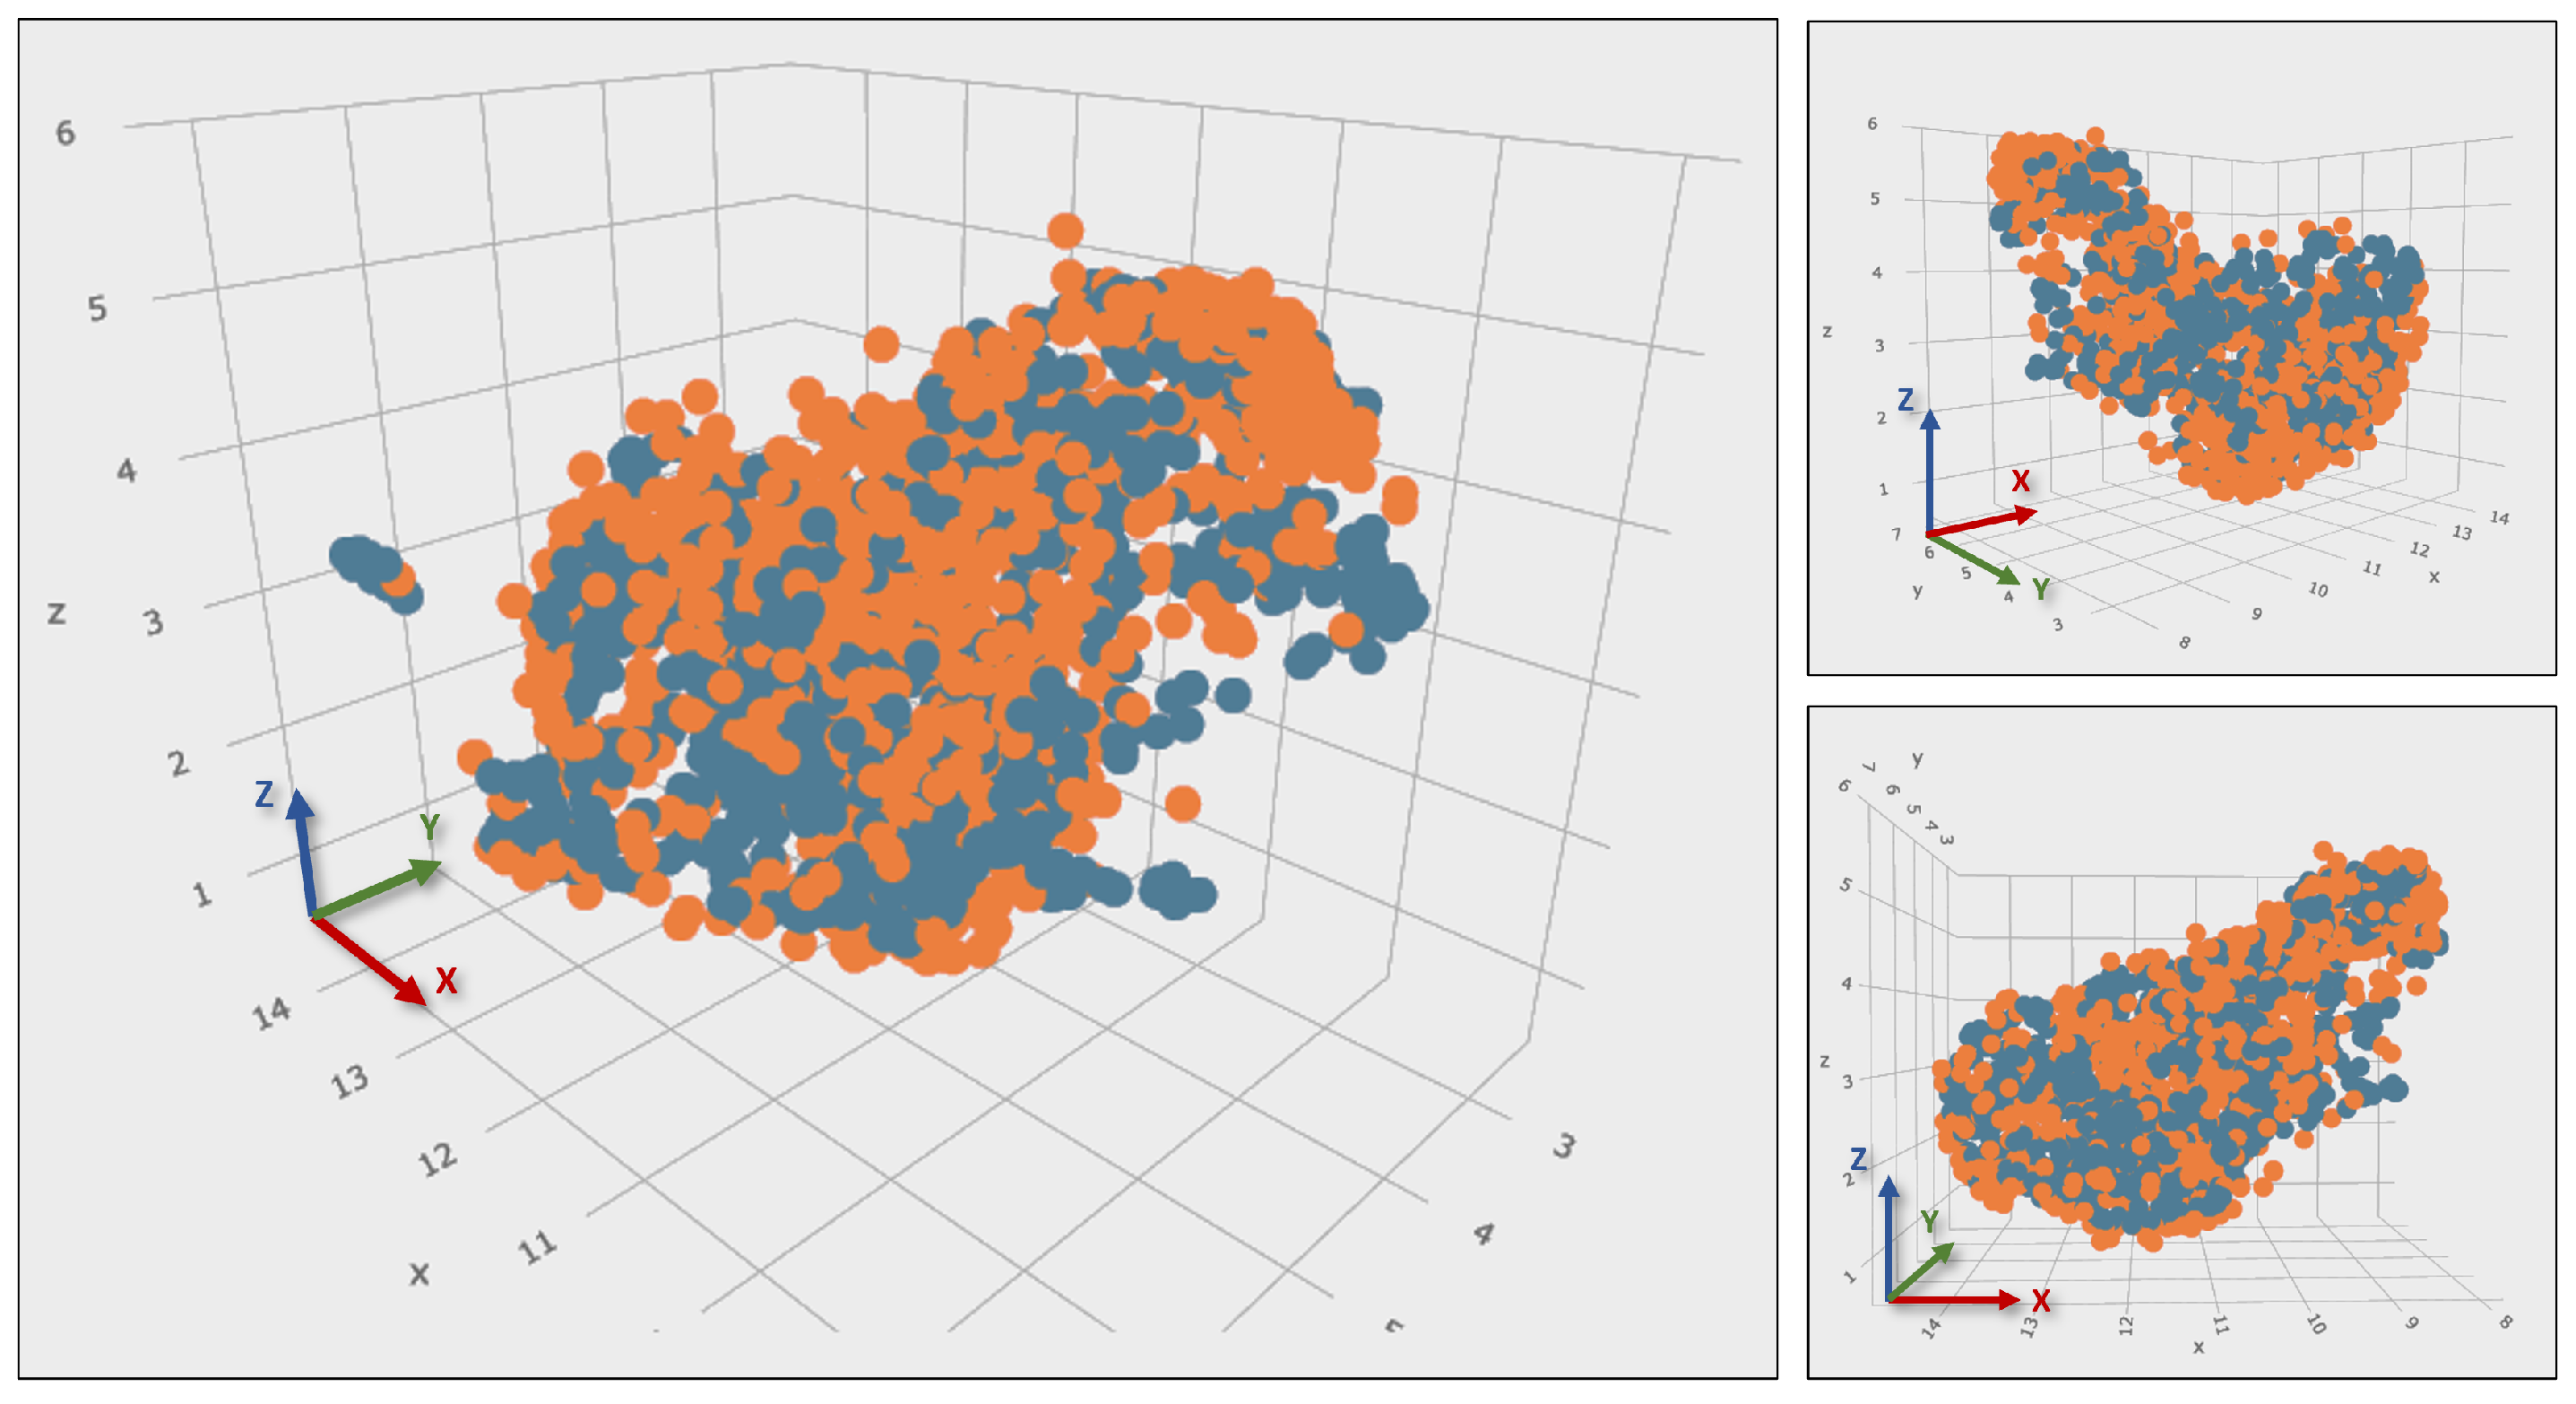
The application of the Uniform Manifold Approximation and Projection (UMAP) technique, alongside a Feature Pyramid Network, is fundamental to the analysis. This method transforms images into embeddings, numerical vectors that encapsulate key attributes such as color, texture, shape, and composition. These embeddings facilitate a granular comparison across datasets. The 3D visualization in
Figure 5 demonstrates the coherent clustering of both real and synthetic datasets, underscoring the fidelity of the feature representations. In this visualization, the axes
x,
y, and
z represent the principal components of the embedded space derived from the dimensionality reduction process. These dimensions are not physical units but are scales that capture the most significant variances within the dataset, essential for illustrating underlying data relationships.
The analysis confirms substantial coherence at the levels of visual detail, object distribution, and embeddings between the datasets.
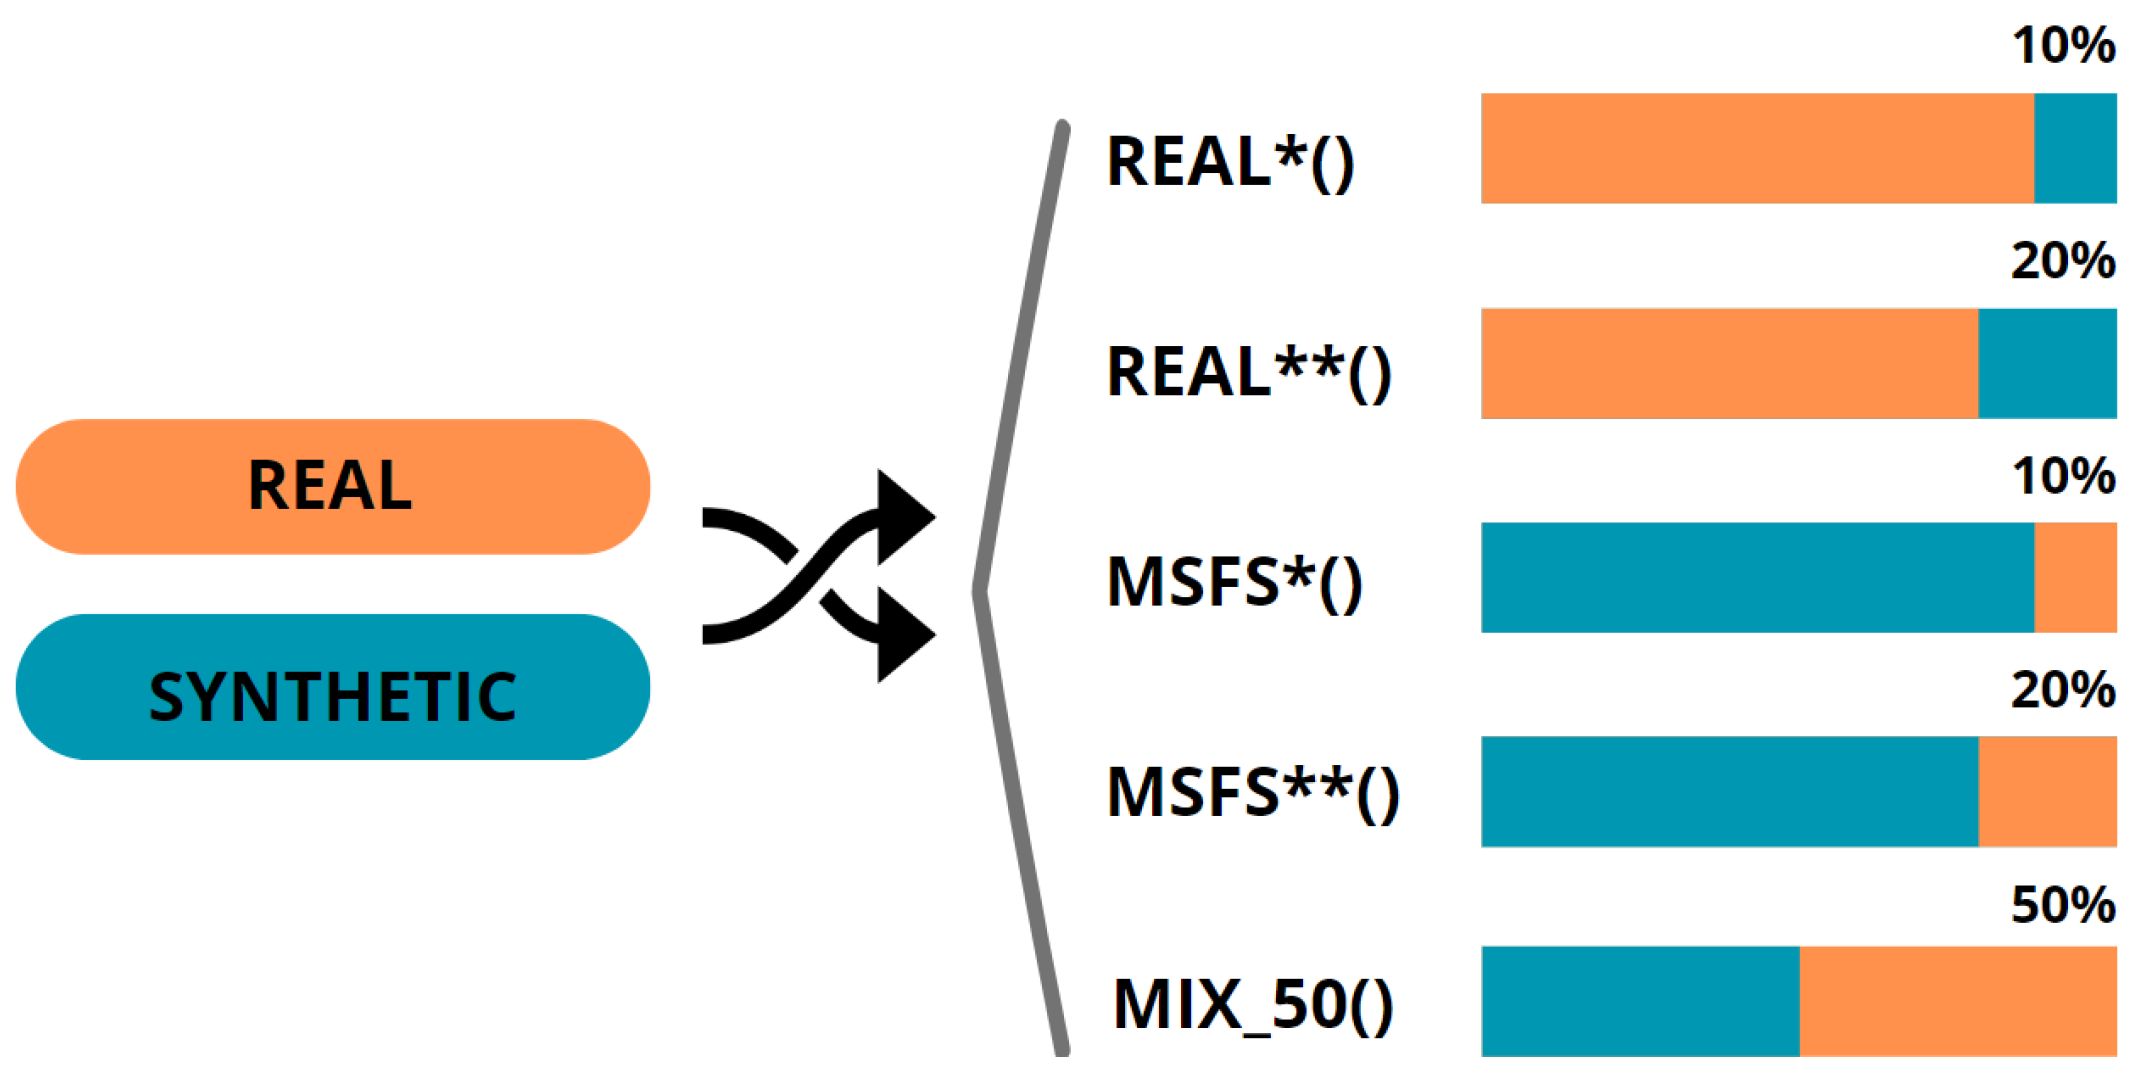
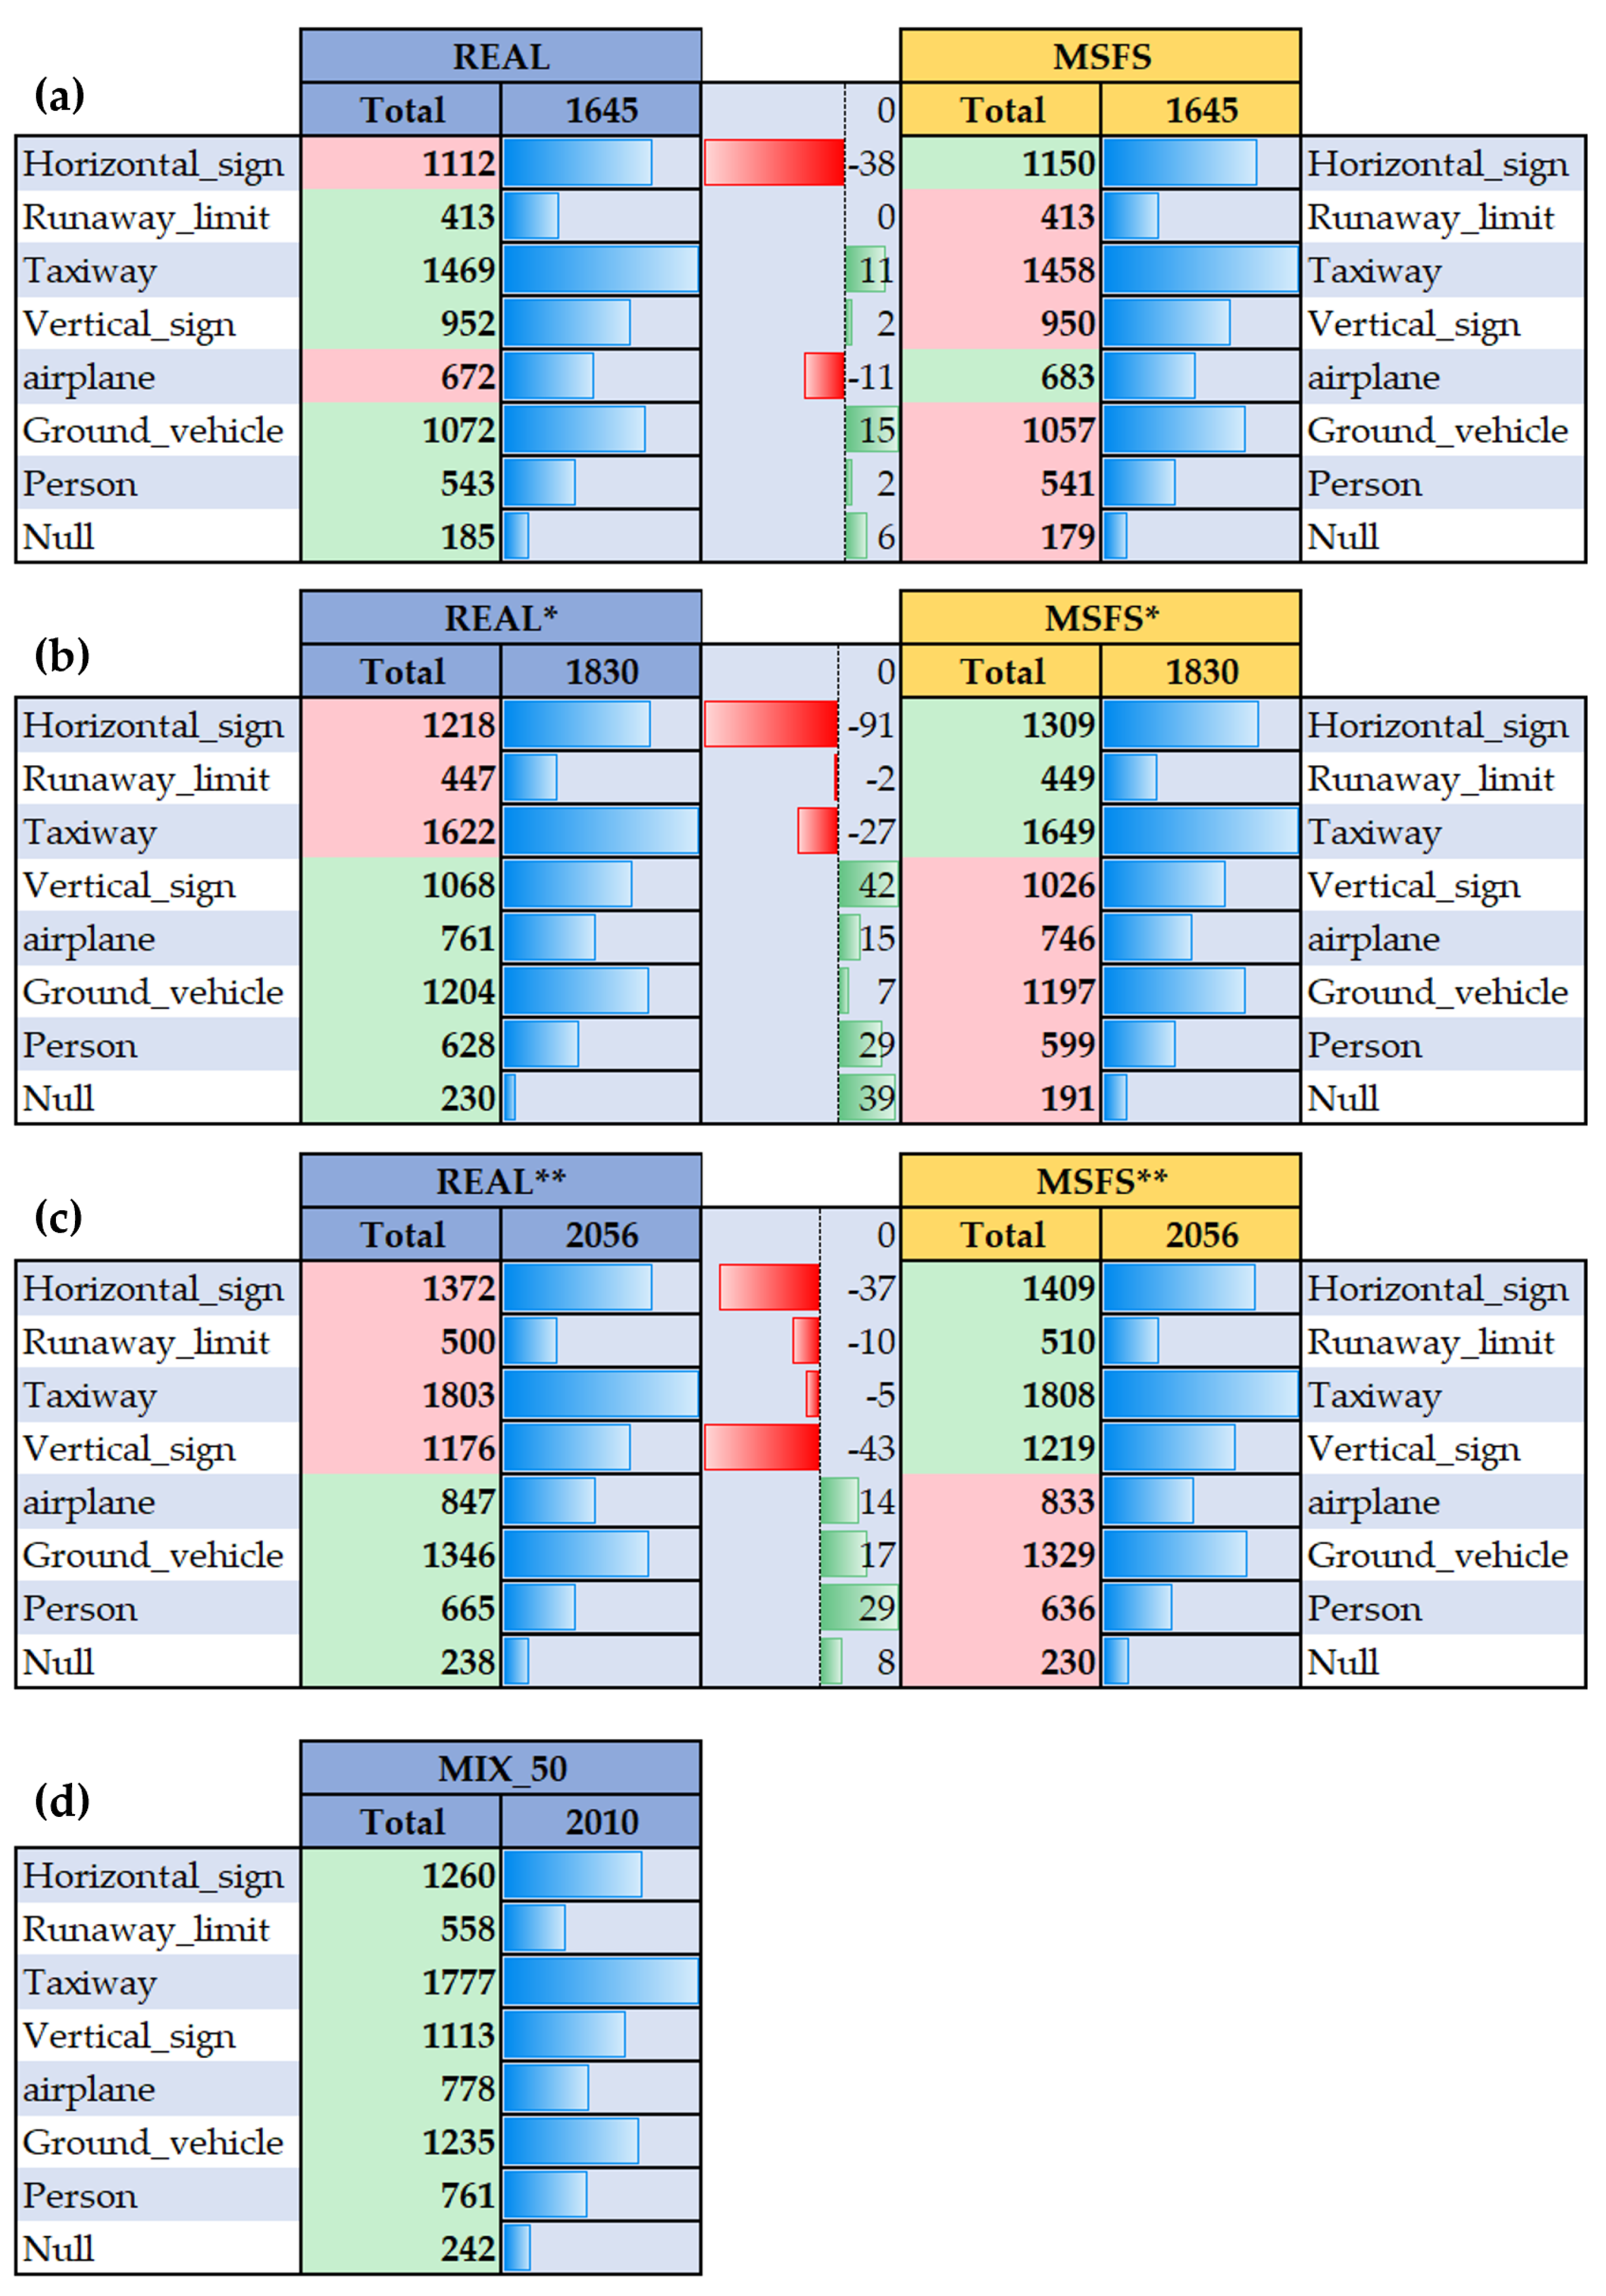
3.3. Hybrid Datasets: Merging Real and Synthetic Data
To enhance dataset diversity, real and synthetic images were merged, creating hybrid datasets with variable proportions of the two. A base of 1645 images was augmented with either 185 or 411 images from the other dataset to achieve a 10 or 20% mixture. This resulted in two datasets of 1830 and 2056 images, respectively. This approach produced four distinct hybrid datasets, as depicted in
Figure 6. These datasets, designed for balanced comparative analysis, maintain consistency with the original class distribution datasets and keep class variance within a 5% error margin (see
Figure 7).
4. Experiments, Results, and Discussion
After generating and assessing the similarity between real and synthetic datasets, their efficacy in training AI models in object detection tasks was evaluated using the YOLOv8-Large model. This model was selected because of its proven efficiency and accuracy in real-time object detection, which enables comprehensive end-to-end analysis for object localization and classification within airport scenes.
The YOLOv8 architecture integrates a ResNet-50 model backbone for feature extraction, and head layers for output predictions. Initially pre-trained on the extensive ImageNet dataset, the backbone is further refined on the COCO dataset, a rich object detection dataset encompassing images from everyday scenarios with 80 object classes, including ‘airplane’, ‘car’, and ‘person’.
The study aims to compare vision-based models trained on synthetic, real-world, and hybrid datasets, rather than optimizing a specific object detection model. Optimal hyperparameters were explored to improve model metrics, but the aim was not to fine-tune. Rather, a balanced approach was chosen for all models, ensuring uniform application and enabling coherent comparisons across the seven models. The models have been named according to mathematical functions, in uppercase and enclosed in brackets. The datasets employed for training each model in different trials are denoted as function arguments, indicated in lowercase (e.g., “MODEL_A(dataset_a)”).
4.1. Evaluation Metrics
Object detection faces two primary challenges: classifying the presence of objects and determining their precise locations within images. To address these challenges, two metrics are commonly used: (1) precision, which measures the accuracy of object detections by indicating the proportion of correct ones among all detections made, and (2) recall, which assesses the model’s ability to identify all instances of objects, reflecting its overall detection capability. Together, these metrics evaluate both the accuracy of classification and the precision of localization.
Mean Average Precision (mAP) extends this evaluation across multiple object classes by averaging precision and recall, utilizing Intersection over Union (IoU) to compare the overlap between predicted and actual bounding boxes. An IoU threshold of 0.5 is considered for easy detection, whereas mAP50-95 calculates the average precision across IoU thresholds from 0.50 to 0.95, providing a comprehensive view of model performance across various levels of detection difficulty.
Understanding these metrics is key to diagnosing the performance of the model. A low mAP indicates that the model may require broad refinements. A low IoU suggests challenges in precise object localization, possibly needing alternative bounding box strategies. Low precision points to an over-detection of non-existent objects, which could be mitigated by adjusting confidence thresholds. Conversely, low recall indicates missed detections of actual objects, suggesting that improvements in feature extraction or the inclusion of more data might be beneficial. Class-specific AP scores reveal which classes the model struggles with, guiding focused enhancements.
The evaluation prioritizes precision, recall, and particularly the mAP50 and mAP90 metrics. These metrics provide comprehensive insights into the models’ accuracy, their effectiveness in minimizing false negatives, and their overall efficacy in object detection across diverse scenarios.
4.2. Objects Detection Models Training
Seven deep learning models were trained, each on a distinct dataset configuration, as depicted in
Figure 7. To mitigate overfitting, the datasets were randomly divided into 70% for training, 20% for validation, and 10% comprising images never seen before by the models and reserved exclusively for testing. For standardization, images were resized to 640 pixels on each side, and data augmentation techniques were applied, including noise addition (1%), brightness adjustment (±14%), and rotation (±12%).
The training was conducted on Google Cloud Platform™ virtual machines [
25], utilizing NVIDIA® Tesla T4 and Volta V100 GPUs. AdamW optimization with a linear learning rate of 0.001 and a batch size of 16 was used, starting with pre-trained weights. The optimal model for each dataset configuration was determined from 100 training epochs based on validation performance, ensuring low stable losses. The comprehensive training process for all seven models spanned around 40 h.
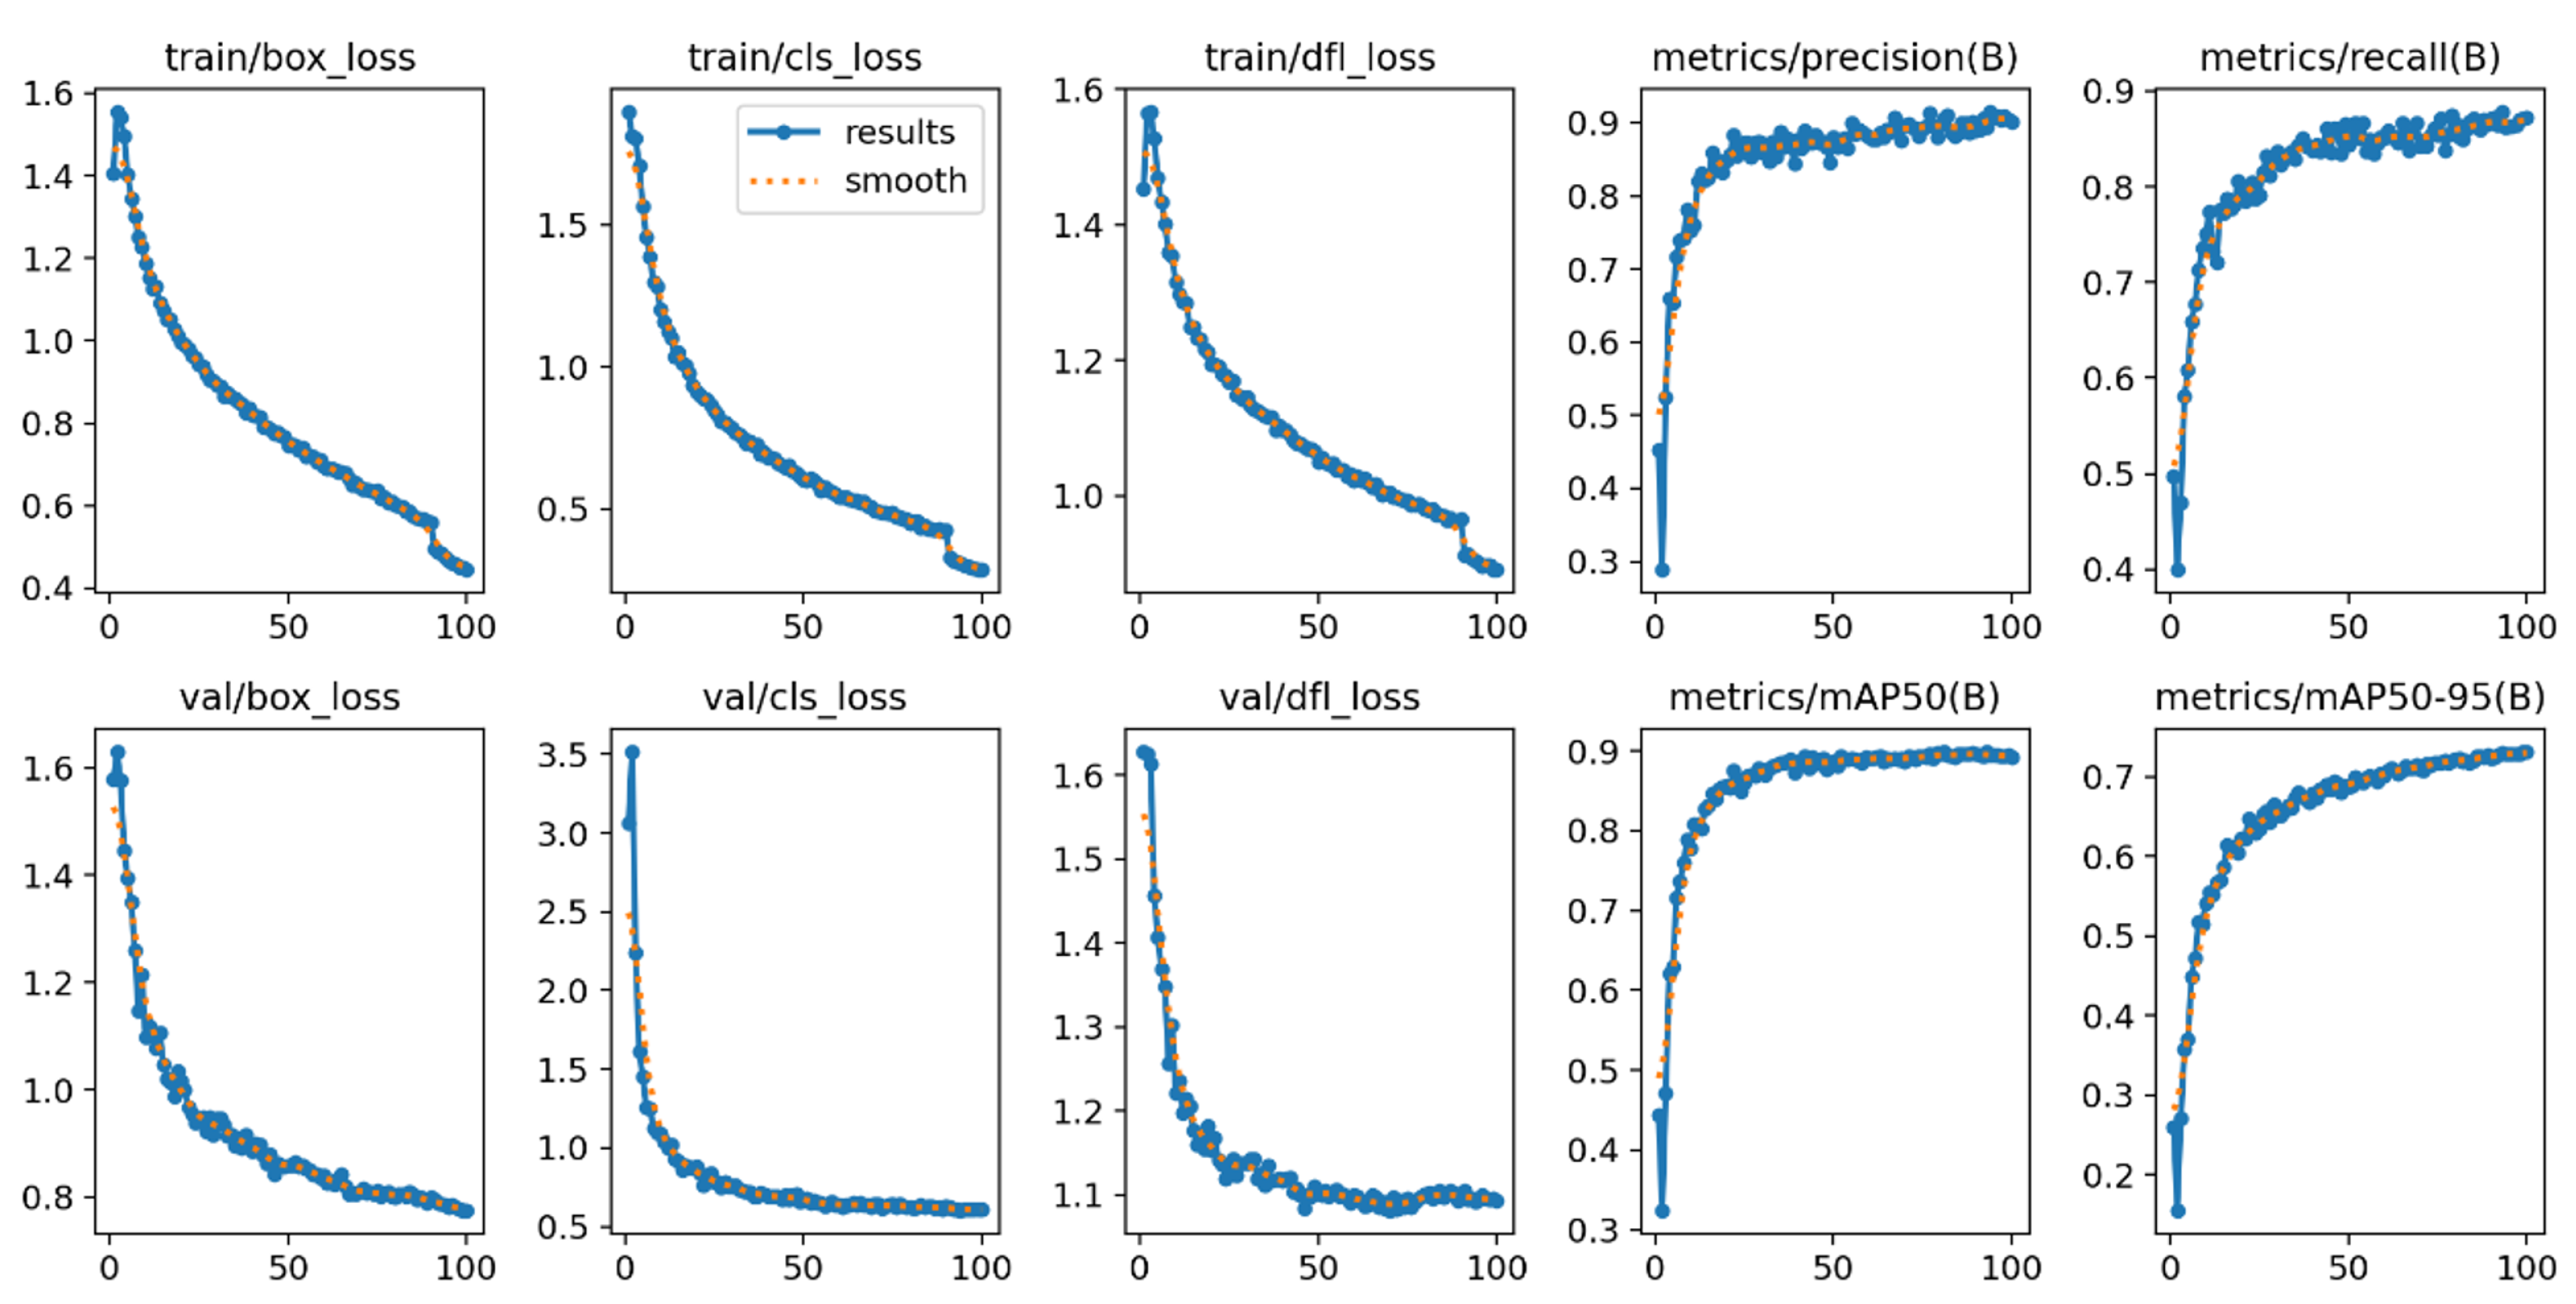
Figure 8 shows the graphs of the metric curves as training progresses for one of the models, serving as an example. Loss functions are crucial for training object detection models. They measure the difference between the model’s predictions and the actual data, showing how effectively the model is learning. Key metrics monitored during training included:
Box Loss (box_loss): evaluation of bounding box coordinate precision against ground truth, essential for accurate object localization.
Class Loss (cls_loss): assessment of the accuracy in object classification within bounding boxes, critical for precise object identification.
Defocus Loss (dfl_loss): specialized metric to enhance detection in unfocused or blurry images, improving performance under challenging imaging conditions.
These metrics, alongside precision, recall, and mAP, offered a detailed overview of training performance, ensuring homogeneous and coherent behavior across all models.
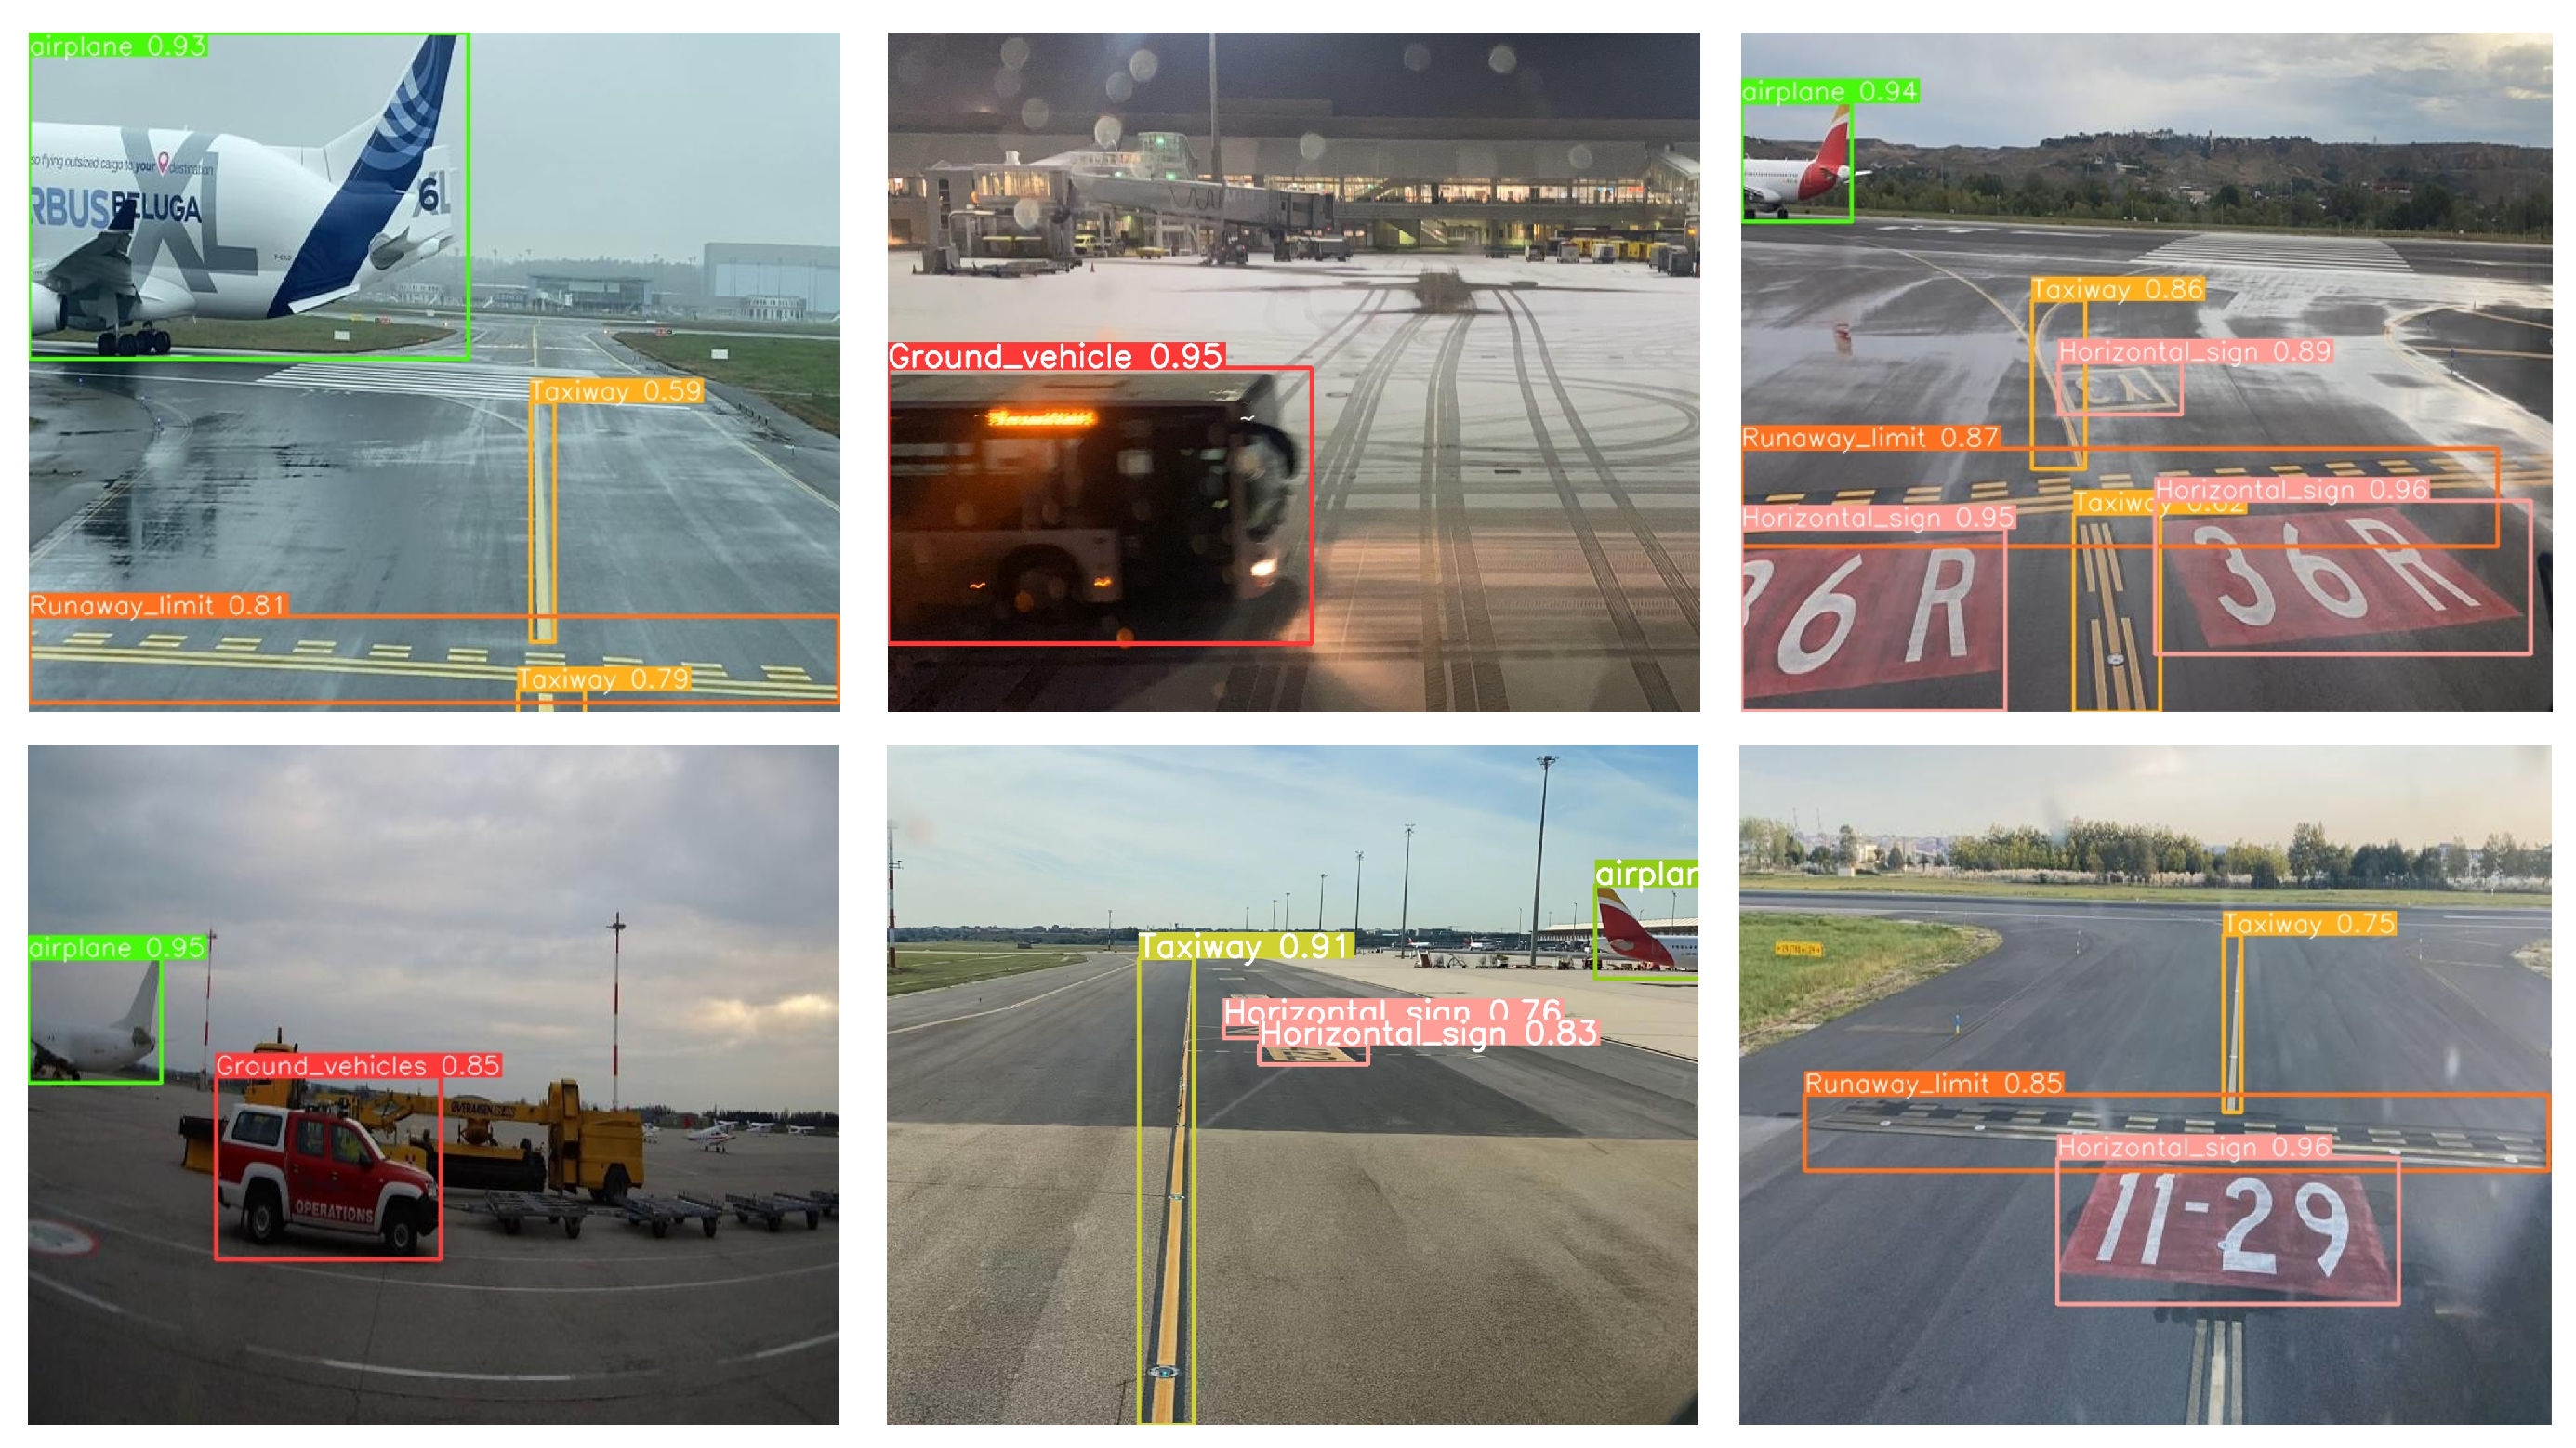
Figure 9 illustrates the capability of this model to identify and classify objects accurately within six validation images, highlighting practical effectiveness in real-world applications. For a detailed analysis of the training results for each specific model, please refer to the
Supplementary Materials provided at the end of the article.
4.3. Results and Discussion
In the comparative analysis, a diverse range of test images from both real and synthetic datasets was carefully selected. These images were previously unseen by the models, ensuring a fair and unbiased assessment of their performance. This dual approach not only allows for the evaluation of the performance of models developed in a virtual environment but also tests the effectiveness of virtual images in validating pre-trained models to handle challenging scenarios that are difficult to replicate in real life.
Figure 10 presents the size and class distribution of these test sets.
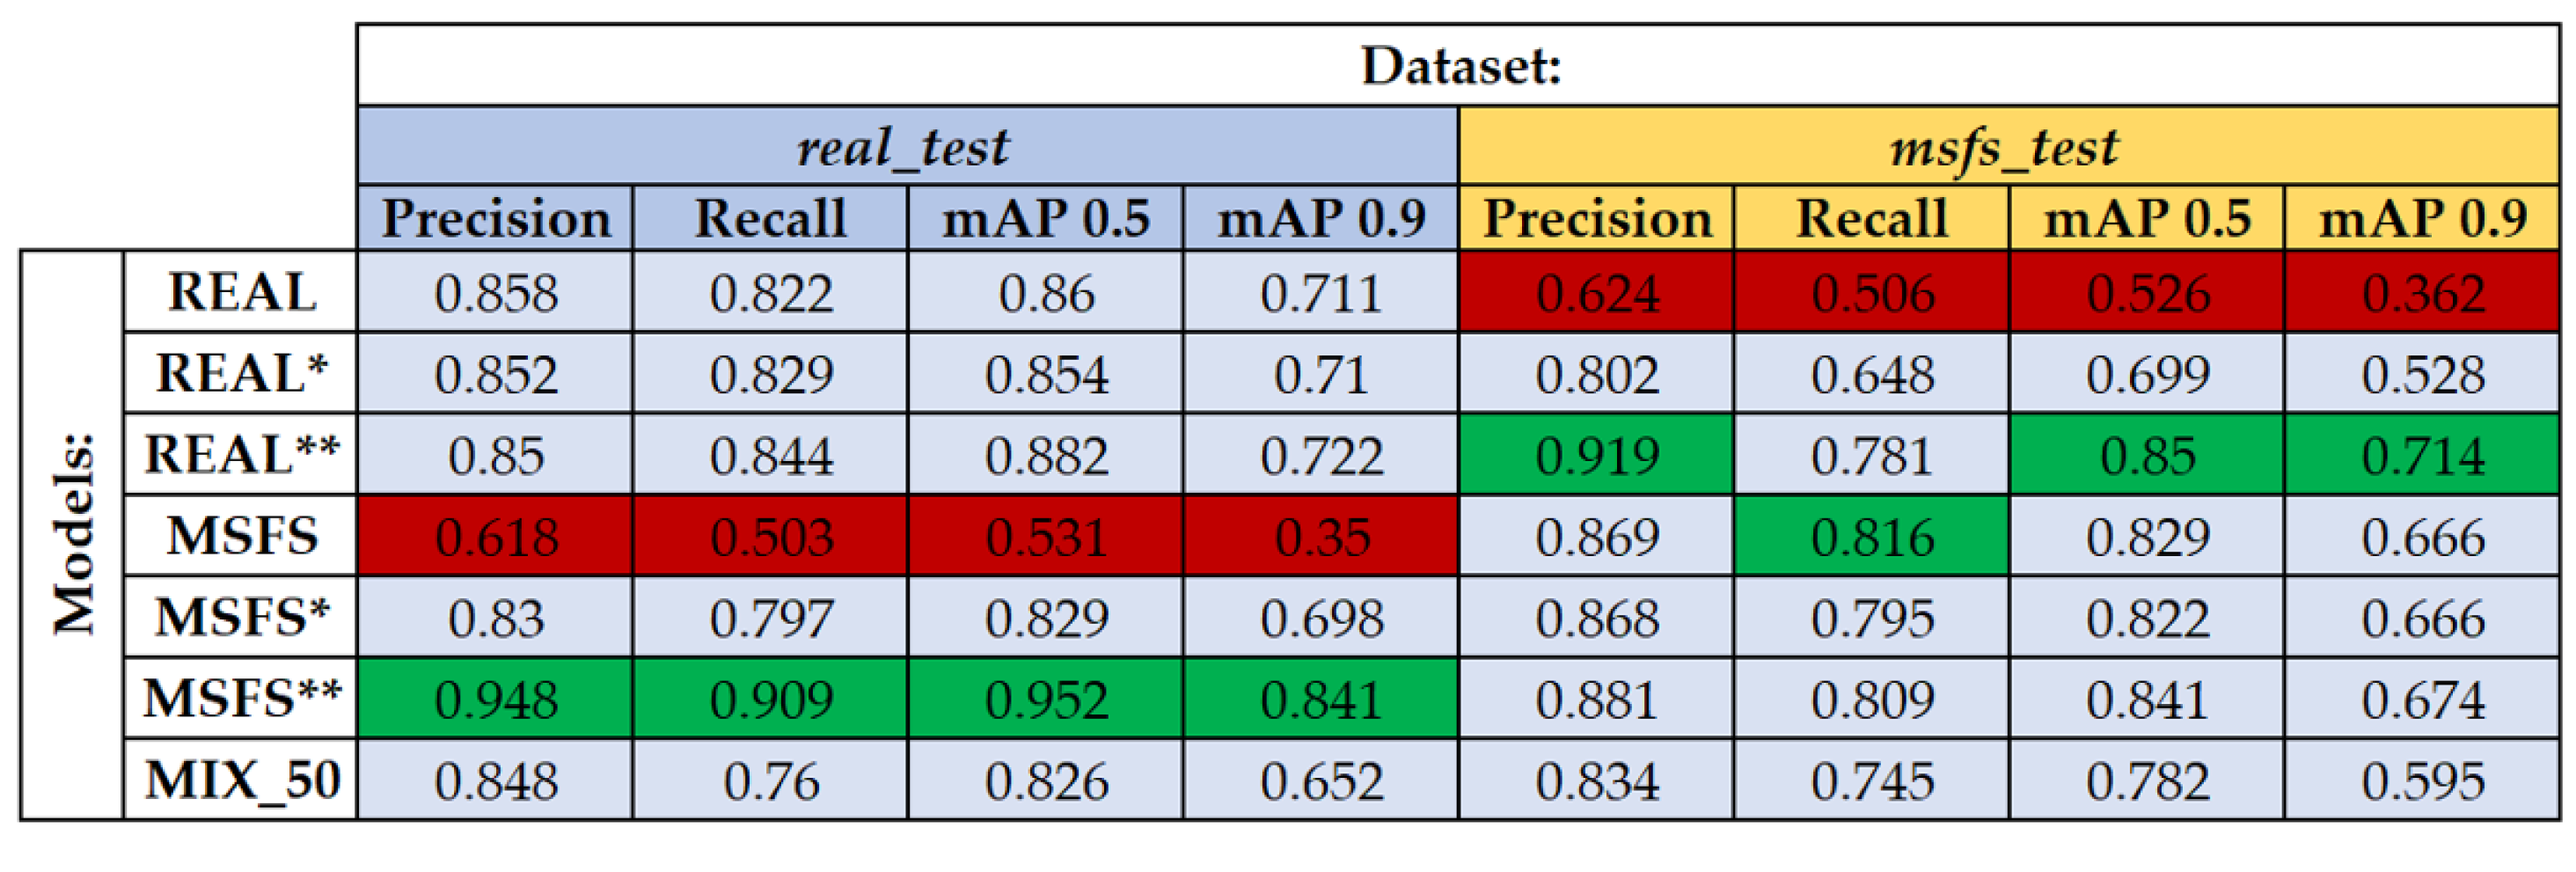
The evaluation process tested each of the seven models against both real and synthetic datasets, totaling 14 evaluations. A detailed class-based analysis is available in the
Supplementary Materials.
Figure 11 condenses these results, using color coding to highlight superior and inferior performances for easy comparison across models and datasets.
Models trained exclusively on real or synthetic datasets exhibited robust performance on their respective test sets, affirming their effective training. However, their efficacy diminished when applied to the opposite dataset type, underscoring the limitations of synthetic data, in fully generalizing real-world conditions. Notably, classes associated with ground markings (“Runway_limit”, “Horizontal_sign”, and “Taxiway”) and entities like “Airplane” and “Person” maintained consistent performance. In contrast, the “Vertical_sign” and, more significantly, the “Ground_vehicle” categories showed weaker results, highlighting discrepancies in the realism between real and synthetic object representations.
Conversely, hybrid models, trained with a mix of real and synthetic data, demonstrated notable improvements across all evaluated metrics, with the optimal compromise solution observed at an 80/20 data mix proportion (e.g., 80% real images, 20% synthetic). The MSFS**(real_test) model exhibited superior performance in tests with real images, suggesting that models primarily based on computer-generated data could achieve satisfactory real-world performance with minimal inclusion of real data. This outcome supports the feasibility of using MSFS2020 as a practical environment for model development and validation. Remarkably, the REAL**(real_test) model outperformed those trained exclusively on real data, highlighting the potential of synthetic data to augment purely real datasets and improve the generalization capabilities of machine learning models. Similarly, the REAL**(msfs_test) model achieved the best performance on tests with synthetic datasets, significantly enhancing its effectiveness with just a 20% addition of synthetic data compared to the model trained only with real images.
5. Conclusions
This investigation addresses the critical issue of limited data availability and simulation environment for autonomous airport navigation and examined the effectiveness of synthetic data from the MSFS2020 video game in enhancing the training and run-time validation of vision-based object detection models. Seven models were trained on distinct datasets comprised entirely of real or synthetic data, and hybrid datasets with varying proportions of both. These models were then rigorously tested against novel real or synthetic datasets, thereby ensuring an unbiased evaluation of their performance.
The findings suggest that, while models trained exclusively on either real or synthetic data perform adequately within their specific domains, their ability to generalize the alternate type of data is limited. This highlights the synthetic data’s shortfall in fully capturing the complexities of real-world environments. In contrast, hybrid models, especially those incorporating a 20% real data mix, demonstrate significant performance improvements. This indicates that the MSFS2020 video game can be relied upon as an easily accessible tool for developing and testing object detection models, provided a minimum percentage of real data is included, to ensure subsequent real-world applicability. Additionally, it has been shown that adding a modest amount of synthetic data to an entirely real dataset enhances the model’s generalization capabilities. This virtual environment has been validated as an effective tool for the robust validation of models by facilitating the virtual generation of scenarios that are challenging to replicate in real life, thereby enhancing the testing and refinement process for these models.
Future work should aim at expanding and enriching the synthetic dataset, thereby improving both its quality and diversity. This includes incorporating representations of various airports, seasons, and daytimes, as well as expanding the number of recognizable classes, especially those relevant to night-time scenarios. Further training and refinement of models will be conducted on this enhanced dataset to maximize performance and advance the development of autonomous navigation solutions in airport environments.
Author Contributions
Conceptualization, M.Á.d.F.C. and A.B.C.; methodology, M.Á.d.F.C. and A.B.C.; software, M.Á.d.F.C. and C.C.V.; validation, M.Á.d.F.C. and C.C.V.; formal analysis, M.Á.d.F.C. and C.C.V.; investigation, M.Á.d.F.C.; resources, M.Á.d.F.C. and A.B.C.; data curation, M.Á.d.F.C. and C.C.V.; writing—original draft preparation, M.Á.d.F.C.; writing—review and editing, M.Á.d.F.C., C.C.V. and A.B.C.; visualization, M.Á.d.F.C. and A.B.C.; supervision, A.B.C.; project administration, M.Á.d.F.C. All authors have read and agreed to the published version of the manuscript.
Funding
This research received no external funding.
Data Availability Statement
Conflicts of Interest
The authors declare no conflicts of interest.
Abbreviations
The following abbreviations are used in this manuscript:
| AI | Artificial Intelligence |
| AP | Average Precision |
| CNN | Convolutional Neural Network |
| GNSS | Global Navigation System |
| GPU | Graphics Processing Unit |
| ICAO | International Civil Authorities Organization |
| IoU | Intersection over Union |
| LiDAR | Light Detection and Ranging |
| mAP | Mean Average Precision |
| MSFS2020 | Microsoft Flight Simulator 2020® |
| RADAR | Radio Detection and Ranging |
| UAM | Urban Air Mobility |
| UAS | Unmanned Aerial System |
| UAV | Unmanned Aerial Vehicle |
| UMAP | Uniform Manifold Approximation |
References
- European RPAS Steering Group. Roadmap for the Integration of Civil Remotely-Piloted Aircraft Systems into the European Aviation System. 2013. Available online: https://ec.europa.eu/docsroom/documents/10484/attachments/1/translations/en/renditions/native (accessed on 14 March 2024).
- Tomaszewska, J.; Krzysiak, P.; Zieja, M.; Woch, M. Statistical Analysis of Ground-Related Incidents at Airports. J. KONES 2018, 25, 467–472. [Google Scholar] [CrossRef]
- Studio, A.; Studios, X.G. Microsoft Flight Simulator. 2020. Available online: https://flightsimulator.com/ (accessed on 14 March 2024).
- Barresi, F.F.; Allasia, W. Airport markings recognition for automatic taxiing. In Proceedings of the 2013 Conference on Design and Architectures for Signal and Image Processing, Cagliari, Italy, 8–10 October 2013. [Google Scholar]
- Suder, J.; Podbucki, K.; Marciniak, T.; Dabrowski, A. Low complexity lane detection methods for light photometry system. Electronics 2021, 10, 1665. [Google Scholar] [CrossRef]
- Lee, S.; Seo, S.W. Probabilistic context integration-based aircraft behaviour intention classification at airport ramps. IET Intell. Transp. Syst. 2022, 16, 725–738. [Google Scholar] [CrossRef]
- Coombes, M.; Eaton, W.; Chen, W.H. Machine Vision for UAS Ground Operations: Using Semantic Segmentation with a Bayesian Network classifier. J. Intell. Robot. Syst. Theory Appl. 2017, 88, 527–546. [Google Scholar] [CrossRef]
- Lu, B.; Coombes, M.; Li, B.; Chen, W.H. Improved situation awareness for autonomous taxiing through self-learning. IEEE Trans. Intell. Transp. Syst. 2016, 17, 3553–3564. [Google Scholar] [CrossRef]
- Dhulipudi, D.P.; Rajan, K.S. Multiclass geospatial object detection using machine learning-aviation case study. In Proceedings of the 2020 AIAA/IEEE 39th Digital Avionics Systems Conference, San Antonio, TX, USA, 11–15 October 2020. [Google Scholar] [CrossRef]
- Steininger, D.; Kriegler, A.; Pointner, W.; Widhalm, V.; Simon, J.; Zendel, O. Towards Scene Understanding for Autonomous Operations on Airport Aprons. In Proceedings of the Asian Conference on Computer Vision, Qingdao, China, 22–24 September 2023; pp. 153–169. [Google Scholar] [CrossRef]
- Shaikh, M.Y.; Petrunin, I.; Zolotas, A. Self-supervised Obstacle Detection during Autonomous UAS Taxi Operations. In Proceedings of the American Institute of Aeronautics and Astronautics, Las Vegas, NV, USA, 23–25 October 2023. [Google Scholar] [CrossRef]
- Zhang, Y.; Poupart-Lafarge, G.; Teng, H.; Wilhelm, J.; Jeannin, J.B.; Ozay, N.; Scholte, E. A software architecture for autonomous taxiing of aircraft. In Proceedings of the American Institute of Aeronautics and Astronautics, Orlando, FL, USA, 9–13 August 2020. [Google Scholar] [CrossRef]
- Cremona, J.; Uzal, L.; Pire, T. WGANVO: Monocular visual odometry based on generative adversarial networks. RIAI—Rev. Iberoam. Autom. Inform. Ind. 2022, 19, 144–153. [Google Scholar] [CrossRef]
- Bauer, A.; Trapp, S.; Stenger, M.; Leppich, R.; Kounev, S.; Leznik, M.; Chard, K.; Foster, I. Comprehensive Exploration of Synthetic Data Generation: A Survey. arXiv 2024, arXiv:2401.02524. [Google Scholar]
- Dosovitskiy, A.; Ros, G.; Codevilla, F.; Lopez, A.; Koltun, V. CARLA: An Open Urban Driving Simulator. In Proceedings of the Conference on Robot Learning, Mountain View, CA, USA, 13–15 November 2017; Volume 78, pp. 1–16. [Google Scholar]
- Ros, G.; Sellart, L.; Materzynska, J.; Vazquez, D.; Lopez, A.M. The SYNTHIA Dataset: A Large Collection of Synthetic Images for Semantic Segmentation of Urban Scenes. In Proceedings of the IEEE Conference on Computer Vision and Pattern Recognition, Las Vegas, NV, USA, 27–30 June 2016; pp. 3234–3243. [Google Scholar] [CrossRef]
- Rong, G.; Shin, B.H.; Tabatabaee, H.; Lu, Q.; Lemke, S.; Mozeiko, M.; Boise, E.; Uhm, G.; Gerow, M.; Mehta, S.; et al. LGSVL Simulator: A High Fidelity Simulator for Autonomous Driving. In Proceedings of the 2020 IEEE 23rd International Conference on Intelligent Transportation Systems (ITSC), Rhodes, Greece, 20–23 September 2020; pp. 1–6. [Google Scholar] [CrossRef]
- Talwar, D.; Guruswamy, S.; Ravipati, N.; Eirinaki, M. Evaluating Validity of Synthetic Data in Perception Tasks for Autonomous Vehicles; Institute of Electrical and Electronics Engineers Inc.: New York, NY, USA, 2020; pp. 73–80. [Google Scholar] [CrossRef]
- AI4. Airbus and AI4 Technologies Announce Partnership to Enhance Airport Operations with OneView. 2021. Available online: https://ai4.io/pdfs/OneView-Airbus-Ai4-Press-Release.pdf (accessed on 14 March 2024).
- Shermeyer, J.; Hossler, T.; Etten, A.V.; Hogan, D.; Lewis, R.; Kim, D. RarePlanes: Synthetic Data Takes Flight. In Proceedings of the 2021 IEEE Winter Conference on Applications of Computer Vision (WACV), Waikoloa, HI, USA, 3–8 January 2021; pp. 207–217. [Google Scholar] [CrossRef]
- Ducoffe, M.; Carrere, M.; Féliers, L.; Gauffriau, A.; Mussot, V.; Pagetti, C.; Sammour, T. LARD—Landing Approach Runway Detection—Dataset for Vision Based Landing. arXiv 2023, arXiv:2304.09938. [Google Scholar]
- Roboflow, Version 1.0. 2024. Available online: https://roboflow.com/ (accessed on 14 March 2024).
- Jocher, G.; Chaurasia, A.; Qiu, J. Ultralytics YOLO. 2023. Available online: https://github.com/ultralytics/ultralytics (accessed on 14 March 2024).
- Rendered.AI. Platform-as-a-Service for Synthetic Data. 2024. Available online: https://rendered.ai/ (accessed on 14 March 2024).
- Bisong, E. Google Colaboratory; Apress: Berkeley, CA, USA, 2019; pp. 59–64. [Google Scholar] [CrossRef]
| Disclaimer/Publisher’s Note: The statements, opinions and data contained in all publications are solely those of the individual author(s) and contributor(s) and not of MDPI and/or the editor(s). MDPI and/or the editor(s) disclaim responsibility for any injury to people or property resulting from any ideas, methods, instructions or products referred to in the content. |
© 2024 by the authors. Licensee MDPI, Basel, Switzerland. This article is an open access article distributed under the terms and conditions of the Creative Commons Attribution (CC BY) license (https://creativecommons.org/licenses/by/4.0/).


