Abstract
In order to ensure that aircraft have medium and long-range flights, enhanced aerodynamic performance, and reduced fuel consumption, this paper presents an original Distributed Hybrid Electric Propulsion Aircraft (DHEPA) design scheme and proposes a novel power allocation management method based on convex optimization. Firstly, by taking the Tecnam P2006T general-purpose aircraft as a reference, key components of DHEPA are selected and modeled. Then, a power allocation management method for DHEPA is proposed on the basis of convex optimization, which takes the minimum fuel consumption as the performance index to realize the reasonable power allocation of the battery and engine, while avoiding sliding into the local optimum of allocation. Finally, momentum theory and numerical simulation methods are used to analyze the aerodynamic enhancement effect of the propeller on the wing in the DHEPA, and a dynamics method is utilized to calculate the dynamics performance of the aircraft at several important stages. The results show that, compared with the reference aircraft, the lift of the DHEPA is increased by 46%. Under typical sectors, the DHEPA has a higher rate of climb and maximum leveling off speed at cruise, and a significantly lower fuel consumption.
1. Introduction
Conventional aircraft convert the chemical energy of aviation fuel into mechanical energy through the engine to provide the required propulsion power, with a maximum efficiency of only 40% [1]. The electric propulsion system is a power device that uses batteries or energy storage devices as primary energy, providing the necessary thrust to the aircraft through one or more motors that drive the propellers. The conversion efficiency of electric energy can reach 70% [1]; therefore, electric propulsion technology has the advantage of improving the propulsion efficiency of the aircraft, reducing fuel consumption and pollutant emission. High propulsion efficiency (95–97%), low noise level, and zero emissions during the entire operation of the electric propulsion system realize the requirements of green environmental protection [1]. However, pure electric propulsion relies on batteries to supply energy for the aircraft, and the current level of battery technology is unable to realize the needs of large electric aircraft or small aircraft flying over long distances [2].
Influenced by the level of battery density, in the field of aviation electric propulsion, hybrid electric propulsion has been emphasized by a large number of researchers and engineers [3]. A hybrid electric propulsion aircraft (HEPA) combines a higher energy density engine, a more efficient energy storage system, and a propulsion motor. HEPAs have lower fuel consumption and higher efficiency than conventional aircraft, and a longer range and higher payload than electric aircraft [4]. Additionally, due to the use of two power sources, the applied range of HEPAs will be larger than that of conventional and electric aircraft.
The United States and some European countries have conducted in-depth research and experimental verification of HEPAs [5]. In 2011, NASA and GE collaborated to propose the future wide-body airliner N3-X, whose two engines are directly connected to superconducting generators to generate power to drive the propellers to generate thrust [6,7]. In 2014, NASA completed the AirVolt testing table to measure the efficiency of key components of the HEPA, and later collaborated with Experimental Systems Aeronautics and Aviation Company (ESAero) to conduct testing tables for HEPAs [8,9]. In 2016, based on Tecnam P2006T, NASA proposed the X-57 Maxwell all-electric aircraft project, which has 14 electrically driven propellers that provide lift and thrust to the aircraft [8]. Based on the parallel HEPA, the University of Cambridge developed the Alatus aircraft, and Amber Ridder Aeronautical University developed the Eco-Eagle aircraft [10]. In the meantime, a distributed electric propulsion aircraft (DEPA) is a kind of state-of-the-art aircraft, which is characterized by multiple propulsion devices to provide forward thrust for the aircraft. Since propulsion devices of a DEPA are electrically connected, individual propulsion devices can be placed in different parts of the aircraft through a rational layout, thus adsorbing a thicker boundary layer flow, reducing drag, and enhancing the aerodynamic performance of the aircraft [11,12]. Multiple propulsion devices add redundancy to a distributed electric propulsion system (DEPS), improving the reliability and fault tolerance of the aircraft [13].
Numerous experts and scholars have also carried out a series of studies on distributed aircraft and their aerodynamic advantages. By analyzing and modeling distributed aircraft boundary layer ingestion systems, Da et al. [14] concluded that the energy consumption of the propulsion system is reduced by about 4% when the percentage of the ingested boundary layer is about 50%. Yan et al. [15] used numerical calculations to study the effects of a propulsion system’s key design parameters on an aircraft’s aerodynamic performance. Tong et al. [16] proposed a design method for the parameters and wing geometry of a lightweight DEPA. Zhang et al. [17] conducted an experimental study on the coupling characteristics of distributed electric propulsion, and the simulation results verified the potential advantages of boundary layer inhalation technology for drag reduction. Wang et al. [18] established a fuel consumption calculation model for a distributed aircraft to improve the aerodynamic performance of the distributed aircraft, which provides a reference basis for the optimization of parameters of the distributed aircraft. Lei et al. [19] made a comparative analysis between electric propulsion and turbo-electric propulsion architectures in terms of propulsive power, propulsive efficiency, and range by constructing a model of an electric propulsion aircraft power system. Xue et al. [20] conducted the design and simulation of a hybrid electric propulsion system with a lightweight unmanned aerial vehicle prototype, and verified that the hybrid aircraft consumed less fuel during flight. However, their research aspect of distributed aircraft is relatively isolated, and there is no research analysis of the whole aircraft.
Compared with the conventional aircraft, DHEPA merges the advantages of DEPA to improve the aerodynamic performance of the aircraft, and HEPA to enhance the range performance of the aircraft to reduce fuel consumption, which is one of the most promising aerodynamic technologies. DHEPA improves the aerodynamic structure of a conventional aircraft; greatly increases the equivalent bypass ratio; and reduces fuel consumption, noise, and emissions, so it attracts the attention of major aviation research and development institutions around the world [21].
In the aviation field, both HEPAs and DEPAs have been investigated. However, distributed hybrid propulsion technology is still in its infancy, and well-known research enterprises of aviation in various countries are actively exploring this field.
Therefore, an original DHEPA design scheme is proposed in this paper, and the power allocation management for the DHEPA is presented.
The remaining sections of this paper are arranged as follows: In Section 2, a certain general-purpose aircraft is taken as a reference aircraft and the design scheme of DHEPAs is expressed in detail, including key component selection, a mass analysis, an aerodynamic performance analysis, and a power performance analysis. In Section 3, on the basis of the DHEPA power model, the DHEPA power allocation management problem is solved according to the basic theory of convex optimization, considering the optimal performance index of fuel consumption rate. A comparison between the aerodynamic and dynamic performance of the DHEPA and the reference aircraft, along with a DHEPA power allocation management simulation, is presented in Section 4. Section 5 draws the conclusions of this paper.
2. Distributed Hybrid Electric Propulsion Aircraft Design
The main feature of a DHEPA is that multiple propellers are used for propulsion, while the battery and engine are used as power sources to provide thrust. In this section, a Tecnam P2006T general-purpose aircraft is selected as a reference aircraft at first, and then the key components of a DHEPA are selected and modeled to complete the design of an original DHEPA.
2.1. Reference Aircraft
The Tecnam P2006T general-purpose aircraft, which was certified by the Federal Aviation Administration FAR Part 23, is used as a reference for the design of the DHEPA. This reference aircraft is manufactured by Tecnam (Italy) and is powered by two four-cylinder, four-stroke, Rotax 912S piston engines rated at 69 kW (73.5 kW maximum), which were certified by the Federal Aviation Administration FAR Part 33 in 2010. Its structure is shown in Figure 1, and its main flight parameters are shown in Table 1.
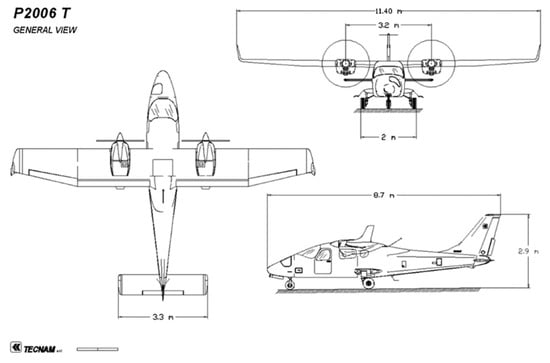
Figure 1.
Tecnam P2006T Structure Diagram [22].

Table 1.
Main flight parameters of Tecnam P2006T [22].
The flight parameters of this reference aircraft are considered for the design of the DHEPA, such as the maximum horizontal flight speed, cruise speed, maximum flight power, actual lift, fuel quantity, and other parameters.
2.2. Key Component Selection and Modeling
Propellers are firstly selected for the multi-propeller characteristics of the distributed aircraft to determine the number of propellers, area, mass, and power. Then, the engine and electric machine are chosen. Next, li-ion batteries are utilized as the energy storage module for the DHEPA. The flowchart for DHEPA component selection is shown in Figure 2.
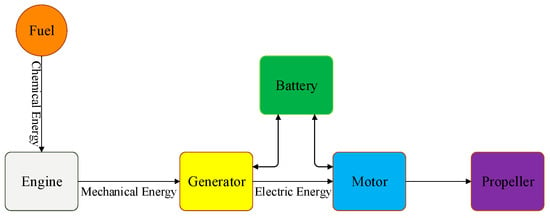
Figure 2.
Key components of the DHEPA.
2.2.1. Propeller Selection
A propeller is a device that relies on the rotation of propeller blades to generate thrust or torque, consisting of a propeller hub and propeller blades. The blades of the propeller are fixed on the hub, which is connected to the drive shaft, and the power unit drives the propeller to rotate and generate forward thrust. Under a certain power output of the power unit, the actual output thrust of the propeller depends on the matching between the propeller and the engine. At the same time, the DHEPA also ought to determine the number of power devices and propellers, so selection of the propeller mainly includes the type and number of propellers.
Propeller Type
The propeller used in the P2006T general-purpose aircraft is a two-bladed propeller, MTV-21-A-C-F/CF178-05, manufactured by the MT Corporation (DeLand, FL, USA). The weight of a single propeller is 10 kg, the diameter is 1.78 m, and the rotational speed in normal operation is 2250 rpm, with an efficiency of 85%. The propeller used in the reference aircraft cannot meet the demand of multiple propulsion for the DHEPA due to its large diameter. Therefore, the propeller used in the reference aircraft is scaled down as the propeller of the DHEPA.
Number of Propellers
The post-propeller wake region of the DHEPA should fill the entire wing as much as possible, thus, once the number of propellers has been determined, an equal scale reduction factor for DHEPA propellers will also be determined. The number of propellers is selected based on the diameter of the propeller, the mass of the propeller, and the power match between the propeller and the propulsion motor.
- Propeller area
The area of the propeller disk is an important factor affecting propeller efficiency. The ideal efficiency of a propeller is represented as [23]
where is propeller efficiency and is the thrust coefficient of the propeller.
The formula for the thrust coefficient of the propeller is given as [24]
where is the thrust force generated by the propeller, is the area of the propeller disc, is aircraft flight speed, and is the density of incoming flow.
In the case of the same dynamic pressure, the larger area of the propeller disk, the lower the coefficient of propeller pull at the same thrust, and the higher the efficiency. Therefore, in order to maximize the efficiency of the propeller and increase the thrust, it is necessary to increase propeller disc area as much as possible. According to these results, distributed propellers must cover the wings on both sides of the aircraft as much as possible, ideally with the sum of distributed propeller diameters equal to wing lengths. In view of the analysis results, there is a relationship between the distributed propeller diameter and the reference aircraft propeller diameter, as Equation (3) shows.
where is the diameter of a single propeller, is the number of propellers, is the wing length, and is the diameter of the propeller of the reference aircraft. Since propeller area is closely related to propeller efficiency, the thrust and torque that the propeller can provide and the relationship between propeller area and the number of propellers is further considered.
The DHEPA ideal total propeller area can be described as
The reference aircraft total propeller area can be described as
In order to ensure that the DHEPA is aerodynamically superior to the reference aircraft, the total area of small propellers should be larger than the total area of reference aircraft propellers.
where is the diameter of the reference aircraft propeller and is the number of propellers of the reference aircraft. According to Equations (1)–(6), the relationship between propeller area and the number of propellers can be illustrated, as shown in Figure 3.
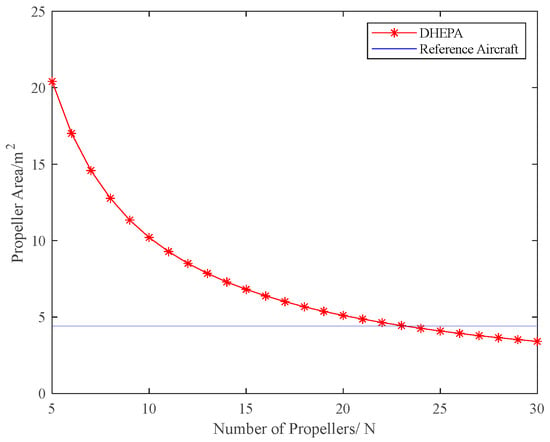
Figure 3.
Relationship between propeller area and the number of propellers.
Figure 3 shows the total area of the propeller disc in the DHEPA decreases with the increase in the number of propellers, and the number of DHEPA propellers should be selected to be less than 24. The correlation between propeller area and propeller number provides a reference for the maximum number of propellers.
- Propeller mass
The propellers selected for the DHEPA are an adaptation of the reference aircraft propeller, using an isometric reduction strategy, with the same material and the same density, so that the ratio of their mass is equal to the ratio of their volume. The relationship between the total mass of the distributed propeller and the number of propellers can be described as
where is the total weight of the small propellers and is the mass of the single propeller of the reference aircraft. From Equation (7), the dependence between propeller mass and the number of propellers can be obtained, as shown in Figure 4.
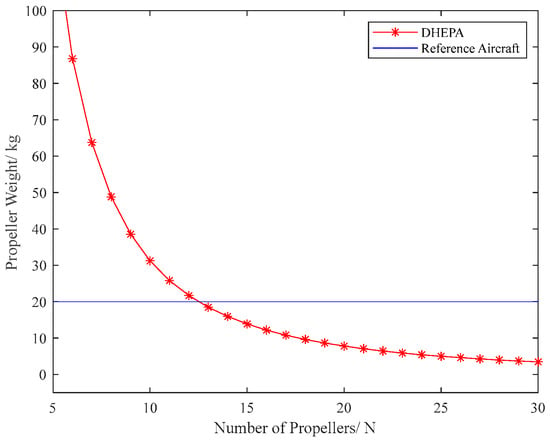
Figure 4.
Relationship between total propeller mass and the number of propellers.
From Figure 4, it can be seen that the total mass of DHEPA propellers decreases with the increase in the number of propellers, and when the number of propellers is greater than 12, the total mass of DHEPA propellers is less than those of the reference aircraft. The relationship between propeller mass and the number of propellers provides a reference for the minimum number of propellers.
- Propeller power
The power matching of the propeller is reflected in the propeller and power device. When the efficiencies of both propellers and motors are high, i.e., the propellers and power devices are well-matched, then the output power of the propellers is high. This subsection provides a guide for the selection of the number of propellers for the DHEPA based on the electric propulsion aircraft matching method. The relationship between propeller diameter and output power under operating conditions can be described as
where is the diameter coefficient [25], is the output power of the motor, and is the rotational speed of the propeller at the highest efficiency.
The reference aircraft propeller tip speed should be the same as the distributed propeller tip speed to prevent excessive propeller tip speed., i.e.,
where is the rotational speed of the propeller of the reference aircraft.
From Equations (8) and (9), the dependence between propeller power and the number of propellers in operating conditions can be derived as
Due to the characteristics of the motor [26], when a large power motor system is decomposed into several small power motor systems with the same total power, the power density and efficiency of the system remain basically unchanged. Therefore, the power of a real single motor can be written as
where is the total motor power.
According to the propulsion requirements of the reference aircraft, as shown in Table 1, taking , the propeller power in full operating conditions and the relationship between the motor power and the number of propellers are shown in Figure 5.
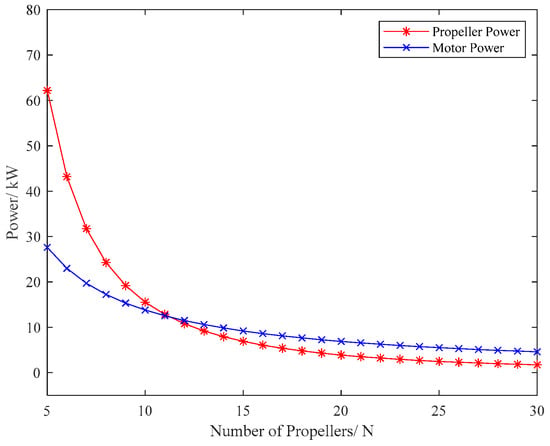
Figure 5.
Relationship between power and the number of propellers under operating conditions.
As shown in Figure 5, with the increase in the number of propellers, propeller matching power decreases continuously under propeller operating conditions. To make a good match between propellers and motors, a similar point of power between the two should be selected, i.e., the number of propellers for the DHEPA should be between 10 and 16.
Comprehensively considered propeller diameter and propeller disk area, propeller mass and propeller matching power, and critical parameters in the DHEPA are selected, as Table 2 shows.

Table 2.
Propeller parameters in the DHEPA.
2.2.2. Engine Selection
For light utility aircraft, the most widely used power plant is the piston engine. The DHEPA provides thrust for the aircraft through the engine and the battery, so it is essential to determine the engine. To keep the power, structural shape, and weight of aircraft as unchanged as possible, the DHEPA is powered by the same type of four-cylinder, four-stroke piston engine as the reference aircraft, which is the Rotax 912S.
Based on the Rotax 912S piston engine data sheet from Rotax, its basic performance parameters, characteristic parameters, and geometric structure are shown in Table 3, Figure 6 and Figure 7.

Table 3.
Basic parameters of Rotax 912S [27].
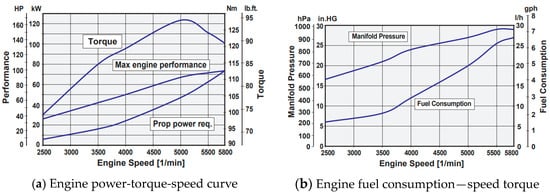
Figure 6.
Rotax 912S Parameter Chart [27].
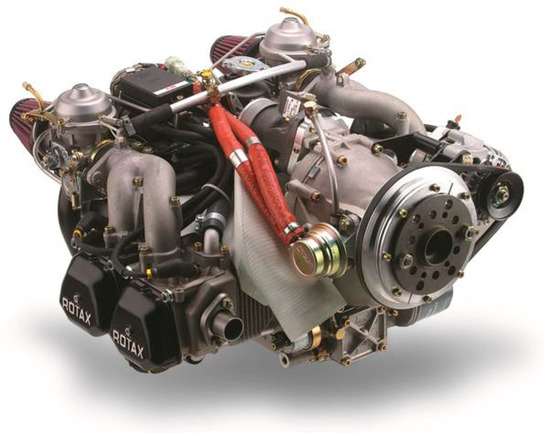
Figure 7.
Rotax 912S physical image [27].
2.2.3. Electric Machine Selection
In the DHEPA, electric machines are categorized as electric motors and generators. The sole source of propulsion for the DHEPA is the electric motor drive system, while the generator is connected to the prime mover to provide range support and security for the aircraft. Therefore, electric motors play a vital role in the design process of the DHEPA. Commonly used electric motors and their performance are shown in Table 4.

Table 4.
Basic performance of commonly used motors [28].
By comparing the performance of the above motors, it can be seen that switched reluctance motors and permanent magnet synchronous motors (PMSMs) have the advantages of smooth operation, high torque, high power density, and high reliability. However, the switched reluctance motor has large torque pulsation and noise, and a complex control system, while the PMSM is easier to control and is suitable for use as an electric propulsion motor for a high-power density vehicle, so the DHEPA uses a PMSM for both generators and motors.
In the case of a DHEPA in windmill state, the propeller drives the motor to charge the battery, and the motor should be used to generate electricity. A generator directly connected to the piston engine does not need to consider the function of reversing, which should work with the power and speed corresponding to the optimal power speed of the engine.
A generator directly connected to the engine does not need to consider the function of reversing, and its power and speed should correspond to the optimal power speed of the engine.
Motor Selection
The operating conditions of the motor at different powers will directly affect the flight performance. If the power of the selected motor is too high, then too much residual power during actual operation will lead to the overall overweight of the aircraft, as well as affecting the battery selection. On the contrary, if the power of the selected motor is too small, it will not be able to meet the power demand of the aircraft in some phases, such as takeoff ground roll, climbing, and other operating conditions. Normally, the aircraft consumes maximum power during takeoff ground roll, so the maximum power is considered to be the same as the peak power of the motor.
Remark 1.
The maximum power of a well-matched single motor and propeller is 10 kW. The power requirement of a single motor for normal operations of an aircraft at long endurance times is about 7 kW. After a comprehensive analysis of various types of PMSM, we choose the Joby Motor-JM1S from Joby Aviation Company. This kind of PMSM is a surface-mounted permanent magnet motor with a mass of 1.8 kg, a rated power of 8.2 kW, a maximum operating power of 12.6 kW, a rated torque of 13 Nm, a suitable voltage range of 40–450 V, and a rated power density of 4.56 kW/kg [29]. The PMSM has a high continuous torque density and high efficiency; for example, it has a high efficiency of 96% when operating in the range of 1000–3000 r/min.
Generator Selection
The Rotax 912S has its own external generator, but a low generating power of 400 W. Therefore, it is necessary to choose a suitable generator to provide the required electrical energy for the DHEPA. The maximum power of the generator should be as close as possible to the maximum power the engine can provide, so that the power generation requirement of the DHEPA can be met, and the generator can work in a higher efficiency range. After several comparisons, it was decided the JF60-B alternator would be selected, which is a typical three-stage brushless alternator with a rated power of 60 kW, rated voltage of 400 V, rated current of 174 A, and efficiency of 88%, which is able to satisfy the power output of the engine for the DHEPA.
Ultimately, the Joby Motor-JM1S and JF60-B were selected for the DHEPA. Their parameters are shown in Table 5.

Table 5.
PMSM and generator parameters in the DHEPA.
2.2.4. Battery Selection
The primary parameters of energy storage batteries include the State of Charge (SOC), battery energy density, the number of cycles, and energy efficiency. Common batteries are Pb-acid batteries, Li-ion batteries, Li-ion batteries, and Ni-MH batteries, etc. Table 6 shows the primary performance parameters of common batteries.

Table 6.
Performance Parameters of Commonly Used Batteries [30].
From Table 6, it can be seen that Li-ion batteries have advantages over other batteries in terms of energy density and energy efficiency. Additionally, Li-ion batteries have more cycles and a long life, which can be well adapted to the needs of the DHEPA, so Li-ion batteries are selected as the energy storage component for the DHEPA in this paper.
Based on the power demand of the flight envelope, the minimum required power of the battery is calculated as
Based on the energy density of the Li-ion batteries, it was determined that the total power provided by two groups of batteries is 30 kW, and the mass of the single group of batteries is 65 kg. Li-ion battery resistance changes with temperature and SOC. When the battery’s SOC is between 20% and 80% and the temperature remains constant, the battery resistance remains constant. Therefore, it can be assumed that the internal resistance of the battery is a constant value during the operation of the DHEPA as .The parameters of the battery are shown in Table 7.

Table 7.
Battery parameters in DHEPA.
3. DHEPA Power Allocation Management
After completing key component selection and modeling of the DHEPA, the power allocation management of the DHEPA is started. This section focuses on the quantitative relationship between the input and output power of each component of the hybrid electric propulsion system, and builds the power model of each component based on this. After the modeling of the main components is completed, a convex optimization method is used to simulate and analyze the power distribution of the hybrid electric propulsion system from takeoff, climb, cruise, to landing, with the goal of minimizing fuel consumption.
3.1. DHEPA Power Model
3.1.1. DHEPA Power Allocation Framework
A HEPA is a kind of propulsion system that consists of an engine, a battery, and an electric motor working together. The propulsive power required for aircraft flight is provided by the electric motor and engine. According to whether the engine provides propulsion power directly or not, it can be divided into series architecture and parallel architecture. A DHEPA is a HEPA that integrates distributed propulsion.
In order to simplify the process of analyzing and calculating aircraft fuel minima during the operation of the DHEPA, it is assumed that all the power generated by engine and the battery is used for the propulsion device, and the fuel consumption caused by the power consumption of other power-using devices of the general-purpose aircraft is not taken into account.
The DHEPA uses 14 electric motors to provide thrust; a series power framework is more in line with the structural requirements of the DHEPA.
In series architecture, when the aircraft is performing flight tasks, the engine does not directly connect to the propeller, but transfers the power to the generator, which in turn transfers power to the aircraft power grid, and the power demanded by the propeller is completely provided by the motors. When the aircraft is in a windmill state, the propeller drives the motors to reverse, the motors power the aircraft grid, and the battery draws power from the aircraft grid at this time. The series hybrid electric propulsion power framework is shown in Figure 8.
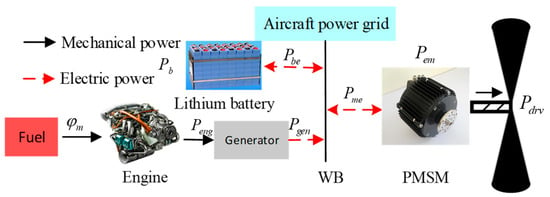
Figure 8.
Series hybrid electric propulsion power framework.
Where is fuel flow, is the power produced by the piston engine, is the power produced by the generator, is the chemical power provided by the battery, is the effective electrical power transferred from the battery to the grid, is the electrical power input from the grid into the electric motor, is the mechanical power output from the electric motor, and is the propulsive power required to carry out the normal mission of the DHEPA.
Characterized by the power allocation of the series DHEPA, the motor electric power is supplied by the generator and the battery through the DC bus, and can be obtained as
3.1.2. Aircraft Dynamics Power Model
Aircraft dynamics modeling is first performed to establish the correlation of fuel consumption with propulsion power. Typical operating conditions of the aircraft include takeoff, climb, cruise, descent, landing, etc. To simulate the dynamics of the aircraft, the aircraft is simplified into a particle, and all the forces of the aircraft are concentrated on the point mass. The forces of the aircraft in its typical operating conditions are shown in Figure 9.
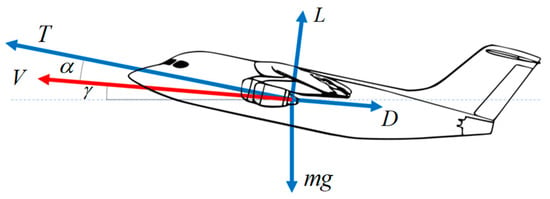
Figure 9.
Forces on the aircraft in typical operating conditions. Where is the thrust, is the lift, is the drag, is the speed of the aircraft, is the total mass of the aircraft, is the angle of attack of the aircraft, and is flight path angle.
According to Figure 9 and the momentum theorem, Equation (13) can be derived as follows
where the values of and are related to the angle of attack of the aircraft.
From Equation (13), the required propulsive power of the aircraft can be expressed as
3.1.3. Engine Power Model
The rate of change in the mass of the aircraft is the rate of fuel consumption, which can be converted into the power that can be supplied by the engine and can, therefore, be derived as
where is the piston engine output shaft speed and is a function of fuel consumption, power, and speed.
This quantitative relationship can be obtained by fitting the data from the fuel characteristic plot, presented as a segmented quadratic function [31].
where and are coefficient functions related to the output speed of the engine and are greater than zero. Furthermore, engine output speed and output power are required to meet the safety limit requirements, i.e.,
where is minimum , is maximum , is minimum , and is maximum .
3.1.4. Motor Power Model
The power model of the motor mainly considers the interaction of motor input power with output shaft power. In accordance with the motor characteristic curve, the motor model in the form of a segmented linear quadratic function can be derived as
where is the motor speed and and are coefficient functions related to the motor output speed, all of which are greater than zero. Meanwhile, the motor output speed and output power are required to meet the safety limit requirements, i.e.,
where is minimum , is maximum , is minimum , and is maximum .
The power model of the generator considers the relationship between the generator input shaft power and the input electrical power, and the generator power model can be expressed as
where is generator speed, and are functions of coefficients related to generator output speed, and, since the piston engine is co-axially connected to the generator in the series architecture, there is .
3.1.5. Energy Storage Battery Power Model
The fundamental physical model of the battery can be equated to a circuit as shown in Figure 10. In this circuit, the battery consists of an ideal open-circuit voltage source in series with an internal resistance.
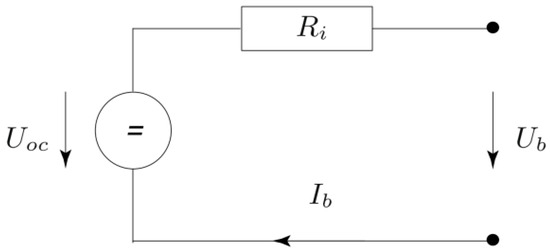
Figure 10.
Battery equivalent circuit.
By Kirchhoff Voltage Laws, the equation can be derived as
where is the internal resistance of the battery, is the current flowing through the battery, and is constant open circuit voltage.
The formula for calculating the current during constant current charging and discharging of the battery can be expressed as [32].
where is effective electric power that can be delivered by the battery.
Therefore, the function of battery chemical power and effective electric power available through the battery power is [33].
Due to Equations (21)–(23), the maximum chemical power of the cell can be calculated as
The SOC is related to the battery charge as
To ensure the life and safety of the battery, there are minimum and maximum SOC, which are determined by battery’s own characteristics and operating conditions
where is minimum SOC, and is maximum SOC.
3.1.6. Power Model Discretization
For subsequent simulation calculations, it is necessary to obtain the aircraft dynamics power model, engine power model, electric motor power model, and battery power model at a discrete time.
From Equations (13) and (14), the power model of aircraft dynamics in discrete time is described as
where , is the total number of sampling steps during flight time, is thrust, and is a fixed sampling time. If the total flight time is , then exists.
Fuel mass consumption and engine power model under discrete time conditions can be rewritten as,
where is obtained by interpolating and fitting the data from the engine performance parameter map.
The motor power model under discrete time conditions can be expressed as
The generator power model under discrete time conditions can be represented as
The equation defining the relationship between the chemical power of the storage battery and the effective electric power that can be output to the grid under discrete time conditions is
where ; therefore, the maximum value of the chemical power of the cell can be obtained as .
3.2. DHEPA Power Allocation Based on Convex Optimization
3.2.1. Basic Theory of Convex Optimization
Convex optimization, as one of the mathematical tools in the field of optimal control, is an optimization algorithm based on convex sets and convex functions, which has been widely applied in recent years in the field of engine design, such as automotive energy management, communication and signal processing, finance and statistics, etc. [34]. The convex optimization problem is a study of the maximum and minimum values of convex functions under specific constraints. When a certain problem is to satisfy the conditions of a convex optimization or can be transformed into a convex optimization problem, this problem can be solved by a specific framework structure of convex optimization. The convex optimization method can avoid local optimality and achieve global optimization in system control. Therefore, many engine optimization problems, which are too complex and non-convex, are transformed into convex optimization problems and given an approximate solution to the problem.
For general optimization problems, the standard form is described as follows
For convex optimization problems, the standard form is expressed as follows
From the standard form of convex optimization, it can be summarized that a standard convex optimization problem consists of three main parts:
- Objective function: the objective function is a kind of performance index for finding the minimum, and it must be a convex function on a convex set.
- Inequality constraints: it must be a convex function on a convex set.
- Equation constraints for affine.
Therefore, the convex optimization model for the DHEPA should also have the above three conditions.
3.2.2. DHEPA Power Model Convex Optimization Processing
As mentioned in Section 3.2.1, three conditions should be satisfied to solve the problem through the convex optimization algorithm, whereas the power models in Section 3.2 do not contain inequality, and some of the optimization variables and functional relations are not convex functions. To ensure that the problem of minimizing the fuel consumption rate of the DHEPA is solved through the convex optimization method, it is necessary to make approximations to these non-convex functions to satisfy the conditions of convex optimization.
Convex Optimization Inequality Acquisition
In a series power architecture, the quantitative link between fuel consumption and power consumption is required to be constructed. The most critical are the relationships between fuel consumption, battery power consumption, and propulsion power. According to the direction of power allocation in a series, the following relation can be derived as
where Equation (36) is also convex since , , , and are all convex functions.
The ultimate goal of DHEPA control is to enable the aircraft to achieve minimum fuel consumption while meeting the propulsion power requirement for typical operating conditions. In the absence of an optimum, actual fuel consumption is always greater than the fuel consumption obtained by back-calculating propulsion power and battery power. Therefore, the following exists
Aiming to ensure that the components are always in a safe while the DHEPA is performing a mission, it is also necessary to determine the upper and lower limits of the power model for each component. In an attempt to minimize the variables as much as possible, the upper and lower power limit protection of the engine and motors are transformed. The upper and lower power limits of the engine can be transformed into limits on fuel, while the upper and lower power limits of the motors need to take into account both the power limit of battery itself and the power demand of motors, so there are
where and . In a convex optimization problem, should be an increasing function, so a lower bound on the fuel quantity is obtained for a simple increasing function determination.
The upper and lower bounds of the cell can be expressed, respectively, as
Equations (40) and (41) show that the calculation method of the upper and lower limits of battery power can be transformed into a limit value relationship among the battery, motor, and fuel.
Convex Optimization Power Model for Aircraft Dynamics
To transform a non-convex power model formulation of aircraft dynamics into a convex optimization model, lift and drag coefficients therein need to be simplified to obtain a convex functional about propulsive power and mass. For a given Reynolds and Mach number, lift and drag coefficients can be viewed as a quadratic polynomial and a primary polynomial in the angle of attack, respectively, as shown in Equation (42) [35].
where .
Substituting Equation (42) into Equation (14), and taking into account that the range of values of the angle of attack for general-purpose aircraft is usually less than 2°, is neglected. The relationship in the form of a quadratic function between the mass of the aircraft and propulsion power can be obtained as
where the coefficients in front of the quadratic polynomial are described, respectively, as
The three coefficients in Equation (44) vary with speed and trajectory angle, and once the values of speed and trajectory angle are determined, the three coefficients are also determined. As can be seen from Equation (44), is always greater than zero, so propulsion power is a convex function of mass.
Motor Convex Optimization Power Model Parameter Calculation
For obtaining the convex optimization model of a motor, the parameters of the motor power model need to be calculated. Meanwhile, in order to simplify the calculation, the connection between the electric power of the motor and the power of the output shaft can be approximated as linear in a typical operating range. Therefore, the required convex optimized power model of the motor is transformed into
where .
To obtain the specific values of and varying with motor speed, given the data of motor operating points (motor speed, motor input, and output power), the least-squares method is firstly applied to fit different input electric power values and corresponding output shaft power values of each motor speed point. After obtaining and at multiple motor speeds, a linear power model of the motor is obtained by spline interpolation. The correlation between electrical power and output shaft power at a motor speed of 1800 rpm is shown in Figure 11.
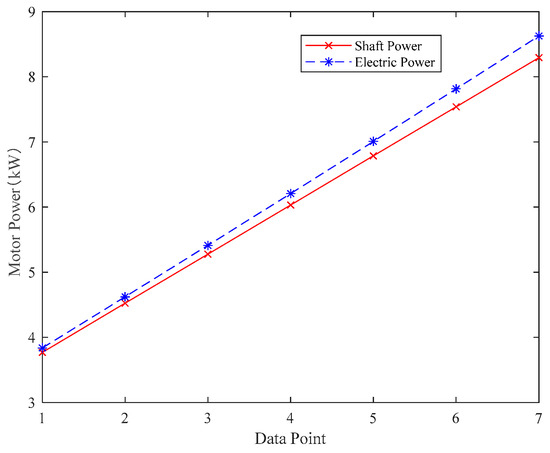
Figure 11.
Relationship between electrical power and output shaft power.
Figure 11 gives the dependence of input power and output power of the motor, while indirectly reflecting efficiency values of the motor at different speeds and different powers. It can be seen that, as the given electric power becomes larger and larger, the output shaft power of the motor increases, but the increase is smaller than the increase in electric power, i.e., the efficiency of the motor is decreasing. Interpolating electric power and shaft power for several given speed conditions, a convex optimized power model of the motor can be obtained, i.e., the variation of electric and shaft power with respect to motor speed.
Generator Convex Optimized Power Model
In accordance with the characteristics and efficiency of the generator selected in Section 2, the generator power model is simplified to the form of a primary linear function, i.e.,
3.2.3. DHEPA Power Model Convex Optimization Problem Solving
The goal of the DHEPA convex optimization task is to carry out a reasonable allocation of power output between the engine and the battery, which makes the aircraft consume the least amount of fuel on the basis of meeting the normal safety range of operation of each component. The performance index is shown in Equation (47)
Based on the power allocation in series-connected architecture and the constructed convex optimization model of each component, a standard convex optimization problem expression can be derived as
where the upper and lower limits for fuel are, respectively, as follows
The upper and lower limits of the battery are, respectively, as follows
4. Comparative Analysis between the DHEPA and the Reference Aircraft
The mass of the reference aircraft changes when it is modified to the DHEPA, and this change in mass is analyzed comparatively. To verify the effect of the propeller on wing aerodynamic force in the DHEPA, the momentum theory and numerical simulation method are employed to calculate and analyze. The dynamic performance is calculated for several important stages, such as takeoff ground roll, climbing, and cruise, to complete a comparative analysis between the DHEPA and the reference aircraft in terms of mass, aerodynamic performance, and dynamic performance. Finally, the performance of DHEPA is verified by power allocation management simulation.
4.1. DHEPA and Reference Aircraft Mass Analysis
In the whole flight profile of the aircraft, the reference aircraft has a maximum power of 134 kW, the mass of two Rotax engines with gearboxes is ; the mass of two large propellers is ; fuel capacity is 200 L; fuel mass is ; and the mass of two generators is .
The DHEPA has an increased mass of aircraft due to the addition of electric motors, batteries, and electronic control systems. The DHEPA consists of two identical architectures, each consisting of a Rotax engine driving a JF60-B generator, which is connected to the aircraft grid. The DHEPA has a maximum power of 134 kW, two Rotax engines without reduction gearboxes with a mass of , fourteen propellers with a mass of , a fuel capacity of 200 L, a fuel mass of , two JF60-B generators with a mass of , two li-ion batteries with a mass of , and fourteen Joby Motor-JM1S propulsion motors with a mass of . In addition to the above equipment, the retrofit design needs to take into account a variety of electronic controllers, etc., in order to simplify the calculation, here assuming that the controller’s power-to-weight ratio is and the total mass of electronic controllers is about .
Based on the analysis of the reference aircraft and the DHEPA, it is possible to summarize the mass variation of the reference and the DHEPA at takeoff.
The mass of the propulsion system of the reference aircraft is given by
The mass of the propulsion system of the DHEPA is given by
It can be seen that, after transforming the reference aircraft into the DHEPA, if the fuselage and power system of the aircraft are not changed and only the hybrid electric propulsion part is added on the original basis, the mass will be greatly increased. This increase in weight is particularly reflected in the batteries, where specific power is lower at this stage, and the development of hybrid electric propulsion is limited by battery technology. Taking the DHEPA as an example, after adding the hybrid electric propulsion system on the basis of the reference aircraft, the mass of the propulsion system increased by 193.5 kg.
The increase in mass means a decrease in mass available for load and a decrease in efficiency. However, by converting the reference aircraft into the DHEPA, distributed architecture will bring a series of aerodynamic and dynamic performance improvements to the aircraft, which will compensate for the efficiency loss of the DHEPA to a certain extent. Therefore, Section 4.2 and Section 4.3 will investigate the aerodynamic performance and lift improvements of the aircraft from a distributed propulsion perspective.
4.2. Aerodynamic Performance Analysis of the DHEPA and the Reference Aircraft
4.2.1. Theoretical Analysis of the Momentum Theorem
DHEPAs have a greater number of propellers arranged at the leading edge of the wing compared to reference aircraft, and the whole wing is in the slipstream area behind propellers. In this subsection, it is theoretically proved that propeller slipstream has an aerodynamic performance-enhancing effect on the rear wing through the momentum theorem method. Meanwhile, the extent of lift enhancement of the aircraft by using a multiple propeller propulsion configuration is analyzed for the selected reference aircraft and distributed aircraft.
The momentum theory is based on the momentum and energy changes in flow through the paddle disk; the propeller is viewed as a paddle disk with an infinite number of advancing paddle blades and the flow is able to pass through the paddle disk continuously. The flow is assumed to be an ideal incompressible flow, and the airflow through the paddle disk has no rotation. When the flow approaches propeller, the flow velocity increases, the pressure decreases, the potential energy is gradually converted into kinetic energy. After the propeller, due to the propeller’s work on the flow, at this time it can be seen that the flow velocity remains unchanged, the pressure of the flow increases , the paddle wake flows into the slipstream area, axial velocity increases further, and the pressure is slowly reduced to the state before propeller disturbance. The change in velocity of air flow through the propeller is shown in Figure 12 [36].

Figure 12.
Schematic diagram of speed changes before and after the propeller.
Assuming that the flow is an incompressible ideal flow, is the incoming flow density, is area of propeller disk, is axial velocity not disturbed by propeller, is velocity of the airflow through the disk, is velocity of the airflow after entering slipstream area, is pressure not disturbed by propeller, is pressure in front of the paddle disk, and and are the acceleration velocity increments due to acceleration. Based on the above analysis process, the Bernoulli equation (energy equation) before and after the propeller disk can be written.
The Bernoulli equation before the propeller disk is
The Bernoulli equation after the propeller disk slipstream region is
Equations (49) and (50) are differentiated to find the pressure difference between the front and rear of the propeller disk, as well as the thrust force on the paddle disk under ideal conditions
According to the momentum theorem, the force of the propeller on airflow (the reaction force of thrust on the propeller disk) is equal to the increment in momentum per unit time through the propeller disk, i.e.,
After simplifying and re-arranging, it can be obtained as
The flow velocity increment at the propeller disk is half the flow velocity increment in the slipstream zone. If the propeller is placed in front of the wing so that the wing is immersed as much as possible in the slipstream region, it can effectively increase flow velocity over the wing surface.
The useful work done by propeller thrust can be expressed as
The work done by the paddle disk on the airflow can be expressed as the increment in kinetic energy before and after the airflow passes through the propeller disk
The ideal efficiency of a propeller is expressed as the ratio of useful work done by the thrust of the propeller to work done by the paddle disk on the airflow. The ideal efficiency of a propeller can be represented as
where and .
The lift equation for the wing section without a propeller can be expressed as [37]
where is the lift coefficient corresponding to the wing and is the area of the wing.
The equation for the wing lift subject to the slipstream effect can be described as
It can be seen that having a propeller in front of the wing can add times lift to the wing compared to having no propeller.
Assuming that the wing shape and lift coefficients of the reference aircraft and the DHEPA are kept constant, and they fly at the same speed and angle of attack in the air, the lift of the reference aircraft and the DHEPA can be expressed as Equations (60) and (61), respectively
where is the area of the wing on one side of the aircraft, is the area of the slipstream area generated on the wing after a single reference aircraft propeller, and is the area of the slipstream area generated on the wing after a single DHEPA propeller.
The area of the slipstream area behind the propeller is closely related to the area of the wing and the diameter of the propeller; when there is no incoming flow or the incoming flow speed is low, slipstream diameter behind the paddle disk is contracted to be from 0.816 times to 0.92 times the diameter of the propeller, and when the incoming flow speed is high, slipstream diameter is approximately equal to the diameter of the propeller. The cruising speed of this model is lower than 250 km/h, and the flow velocity is low. Hence, the following exists
The ratio of lift between the reference aircraft and the DHEPA under the same flight conditions can be stated as
Under the same incoming flow conditions, by increasing the area of the wing behind the paddle that is immersed in the slipstream area, the DHEPA can ideally increase lift by almost 46% compared to the reference aircraft. As a result, the aerodynamic performance of the aircraft is improved after the adoption of the distributed propulsion model, compared to the conventional reference aircraft.
The DHEPA has more batteries, generators, and electric motors than the reference aircraft, resulting in a 16% increase in aircraft mass. However, the DHEPA is able to improve the aerodynamic performance of the aircraft and increase lift, compensating for the loss of efficiency due to the increased mass. Keeping the payload and fuel weight of the DHEPA consistent with the reference aircraft, a comparison of the mass and performance of two aircraft is shown in Table 8.

Table 8.
Comparison of the DHEPA with the reference aircraft.
As shown in Table 8, the empty weight of the DHEPA has increased by 23.6% compared to the reference aircraft due to the increase in various electrical equipment. The maximum takeoff weight of the DHEPA has increased by 15.7%.
4.2.2. Numerical Computational Analysis
The theoretical analysis of the propeller using the momentum theory shows the improvement in aerodynamic performance of the aircraft by the distributed architecture, but it does not reveal the distribution of propeller blade turbulence or turbulence suffered by the wing behind the propeller. Therefore, this subsection utilizes computational fluid dynamics numerical simulation to analyze the effect of propeller slipstream on the aerodynamic force of the wing. There are two main methods to study the propeller and its slipstream effect through numerical simulation [38,39]:
- Sliding mesh method: The sliding mesh method is to divide the propeller and other parts into regional meshes. The propeller is a rotating part, and the whole domain containing the rotational path of the propeller can be set as a rotating domain. The external flow field other than the rotating domain is set as a stationary domain, and an interface needs to be set between the two domains, which plays the role of exchanging fluid data between the two domains during the numerical calculation.
- Momentum source method: The momentum source method is to approximate the propeller disk as a disk without thickness, that airflow parameters before and after propeller remain the same, and that the disk has the same effect on the airflow as the propeller disk on the airflow. To simulate the rotation and slipstream effect of the actual propeller, the disk surface is set as an internal domain, and suitable boundary conditions need to be set on the boundary surface of the paddle disk to simulate the tangential velocity to the airflow generated by the propeller in the calculation.
To study the disturbance conditions of wing flow field when the propeller rotates, the numerical simulation in this paper adopts the sliding mesh method to compare the wing flow field without a propeller, with a single propeller and the DHEPA with seven propellers, and to obtain the fluid pressure distribution of the wing and the streamline distribution of fluid flow through the propellers and wing for the above three cases.
The sliding mesh method can usually be categorized into structured mesh, unstructured mesh, and hybrid mesh. Structured meshes are characterized by a simple structure, easy storage, and good mesh quality, but if the model structure is too complex, the mesh generation step will be particularly cumbersome. Unstructured mesh is easier to deal with for complex models, but computational efficiency is low. Considering that the computational models in this subsection are multiple propellers and wings, which are relatively complex, unstructured mesh was chosen for the analysis.
Unstructured meshes usually fill the basin by tetrahedral meshes, which are basic cells in the whole flow field. Since unstructured mesh does not limit mesh nodes, parameters such as mesh cell size and the spatial location of the mesh can be easily controlled, so it has a strong adaptability to the complex structural model. Therefore, the numerical simulation in this subsection adopts unstructured mesh to divide the propeller and the wing. The parameters of the propeller model of the reference aircraft were obtained from the propeller datasheet on the official website of MT, and the propeller of the DHEPA is a scaled-down model of the reference aircraft propeller. The wing model of both aircraft adopts the same P2006T wing and, due to the complexity of the reference wing model, the wing is simplified. The propeller, wing models, and their unstructured meshing images are shown in Figure 13 and Figure 14.
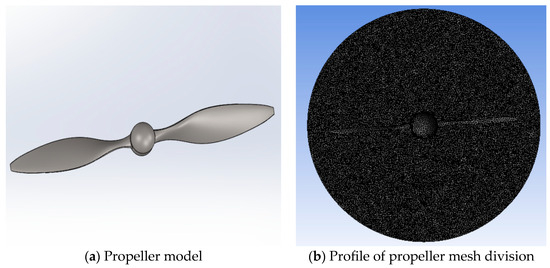
Figure 13.
Propeller model and its mesh division profile.

Figure 14.
Wing model and its meshing profile.
The number of meshes of a single propeller model and the number of meshes of the wing are both about 1 million. After modeling the propeller and the wing, respectively, and meshing, a combined model of the propeller and the wing is built based on the propeller layout of the reference aircraft and the DHEPA. The model and non-structural meshing profiles of the two models are shown in Figure 15 and Figure 16, respectively.

Figure 15.
Reference aircraft.

Figure 16.
DHEPA.
As can be seen from Figure 16, the meshing method adopted in this subsection firstly divides stationary and rotational domains (the wing is regarded as the stationary domain and the propeller as the rotational domain). To minimize the amount of mesh and subsequent simulation calculations, and to improve the calculation accuracy, a small area is divided for each propeller and wing for increasing local mesh density. The fluxes between rotating and stationary domains are transferred through the mesh intersection surface, and the entire rotating area of the propeller and the stationary part of the wing are in a large stationary domain. Due to the limitation of simulation calculation conditions, the mesh division of two aircraft is fine-tuned separately, and the finalized mesh number is about 5 million for the reference aircraft and 8 million for the DHEPA.
The generalized solution of the calculation can be obtained by integrating control equations at each unit node, after which it is necessary to set boundary conditions for the solution region. The computational boundary conditions are set as follows:
- In the model, the angle of attack of the wing is 2°, and the incoming velocity is set to the cruising speed of aircraft: 75 m/s. The propeller rotation domain adopts the Frame motion method, and the propeller blade is set to the cruise speed of aircraft.
- The propeller rotation domain adopts the Frame motion method and the area where the propeller blade is located rotates relative to the external airflow.
- The wall surface of the propeller blade is an adiabatic non-slip wall surface, which rotates in the same direction with the same speed following the rotating domain.
- The inlet pressure is set as a standard pressure at 4 km altitude: 61,625 Pa; the outlet boundary condition is set as the pressure outlet boundary; and the pressure value is consistent with inlet pressure.
- For the multi-propeller structure of the DHEPA, the propeller rotation direction needs to be selected, and the rotation direction of the multi-propeller structure can be divided into four modes as shown in Figure 17.
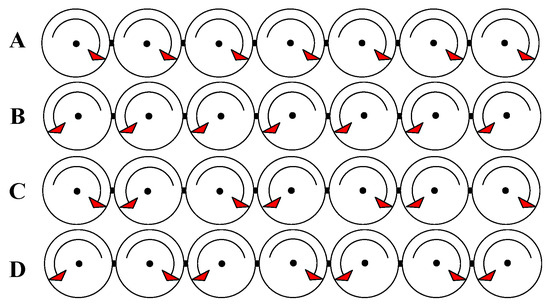 Figure 17. DHEPA multi-propeller structure rotation modes. (A) all propellers rotate clockwise; (B) all propellers rotate counterclockwise; (C) propellers are distributed clockwise–counterclockwise alternately; and (D) propellers are distributed counterclockwise–counterclockwise alternately. In the rotation domain setting, boundary conditions are set for these four rotation modes, respectively.
After the simulation setup is completed, simulation calculations are carried out for the propeller-less wing model, the reference propeller wing model, and the distributed wing propeller model, respectively. Figure 18, Figure 19, and Figure 20 show the upper and lower surface pressure contour and velocity streamline diagrams of propeller-less wing cases, respectively. It can be seen that the pressure on the upper surface of the wing is smaller than that on the lower surface, and, on both sides of the wing, a vortex of airflow from the bottom to the top occurs due to the induced drag.
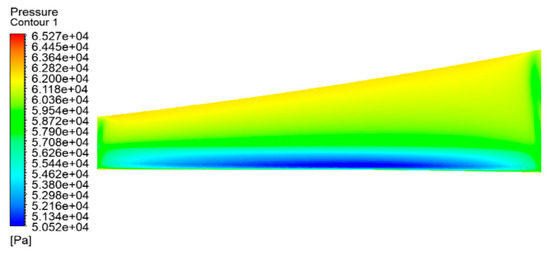
Figure 18.
Pressure contour on the upper surface of the wing without propeller action.
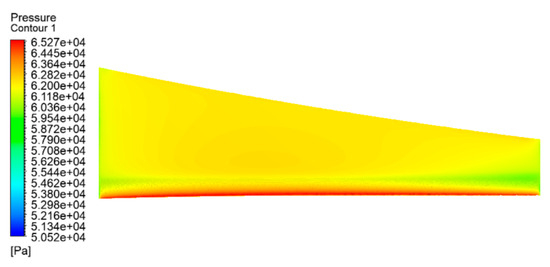
Figure 19.
Pressure contour on the lower surface of the wing without propeller action.
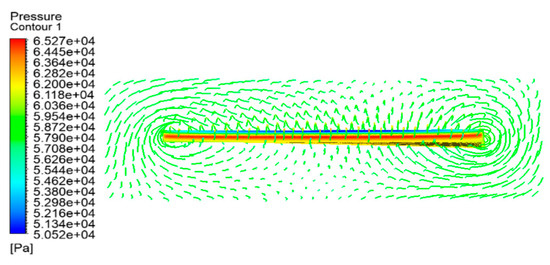
Figure 20.
Velocity streamlines of the wing without propeller action.
The reference aircraft has only one large propeller rotating in front of each wing. Since the rotational direction of the propeller of the reference aircraft is not mentioned, simulation calculations and comparisons are made in this subsection for both clockwise and counterclockwise rotational modes. The pressure contour diagrams of upper and lower surfaces of the reference aircraft wing and velocity vector distributions and streamline diagrams are shown in Figure 21, Figure 22, Figure 23 and Figure 24.

Figure 21.
Pressure contour of the wing with the propeller rotating clockwise.

Figure 22.
Clockwise rotational velocity vector distribution and streamline diagram.

Figure 23.
Pressure contour of the wing with the propeller rotating counterclockwise.

Figure 24.
Counterclockwise rotational velocity vector distribution and streamline diagram.
Compared with the pressure contour of the wing without a propeller, due to the slipstream effect of the propeller, the airflow velocity through the wing increases, and the pressure difference between the upper and lower wing surfaces increases. However, due to how the number of propellers is only one, there are fewer portions of the wing that generate the slipstream area and produce a larger pressure difference. From the comparison of the simulation images of the clockwise and counterclockwise rotation of the reference aircraft propeller, it is clear that the counterclockwise rotation of the propeller can make the pressure difference between the top and the bottom of the wing larger, and the propeller slipstream effect spreads farther, therefore generating more lift for the aircraft. The main reason for the difference between the clockwise and counterclockwise rotation of the reference aircraft is the asymmetry of the wing chord, with smaller chords at the wing tips and larger chords at the wing roots. Where the chord is smaller, the airflow is less impeded by the wing, and the airflow is accelerated by the counterclockwise rotation of the propeller for a longer period of time.
There are fourteen propellers on both sides of the DHEPA, which rotate simultaneously to provide the required thrust for the aircraft during a mission. Figure 25 shows the velocity streamline distribution of the DHEPA with seven propellers rotating simultaneously on one side of the aircraft.
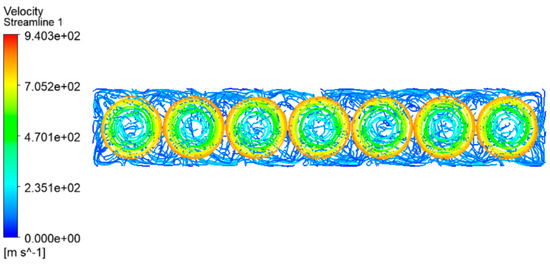
Figure 25.
DHEPA rotating propeller velocity streamline.
From the fluid velocity vector diagram of the rotating propeller of the DHEPA, the velocity of the propeller is lower in the center part, and the closer to the tip position, the faster the fluid flow rate is. From Figure 17, DHEPA multi-propeller propulsion can be roughly categorized into four rotational modes, and this subsection carries out simulation calculations for these four rotational modes, respectively.
Figure 26, Figure 27, Figure 28, Figure 29, Figure 30, Figure 31, Figure 32 and Figure 33 show the four rotational modes A, B, C, and D, respectively, of the wing’s upper and lower surface pressure contour, wing velocity vector distribution, and velocity streamline. Among these four modes, mode A and B are different to C and D in both wing surface pressure contour and wing surface velocity vector distribution and velocity streamline diagrams. Mode A and B rotate the propeller uniformly clockwise or counterclockwise, so that the airflow is also tilted to the left or right, which prolongs the time of the slipstreaming effect to a certain degree compared with the reference aircraft. Mode C and D are able to provide a longer time for the aircraft wing to rotate, which is the same as the reference aircraft. The two modes are able to provide a larger pressure difference between the top and the bottom of the aircraft wing, which has a greater contribution to increasing aircraft lift. From the velocity vector diagram, mode C makes the slipstream area run through the whole area, which can effectively improve the length of the slipstream effect; mode D makes the airflow between the two propellers collide with each other, which increases the breadth of the slipstream area, but cannot be realized through the whole wing area. It can be seen that when the DHEPA is performing flight tasks, it is better to alternate the rotational direction of multiple propellers, to maximize the use of the slipstream effect of the propellers to increase the lift of the wing. However, these alternating changes also produce two distinct effects. Based on the difference between these two effects, propeller rotation can be used in mode C when the aircraft wing has a short wingspan and a long chord, and propeller rotation can be used in mode D when the aircraft wing has a long wingspan and a narrow chord.

Figure 26.
Rotation mode A wing upper and lower surface pressure contour.

Figure 27.
Rotational Mode A velocity vector distribution and velocity streamline.

Figure 28.
Rotation mode B wing upper and lower surface pressure contour.

Figure 29.
Rotational Mode B velocity vector distribution and velocity streamline.

Figure 30.
Rotation mode C wing upper and lower surface pressure contour.

Figure 31.
Rotational Mode C velocity vector distribution and velocity streamline.

Figure 32.
Rotation mode D wing upper and lower surface pressure contour.

Figure 33.
Rotational Mode D velocity vector distribution and velocity streamline.
4.3. Dynamics Performance Analysis of the DHEPA and the Reference Aircraft
4.3.1. Drag Polar Analysis
The drag polar is the curve of the lift coefficient and the drag coefficient of an aircraft, which is the most important aerodynamic parameter to measure the lift and drag characteristics of an aircraft [40]. To analyze the dynamic performance of an aircraft and determine the lift and drag magnitude of an aircraft in each flight state, it is necessary to calculate and image the drag polar of the reference aircraft and the DHEPA.
The pole curve equation for the ideal state is described as
where is the drag coefficient, is the zero-lift drag coefficient, is the aspect ratio, and is the Oswald efficiency factor. Since the Mach number of the reference aircraft is less than 0.9 and the spreading ratio is more than 5, the Oswald efficiency factor is calculated using Equation (66) [41]
where is the number of propellers on the leading edge of the wing, is the wing swept back angle, is the relative thickness of the wing, and is the ratio of wing tip chord length to wing root chord length.
The zero-lift drag coefficient can be calculated by [42]
where is the equivalent drag area and is the area of the aircraft wing.
The equivalent drag area is related to the surface friction coefficient and the maximum takeoff mass, so to simplify the calculation, the empirical formula for the equivalent drag area of a propeller aircraft is selected as
In view of Equations (64)–(69), the corresponding zero-lift drag coefficients, Oswald’s efficiency factors, spreading ratios, and other parameters for the two aircraft can be calculated as shown in Table 9. Based on the pole curve input parameter values and Equation (65), the ideal state pole curves for the DHEPA and the reference aircraft can be obtained as shown in Figure 34.

Table 9.
Drag polar input parameters.
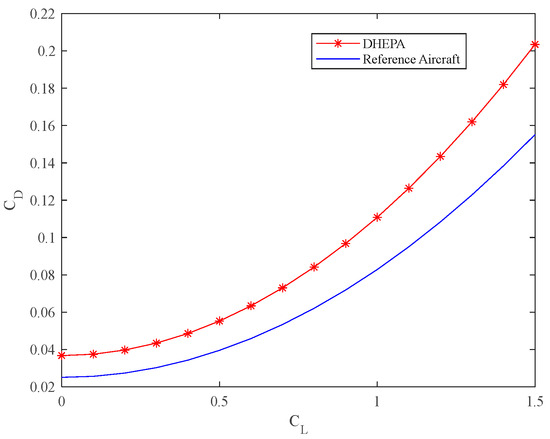
Figure 34.
Two aircraft pole curves in the ideal state.
Based on the maximum slopes of the drag polars corresponding to the two aircraft in the ideal state, the maximum lift-to-drag ratio suffered by the two aircraft during flight can be calculated as
The maximum lift-to-drag ratio of the reference aircraft is , and the maximum lift-to-drag ratio of DHEPA is . Since the DHEPA is propelled by fourteen small propellers and the reference aircraft is propelled by two large propellers, the increase in propellers makes the resistance of the DHEPA larger. Additionally, the formula for calculating the ideal lift-resistance ratio does not fully take into account the propeller slipstream effect, which makes the reference aircraft maximum lift-resistance ratio larger than the DHEPA maximum lift-resistance ratio.
4.3.2. Takeoff Ground Roll Performance Analysis
The power used by a light utility aircraft during the takeoff ground roll is generally the maximum power of the power plant, while the power used during climb is 90% of the maximum power of the powertrain. The takeoff ground roll can generally be divided into three phases: ground roll, rotation, and takeoff phase. The takeoff ground roll is shown in Figure 35.
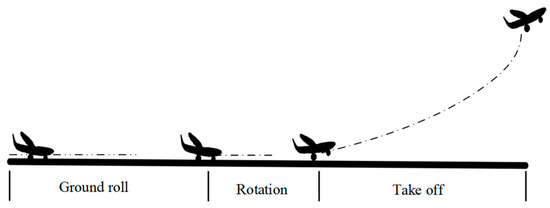
Figure 35.
Takeoff ground roll.
The takeoff ground roll of an aircraft is a process of variable acceleration, in which the lift of an aircraft increases until the main wheels of the aircraft lift off. During this process, the thrust generated by the propeller and the drag force on the aircraft are not constant. The drag force on the aircraft mainly includes ground friction and air resistance, in which the ground friction decreases with the increasing lift force, while the air resistance of the aircraft increases with increasing ground-roll speed. To analyze the difference in the performance of the DHEPA and the reference aircraft in the takeoff ground roll phase, combined with engine research experience, the following assumptions are made for the ground roll phase of the aircraft:
- The sum of air resistance and ground roll friction resistance remains constant.
- The thrust force on the aircraft during the takeoff ground roll stage remains constant.
- The whole takeoff ground roll process of the aircraft is regarded as a process of uniform acceleration.
The lift and air resistance on the aircraft are expressed as
The resistance of an aircraft during a ground roll consists of two parts, air resistance and ground friction resistance , i.e., .
The empirical formula for propeller ground thrust for the reference aircraft can be described as [23]
where is the density of air at standard atmospheric pressure, . The ratio of the two densities at different flight altitudes can be represented as
where is altitude.
To obtain the thrust of both aircraft, the power of their power plants needs to be estimated and calculated according to Equation (73). The empirical equations for the approximate estimation of variation of power, with height for the permanent magnet synchronous motor and piston engine, are formulated as Equations (75) and (76), respectively [43]
where and are the power of the drive motor at flight altitude H and sea level, respectively, and is the temperature rise limit of the motor; are the power of the engine at flight altitude H, ambient pressure, and temperature, respectively; and are the power of the engine at sea level, ambient pressure, and temperature, respectively.
The dynamic equations and force analysis calculations in the takeoff ground roll are as follows
where is the coefficient of friction of the airport against the wheels of the aircraft, and for a dry concrete runway, . So the following exists
In the first two stages of the takeoff process, there is . Integrating Equation (79) yields
where is the liftoff speed of the aircraft at the moment at the end of the rotation phase.
To summarize, to shorten the ground-roll time and ground-roll distance as much as possible, it can be used to increase the thrust, reduce the ground-leaving speed, reduce the friction resistance coefficient, and reduce the resistance during skidding. The aircraft flight performance calculation manual gives various types of aircraft ground speed ranges, for which civil aircraft ground speed range is
where is the stall speed, the average value taken being . According to the P2006T Aircraft Operations Manual, the stall speed is 66 knots, i.e., .
In the process of aircraft ground roll, assuming that the aircraft follows uniformly accelerated linear motion, when the aircraft is at the beginning of the ground roll stage, the speed is zero; aircraft resistance is the ground friction, when the aircraft is off the ground instantly, aircraft resistance is the air friction. The aircraft ground roll process as a whole, the resistance of the aircraft for the average of the maximum value of the two types of resistance, can be phrased as
where is ground friction at the moment that the aircraft starts ground roll, is air friction on the aircraft at the moment of takeoff from the ground, and is the lift-to-drag ratio on the aircraft at the moment of takeoff from the ground.
In summary, the DHEPA and the reference aircraft takeoff ground roll distance versus airport altitude can be obtained, as shown in Figure 36.
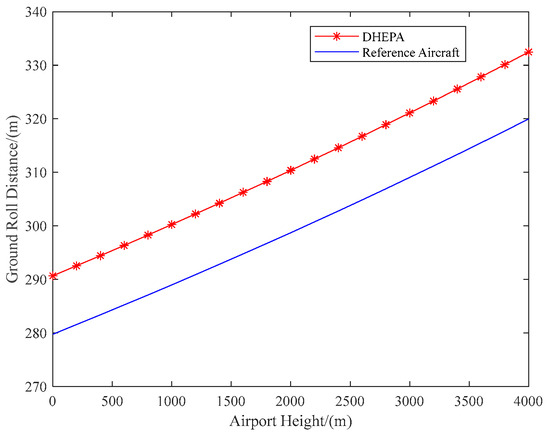
Figure 36.
Relationship between airport altitude and ground roll distance.
As shown in Figure 36, the required ground roll distance of the aircraft increases with the increase in airport altitude. Meanwhile, at the same airport altitude, the required ground roll distance of the reference aircraft is shorter than that of the DHEPA due to the significant weight increase in the DHEPA compared to the reference aircraft.
4.3.3. Climbing Performance Analysis
Important indicators to describe climb performance include climb angle, climb rate, climb time, residual thrust, and other indicators [44]. Civil aircraft usually climb at a fixed climb angle and rate in the process of climbing, so it can be approximated as a constant climb. In a constant climb state, the aerodynamic forces on the aircraft change very little, and can be regarded as a quasi-static flight from the view of the force state. Assuming that the constant climb speed of the aircraft is , the climb rate of the aircraft can be expressed as
The empirical formula for the thrust on a single propeller in the air can be phrased as
With aircraft dynamics calculations, considering the effects of atmospheric density and airport altitude, the climb rate versus altitude curves for the DHEPA and the reference aircraft can be simulated, as shown in Figure 37.
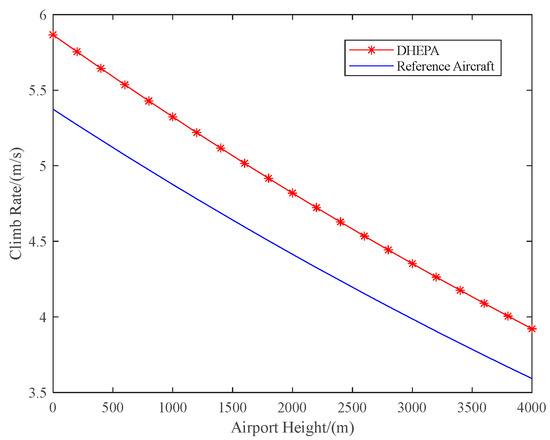
Figure 37.
Comparison of climb rate with airport altitude for the DHEPA and the reference aircraft.
As can be seen in the Figure 37, the climb rate of the aircraft decreases with increasing airport altitude. If taking off and climbing from the same airport altitude, the DHEPA is able to achieve a higher climb rate compared to the reference aircraft. Taking the climb rates of the two aircraft at zero altitude as an example, the DHEPA’s climb rate after takeoff is 11% higher than that of the reference aircraft, and a higher climb rate means that the aircraft can climb to the mission altitude at a faster rate. From this point of view, the DHEPA has a better power performance than the reference aircraft.
4.3.4. Level Flight Performance Analysis
The aircraft enters the level flight stage after ground roll and climbing. Level flight performance is reflected by the aircraft’s performance parameters when the aircraft is flying smoothly in the air, usually including the level flight thrust, maximum level flight speed, and so on. It is assumed that the aircraft is in uniform linear motion during level flight, and mass reduction caused by fuel consumption during the working process is not taken into account. When the aircraft is flying at a constant speed, it is in the state of zero acceleration and balance of forces, at which time the lift equals the weight and thrust generated by propellers equals the drag, i.e.,
where , , and are total thrust force generated by the propeller at level flight, air resistance and lift force on the aircraft, and level flight speed, respectively.
On account of Equations (87) and (88), and the ideal state drag polar, the required thrust of the aircraft at a constant cruising speed can be determined as
where is the lift-to-drag ratio coefficient corresponding to level flight speed.
Based on the aircraft’s required thrust lines and maximum propeller thrust lines available for the two aircraft, the thrust lines can be plotted for different level flight speeds, as shown in Figure 38.
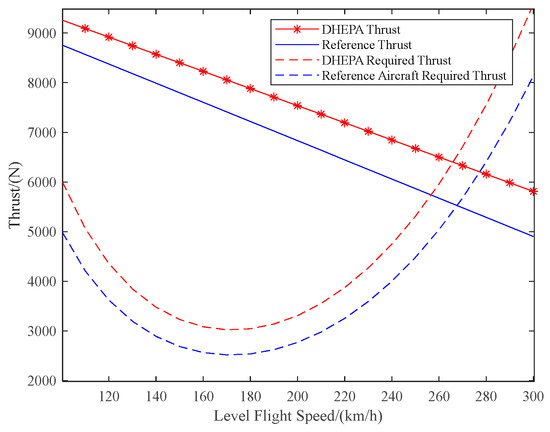
Figure 38.
Thrust lines for both aircraft at different level flight speeds.
In the thrust curve, the line of the aircraft’s required thrust is a curve that descends and then rises. When level flight speed is 150–200 km/h, the aircraft requires less thrust and, therefore, less power, and level flight at this speed can prolong the endurance of the aircraft. The reference aircraft and the DHEPA’s thrust line is two straight lines with negative slopes, the intersection of the aircraft’s available thrust line and the required thrust line indicates the maximum level flight speed point of the aircraft under the power, as can be seen in Figure 38. The maximum level flight speed point of the reference aircraft is about 270 km/h, while the maximum level flight speed point of the DHEPA is about 260 km/h. The DHEPA adopts a multi-propeller propulsion layout to achieve a larger thrust.
4.4. DHEPA Power Allocation Management Simulation
MATLAB R2023a software and the CVX toolbox were applied to solve convex optimization problems for DHEPA power allocation management. The previously designed DHEPA has two sets of identical propulsion systems, each of which contains an engine, a generator, a li-ion battery, and seven small propulsion motors, and to simplify the analytical process, power allocation of one of the sets of the hybrid electric propulsion systems is considered only. To simulate the reverse charging of the battery by the propeller during windmill state of the aircraft, the propulsion motor can be applied as a generator for a short period of time, and model parameters of this small generator are kept the same as those of the electric motor. DHEPA parameters are shown in Table 10.

Table 10.
Model parameters of DHEPA.
A complete aircraft mission includes the process of ground roll, taking off, climbing, cruising, descending, and landing, etc. In order to facilitate the analysis of the aircraft’s fuel consumption and the power allocation of each component, ignoring the fuel consumption of the aircraft’s jogging, waiting, and ground roll, and starting from the moment of the aircraft’s takeoff from the ground until the aircraft’s landing, which lasts for 1 h and flies , the speed profile and altitude profile of the DHEPA are selected and plotted as a flight instruction, as shown in Figure 39.
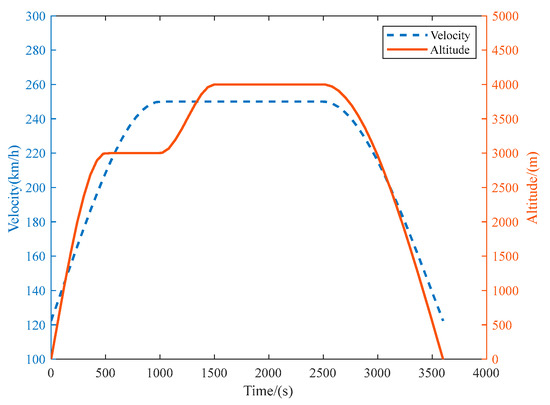
Figure 39.
Relationship of aircraft speed and altitude with time.
Figure 39 contains five flight processes: within 500 s after takeoff, aircraft speed and altitude increase continuously; within 500–1000 s, aircraft altitude remains unchanged at 3000 m and the speed increases continuously, until it reaches the maximum cruise speed of the aircraft; within 1000–1500 s, the aircraft begins to climb further until it reaches the maximum lift of the aircraft, during which the flight speed remains unchanged; within 1500–2500 s, the aircraft enters the cruise state at the maximum cruise speed and maximum cruise altitude; after 2500 s, the aircraft begins to descend until it lands. In this process, aircraft flight speed remains constant; within 1500–2500 s, the aircraft enters the cruise state, flying at the maximum cruise speed and maximum cruise altitude; after 2500 s, the aircraft begins to descend and the speed decreases until it hits the ground.
On account of a given flight speed and flight altitude, with the goal of minimizing fuel consumption, power flow and distribution of the aircraft under full operating conditions can be obtained. Figure 40 shows the distribution of the flow of the motor inputs outputs and propulsion power of the DHEPA.
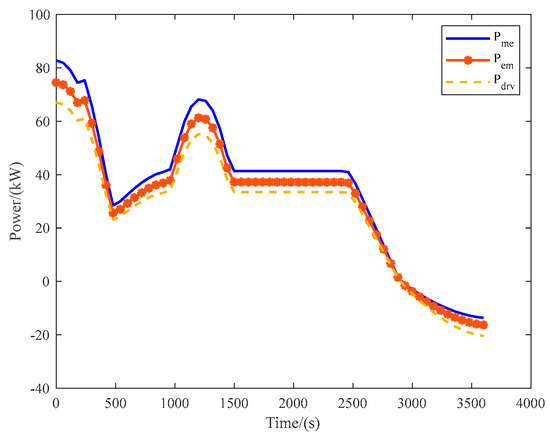
Figure 40.
Series DHEPA motor end power flow.
From Figure 40, the power consumed for takeoff and climb is the largest in the initial stage of the aircraft. As the speed and altitude of the aircraft continue to increase, the propulsion power of the aircraft continues to decrease and, at once, the motor electric power and shaft power of the DHEPA also decreases, until the aircraft reaches the predetermined speed and altitude values set at 500 s. Then, the propulsive power and the motor end power continue increasing because aircraft altitude remains constant and speed increases, but the increasing trend is slow. Starting at 1000 s, aircraft speed reaches its maximum and starts to climb. Aircraft propulsive power continues to increase continuously, and the increase rate is fast. As the aircraft enters the cruise state, the propulsive power of the aircraft remains stable, while the shaft power and electric power of the motor also remain stable. Finally, the aircraft begins to enter the descending landing phase. Eventually, the aircraft enters a windmill state at 2800 s, at which time the aircraft propeller reverses, and the propulsion motor transforms into a generator to generate electricity.
Figure 41 shows the fuel change in the tanks of the reference aircraft and the DHEPA during 1 h of mission. According to engine performance curves in Section 2, there is a certain quantitative relationship between fuel consumption and the output power of the reference aircraft engine, and fuel variation of the DHEPA is obtained by making a difference between the initial aircraft mass and the current moment aircraft mass. Usually, fuel consumption per unit of time is the highest in the climb phase of the aircraft, followed by the cruise phase, and is the lowest in descent phase. As shown clearly in Figure 42, the fuel consumption rate is highest in the climb phase; slows down as the ircraft enters the cruise phase; and, after 2800 s, the DHEPA enters the windmill state and no longer consumes fuel, while the reference aircraft continues to consume fuel.

Figure 41.
Comparison of fuel consumption between the reference aircraft and the DHEPA.
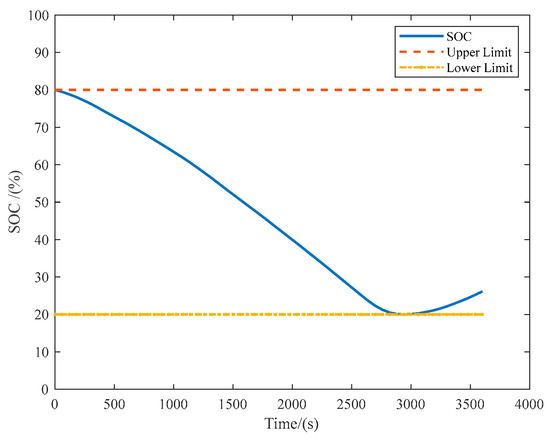
Figure 42.
Variation of the DHEPA battery SOC with flight time.
Figure 42 and Figure 43 show the relationship between SOC and the battery power of the DHEPA battery with flight time and flight conditions of the aircraft, respectively. To ensure the life and safety of the battery, the SOC upper limit and the SOC lower limit of the battery are 0.8 and 0.2, respectively. As shown in Figure 42, in the first 2800 s, the battery SOC decreases until it is lowered to the lower limit of the battery SOC, then the aircraft enters into a windmill state and the generator charges the battery, so that after 2800 s, the battery SOC has partially recovered. As shown in Figure 43, batteries all rise in the initial stage of power demand increase, and battery power decreases as generator power increases. From the total mission envelope, the battery discharging power continues to increase until the aircraft enters the windmill state at 2800 s, and the battery reverses to be charged, so the battery power is negative.
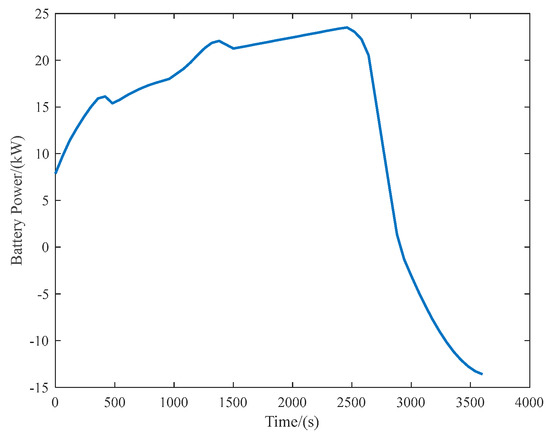
Figure 43.
Variation of the DHEPA battery power with flight time.
According to Equation (12), the sum of the power input to the aircraft grid from the generator and the battery should be equal to the electrical power input to the motor, and this feature of series power frame is verified and calibrated, as shown in Figure 44.
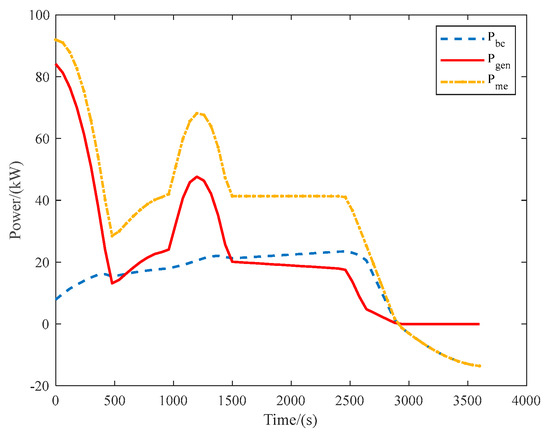
Figure 44.
Series DHEPA frame power calibration.
As can be seen from Figure 44, the generator power output change rule is almost consistent with the propulsion power demand change rule. In the aircraft’s takeoff, climb, speed increase, and other power requirements of the mission segment, the generator plays a more important role; when entering cruise and other flight segments, the motor provides greater power until the aircraft is ready to land. Battery power is as low as the SOC limit, which ensures that aircraft fuel consumption is minimized. After the aircraft enters the windmill phase, the engine and generator stop the power output, and power obtained from the aircraft grid completely charge the li-ion battery. After calibration, the sum of aircraft generator power and battery power output to the grid is aircraft grid power.
5. Conclusions
To meet the requirements on reducing carbon emissions and lower fuel consumption rates, this paper carries out an original Distributed Hybrid Electric Propulsion Aircraft (DHEPA) design scheme and expresses a novel power allocation management method based on convex optimization, to realize that the aircraft possesses medium and long-range flights, improved aerodynamic performance, and decreased fuel consumption rate.
The main features of this article include:
- An original DHEPA design scheme is proposed by taking the Tecnam P2006T general-purpose aircraft as a reference aircraft in this paper. Based on the demanded power and external dimensions of the reference aircraft, the key components of the DHEPA were selected and modeled.
- The DHEPA is in the form of series architecture, with significant advantages. Because the engine is directly connected to the generator in the DHEPA, a power allocation management system design is relatively simple.
- Focusing on the quantitative relationship between the input and output power of each component of the DHEPA, the power model of each component has been built.
- Based on the power model of the proposed DHEPA, a novel convex optimized power allocation management method is presented to enable the DHEPA consumes the least amount of fuel while performing the flight mission.
- The constructed power model is convex optimized so that it can be solved by the convex optimization method. The approach of the convex optimization method can avoid a slide into the local optimum and achieve global optimum in power allocation management.
- Power allocation management is simulated for a complete mission, including ground roll, takeoff, climb, cruise, descent, and landing, for a distributed aircraft. The results show that the DHEPA has lower fuel consumption compared to the reference aircraft under the same flight conditions.
- A comparative analysis between the proposed DHEPA and the reference aircraft has been completed, exploring both aerodynamic performance and dynamics performance.The simulation results show that:
- Compared to the reference aircraft, the DHEPA has a 15.7% increase in maximum takeoff weight.
- The DHEPA has a significant advantage over the reference aircraft in terms of power performance during several important phases, such as takeoff ground roll, climb, and cruise.
- Based on flight altitude, Mach number, and other parameters, power allocation management of the DHEPA aircraft has been carried out. The DHEPA consumes less fuel than the reference aircraft.
Compared with the reference aircraft, the lift of the DHEPA is increased by 46%, which not only compensates for the mass increase brought by the modification, but also improves the maximum takeoff mass of the aircraft. Propeller wing fluid simulations explain the effect of rotational direction on the wing, i.e., due to the slipstream effect of the propellers, the rotational direction of multiple propellers of a distributed aircraft can be changed alternately, thus maximizing the lift of the DHEPA. Under typical sectors, the DHEPA has a higher rate of climb and significantly lower fuel consumption rate.
Author Contributions
Conceptualization and original draft preparation, L.X.; simulation, review, and editing, Y.T.; investigation and software, X.Z. and Z.H. All authors have read and agreed to the published version of the manuscript.
Funding
This manuscript is supported by National Natural Science Foundation of China (No.62373185, No.51876089).
Data Availability Statement
The data presented in this study are available in the article.
Acknowledgments
The authors would like to thank all of their lab-mates. This work is partially supported by High Performance Computing Platform of Nanjing University of Aeronautics and Astronautics.
Conflicts of Interest
The authors declare no conflicts of interest.
References
- Farokhi, S. Future Propulsion Systems and Energy Sources in Sustainable Aviation; John Wiley & Son: Hoboken, NJ, USA, 2020. [Google Scholar]
- Sayed, E.; Abdalmagid, M.; Pietrini, G.; Sa’adeh, N.M.; Callegaro, A.D.; Goldstein, C.; Emadi, A. Review of Electric Machines in More-/Hybrid-/Turbo-Electric Aircraft. IEEE Trans. Transp. Electrif. 2021, 7, 2976–3005. [Google Scholar] [CrossRef]
- Benzaquen, J.; He, J.; Mirafzal, B. Toward more electric powertrains in aircraft: Technical challenges and advancements. CES Trans. Electr. Mach. Syst. 2021, 5, 177–193. [Google Scholar] [CrossRef]
- Thalin, P.; Rajamani, R.; Maré, J.C.; Taubert, S. Aircraft Applications-Part II: Hybrid-Electric Propulsion; SAE: Warrendale, PA, USA, 2018; pp. 161–179. [Google Scholar]
- Wheeler, P.; Sirimanna, T.S.; Bozhko, S.; Haran, K.S. Electric/Hybrid-Electric Aircraft Propulsion Systems. Proc. IEEE 2021, 109, 1115–1127. [Google Scholar] [CrossRef]
- Armstrong, M.J.; Ross, C.A.; Blackwelder, M.J.; Rajashekara, K. Trade Studies for NASA N3-X Turboelectric Distributed Propulsion System Electrical Power System Architecture. SAE Int. J. Aerosp. 2012, 5, 325–336. [Google Scholar] [CrossRef]
- Barzkar, A.; Ghassemi, M. Components of Electrical Power Systems in More and All-Electric Aircraft: A Review. IEEE Trans. Transp. Electrif. 2022, 8, 4037–4053. [Google Scholar] [CrossRef]
- Papathakis, K.V.; Sessions, A.M.; Burkhardt, P.A.; Ehmann, D.W. A NASA Approach to Safety Considerations for Electric Propulsion Aircraft Testbeds; American Institute of Aeronautics and Astronautics Inc., AIAA: Atlanta, GA, USA, 2017. [Google Scholar]
- Samuel, A.; Lin, Y. Airvolt Aircraft Electric Propulsion Test Stand, Orlando; American Institute of Aeronautics and Astronautics Inc., AIAA: Orlando, FL, USA, 2015. [Google Scholar]
- Brelje, B.J.; Martins, J. Electric, Hybrid and Turboelectric Fixed-wing Aircraft: A Review of Concepts, Models, And Design Approaches. Prog. Aerosp. Sci. 2019, 104, 1–19. [Google Scholar] [CrossRef]
- Fard, M.T.; He, J.; Huang, H.; Cao, Y. Aircraft Distributed Electric Propulsion Technologies—A Review. IEEE Trans. Transp. Electrif. 2022, 8, 4067–4090. [Google Scholar] [CrossRef]
- Izaguirre, A.O.T.; González, L.M.G.-C.; Igeño, P.Q.; Martínez, P.V. Series-hybridisation, distributed electric propulsion and boundary layer ingestion in long-endurance, small remotely piloted aircraft: Fuel consumption improvements. Aerosp. Sci. Technol. 2022, 120, 107227. [Google Scholar] [CrossRef]
- Kim, H.D.; Perry, A.T.; Ansell, P.J. A Review of Distributed Electric Propulsion Concepts for Air Vehicle Technology. In Proceedings of the 2018 AIAA/IEEE Electric Aircraft Technologies Symposium (EATS), Cincinnati, OH, USA, 12–14 July 2018; pp. 1–21. [Google Scholar]
- Da, X.; Fan, Z.; Xiong, N.; Wu, J.; Zhao, Z. Modeling and analysis of distributed boundary layer ingesting propulsion system. Acta Aeronaut. Astronaut. Sin. 2018, 39, 113–121. [Google Scholar]
- Yan, W.; Wu, J.; Zhang, Y. Effects of distributed propulsion crucial variables on aerodynamic performance of blended wing body aircraft. J. Beijing Univ. Aeronaut. Astronaut. 2015, 41, 1055–1065. [Google Scholar]
- Da, X.; Li, Y.; Xiong, N.; Zhong, S. Distributed electrical propulsion system design and fuel consumption evaluation for a blended-wing-body transport. J. Aerosp. Power 2019, 34, 2158–2166. [Google Scholar]
- Zhang, X.; Zhang, W.; Weilin, L.I.; Zhang, X.; Tao, L.E.I. Experimental research on aero-propulsion coupling characteristics of a distributed electric propulsion aircraft. Chin. J. Aeronaut. 2023, 36, 201–212. [Google Scholar] [CrossRef]
- Wang, X.-C.; Chen, Y.-C.; Wang, Y.-R. Fuel Consumption Analysis of Distributed Propulsion. In Proceedings of the 2022 13th International Conference on Mechanical and Aerospace Engineering (ICMAE), Bratislava, Slovakia, 20–22 July 2022; pp. 342–346. [Google Scholar]
- Lei, T.; Kong, D.; Wang, R.; Li, W.; Zhang, X. Evaluation and optimization method for power systems of distributed electric propulsion aircraft. Acta Aeronaut. Astronaut. Sin. 2021, 42, 44–63. [Google Scholar]
- Sun, G.; Song, Z.; Xi, J.; Zhu, L. Design and Simulation of Hybrid Electric Vehicle Control Strategy Based on Capacity Difference. In Proceedings of the 2022 IEEE 2nd International Conference on Power, Electronics and Computer Applications, ICPECA, Shenyang, China, 21–23 January 2022; pp. 585–589. [Google Scholar]
- Krznar, M.; Pavković, D.; Cipek, M.; Benić, J. Modeling, controller design and simulation groundwork on multirotor unmanned aerial vehicle hybrid power unit. Energies 2021, 14, 7125. [Google Scholar] [CrossRef]
- Nicolosi, F.; Marco, D.A.; Vecchia, D.P. Stability, flying qualities and longitudinal parameter estimation of a twin-engine CS-23 certified light aircraft. Aerosp. Sci. Technol. 2013, 24, 226–240. [Google Scholar] [CrossRef]
- Ribner, H.S.; Foster, S.P. Ideal efficiency of propellers-Theodorsen revisited. NTRS 1990, 27, 810–819. [Google Scholar] [CrossRef]
- Newman, S.J. Principles of Helicopter Aerodynamics—Second edition J.G. Leishmann Cambridge University Press, The Edinburgh Building, Shaftesbury Road, Cambridge, CB2 2RU, UK. 2006. 826pp. Illustrated. £65. ISBN 0-521-85860-7. Aeronaut. J. 2007, 111, 825–826. [Google Scholar] [CrossRef]
- Stoll, A.M.; Bevirt, J.; Moore, M.D.; Fredericks, W.J.; Borer, N.K. Drag Reduction Through Distributed Electric Propulsion. In Proceedings of the 14th AIAA Aviation Technology, Integration, and Operations Conference, Atlanta, GA, USA, 15–19 June 2014. [Google Scholar]
- Dannier, A.; Del Pizzo, A.; Di Noia, L.P.; Meo, S. Weight Estimation of the Wiring in A Distributed Propulsion System for Aircraft. In Proceedings of the 2019 AEIT International Annual Conference (AEIT), Florence, Italy, 18–20 September 2019; pp. 1–6. [Google Scholar]
- Hamilton, P. Rotax 912 Engine Introduction; Independent Pub Group: Chicago, IL, USA, 2007. [Google Scholar]
- Mechanical Engineering Handbook Editorial Board. Handbook of Electrical Engineering; Machinery Industry Press: South Norwalk, CT, USA, 1997. [Google Scholar]
- Elrefaie, A.; Osama, M. High Specific Power Electrical Machines: A System Perspective. CES Trans. Electr. Mach. Syst. 2019, 3, 88–93. [Google Scholar] [CrossRef]
- Van den Bossche, P.; Vergels, F.; Van Mierlo, J.; Matheys, J.; Van Autenboer, W. SUBAT: An Assessment of Sustainable Battery Technology. J. Power Sources 2006, 162, 913–919. [Google Scholar] [CrossRef]
- Doff-Sotta, M.; Cannon, M.; Bacic, M. Predictive Energy Management for Hybrid Electric Aircraft Propulsion Systems. IEEE Trans. Control. Syst. Technol. 2023, 31, 602–614. [Google Scholar] [CrossRef]
- Guzzella, L.; Sciarretta, A. Vehicle Propulsion Systems; Springer: Berlin/Heidelberg, Germany, 2007. [Google Scholar]
- Kovaova, G.; Rudloff, B. Convex Projection and Convex Multi-objective Optimization. J. Glob. Optim. 2022, 83, 301–327. [Google Scholar] [CrossRef]
- Meshginqalam, A.; Bauman, J. Integrated Convex Speed Planning and Energy Management for Autonomous Fuel Cell Hybrid Electric Vehicles. IEEE Trans. Transp. Electrif. 2023, 9, 1072–1086. [Google Scholar] [CrossRef]
- Pang, M.J.; Wei, J.J. Analysis of drag and lift coefficient expressions of bubbly flow system for low to medium Reynolds number. Nucl. Eng. Des. 2011, 241, 2204–2213. [Google Scholar] [CrossRef]
- Liu, P. Air Propeller Theory and Its Application; BUAA Press: Beijing, China, 2006. [Google Scholar]
- Ismail, N.I.; Yusoff, H.; Sharudin, H.; Pahmi, A.; Hafiz, H.; Mahadzir, M.M. Lift distribution of washout twist morphing MAV wing. Int. J. Eng. Technol. 2018, 7, 89. [Google Scholar] [CrossRef]
- Lyu, C.; Liu, P.; Hu, T.; Geng, X.; Sun, T.; Akkermans, R.A.D. A sliding mesh approach to the Lattice Boltzmann Method based on non-equilibrium extrapolation and its application in rotor flow simulation. Aerosp. Sci. Technol. 2022, 128, 107755. [Google Scholar] [CrossRef]
- Shi, J.; Zhou, J.; Wu, L. Aerodynamic Investigation of a General Aviation Aircraft with Distributed Electric Propulsion. In Proceedings of the 2021 IEEE International Conference on Advances in Electrical Engineering and Computer Applications (AEECA), Dalian, China, 27–28 August 2021; pp. 672–676. [Google Scholar]
- Houghton, E.L.; Carpenter, P.W.; Collicott, S.H.; Valentine, D.T. Aerodynamics for Engineering Students; Butterworth-Heinemann: Oxford, UK, 2015. [Google Scholar]
- Zhu, Z.; Xiao, T.; Zhi, H.; Deng, S.; Lu, Y. Aerodynamic characteristics of co-flow jet wing with simple high-lift devices. Chin. J. Aeronaut. 2022, 35, 67–83. [Google Scholar] [CrossRef]
- Sforza, P.M. Direct Calculation of Zero-Lift Drag Coefficients and (L/D)max in Subsonic Cruise. J. Aircr. 2020, 57, 1–5. [Google Scholar] [CrossRef]
- Jakub, H.; Helena, B.; Stanislav, P. Assessment of All-Electric General Aviation Aircraft. Energies 2020, 13, 6206. [Google Scholar] [CrossRef]
- Pasquale, S. Commercial Airplane Design Principles; Elsevier Inc.: Amsterdam, The Netherlands, 2014. [Google Scholar]
Disclaimer/Publisher’s Note: The statements, opinions and data contained in all publications are solely those of the individual author(s) and contributor(s) and not of MDPI and/or the editor(s). MDPI and/or the editor(s) disclaim responsibility for any injury to people or property resulting from any ideas, methods, instructions or products referred to in the content. |
© 2024 by the authors. Licensee MDPI, Basel, Switzerland. This article is an open access article distributed under the terms and conditions of the Creative Commons Attribution (CC BY) license (https://creativecommons.org/licenses/by/4.0/).