1. Introduction
To ensure flight safety and efficiency in the field of civil aviation, effective communication between aerodromes and airspace must be established. The very-high-frequency communication system (VHF COMM) is a vital component in the realm of mobile wireless communication and plays a pivotal role in the communication of civil aviation. Operating primarily through voice transmission, the VHF COMM system employs very-high-frequency radio signals to convey information between communicating parties. Air traffic controllers monitor aircraft in the airspace using radar surveillance within the air traffic control system. Positioned at air traffic control stations, controllers provide airborne traffic services by issuing voice commands through the VHF COMM system, enabled by interphone systems, to aircraft within their assigned airspace sectors.
The very-high-frequency communication system has an operational frequency range of 30 to 300 MHz, placing it within the very-high-frequency spectrum. VHF radios serve as a primary communication tool within the A1 maritime area of the Global Maritime Distress and Safety System (GMDSS), serving as a pivotal means for on-site communication and the sole method for communication between air traffic controllers and pilots. Presently, VHF radios used in civil aviation operate between 118.000 and 151.975 MHz (with an actual maximum frequency of 136 MHz), with a frequency spacing of 25 kHz per channel. This frequency range and channel spacing are stipulated by the International Civil Aviation Organization. Notably, the frequencies between 121.600 and 121.925 MHz are designated primarily for ground control.
The very-high-frequency (VHF) system operates using amplitude modulation (AM) and has a minimum transmitter output power of 20 W. The key characteristics of VHF transmission are as follows: Due to their high frequency, surface waves experience rapid attenuation, resulting in short propagation distances along the line of sight. As a result, VHF communication relies primarily on space wave propagation, which is highly susceptible to tropospheric effects. Additionally, terrain and geographical features have a significant impact. Factors such as weather, encoders, and thermal noise within the radiotelephone communications channel often lead to challenges such as high noise levels and voice signal distortion in communications.
The VHF radiotelephone communication system is the primary communication network for commercial aircraft within the civil aviation system. It enables bidirectional voice communication between the flight crew and the air traffic controller at various stages of flight. The takeoff and landing phases are the busiest periods for aircraft pilots, and also the most susceptible to accidents. To ensure accurate information exchange between air traffic controllers and flight crews during these crucial phases, VHF communication must be highly reliable. Therefore, real-time evaluation and monitoring of the communication quality between ground and airborne parties becomes a focal point of radiotelephone communications in civil aviation.
In radiotelephone communications, the “Radio Check” command is typically used to determine the operational status and signal quality of voice transceivers and to establish contact with ground control stations. The “Radio Check” command pertains to radio verification and evaluates the quality and consistency of radio signals. In aerial communications, pilots communicate with air traffic controllers to inquire about the clarity of the signals they are receiving. The controller responds and provides advice to ensure smooth communication. According to ICAO’s official recommendations, the sequence for a radio verification is as follows: the other party’s call sign + one’s own call sign + “Radio Check” + “how do you read”. In response, the signal quality is categorized into five levels and reported as follows: Unreadable, Sometimes readable, Readable but with difficulty, Readable, and Perfectly readable [
1,
2,
3].
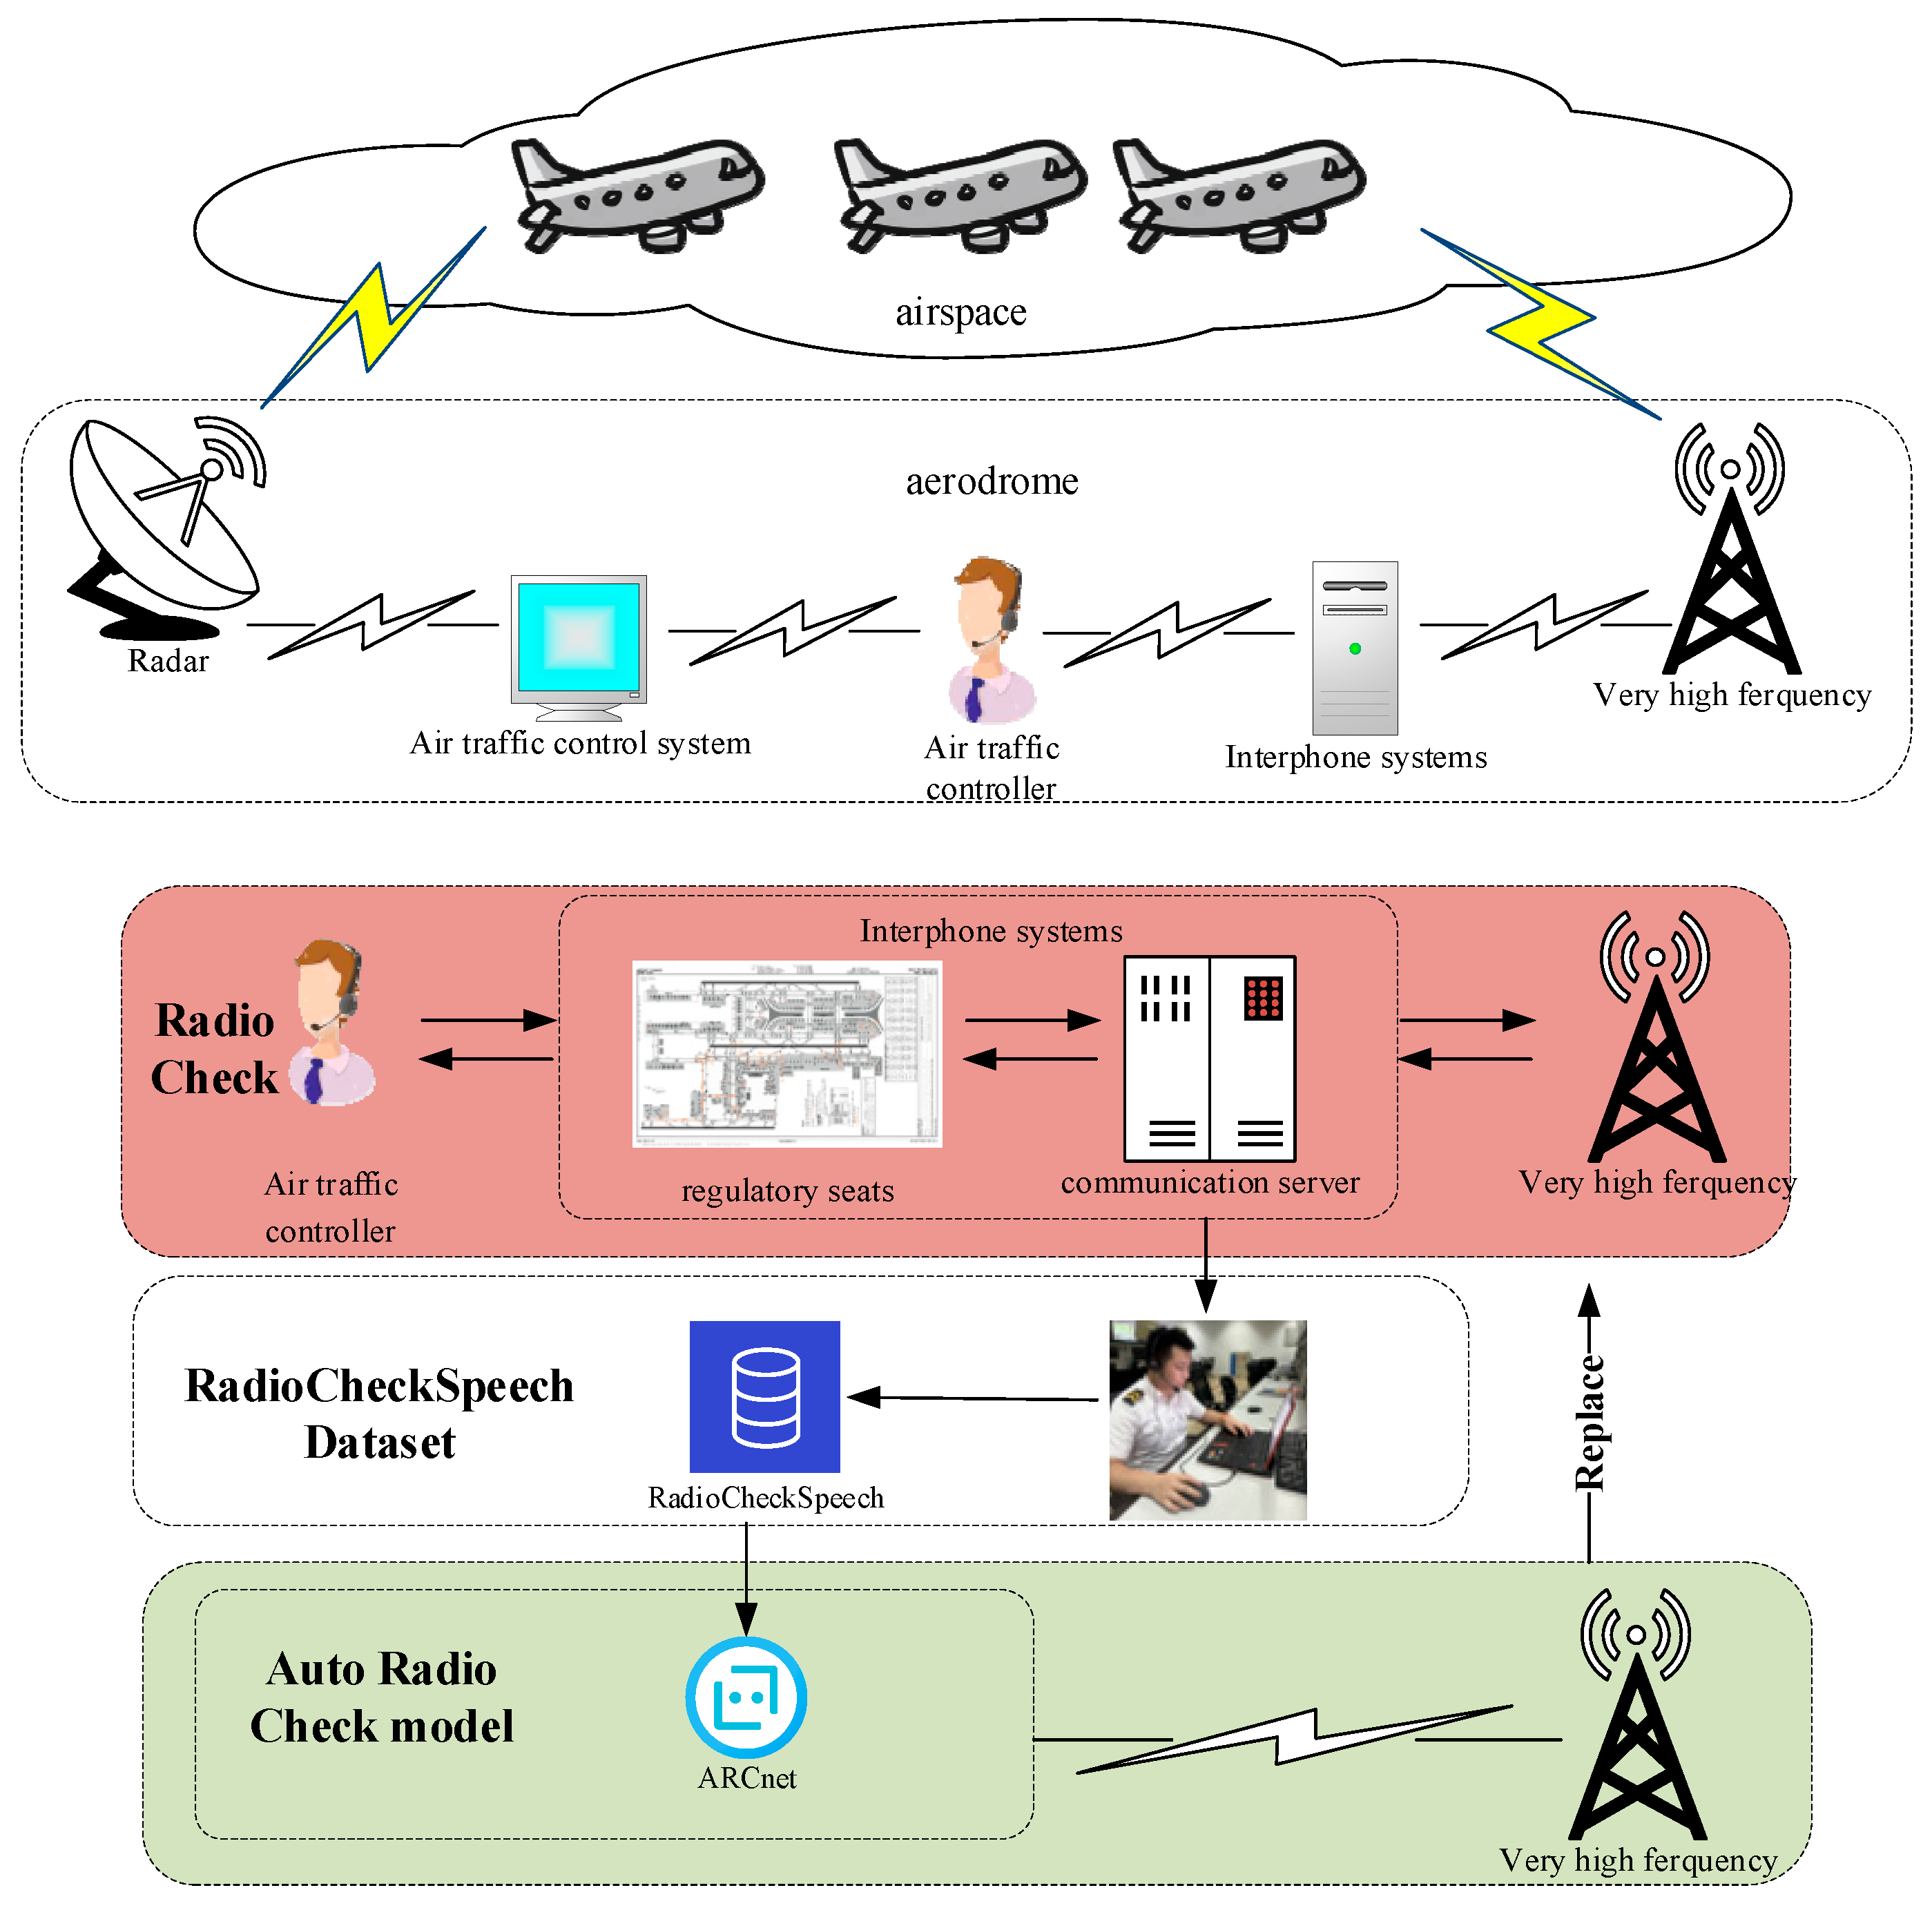
As shown in
Figure 1, when an aircraft initially enters an airspace, it makes contact with an air traffic controller and executes the “Radio Check” command to conduct a radio signal evaluation. The pilot’s voice command undergoes modulation through a very high frequency (VHF) before transmission from the aircraft. Upon reception by the aerodrome’s VHF equipment, the signal is routed to the interphone systems. Subsequently, the air traffic controller evaluates the speech quality based on the received signal, and the evaluation outcome aids both parties in fine-tuning their equipment.
In the actual communication environment of airports, the following reasons may lead to the deterioration of communication, requiring the parties involved to perform a radio check:
Poor weather conditions, which often introduce some noise.
Incorrect use of the transmitter by the communicating parties, such as using mismatched frequency bands (which is generally the main reason for conducting a radio check), and placing the transmitter too close to the speaker’s mouth (this can cause popping sounds, which is also a secondary reason for conducting a radio check).
Aging communication equipment. The current very-high-frequency communication system, compared to the latest WLAN or cellular communications, still modulates, transmits, and demodulates the original signal. The electronic components filter the signal which can lead to a loss of information and the introduction of noise.
In the actual operation of airports, such interactions are plentiful, and effective radio communication can enhance the efficiency of airport operations [
4]. Under poor communication conditions, both ground and air parties expend significant time and effort on radio adjustments, which, on average, reduces the efficiency of airport operations and poses safety risks [
5]. We have analyzed dialogue data from several major airports in China. During the actual operation of airports, the time taken for one command exchange is about 10 s. Including the time taken by both parties to adjust the transmitter, one manual radio adjustment takes about 10 to 20 s, while the actual duration of a normal conversation does not exceed one minute. Moreover, currently, in the actual operation of airports, both parties must manually perform radio checks. Therefore, employing machines for radio adjustments can significantly increase the information throughput of ground-to-air communications, thereby improving the efficiency of controllers.
This study aims to replace the manual “Radio Check” scoring process with an automated machine-based evaluation. By harnessing voice data received by the aerodrome’s VHF equipment, the Auto Radio Check model emulates the controller’s perception of speech quality. The real-time assessment of voice data is conducted using the results of the “Radio Check” scoring. This method not only streamlines the cumbersome radio verification procedure performed each time communication is established between ground and airborne parties, thereby improving communication efficiency, but it also provides a more immediate and intuitive depiction of the channel quality.
Hence, the objective of this study is to compile a RadioCheckSpeech Dataset consisting of radiotelephone communication voice data obtained from interphone systems and evaluated by air traffic controllers. This dataset will be used to train and validate models.
The evaluation of voice in radiotelephone communication heavily relies on the most immediate subjective perception of air traffic controllers, similar to the mean opinion score (MOS) assessment method. MOS is a subjective measurement method used to evaluate the quality of speech. It involves obtaining subjective ratings for voice samples from a group of individuals, including experts and non-experts. MOS scores are widely used in the telecommunications industry to assess call quality [
6,
7,
8]. The MOS and the “Radio Check” command in radiotelephone communication both share similarities as subjective, non-intrusive methods for voice assessment. A comparison of their evaluation methods is presented in
Table 1 below:
Currently, researchers are conducting extensive research on deep-learning-based speech quality prediction models, with the goal of replacing manual perceptual assessments with more accurate and cost-efficient methods. These efforts have accumulated numerous models and achievements. Intrusive speech quality assessment algorithms and non-intrusive speech quality assessment algorithms are the two most common classifications for such speech quality assessment algorithms. The distinction lies in the fact that intrusive algorithms require clean reference signals, whereas non-intrusive algorithms do not.
Non-intrusive speech quality assessment algorithms can evaluate speech quality without requiring reference signals. Due to the requirement for pristine, noise-free reference speech in intrusive assessments, non-intrusive algorithms are increasingly utilized in real-world settings. For instance, Lo et al. proposed MOSNet, a MOS predictor based on convolutional neural networks and bidirectional long short-term memory networks, which is used to predict MOS scores of converted speech in speech transformation systems [
9]. Fu et al. introduced Quality-Net, a speech quality assessment model based on bidirectional long short-term memory networks, which is used to predict MOS scores of enhanced speech generated by speech enhancement systems [
10]. Yoshimura et al. presented a synthetic speech naturalness predictor based on fully connected neural networks and convolutional neural networks, which is used to predict MOS scores of synthetic speech generated by speech synthesis systems [
11]. Naderi et al. presented AutoMOS, a naturalness assessment model based on autoencoders and convolutional neural networks, for predicting MOS scores of synthetic speech generated by speech synthesis systems [
12]. Mittal et al. proposed NISQA, a non-intrusive speech quality assessment model based on convolutional neural networks and long short-term memory networks, for predicting MOS scores of speech with various channel noise introductions [
13]. ITU-T Rec. P.563 is a single-ended method for objective speech quality assessment in narrowband telephone applications, approved in 2004 [
14]. ANIQUE+ is a novel national standard used in the United States for non-intrusive estimation of narrowband speech quality [
15]. A. A. Catellier and S. D. Voran introduced WAWEnets, a reference-free convolutional waveform method for estimating narrowband and wideband speech quality [
16].
Some examples of intrusive speech quality assessment algorithms for comparison are given as follows: ITU-T Rec. P.863 is a perceptual objective listening quality assessment method, approved in 2018 [
7]. The Integral and Diagnostic Intrusive Prediction of Speech Quality is an algorithm proposed by N. Coté that employs dual-end comparison for speech quality evaluation [
17]. M. Chinen et al. introduced the open-source, production-ready speech and audio metric ViSQOL v3 [
18].
As mentioned above, statistical speech assessment algorithms like P503, although more interpretable than deep-learning-based speech assessment algorithms, perform poorly in radio check evaluation tasks. In experiments, it was found that statistical speech assessment algorithms have a significant gap in perception compared to actual evaluators of speech quality. Therefore, the ARCnet network still opted for a deep-learning-based network architecture. Moreover, in practical research, it was discovered that controllers performing radio check scoring not only focus on the impact of noise in the speech but also on its comprehensibility. Speech quality assessment algorithms such as MOSNet, AutoMOS, and NISQA primarily focus on noise, with the models using mel-frequency cepstrum coefficient features as the vector for extracting speech quality. The NOMAM model and the speech evaluation algorithm proposed by Fu et al. utilize self-supervised learning features for assessing speech quality, but the self-supervised vector training mentioned still focuses on extracting speech noise, using noise characterization to predict speech quality [
19,
20]. Therefore, in the design of ARCnet, not only were mel-frequency cepstrum coefficient features strongly correlated with noise used, but self-supervised vector representations for comprehensibility features relevant to downstream tasks like speech recognition were also considered. In the multi-feature module network design, simply concatenating two different features is insufficient. As the research by Liu et al. suggests, skillfully fusing tensors can enhance the network’s perception of speech quality [
21]. Therefore, in the design of the ARCnet network, we perform differentiated information extraction for each type of feature, then concatenate them, and in subsequent ablation experiments, this network design approach has been shown to improve network performance.
In summary, Currently, traditional voice evaluation algorithms predominantly process speech using spectral features, focusing solely on the impact of audio noise on speech quality. However, in evaluating radio check scores, the intelligibility of the speech within the audio, that is, whether the audio can be accurately transcribed into text commands, must also be considered. This aspect of speech intelligibility serves as one of the dimensions for controllers when scoring a radio check. Therefore, one of the challenges in designing a radio check scoring network lies in encapsulating the audio’s spectral, intelligibility, and temporal information. The current speech evaluation algorithms rely heavily on mean opinion score (MOS) ratings as the primary evaluative metric. These algorithms are often applied in voice over Internet protocol (VOIP) networks, where voice data is transmitted in the form of data packets. In this context, factors affecting speech quality include network-related issues such as packet loss and latency. However, within the realm of civilian aviation communication, evaluation is typically conducted through radio check scoring. In this scenario, very-high-frequency communication systems directly modulate and demodulate voice signals using radio waves. Influential factors on voice quality encompass channel noise and interference generated by components. Currently, AI-powered networks have reached a significant level of maturity in predicting speech quality using the MOS scoring method. Although the MOS scoring method and the radio check scoring method produce similar results, there has been no prior research on the use of AI-based algorithms for evaluating radiotelephone communication speech quality in civil aviation communication systems. Given this context, the major contributions of this paper are as follows:
We present for the first time a non-intrusive speech quality assessment algorithm based on the radio check standard for radiotelephone communication that combines human-engineered and self-supervised features. On the NISQA dataset and our proprietary RadioCheckSpeech dataset, comparative evaluations against state-of-the-art speech assessment algorithms were performed. The proposed algorithm demonstrated relative performance enhancements, achieving a 6% increase in Pearson correlation coefficient and a 12% reduction in root mean square error (RMSE) on the NISQA dataset, as well as a 12% increase in Pearson correlation coefficient and a 12% reduction in RMSE on the RadioCheckSpeech dataset.
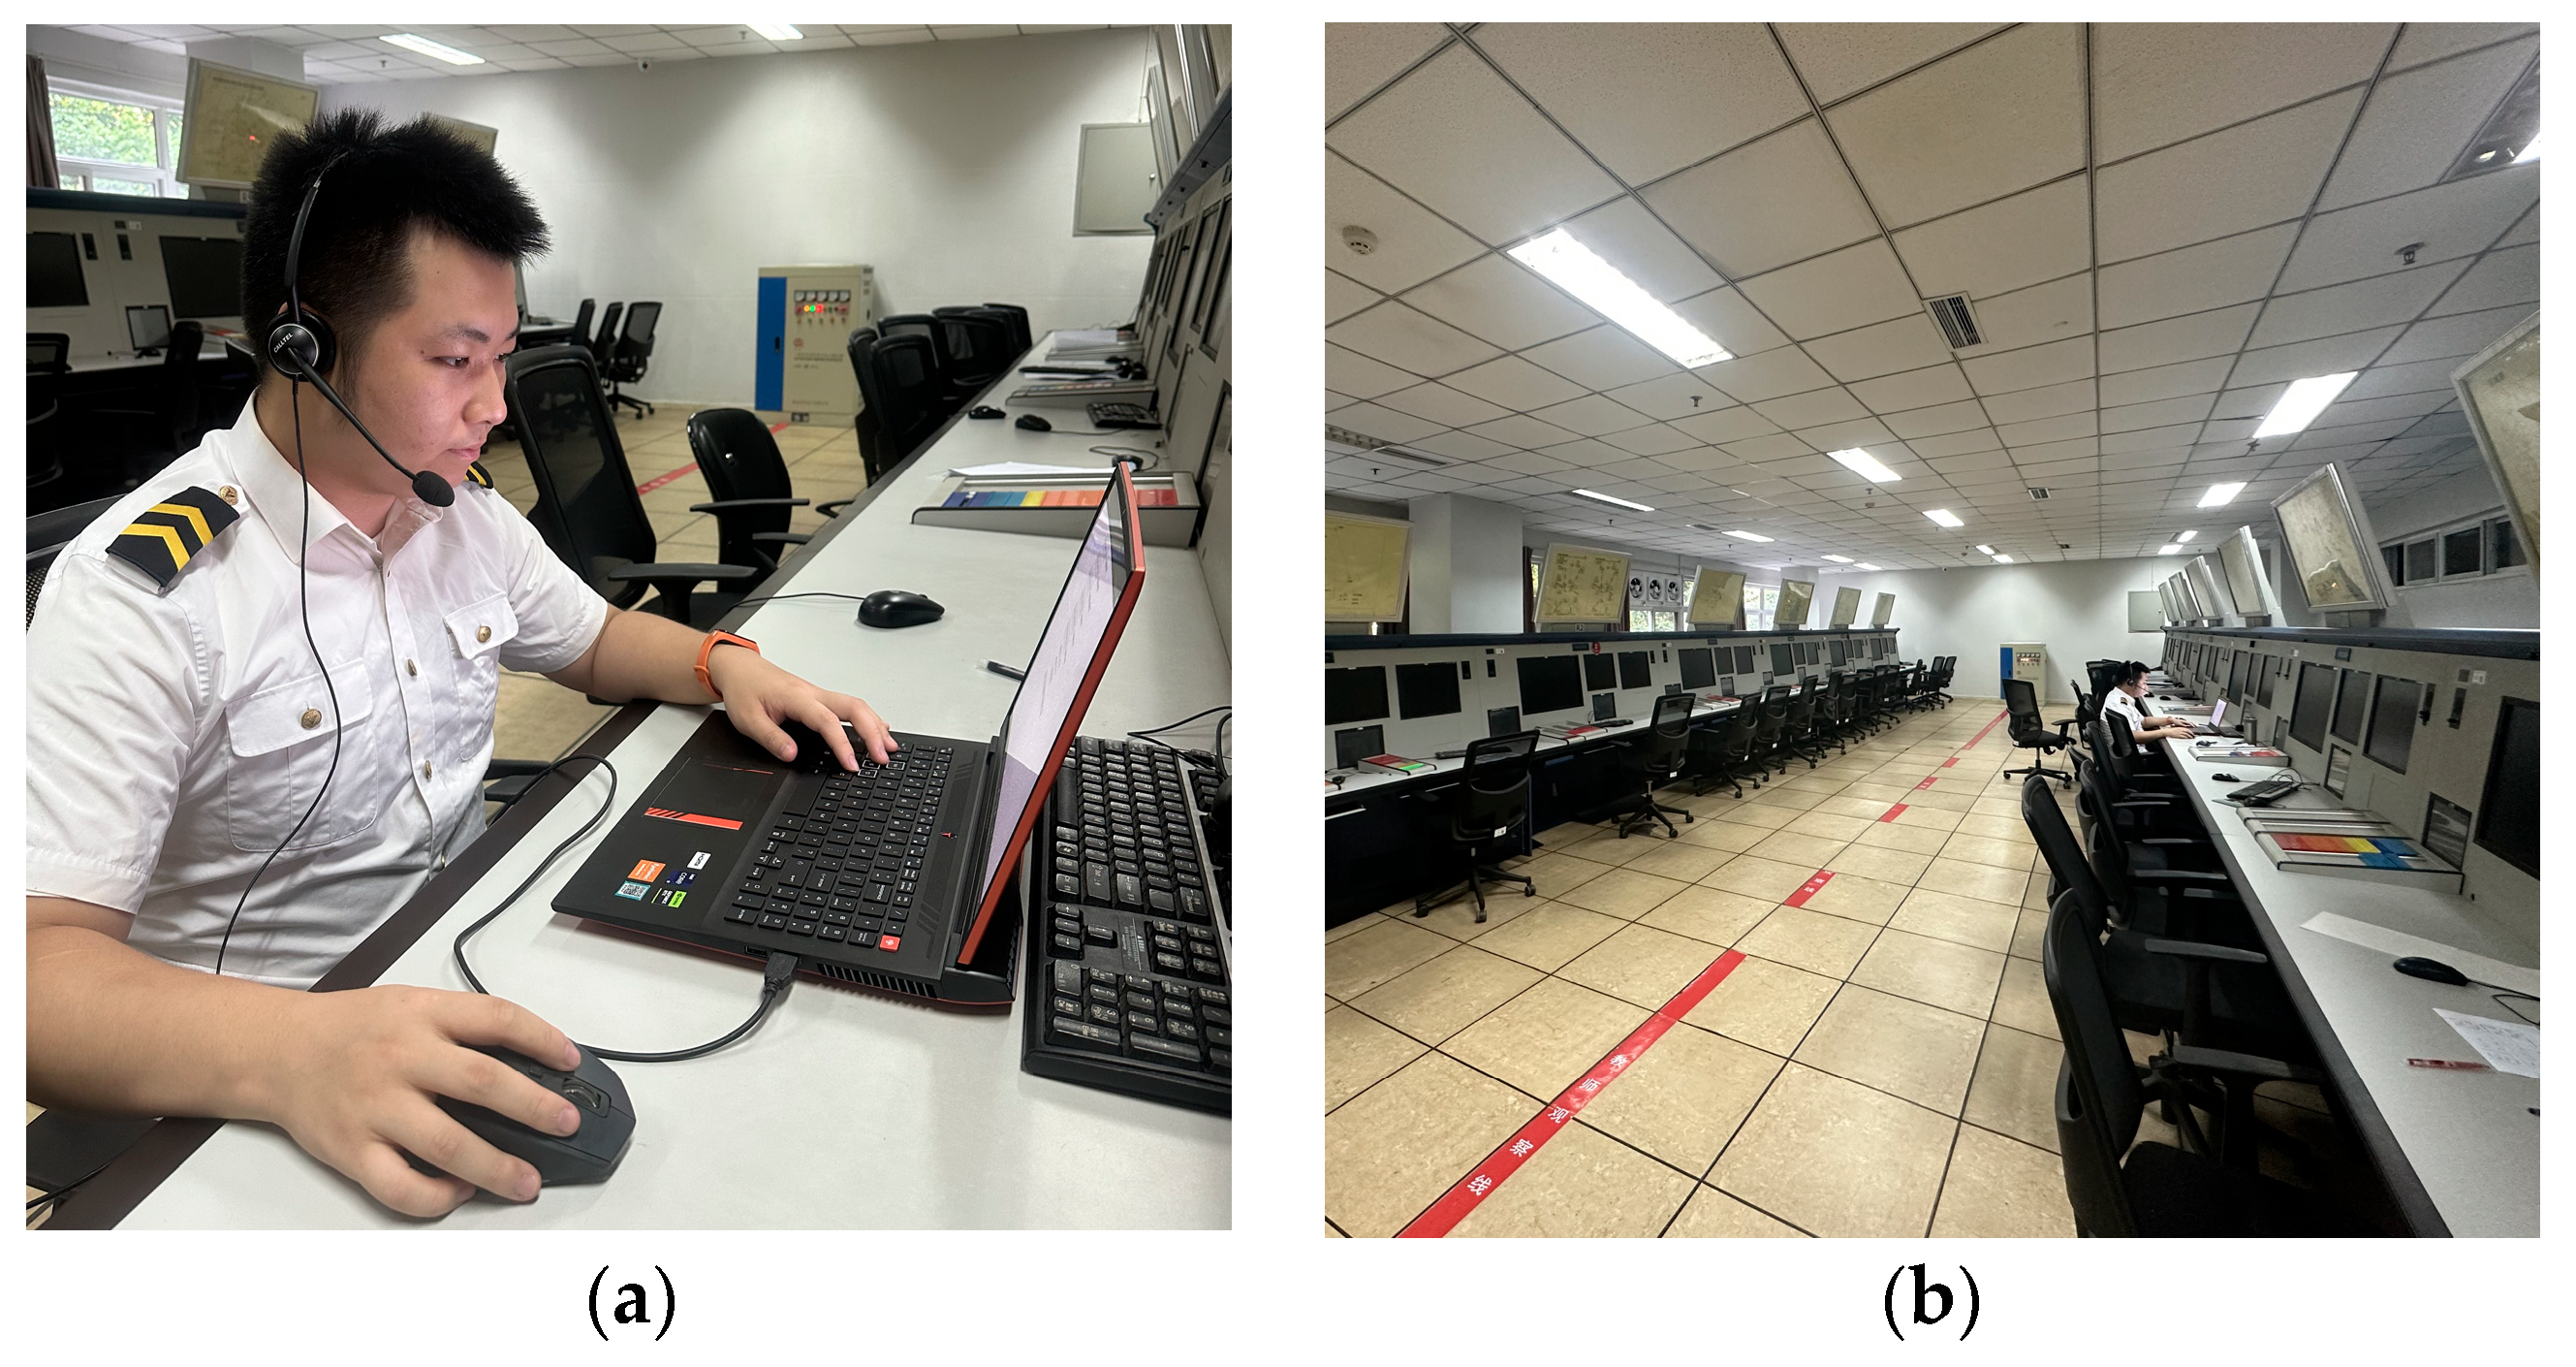
In this study, a dataset titled “RadioCheckSpeech” containing authentic voice commands recorded from internal communication systems at various Chinese airports, control units, and control systems was established. The research employed a method where air traffic controllers assessed these voice commands using the “Radio Check” procedure. Professional controller ratings were collected and manually verified in order to compare mean opinion score (MOS) ratings to radio check scores. Additionally, this dataset was utilized for the network to learn how controllers perform radio check evaluations on speech. The dataset consists of 3200 voice commands spoken in a combination of Chinese and English.
In the second section of the article, the experiments primarily focused on comparing the similarities and differences between MOS ratings and radio check scores. The third section addressed the differences between these two rating methods and introduced the RadioCheckSpeech dataset. The fourth section describes the design of a network named ARCnet, which combines human-engineered and self-supervised features. The fifth section encompassed comparative experiments between ARCnet and other open-source speech quality prediction models on both the NISQA dataset and the RadioCheckSpeech dataset. Additionally, the section included an ablation analysis of ARCnet’s features. Finally, in the sixth section, the article provided a summary of its content.
2. Preliminary Analysis
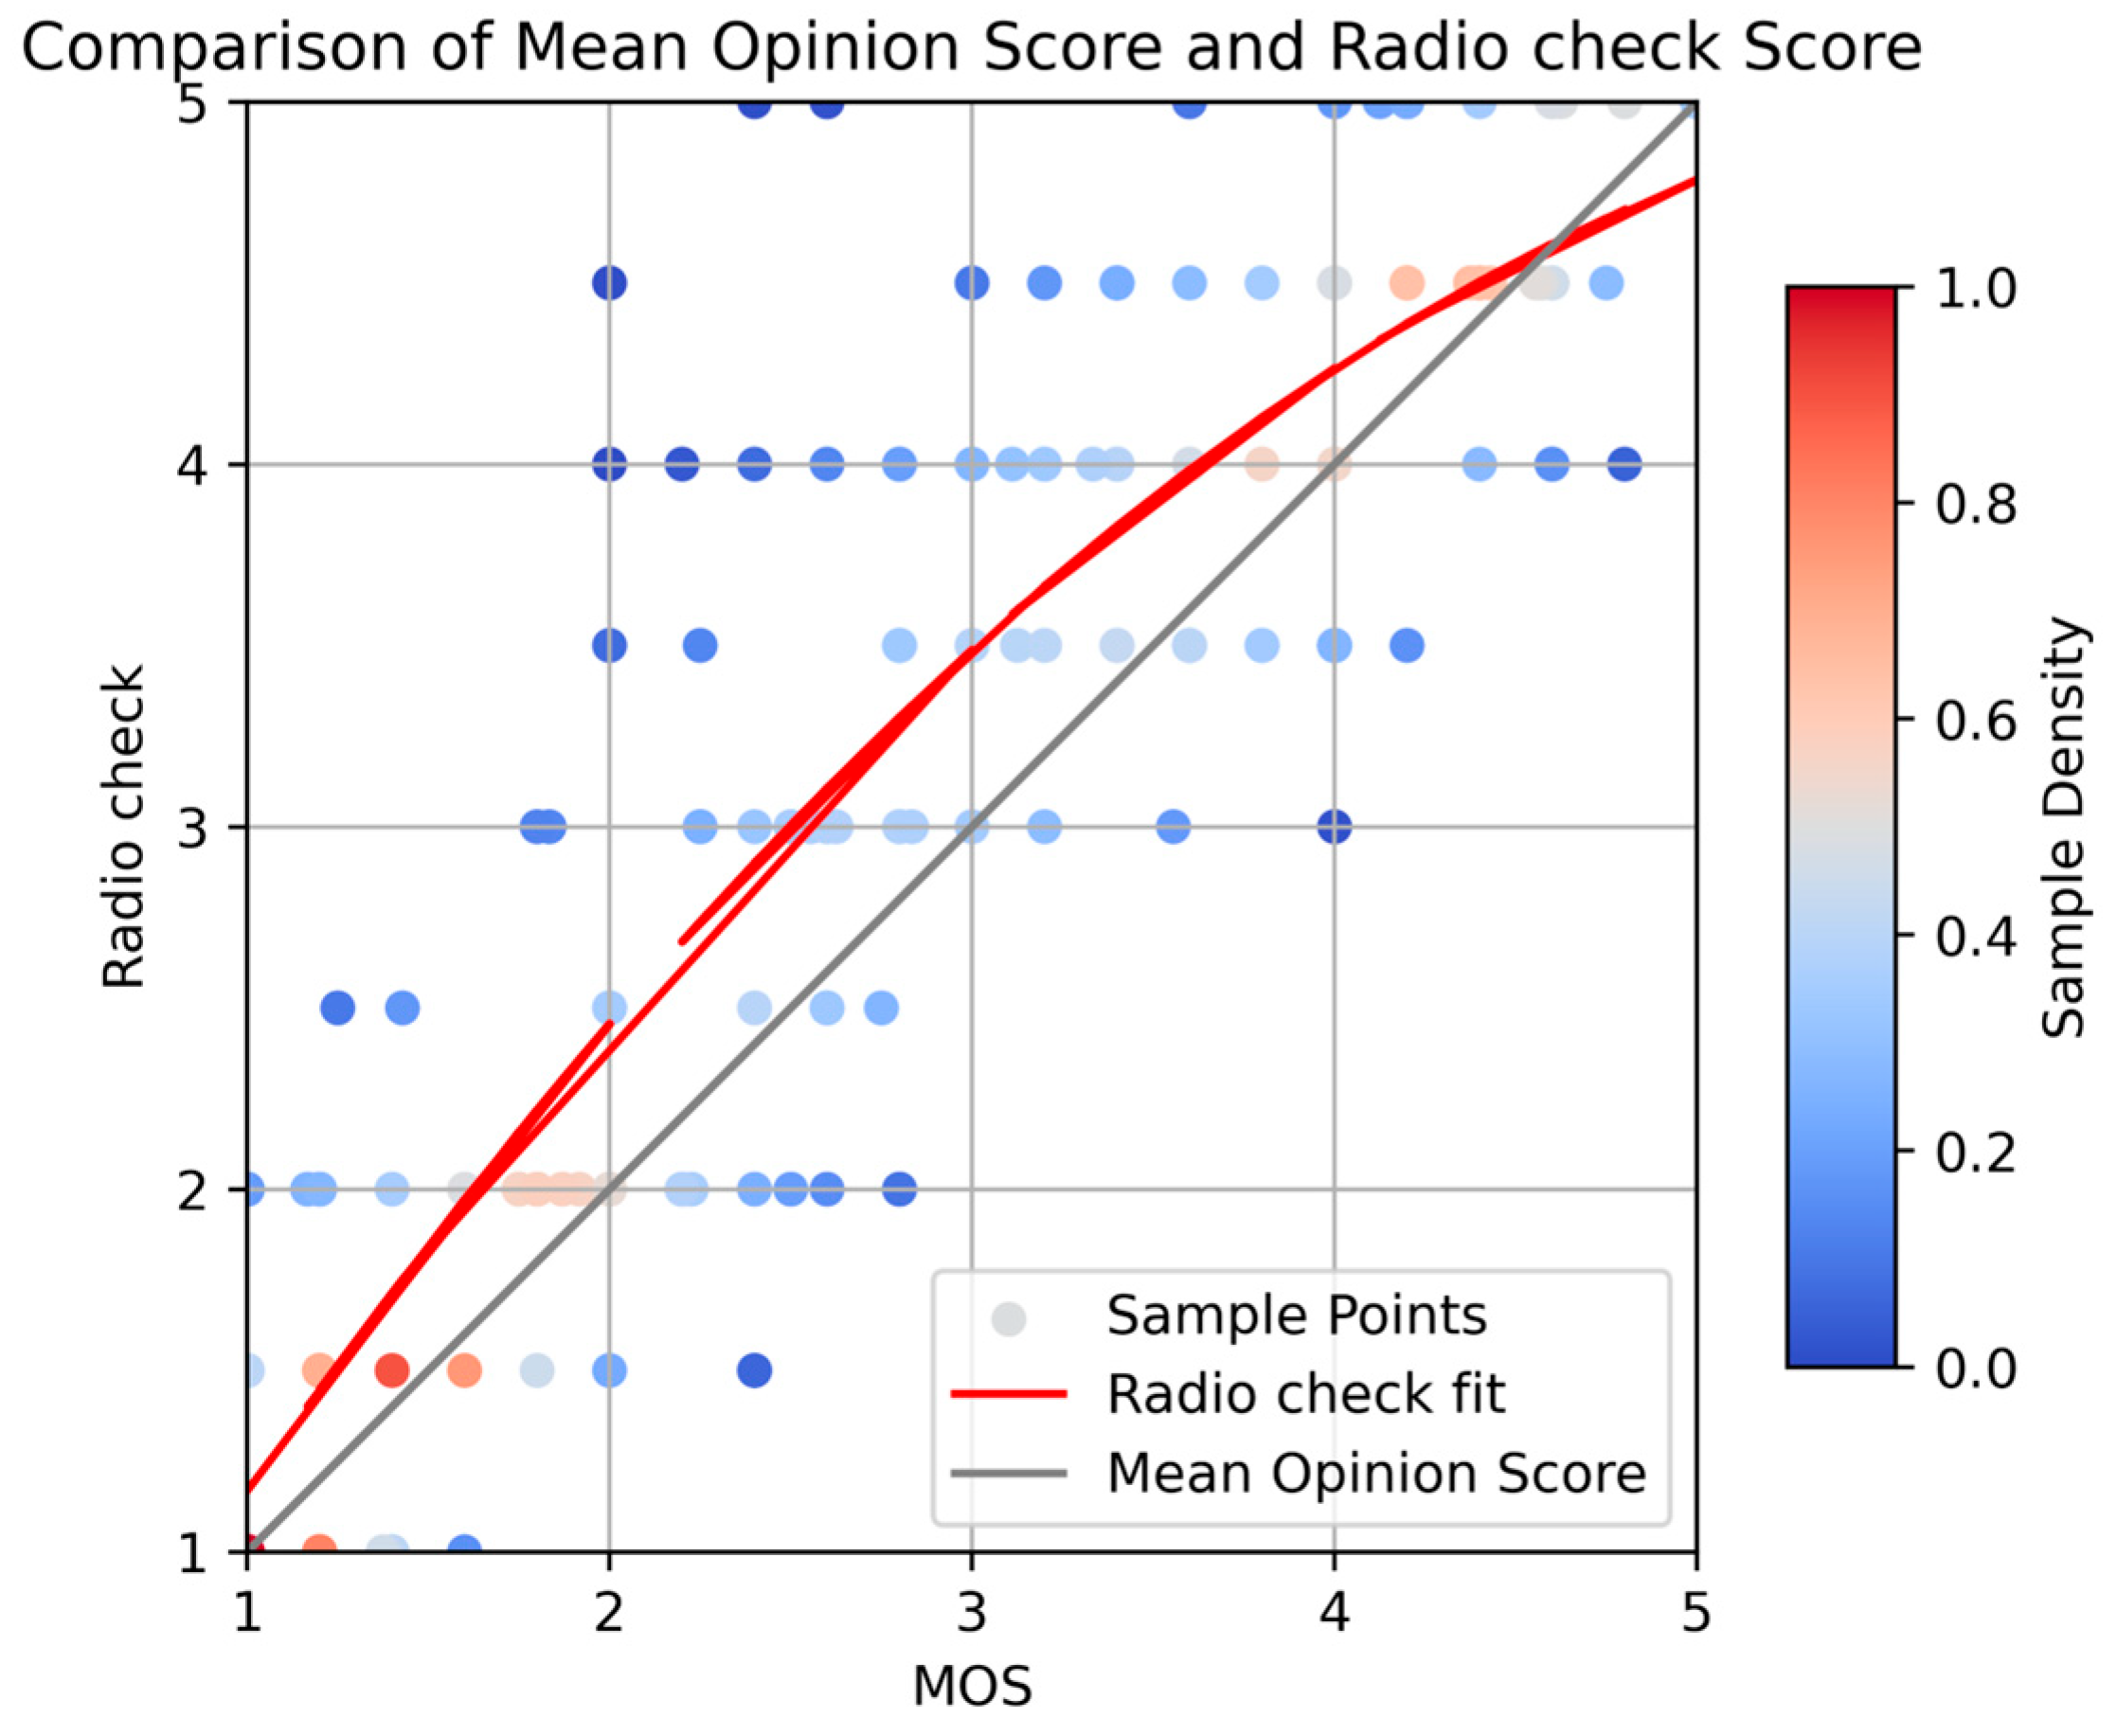
Based on the introduction in the first chapter, it is evident that MOS scores and radio check scores share a remarkable similarity in terms of their scoring methodologies. Given this similarity, the question arises as to whether an algorithm designed to predict MOS scores could also predict radio check scores. Therefore, it is essential to design experiments that confirm the similarity between these two scoring methods. In the experiments, we opted to use a publicly available, pre-labeled dataset from NISQA with MOS scores [
11]. For this dataset, we engaged air traffic controllers to provide radio check scores as well. We divided the dataset into five intervals based on MOS scores between 0 and 5. Within each interval, we randomly selected 40 samples, amounting to a total of 200 samples. According to radio check scoring rules, air traffic controllers then assigned scores to these samples. The resulting scores were fitted with a second-order polynomial, the results of which are depicted in
Figure 2 below:
Observing the results, it is evident that MOS scores and radio check scores share a significant trend similarity. In situations where the speech quality is either poor or excellent, the sample density is higher, and this is represented by the red region of the graph, indicating that the two scoring methods agree closely. However, in certain instances where the speech quality is of moderate levels, there is a noticeable discrepancy between the two methods, represented by the blue region. Moreover, radio check scores are typically higher than average. This divergence could potentially be attributed to the differences in how very-high-frequency (VHF) communication networks and voice over Internet protocol networks handle voice data, as well as the inherent dissimilarities between the radio check scoring method and other scoring approaches. To gain a deeper understanding, we conducted a thorough analysis of a voice sample extracted from authentic radiotelephone communication at Suilin Anju Airport.
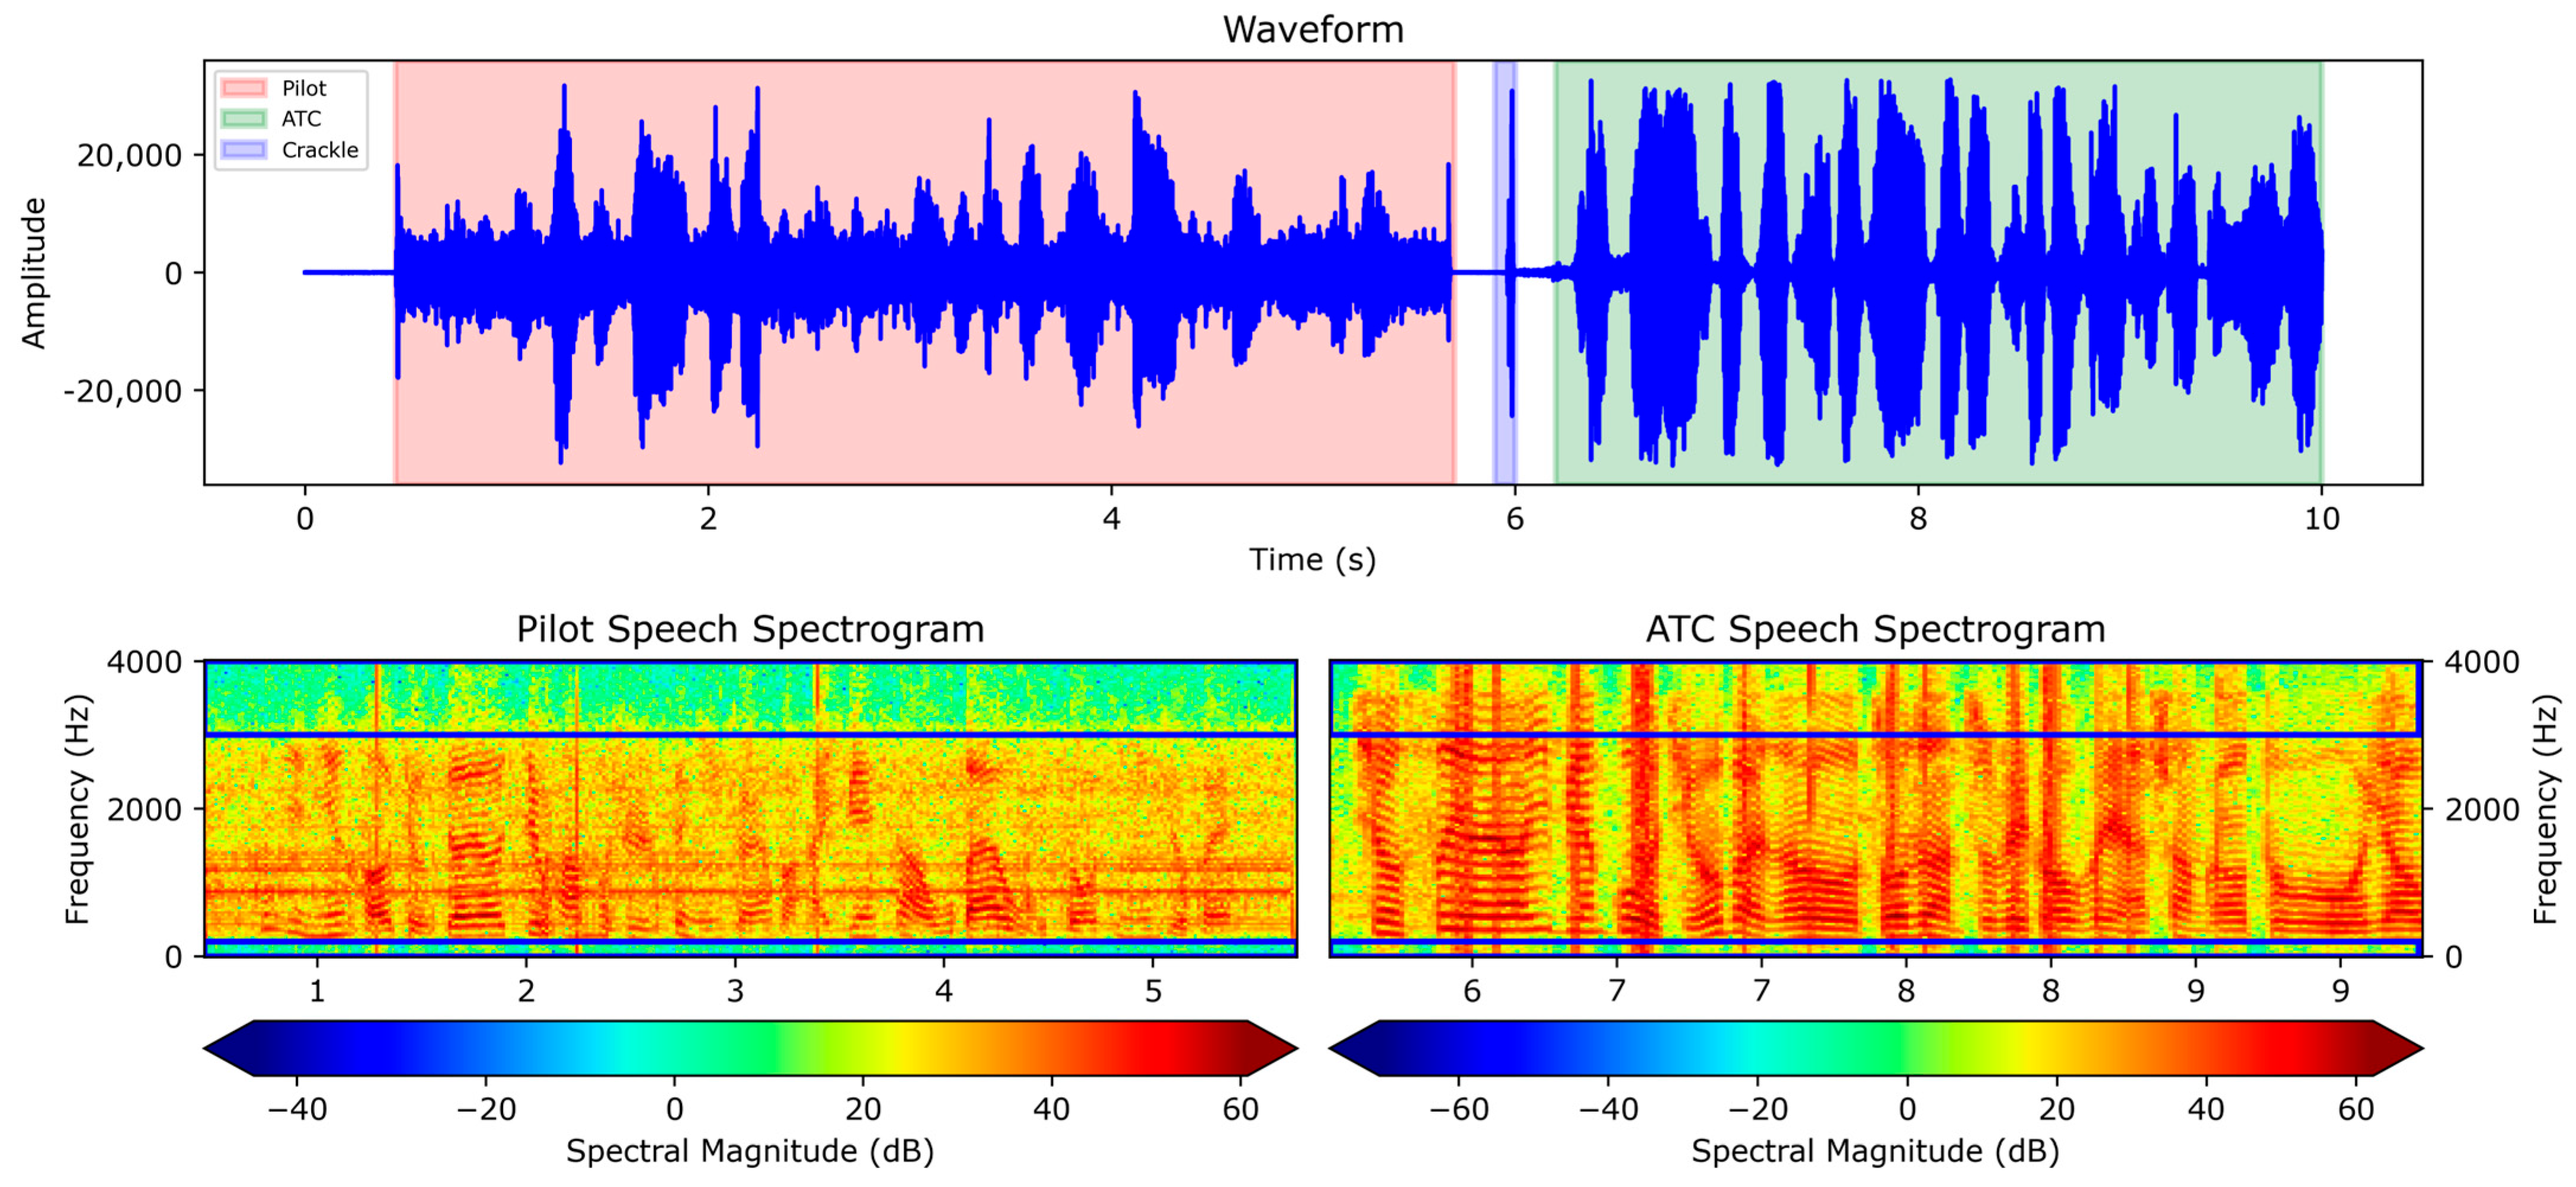
As shown in
Figure 3, the red-bordered section represents the pilot’s voice, whereas the green-bordered section represents the air traffic controller’s voice. Analyzing the waveform and spectrogram, it is evident that in comparison to the clear voice from the air traffic controller’s end, the pilot’s voice contains a low-frequency noise at approximately 1000 Hz. This continuous noise on the pilot’s side causes the voice envelope to become less distinct and challenging to discern. In the spectrogram, the voice of the pilot has been band-pass filtered between 30 Hz and 3000 Hz, resulting in the loss of both high- and low-frequency features. Additionally, the audio waveform from the pilot’s end is relatively weaker, which severely degrades the voice communication quality.
The fundamental reason behind this phenomenon lies in the distinct processing approaches of the very-high-frequency communication system (VHF COMM) used in radiotelephone communication as compared to the processing methods of voice over Internet protocol systems. This divergence diminishes the quality of speech. Therefore, during radio check training, instructors emphasize that the most important aspect of evaluating speech quality is the clarity of command comprehension. If the command is clear and understandable, it is rated a 5. If the command is unclear, it is rated a 4 or 3. However, if the command is difficult to comprehend, it may receive a rating of 2 or 1. Nevertheless, the lack of well-defined standards for scoring between 4 and 3, as well as between 2 and 1, may result in inconsistent evaluations, with air traffic controllers possibly awarding a score of 3 or 4 for the same voice command.
This implies that radio check evaluations not only focus on the influence of noise but also consider the intelligibility of the voice itself. Therefore, for the selection of network features, a multi-feature fusion strategy was utilized, which included the extraction of both human-engineered voice features and self-supervised features. Human-engineered voice features are used to capture noise-related perceptual characteristics affecting speech quality, whereas self-supervised voice features are used to capture features affecting voice intelligibility. This indicates that MOS machine scoring model insights can be applied to radio check scoring research. However, despite the similarities between radio check and MOS scoring methods and outcomes, slight differences still exist. Therefore, in the next section, a dedicated dataset is established for the development of a self-supervised model for radio check scoring.
4. Proposed Framework
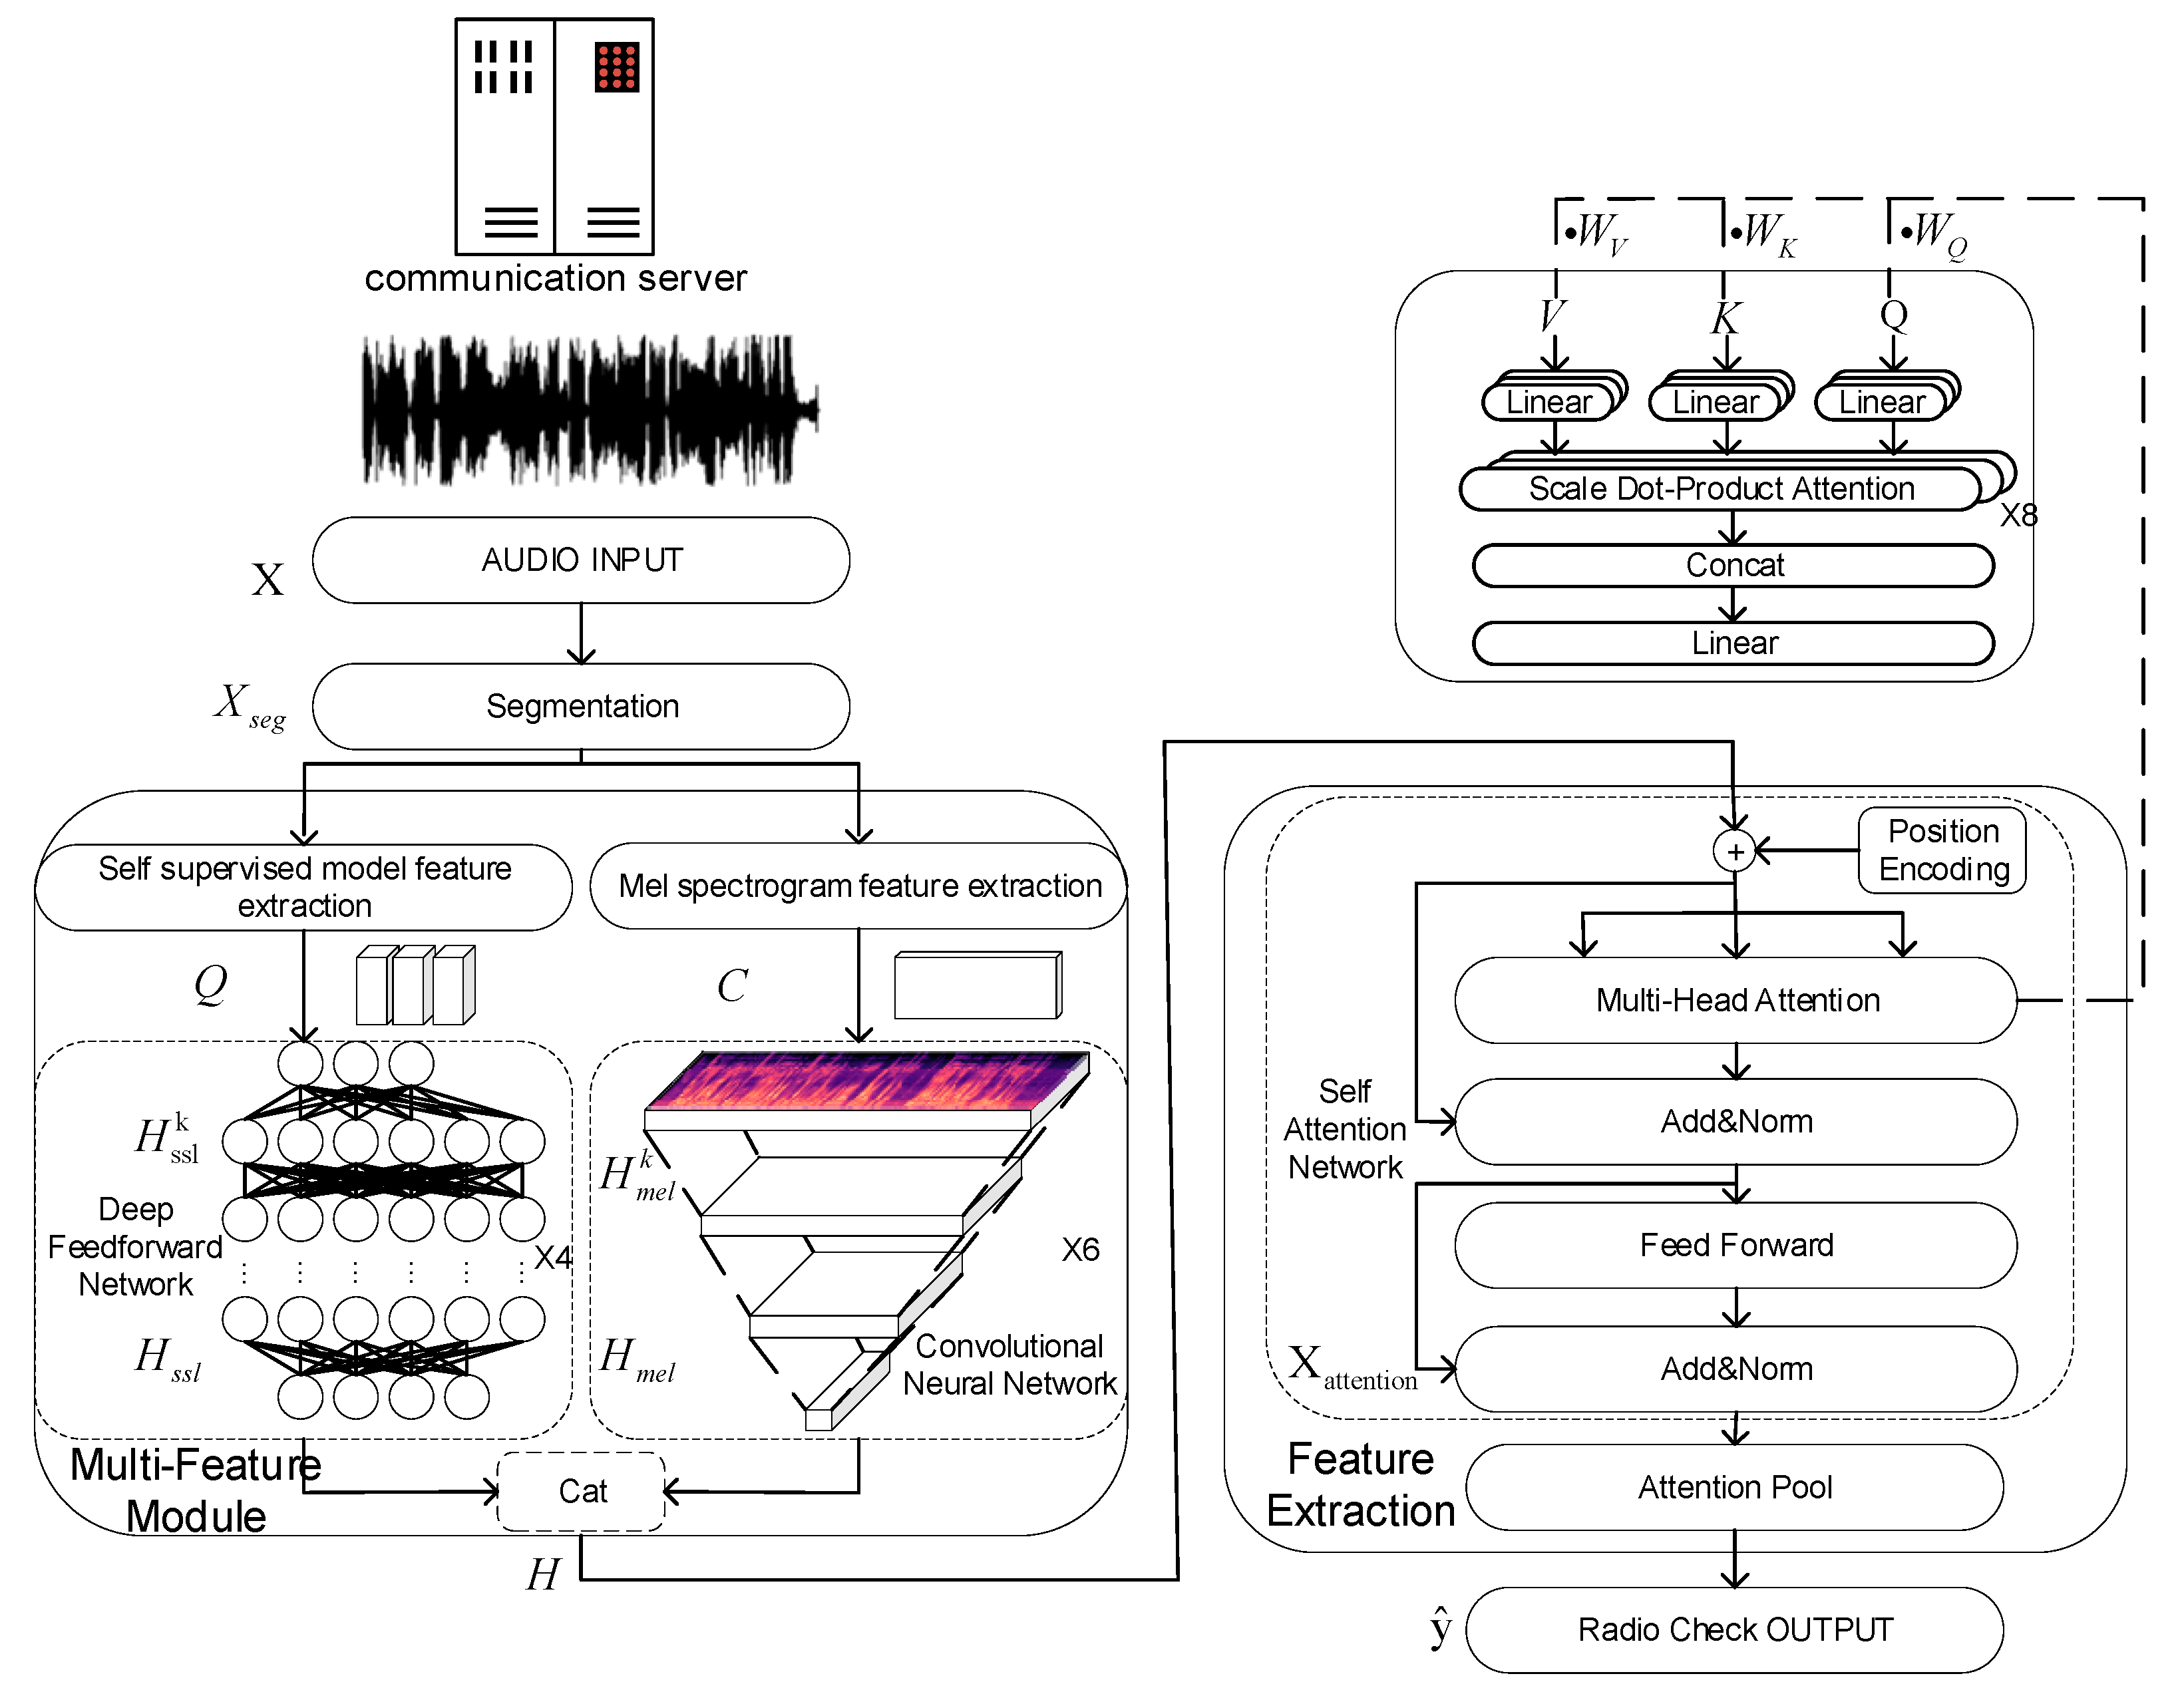
In this study, we present a fusion model that combines self-supervised learning, human-engineered mel spectrogram features, and a transformer-based feature extraction backbone. This has led to the creation of a multi-feature fusion model.
Figure 5 below illustrates the proposed network architecture.
Specifically, the input speech is segmented initially. Each segment of the speech is then passed through the multi-feature module for feature extraction. Self-supervised feature extraction and mel spectrogram feature extraction are involved. The extracted features are concatenated, and then processed using a transformer-based feature extraction model. Finally, the output is the radio check score.
4.1. Feature Interpretability Discussion
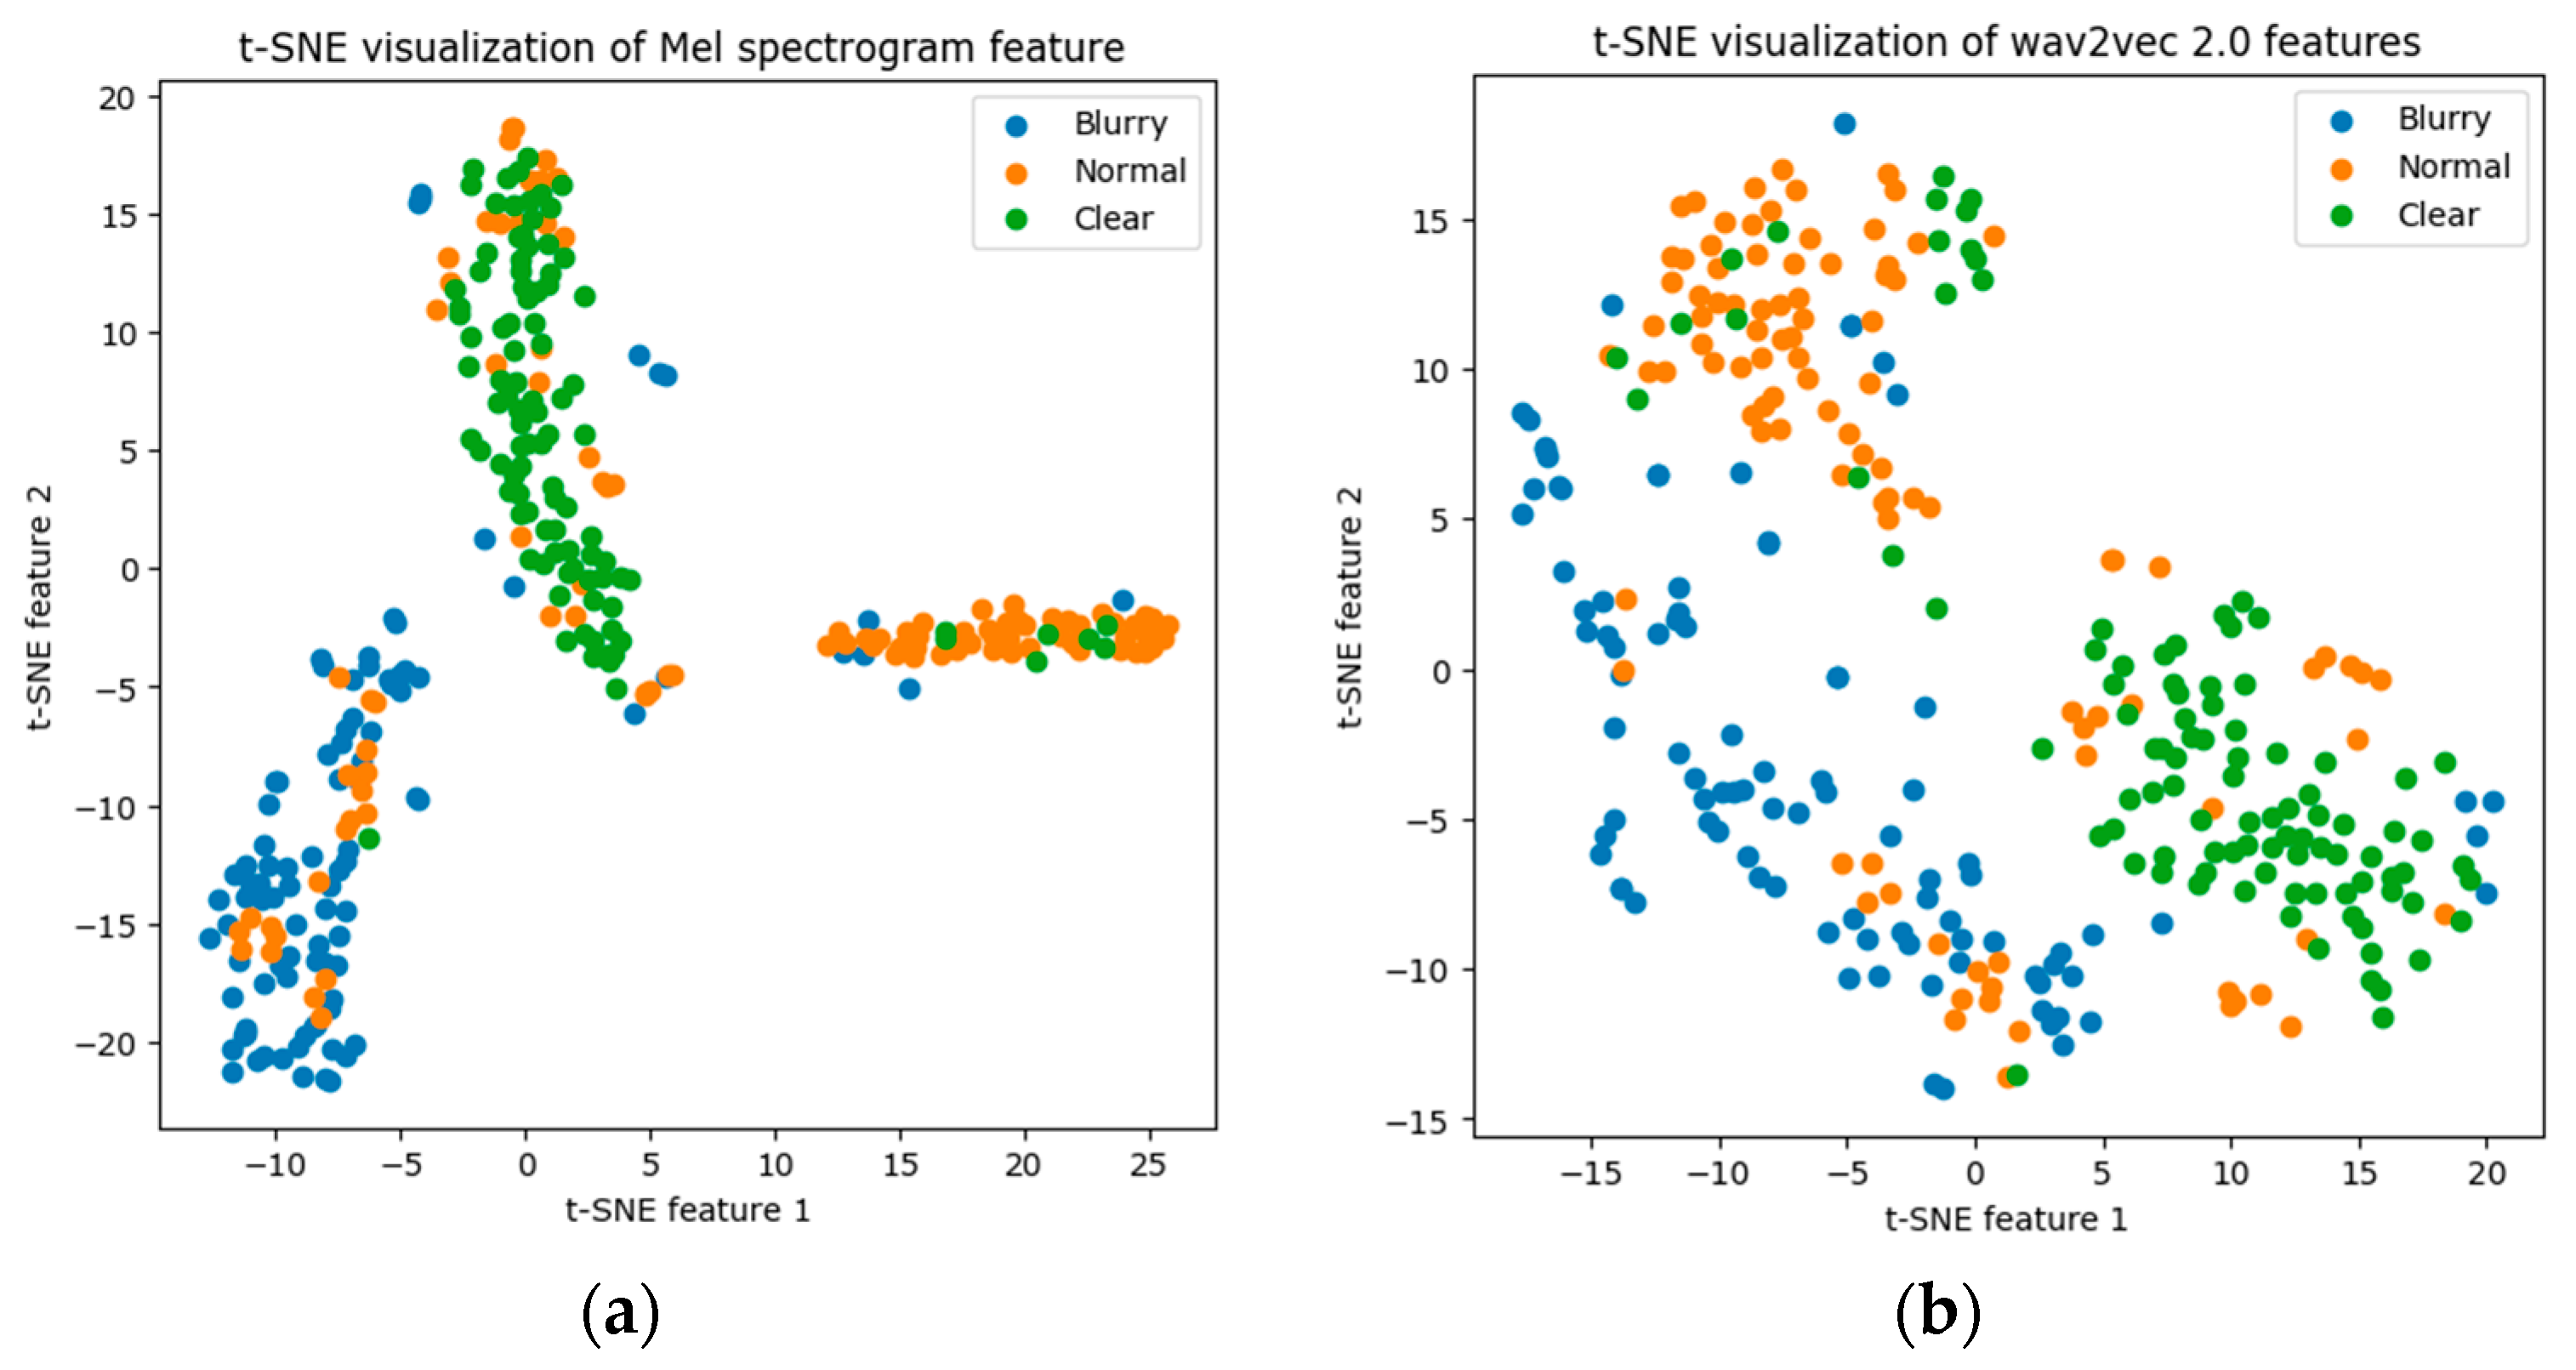
In the design of the ARCnet network, the most crucial step is selecting an appropriate method for encoding audio. The chosen audio encoding features should be as relevant as possible to the target task and possess feature interpretability. As described in the Preliminary Analysis section of the document, to enable the ARCnet network to perceive content related to noise and comprehensibility in speech, the selected encoding features are mel spectrogram features and wav2vec2.0 features. To validate the relationship between these features and speech quality, an experiment was conducted. A batch of audio was played for multiple participants to listen to and rate. The evaluations were based on two dimensions: the clarity of the text in the audio and the level of noise. The rating scale was as follows: 1: Burry, 2: Normal, 3: Clear. After evaluation, 100 audio samples were selected from each rating category according to the same scoring dimension to form a noise perception dataset and a comprehensibility perception dataset. In the noise perception dataset, all audios were encoded using mel spectrogram features, while in the comprehensibility perception dataset, audios were encoded using wav2vec2.0 features. After encoding, the t-SNE (t-distributed stochastic neighbor embedding) method was used to analyze both datasets separately, with the analysis results shown in
Figure 6a,b.
t-SNE is a statistical method used to reduce high-dimensional data to two or three dimensions for easier visualization. It operates by preserving the relative proximity of similar points in the original high-dimensional space, thus reflecting the structural features of high-dimensional data in the reduced lower-dimensional space. t-SNE excels at maintaining the local structure of data points, meaning that points close to each other in a high-dimensional space remain close in a reduced space. Additionally, t-SNE can reveal clustering structures within the data, even without explicitly using clustering algorithms. Since the t-SNE method lacks the learnability of neural networks, it leads to an interpretative dimension reduction in data. Therefore, analyzing encoded speech data with t-SNE provides an intuitive understanding of whether the encoding method can represent the data’s features, verifying the relevance of encoding features to the target task.
As shown in
Figure 6a, after reducing the data from the noise perception dataset encoded with mel spectrogram features to two dimensions using t-SNE, the data naturally clusters into three segments. This indicates that data encoded with mel spectrogram features are significant, and using mel spectrogram features can well represent the characteristic of audio noise. However, the presence of some different types of points in various segments suggests that more complex neural networks should be used for further feature extraction after encoding with mel spectrogram features, as using only mel spectrogram features is not precise enough.
As shown in
Figure 6b, after encoding the comprehensibility perception dataset data with wav2vec2.0 features and reducing it to two dimensions using t-SNE, the data clusters according to evaluation metrics, although it does not cluster into three distinct segments. The enrichment of data under the same labels indicates that wav2vec2.0 features have a strong correlation with speech comprehensibility (ease of understanding spoken words). However, the unclear boundaries between clusters suggest that linear networks should be used to further enhance the features of wav2vec2.0, to achieve better perception.
In summary, mel spectrogram features effectively represent noise but require further refinement through more complex neural networks. wav2vec2.0 features strongly correlate with speech comprehensibility (clarity of spoken words), but still need linear networks to enhance the features. Both noise and speech comprehensibility directly impact the evaluation results of radio checks. Therefore, in the design of ARCnet, mel spectrogram features and wav2vec2.0 features will be used to encode speech.
4.2. Method
In the design of the ARCnet network, the foremost consideration is which voice representation method to use for characterizing speech. The experiment description in the “Preliminary Analysis” section states that during the actual radio check process, evaluators focus more on the impact of noise on speech quality and whether the speech content can be fully transcribed. As shown in
Figure 3 of the “Preliminary Analysis”, the presence of noise in radio communication is mainly indicated by the long solid lines in the spectrogram, as well as some shapes with graphic features. Therefore, using image recognition methods with convolutional neural networks can easily extract the masking features of noise on the original audio, allowing the model to understand the impact of noise on audio through neural network learning. Secondly, the ability to fully transcribe the textual content boils down to a speech recognition task. In speech recognition tasks, researchers have developed a novel feature, self-supervised learning features, to project speech into a higher-dimensional textual domain, enabling the neural network to recognize speech as text. When a segment of speech is clear, a hyperplane can be used to separate the speech projected in the textual domain. Conversely, if the speech is noisy and indistinguishable, the corresponding hyperplane is twisted and complex. To allow the network to perceive whether the textual content in speech can be fully transcribed, a linear network processes the projected vectors. The linear network can be understood as a trainable hyperplane, and ultimately, the recognizability of text in speech can be determined by observing the output of the hyperplane.
The network operates as follows: Initially, the audio is segmented, and a Self-supervised feature model is employed to obtain features indicative of the speech’s textual domain comprehensibility confidence. Commonly utilized in upstream speech recognition tasks, the Self-supervised feature model maps audio into vectors that neural networks can understand, thus facilitating the translation from the audio domain to the textual domain. Additionally, this model can output a comprehensibility confidence interval for the current audio, indicating whether the audio segment can be accurately transcribed. Through the mapping by the Self-supervised feature network, features related to the speech’s textual domain comprehensibility confidence are obtained. Although this process yields a vector feature of speech’s textual comprehensibility, these features are initially coarse. A deep feedforward network is then used to refine these features, producing a more defined confidence feature regarding the segment’s textual comprehensibility. Similarly, mel spectrogram features are used to obtain the audio segment’s frequency domain vectors. To capture features of noise in the frequency domain that affect audio quality, the network employs a convolutional neural network for noise feature extraction. Pre-trained convolutional layers are sensitive to discontinuities (commonly caused by communication interference), long solid lines (typically resulting from noise), and unnatural envelopes in the spectrogram (often due to distortion caused by VHF COMM amplifying and filtering the signal under poor communication conditions), enabling the network to understand noise in the audio. By concatenating the textual confidence vector feature with the noise vector, a comprehensive feature vector for the individual speech segment is created.
For variable-length audio inputs, extracting the overall audio quality from the temporal domain requires more than merely averaging the vectors of segments. Simple averaging does not effectively utilize the temporal information of the audio. Therefore, a transformer-based feature extraction module is utilized to extract audio quality in the temporal domain. The pre-trained feature extraction network not only focuses on the composite feature vectors of segments performing exceptionally well or poorly but also scores based on the overall quality of the speech signal globally, leveraging the audio’s temporal data. After processing all audio segments of the test audio, an attention pool is used to pool all feature vectors, yielding the final radio check score.
4.3. Multi-Feature Module
4.3.1. Self-Supervised Model Feature Extraction
In 2020, Meta introduced the unsupervised speech pre-training model Wav2vec 2.0 [
22]. Its core idea involves constructing a self-supervised training objective through vector quantization (VQ) and training by applying contrastive loss on heavily masked inputs. Wav2vec 2.0 significantly improved the performance of downstream speech tasks such as Automatic Speech Recognition (ASR), Text-to-Speech (TTS), and Voice Conversion (VC) through self-supervised learning on extensive amounts of unannotated speech data (such as Libri-light). Other research has demonstrated the robustness of the Wav2vec 2.0 model in speech quality prediction tasks. Therefore, the Wav2vec 2.0 base model was chosen for initial feature extraction [
23,
24]. For ablation studies, we also experimented with fine-tuned pre-trained models based on Chinese datasets and English datasets [
25,
26]. However, using these fine-tuned models resulted in a less accurate fit of the entire network to the data. We utilized the Wav2vec 2.0 model without pre-training to address this issue. Assuming the input speech signal consists of
samples, denoted as
, following the methodology in [
22], the input speech signal is segmented with a stride of
, at this time, the audio can be defined as Equation (1):
After segmenting and encoding each segment, we denote the encoding as
and the resulting encoded output as
, defined as Equations (2) and (3).
where
represents the number of segments after segmentation, and
represents the dimensionality of the audio mapped through wav2vec 2.0 for each segment.
After this, the generated features will enter a four-layer deep feedforward network for feature transformation. The workflow can be defined as Equations (4) and (5). Assume the transformed vector is denoted as
, and
represents which layer of the linear transformation it has passed through.
where
represents batch normalization,
denotes the linear layer, and
stands for rectified linear unit. In the subsequent ablation experiments, it will be demonstrated that this four-layer linear transformation contributes to improving the network’s performance.
4.3.2. Mel Spectrogram Feature Extraction
It is common practice to transform audio into a spectrogram in order to better comprehend its frequency distribution when working with audio. the mel spectrogram is a specialized type of spectrogram that uses mel filters to map spectral data to a frequency scale that is more compatible with human auditory perception. This transformation helps us accurately capture variations in tone and timbre in the audio, as human perception of frequency is nonlinear. Therefore, this feature can effectively reflect the perception of noise in the radiotelephone communication by the air traffic controller. Moreover, studies such as [
13] have demonstrated that mel spectrograms are robust in predicting speech quality.
Similarly, here, we assume that the input audio signal consists of
sample points, denoted as
. Following the computation process for mel spectrograms, the signal is segmented with a step size of
as follows at this time, the audio can be defined as Equation (6):
For each segment, a discrete Fourier transform (DFT) is performed, followed by mel filtering using a set of
mel filters. The result is subjected to a logarithmic transformation to obtain the mel spectrogram
defined as Equations (7) and (8).
In the mel filtering process, the center frequency of each filter is denoted as . represents the gain of the -th mel filter at the -th frequency point, determining the energy contribution of that frequency point on the mel frequency scale.
After this, the generated features enter a six-layer convolutional neural network (CNN) for feature transformation, The workflow can be defined as Equations (9) and (10), where
represents the transformed vector and
indicates the layer number that has passed through the convolutional layer.
where
represents batch normalization,
stands for a two-dimensional convolutional layer, and
represents the rectified linear unit activation function. Subsequent ablation experiments will demonstrate that this six-layer convolutional structure facilitates the model’s convergence.
Mel spectrogram features and self-supervised features are aligned in the time dimension because they are segmented into the same time steps. After being flattened, the two vectors are concatenated along the time dimension as shown in Equations (11) and (12):
4.4. Feature Extraction
A temporal network is modeled using the transformer architecture introduced in [
27] to process the multi-feature fusion vectors generated in the previous step. Due to its capacity to capture global contextual information and parallelization capabilities [
28,
29,
30,
31], the transformer model is widely employed in the natural language processing and computer vision domains. Therefore, we employ the transformer model as one of the modules for extracting temporal information from the network.
Firstly, the input sequence of the given data is embedded into a -dimensional vector space. Next, position encoders are utilized to keep track of the sequence’s order and relative positions of each component. These positional encodings are concatenated with the original vectors of dimension and fed into the encoder. Two major components make up the encoder: the multi-head attention (MHA) mechanism and the feedforward layer.
The MHA mechanism consists of multiple scaled dot-product attention units. Given a sequence vector, attention units calculate contextual information about specific tokens and combine them with weighted combinations of similar tokens. During training, the attention units learn three weight matrices: the key weight matrix
, the value weight matrix
, and the query weight matrix
. Finally, attention representations for all tokens are obtained. The workflow can be defined as Equations (13) and (14).
where
represents the transpose of matrix
, while
denotes the dimensionality of vector features, introduced to stabilize the gradient. The
function is applied for weight normalization. During computation, the weights are dot-multiplied with the attention vectors of each head, and the result is aggregated through a layer consisting of a linear transformation activated by the
function. The workflow can be defined as shown in Equation (15).
Here, represents the attention mechanism generated by the -th head, while denotes the concatenation operation.
In experiments conducted by researchers such as [
13,
24,
32], attention pooling has been shown to be effective. Therefore, we employ attention pooling at the final stage of the network to generate comprehensive quality for each segment. By averaging these values, we obtain the ultimate prediction for speech quality. The workflow can be defined as follows:
where
represents the
speech segments generated in the first step, and
signifies the linear weights of the attention pool.
refers to the masking function that conceals vectors greater than
. Assuming the input variable is
, the specific procedure is as follows (17):


