Article

Research on Solving the Structural Instability of Composite Propellants by Using Non-Ablative Cladding Layers

1
National Key Laboratory of Solid Rocket Propulsion, Northwestern Polytechnical University, Xi’an 710072, China
2
Hubei Institude of Aerospace Chemotechnology, Xiangyang 441003, China
*
Author to whom correspondence should be addressed.
Aerospace 2024, 11(4), 326; https://doi.org/10.3390/aerospace11040326
Submission received: 5 March 2024 / Revised: 14 April 2024 / Accepted: 16 April 2024 / Published: 22 April 2024

Abstract

:
In a high-temperature test of the gas generator with a free-loading composite propellant, an abnormal jitter appeared in the latter part of the internal ballistic curve, whereas no such abnormality was observed in the low-temperature and normal-temperature tests. To investigate the cause, quasi-steady-state simulations of the internal flow field, as well as strength and buckling simulations of the grain, were conducted. The strength simulation revealed that the maximum stress experienced by the composite propellant during operation at 323 K is 0.7 MPa, which is lower than the ultimate stress of the grain (1.01 MPa), indicating no stress failure. The buckling simulation demonstrated that the instability arises from an imbalance of pressure on the inner and outer surfaces of the grain. In the original structure, the ventilation effect on each surface of the grain varied with the regression of the burning surface, leading to a pressure imbalance on the inner and outer surfaces of the composite propellant. Consequently, a non-ablative cladding layer was applied to ensure that the ventilation effect of each channel remains constant. The simulation demonstrated that the pressure on the surfaces of the composite propellant gradually balanced with the operation of the gas generator. Upon retesting at high temperatures, no abnormal jitter was observed in the internal ballistic curve. This indicates that maintaining a constant ventilation area for the combustion chamber and preventing changes in the ventilation effect can ensure the structural integrity of the composite propellant during operation. The working state of the composite propellant with this non-ablative cladding layer is not affected by variations in the design of the solid rocket motor. This approach enhances the adaptability and reliability of the free-loading composite propellant under different motor structures.

1. Introduction

Composite solid propellant is a type of viscoelastic energetic material composed of binder, oxidant, plasticizer, metal fuel, and functional additives. It possesses good energy, excellent interior ballistic properties, outstanding mechanical characteristics, and a long service life [1,2]. Its modulus is smaller than that of double-base propellant and modified double-base propellant. Liu et al. [3] conducted a study on the aluminum agglomeration in the combustion process of aluminized composite propellants using experimental and numerical methods. Zhang et al. [4] investigated the prediction of the structural integrity of nitrate ester-plasticized polyether propellant (NEPE) under asymmetric tension and compression. Wu et al. [5] observed that the tensile and compressive modulus of composite propellant decrease with increasing ambient temperature. Currently, research on the structural integrity of composite propellants primarily focuses on the curing and cooling process [6] and the ignition process [7,8]. Degirmenci and Ercan et al. [9] conducted a thermomechanical analysis of the combustion of double-base propellants in the barrel. There are few studies on the structural integrity of free-loading composite propellants. Deng et al. [10] examined the structural integrity of free-loading propellants in solid rocket motors under low temperatures. Zheng et al. [11] explored the fragmentation phenomenon of free-loading propellants with a large aspect ratio during high-temperature working processes.
In the process of developing and producing solid rocket motors, it is necessary to conduct numerous tests to assess the actual performance, structural integrity, and operational reliability of the motors. These tests are essential for obtaining the internal ballistic curve of the motor and determining whether it functions normally and meets the predetermined tactical and technical indicators. Currently, there is extensive research on the ignition pressure peak during the ignition stage. Zhang et al. [12] investigated the impact of multiple tubular grains on the initial pressure peak of solid rocket motors. Liu et al. [13] examined the effect of varying quantities of ignition powder on the ignition pressure peak. Guan et al. [14] explored the influence of erosion combustion on the ignition pressure under lateral overload conditions.
The reasons for the abnormal pressure peak in the ignition stage can be summarized as follows. (1) The flow coefficient of the ignition motor is too large. (2) The opening pressure of the nozzle cover is too high. (3) Impulse damage to the grain at the moment of ignition. (4) Erosion combustion. (5) The structure of the propellant, tail, and nozzle of the motor creates a non-fluent flow field area. (6) There are internal quality defects in the grain. (7) The nozzle throat is blocked by a foreign body.
Research on the abnormal internal ballistic curve in the middle and late stages of the motor working process mainly focuses on unstable combustion. Chen et al. [15] investigated the unstable combustion of solid rocket motors with a large aspect ratio. Gao et al. [16] examined the influence of flight overload on the unstable combustion of solid rocket motors. Hu et al. [17] analyzed the unstable combustion of solid rocket motors with wing-column grain. Numerous studies have shown that unstable combustion is usually accompanied by noticeable abnormal curve oscillations.
The internal ballistic curve of the gas generator was normal in the low-temperature test and the normal temperature test, while pressure fluctuations occurred in the later stages of the high-temperature test. Preliminary analysis suggests that the structural integrity of the composite propellant was compromised due to a decrease in its modulus at high temperatures. The pressure fluctuations observed during the high-temperature test differ significantly from the violent pressure shock phenomenon associated with unstable combustion. Therefore, we should explore other factors contributing to the structural integrity damage of the composite propellant. During the high-temperature test of the gas generator, quasi-steady-state simulations of the internal flow field, strength simulations of the grain, and buckling simulations of the grain were conducted. Strength simulations were used to assess whether the composite propellant experienced damage due to stress, while buckling simulations were employed to identify potential instability failures. These methods are commonly utilized in the analysis of instability failures in concrete structures [18] and metal structures [19]. After identifying the causes of structural integrity damage to the composite propellant, improvement schemes were proposed, followed by simulation and experimental verification of the proposed improvements. The findings can serve as a reference for the design and verification of gas generators or motors utilizing free-loading composite propellant grains, thereby enhancing the adaptability and reliability of such propellants across different motor structures.

2. Description of Abnormal Phenomena in Interior Ballistic Curves

The range of the operating temperature for modern solid rocket motors is extensive. Based on practical considerations, it is necessary for the temperature range to be maintained from at least 233 K to 323 K. Consequently, the performance requirements for the propellant grain are very stringent. In comparison to double-base propellant and modified double-base propellant, composite propellant exhibits higher energy and density but has a lower modulus. Additionally, as the temperature rises, the modulus of the composite propellant decreases further, leading to specific challenges in maintaining the structural integrity of the composite propellant.
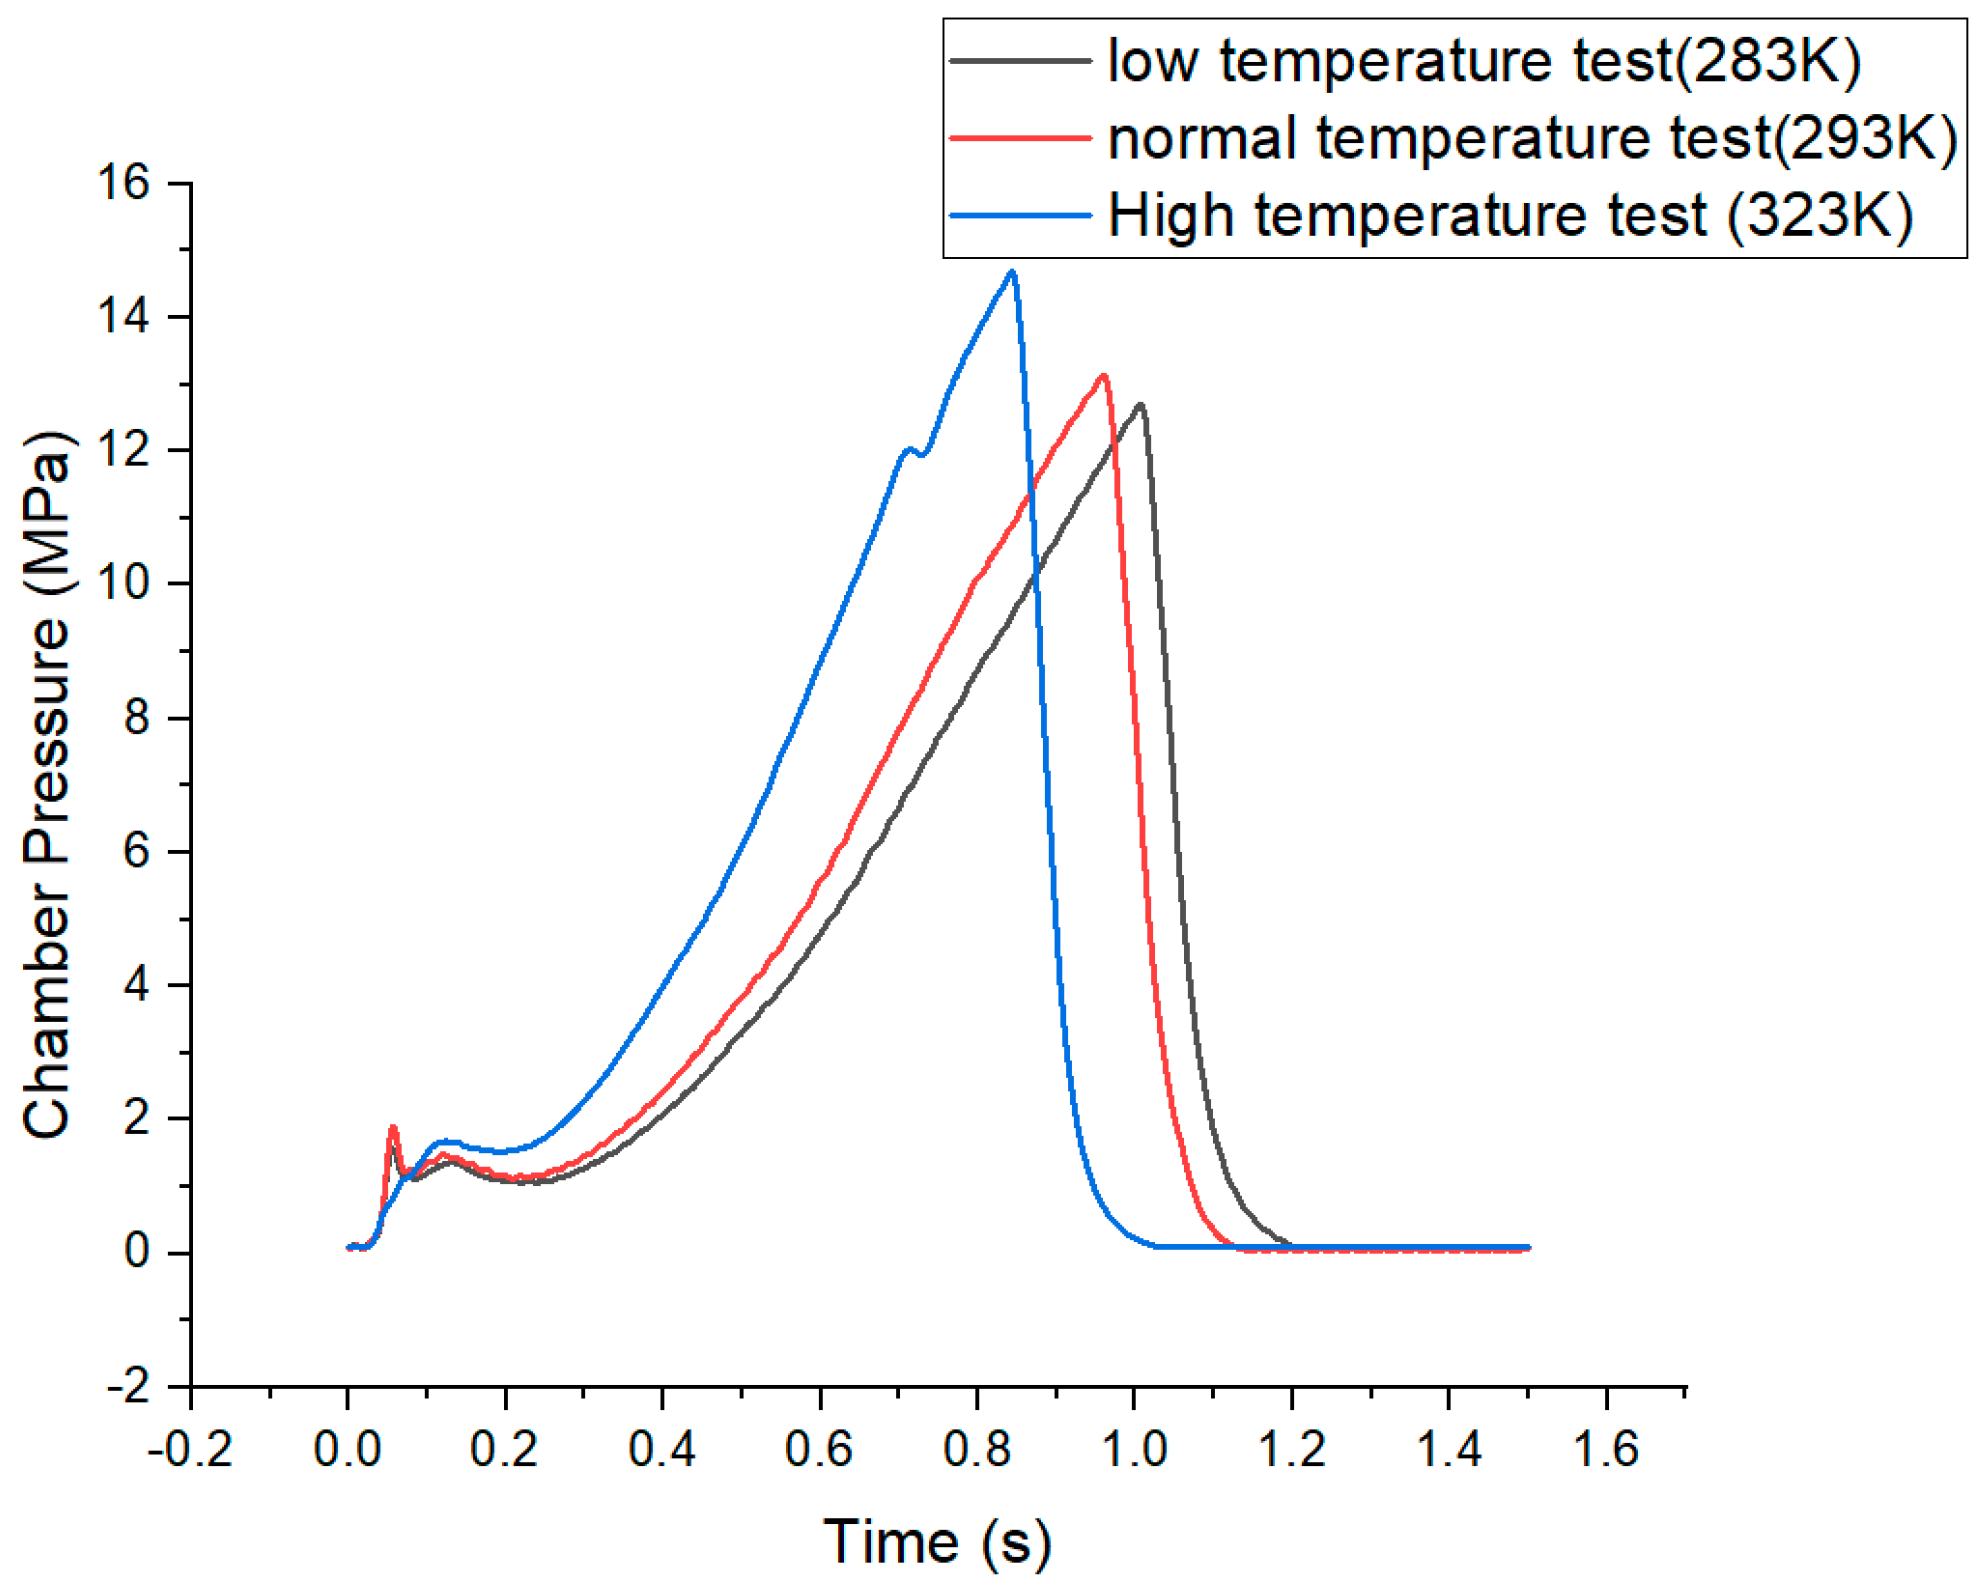
Low-temperature tests (283 K), normal temperature tests (293 K), and high-temperature tests (323 K) were conducted for the designed gas generator. The design of the gas generator is illustrated in Figure 1, while the pressure curves are depicted in Figure 2.
It can be observed that the internal ballistic curves of the low-temperature test and the normal-temperature test are normal. However, during the high-temperature test, pressure fluctuations occur in the later stages of the operating process, specifically when the combustion chamber pressure reaches 12 MPa. The abnormal interior ballistic curve is attributed to the elevated temperature, primarily impacting the physical and chemical properties of the propellant grain. The high temperature exacerbates the reduction in the modulus of the composite propellant, necessitating an investigation into the structural integrity damage of the composite propellant within a high-temperature environment during operation.

3. Simulation Analysis of the Flow Field

To address the abnormal phenomenon observed in the interior ballistic curve during the high-temperature test, quasi-steady state simulations of the flow field were conducted at various regression times of the combustion surface within the combustion chamber. This allowed for the analysis of the flow field within the combustion chamber and the assessment of pressure distribution on the surface of the grain at different time intervals.

3.1. Physical Model

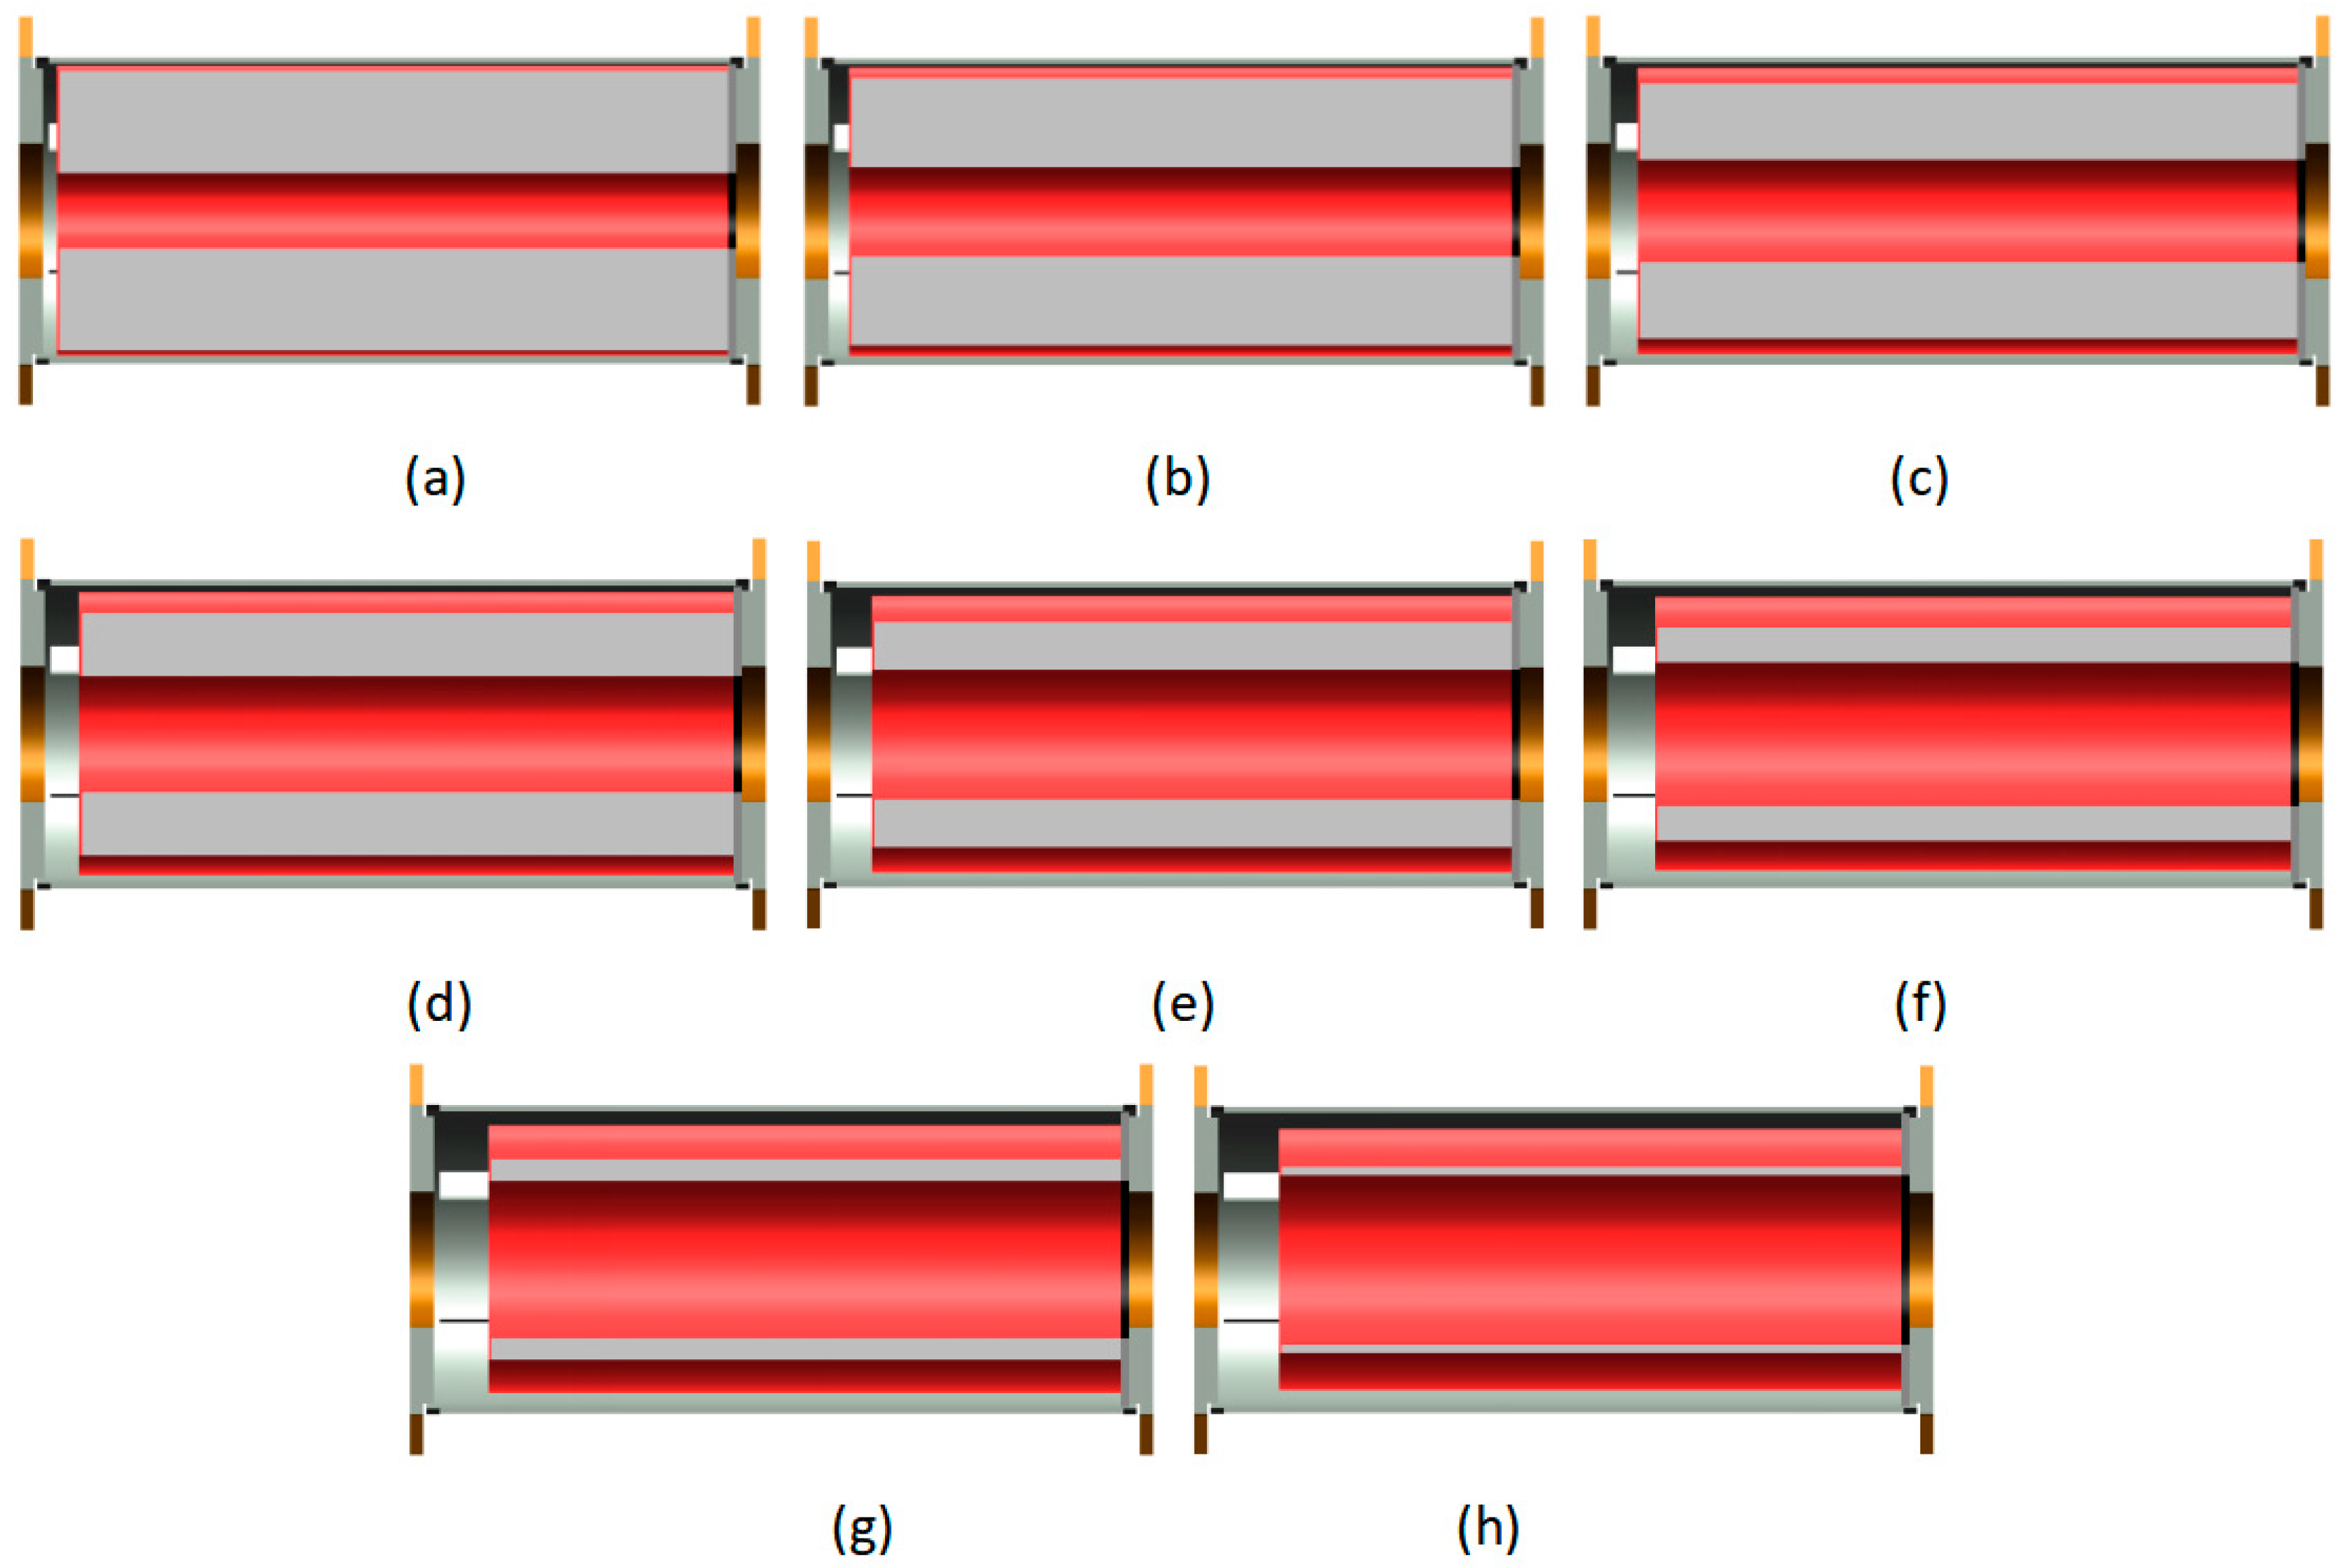
The grain of the gas generator is composed of a gear-shaped composite propellant with six teeth on the exterior. The three-dimensional diagram of the composite propellant is depicted in Figure 3. During the motor’s operation, the initial burning surface of the grain encompasses the inner hole surface, the front end surface, and the outer tooth surfaces. The tail end surface of the composite propellant is coated with an ablative cladding layer. It is assumed that the grain uniformly regresses and the three-dimensional diagrams of the grain at various regression times of burning surfaces are displayed in Figure 4. As the burning surfaces regress, the diameter of the inner hole of the ablative cladding layer also increases. The internal fluid domain of the motor is extracted at different time intervals for quasi-steady-state simulation. Due to the significant computational resources required for quasi-steady-state simulation, the fluid domain of the gas generator is modeled as a 1/2 model.

3.2. Mathematical Models

Based on the actual operational conditions of the solid rocket motor and the characteristics of the internal flow field, the following assumptions are made:
(a)
The regression of the combustion surface adheres to the parallel layer theory, ensuring uniform regression distance for each combustion surface;
(b)
The mixed gas resulting from combustion behaves as an ideal compressible gas. The specific heat capacity at constant pressure remains constant and does not vary with temperature;
(c)
The effects of erosion combustion are disregarded;
(d)
The results obtained from the quasi-steady-state simulation of the flow field at different regression stages of the burning surface represent the actual flow field within the combustion chamber at those respective times.
This study uses three-dimensional simulation, so the N-S equation in the form of weak conservation in the three-dimensional coordinate system [20] is selected, which is based on the state equation, mass conservation equation, momentum conservation equation, and energy conservation equation.
State equation:
P = ρ R T
Mass conservation equation:
ρ t + ( ρ u ) x + ( ρ v ) y + ( ρ w ) z = 0
The momentum conservation equation in the x direction:
ρ u t + ρ u u x + ρ u v y + ρ u w z + P x = 1 R e τ x x x + τ x y y + τ x z z
The momentum conservation equation in the y direction:
ρ v t + ( ρ v u ) x + ( ρ v v ) y + ( ρ v w ) z + P y = 1 R e ( τ x y x + τ y y y + τ y z z )
The momentum conservation equation in the z direction:
ρ w t + ( ρ u w ) x + ( ρ w v ) y + ( ρ w w ) z + P z = 1 R e ( τ x z x + τ y z y + τ z z z )
Energy equation:
( ρ e ) t + ( ρ u e ) x + ( ρ v e ) y + ( ρ w e ) z + ( ρ u ) x + ( ρ v ) y + ( ρ w ) z = 1 R e ( τ x x u + τ x y v + τ x z w + q x ) x + 1 R e ( τ x y u + τ y y v + τ y z w + q y ) y + 1 R e ( τ x z u + τ y z v + τ z z w + q z ) z
In the above equations, e = R T γ 1 + 1 2 ( u 2 + v 2 + w 2 ) , τ x x = 2 3 μ ( · v ) + 2 μ u x , τ y y = 2 3 μ ( · v ) + 2 μ v y , τ z z = 2 3 μ ( · v ) + 2 μ w z , τ x y = μ ( v x + u y ) , τ x z = μ ( w x + u z ) , τ y z = μ ( v z + w y ) , q x = K T x , q y = K T y , q z = K T z , and · v = u x + v y + w z .
In these formulas, u, v, and w are the velocity components in x, y, and z directions, respectively. ρ is gas density; T is the gas temperature; P is gas pressure; μ is the gas dynamic viscosity coefficient; K is the gas thermal conductivity; γ is the specific heat ratio; Re is the Reynolds number; and R is the gas constant.
The turbulence model employed is the k-ωSST two-equation turbulence model. During the operation of the solid rocket motor, highly complex turbulence phenomena occur within the gas flow inside the combustion chamber. Therefore, selecting the appropriate turbulence simulation method and model is crucial for simulating turbulent flow under various conditions. The k-ω SST two-equation turbulence model, widely used in engineering, accounts for the influence of turbulent shear stress transport processes. This makes the model suitable for both low Reynolds number effects and areas of turbulence far from the wall. Consequently, the k-ω SST two-equation turbulence model is utilized in this simulation. Introduced by Menter F R [21] in 1993, the k-ω SST two-equation turbulence model, also known as the shear stress transport k-ω model, is a hybrid model. It incorporates a transverse dissipation derivative term absent in the standard k-ω model, thus accounting for turbulent shear stress transport in defining turbulent viscosity.
The transport equation of the k-ωSST two-equation turbulence model is as follows:
t ( ρ k ) + x i ( ρ k u i ) = x j [ ( μ + σ k μ t ) k x j ] + P k β * ρ ω k
t ( ρ ω ) + x i ( ρ ω u i ) = x j [ ( μ + σ ω μ t ) ω x j ] + γ v t P k β ρ ω 2 + 2 ( 1 F t )   ρ σ ω 2 ω · k x j · w x j
In the formula, μ is molecular viscosity; β * , σ k , γ, β, σ ω , and σ ω 2 are constant coefficients; and the right side of Equation (7) is the diffusion term, the turbulent kinetic energy generation term Pk, and the dissipation term. The last item of Equation (8) is the cross-diffusion term.
The SST k-ω model is calculated by mixing the k-ω turbulence model and the k-ε turbulence model. The coefficients of the inner k-ω turbulence model are σ k 1 = 0.85 , σ ω 1 = 0.5 , β 1 = 0.075 , β * = 0.09 , a n d   γ 1 = 0.5532 . The outer k-ε turbulence model is transformed into the form of k-ω turbulence model and the coefficients of the transformed turbulence model are taken as σ k 2 = 1.0 , σ w 2 = 0.856 , β 2 = 0.0828 , β * = 0.09 , a n d   γ 2 = 0.44 , respectively.
The eddy viscosity coefficient of SST k-ω turbulence model is expressed as
μ t = a 1 k m a x ( a 1 ω , Ω F 2 )
In the formula, a1 is the Bradshaw constant, take 0.31; Ω is the absolute value of vorticity, Ω = | × V | ( V is the velocity vector of flow); and F2 is the switching function. In the SST k-ω turbulence model, for wall turbulence, F2 = 1, and for free shear turbulence, F2 = 0.
The expression of the switching function F2 is
F 2 = t a n h ( a r g 2 2 )
a r g 2 = m a x ( 2 k 0.09 ω y , 500 y ρ y 2 ω )
Meanwhile, the wall surface adopts the standard wall function. All the burning surfaces of the composite propellant of the solid rocket motor are ignited, with the input of mass source term, momentum source term, and energy source term.

3.3. Composite Propellant Parameters and Boundary Conditions

The parameters of the composite propellant and the gas are in Table 1.
The simulation boundary conditions are as follows.
(A)
The 0.5 mm thin layer of the fluid domain on the burning surface of the propellant is designated as the source term. The combustion of the propellant is simulated based on its properties and the properties of the gas. The burning surface can input the gas with corresponding mass, momentum, and energy;
(B)
The simulation only considers the fluid domain, with its walls being adiabatic. Energy exchange with the propellant and shell is not accounted for;
(C)
The outlet is set as the pressure-outlet with a pressure of 101,325 Pa and an ambient temperature of 323 K. In the supersonic calculation of the ideal gas, outlet properties will be calculated using the difference method;
(D)
Considering the symmetry of the model, the model section is set as the symmetric boundary.

3.4. Grid Independence Verification

Because the structure of the gas generator is irregular, we employ the unstructured grid generation method to analyze grid independence by using different grid sizes. When the residuals tend to stabilize, we consider the calculation results accurate and then we extract the calculation results for analysis. Table 2 grid independence verification displays the pressure calculated by the numerical simulation under different grid settings.
According to Table 2 grid independence verification, as the grid size increases, the deviation in the calculation also increases. To balance calculation accuracy and efficiency, we opted for a grid size of 2.5 mm.

3.5. Validation Study on the Model

We set the ambient temperature to 283 K, 293 K, and 300 K, respectively, to simulate the low, normal, and high-temperature experiments. The combustion chamber pressure when the grain thickness is only 1 mm is calculated by simulation and compared with the experimental pressure to verify the accuracy of our model. The comparison between the experimental pressure and the pressure calculated by simulation is shown in Table 3.
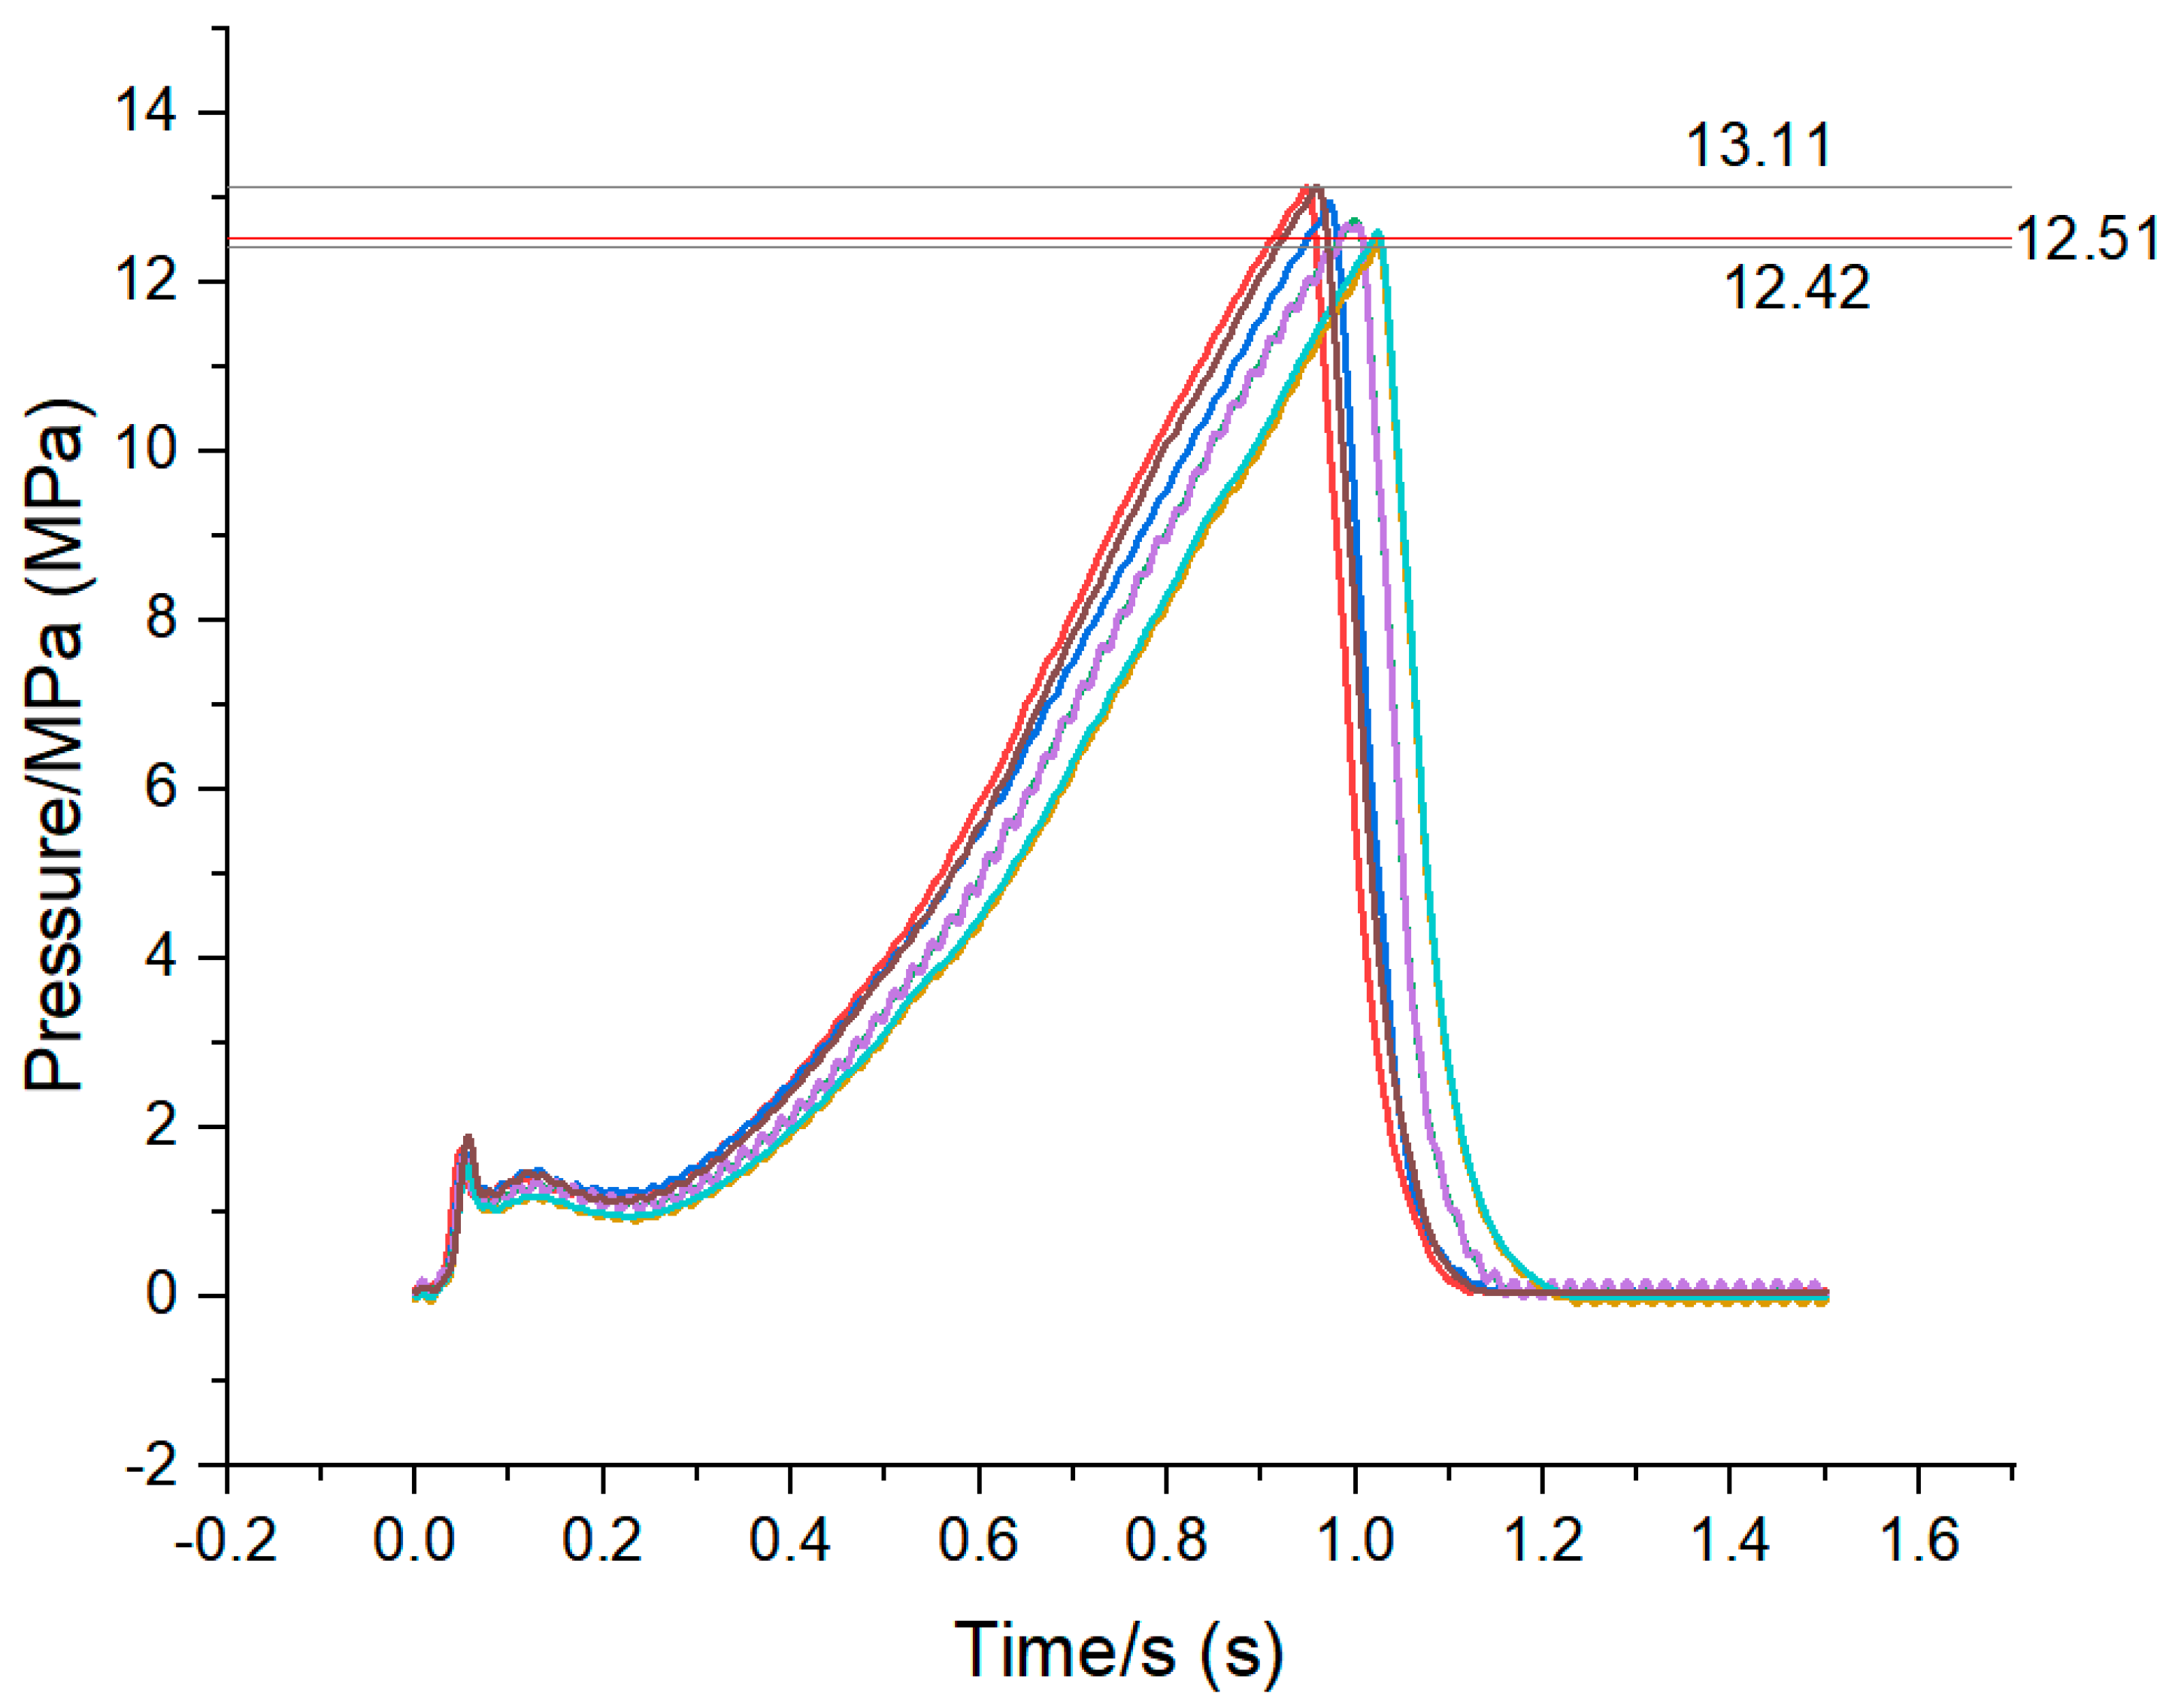
According to Table 3, the error between simulation and experiment is less than 10%, proving the accuracy and effectiveness of our model. Additionally, we conducted numerous experiments at normal temperatures. The experimental pressure curves are depicted in Figure 5, indicating that the maximum pressure in the combustion chamber at normal temperature ranges from 12.42 MPa to 13.11 MPa. Our simulation results fall within this range, further validating the accuracy of our model.

3.6. Analysis of Simulation Results

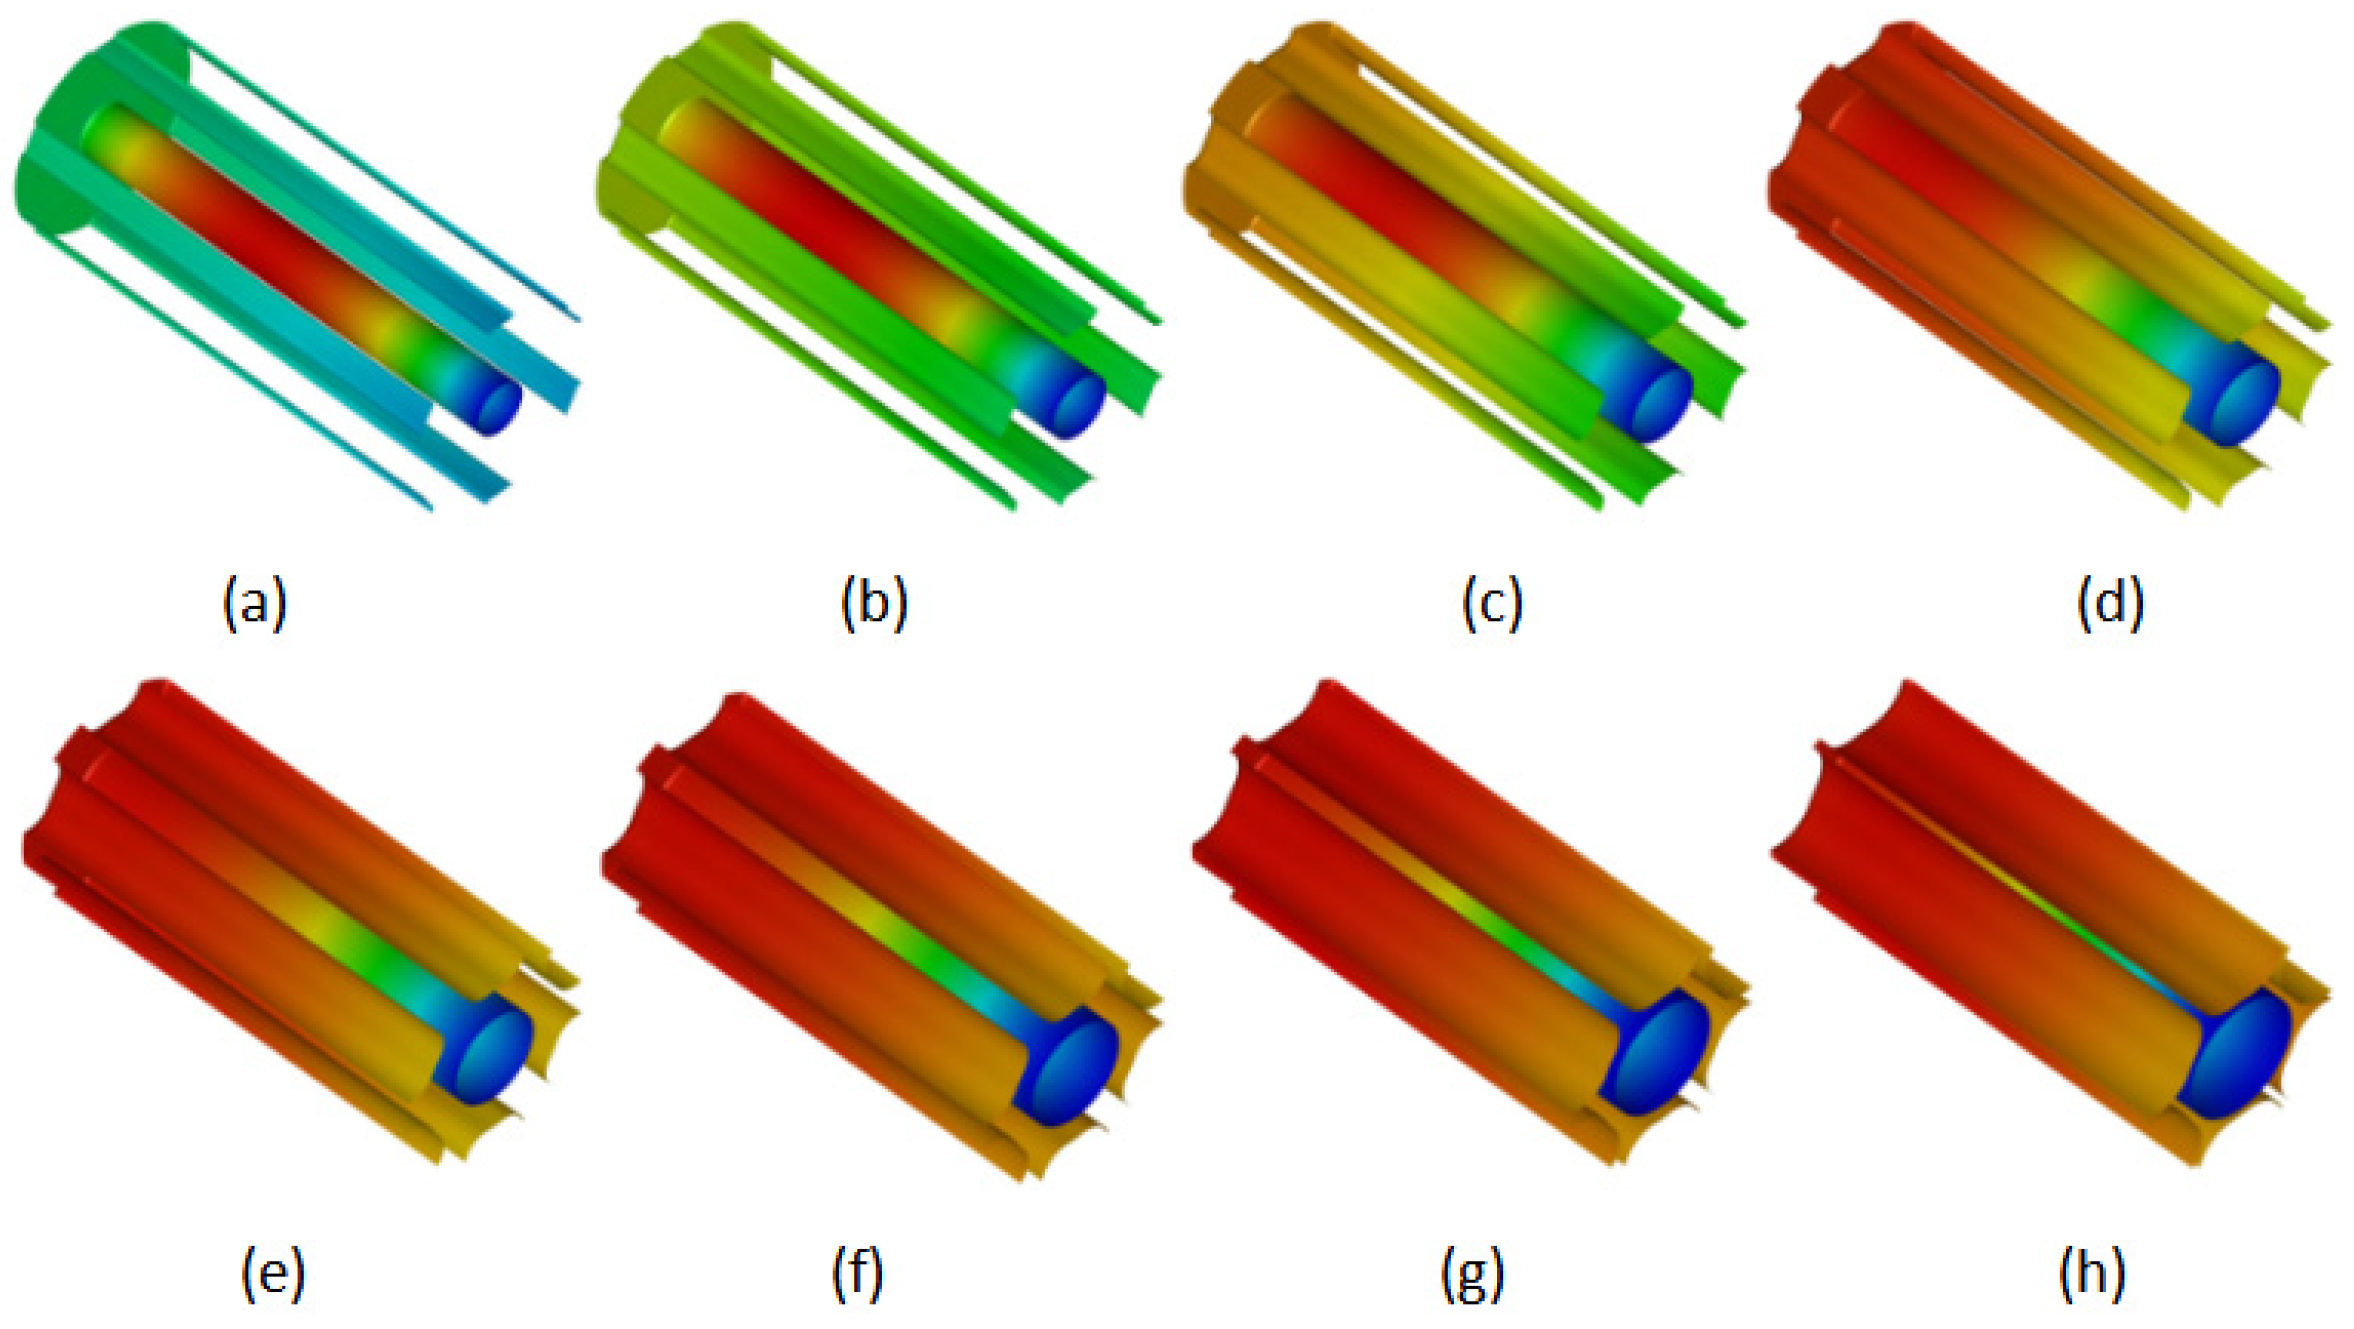
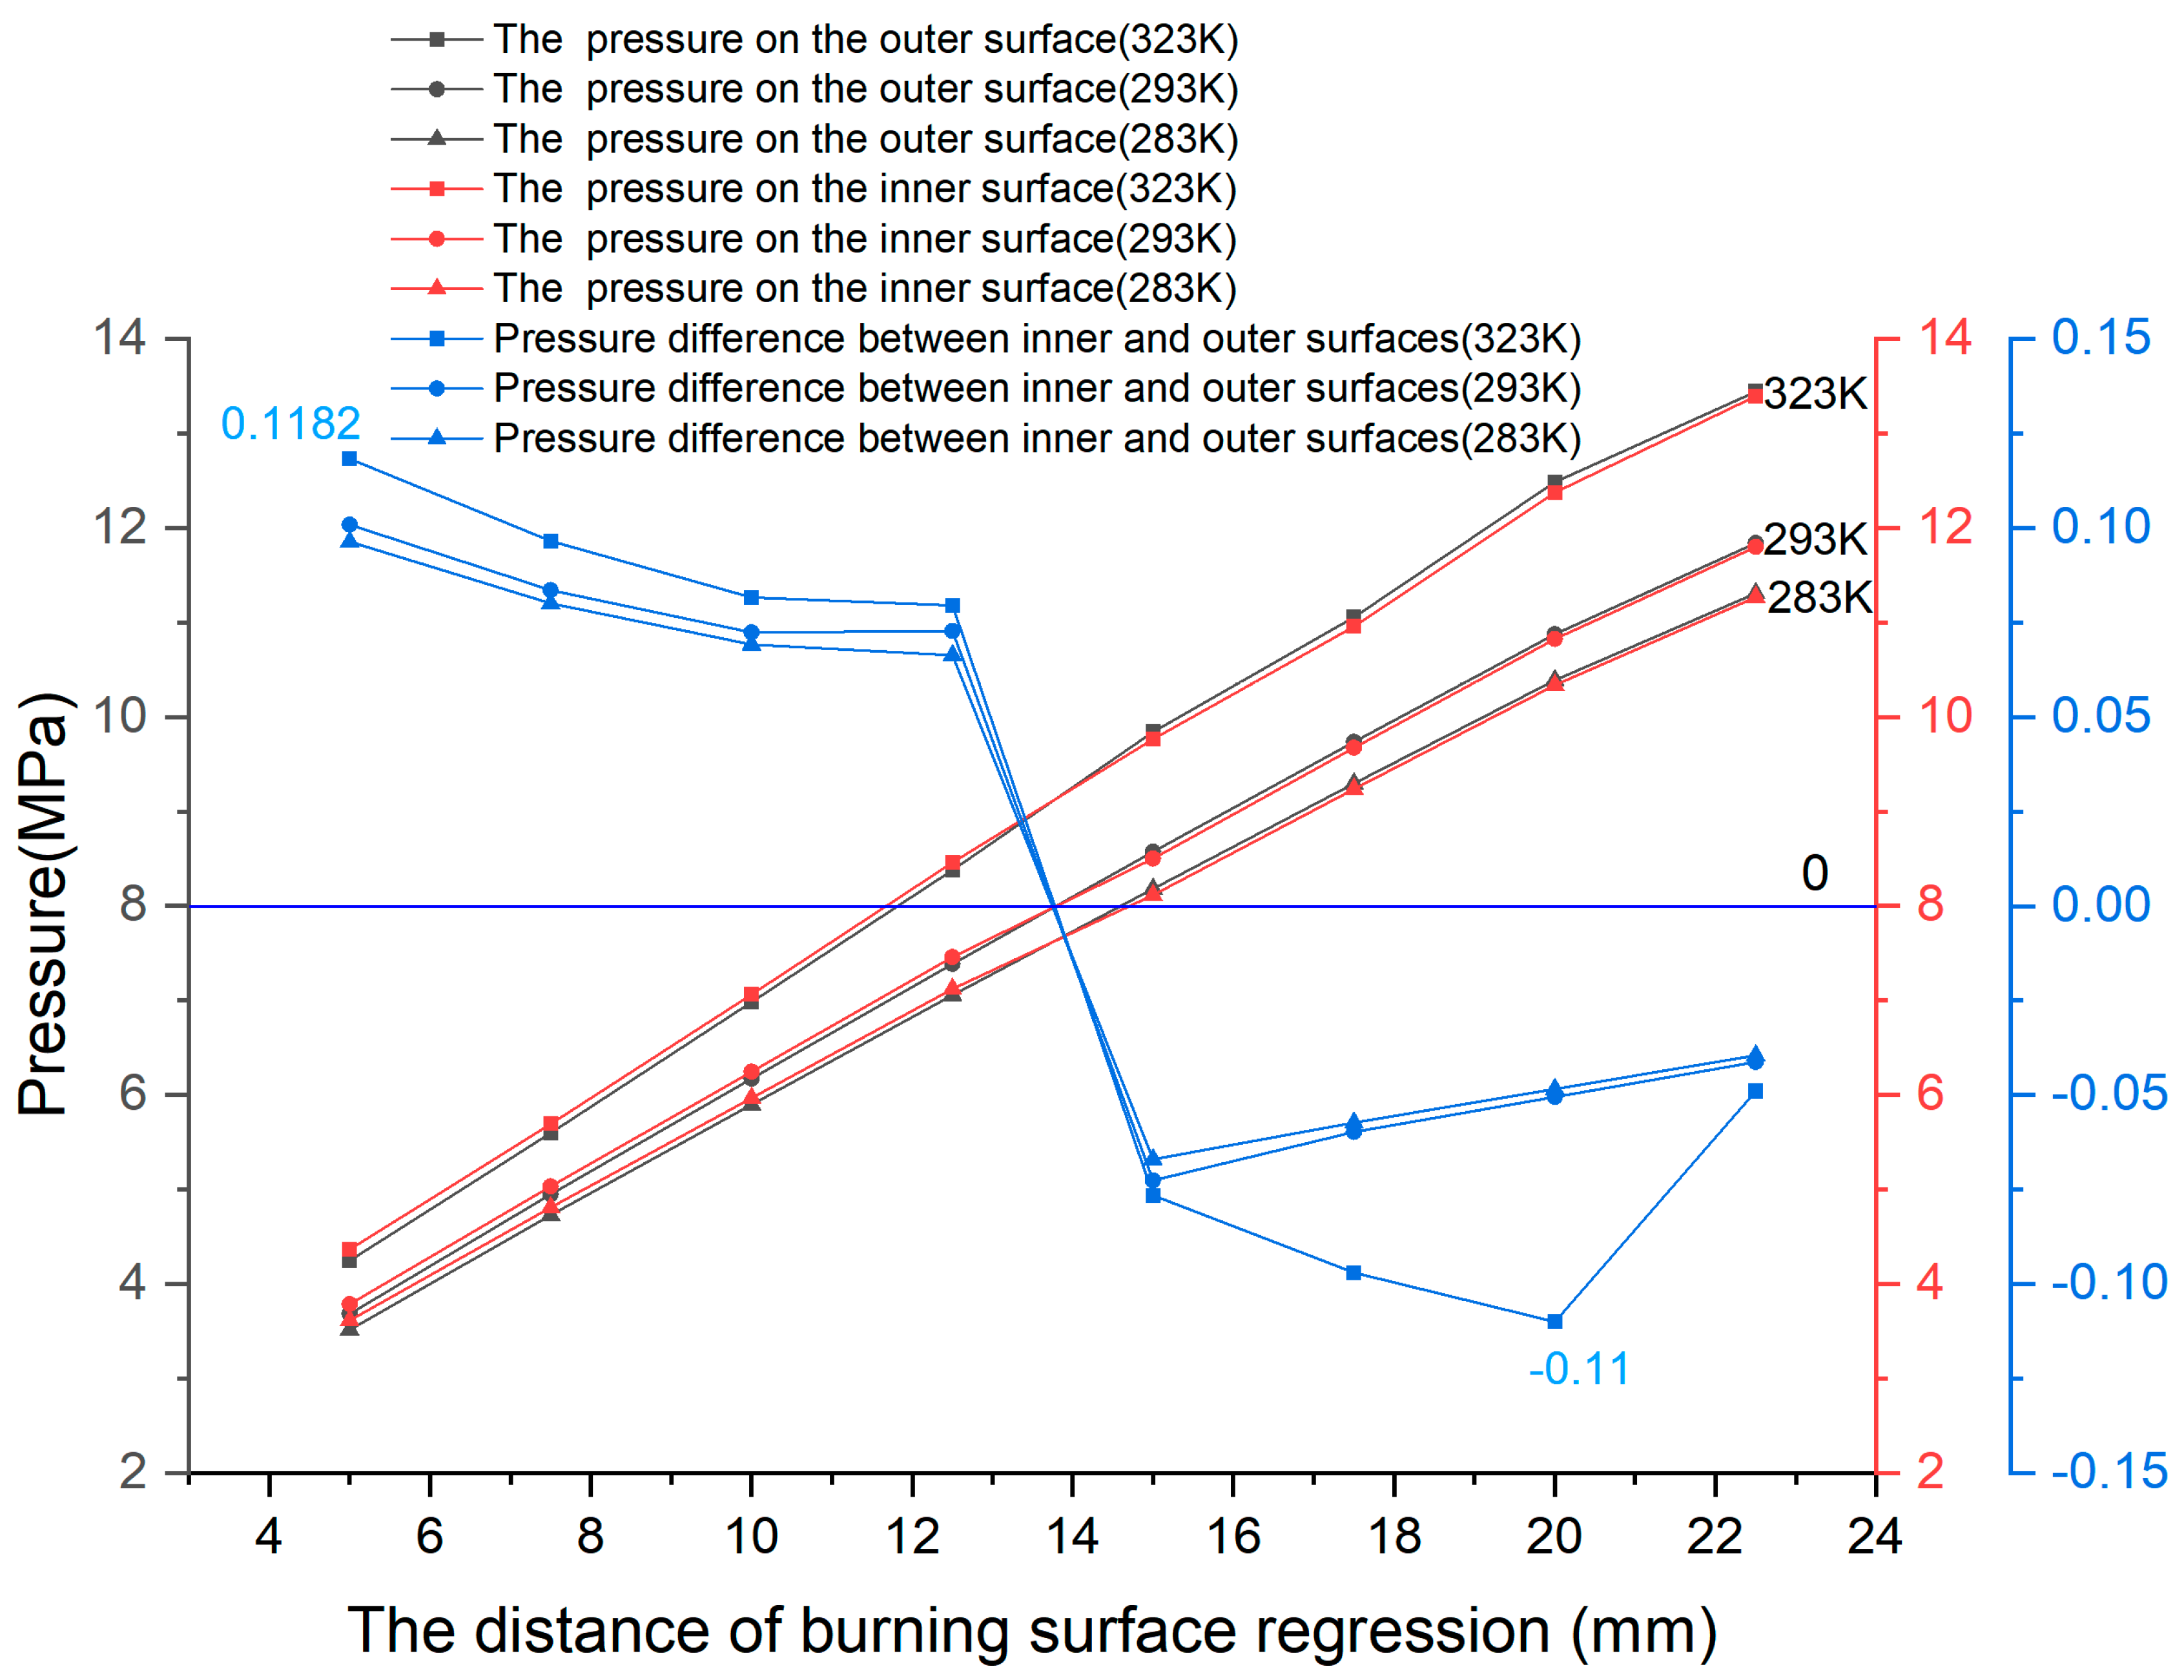
Based on the numerical simulation model established in this paper, a quasi-steady-state numerical simulation analysis of the internal flow field of the solid rocket motor at different regression moments of the burning surface at different temperatures was conducted. The surface pressure cloud diagrams of the composite propellant at high temperature (323 K) are displayed in Figure 6, while the pressure values of the inner and outer surfaces of the composite propellant at different temperatures are depicted in Figure 7.
From the operation of the gas generator, it is evident that as the burning surface regresses, the high-pressure zone on the propellant surface gradually shifts from the middle of the inner aperture towards the head and subsequently transfers to the outer surface of the gear-shaped propellant. Consequently, the pressure on the outer surface exceeds that of the inner aperture. This phenomenon arises from the progressive expansion of the inner aperture as the combustion surface regresses, leading to improved gas ventilation within the aperture. Meanwhile, the ventilation effect on the outer surface remains unchanged as the area of the elongated stripe apertures remains constant.
At the same time, the burning rate of composite propellant is different under different temperature conditions. Under high-temperature conditions, the burning rate of composite propellant is higher, resulting in a greater pressure difference between the inner and outer surfaces. The maximum pressure differential between the inner and outer surfaces occurs at 323 K when the combustion surface regresses by either 5 mm or 20 mm. At a regression of 20 mm, the combustion chamber pressure reaches approximately 12 MPa, consistent with the pressure fluctuations observed during high-temperature testing.

4. Analysis of Structural Integrity of Grain under Unbalanced Pressure

The physical properties of the composite propellant at different temperatures are shown in Table 4. According to the pressure distribution of the burning surface at different regression times, strength and buckling analyses were conducted for the propellant with different regression distances at different temperatures. The simulation results are shown in Figure 8 and Figure 9.
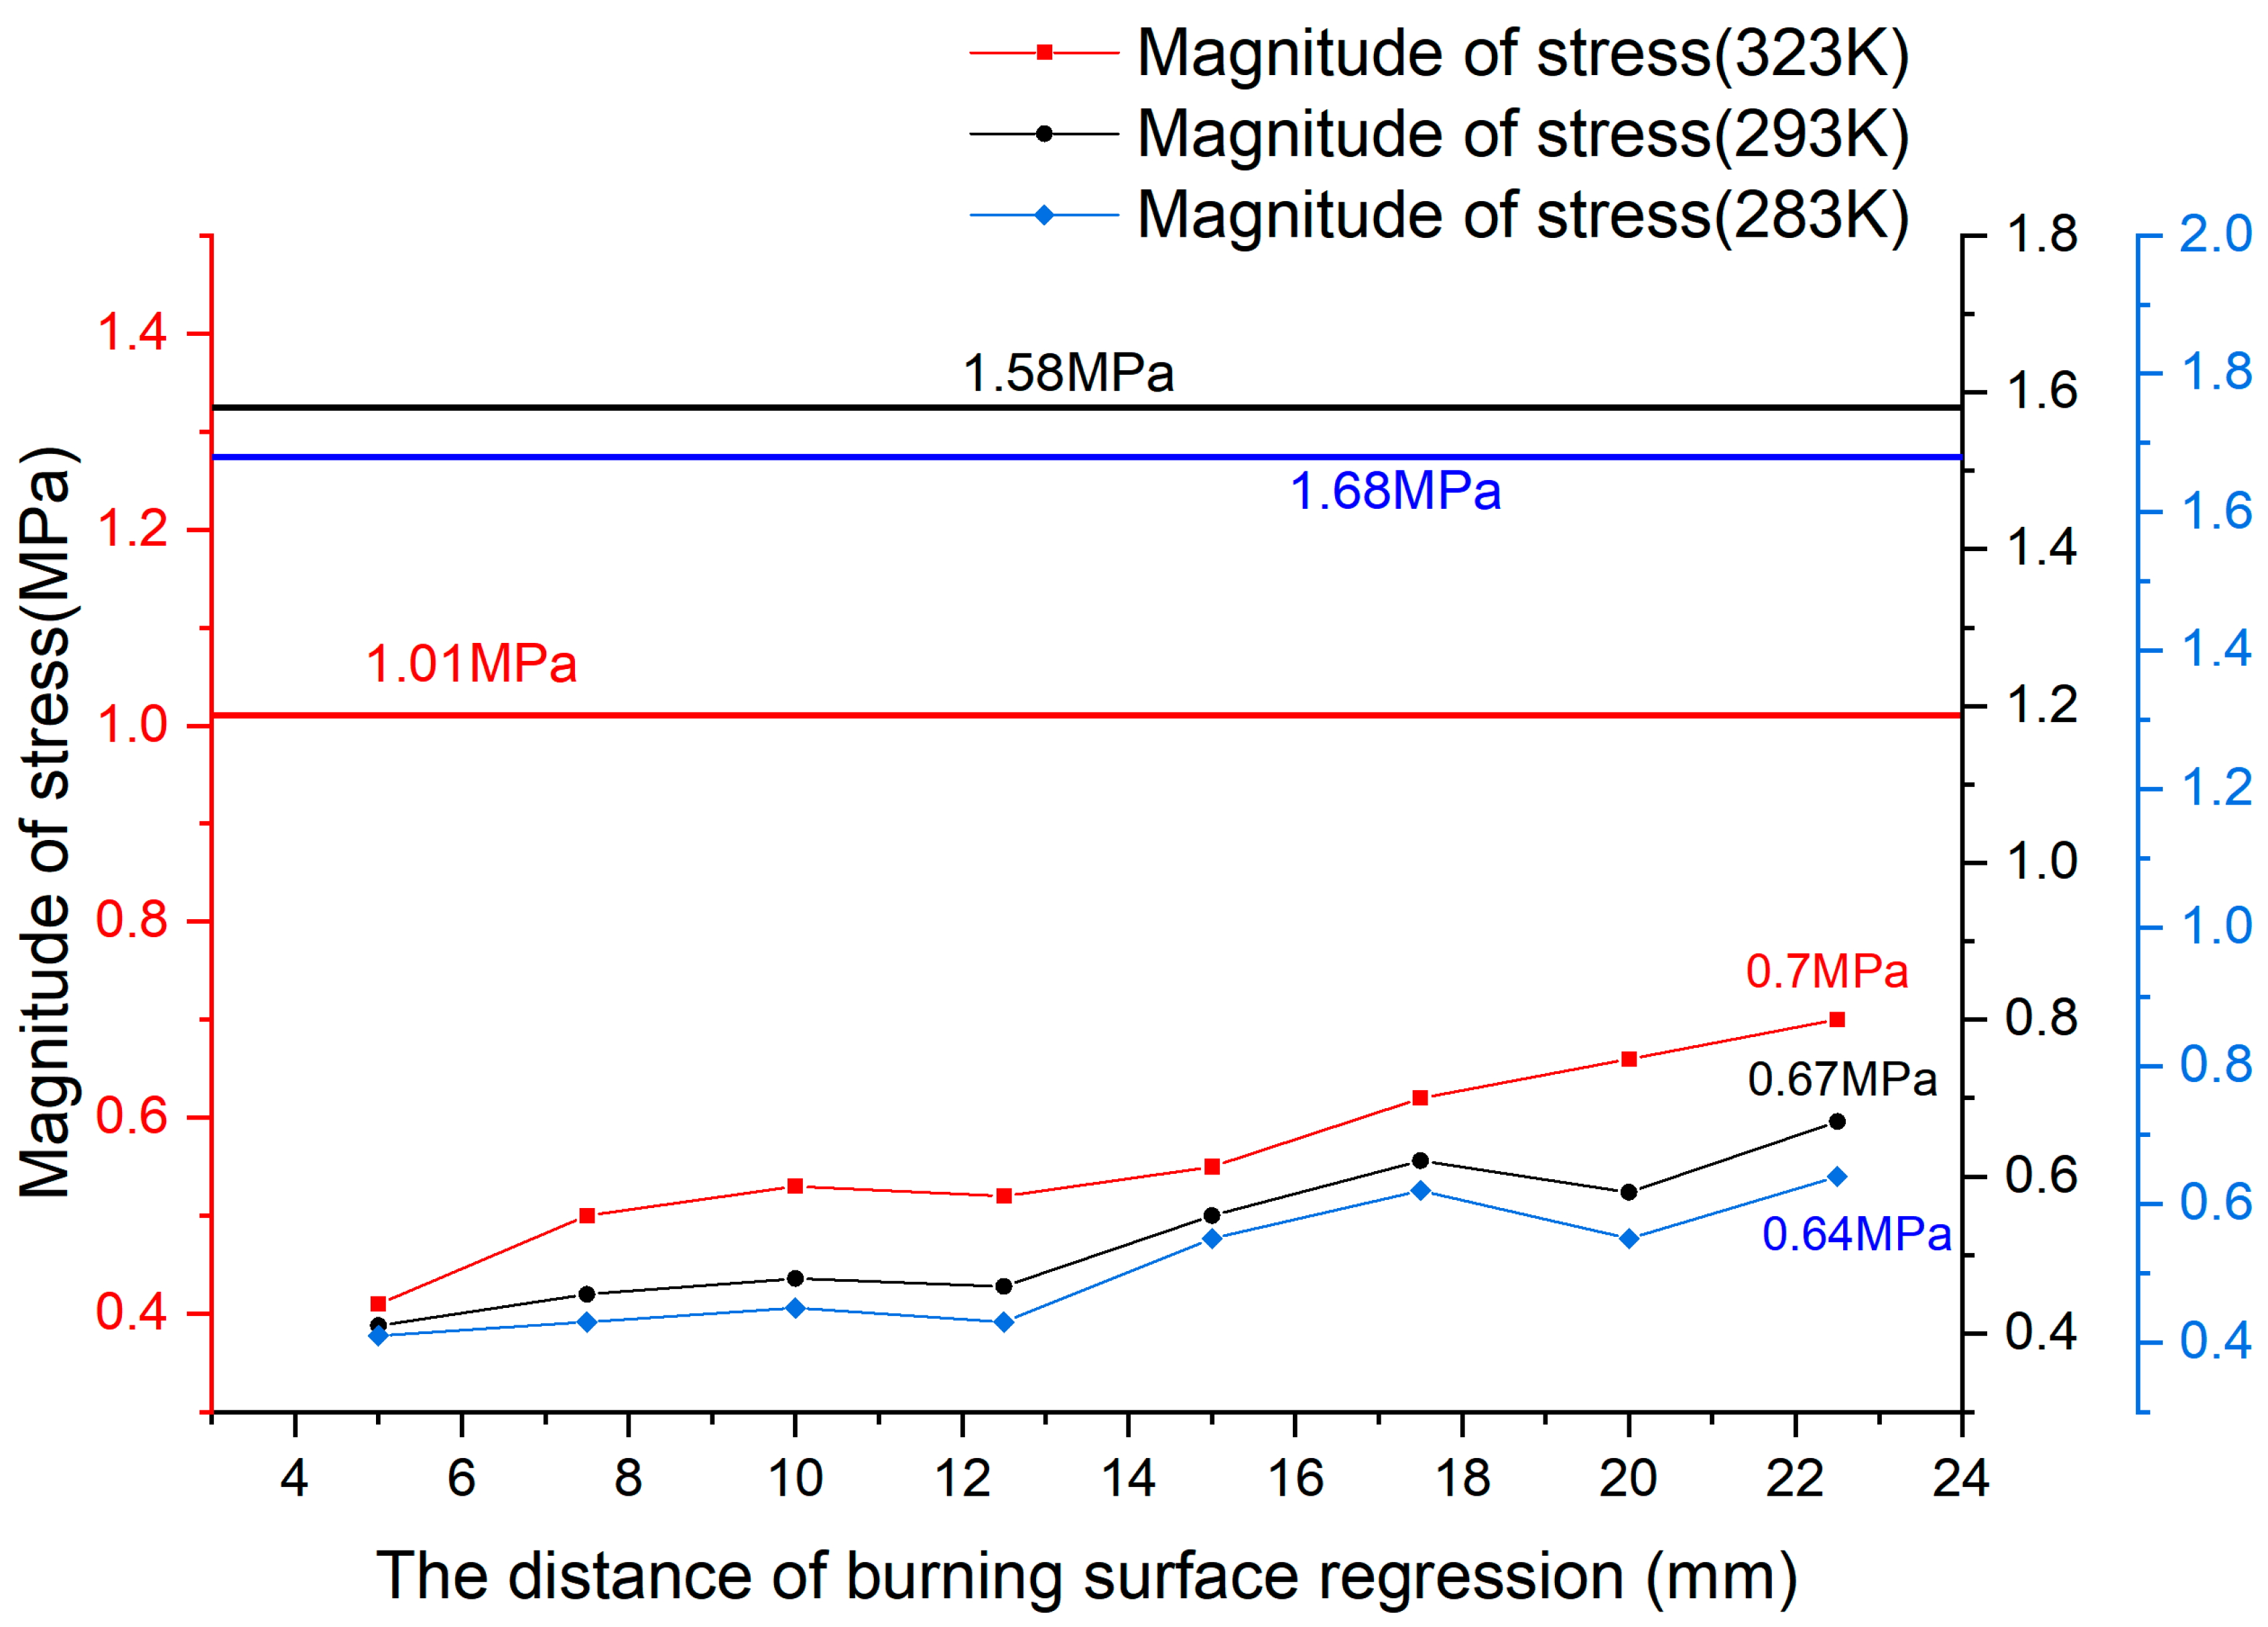
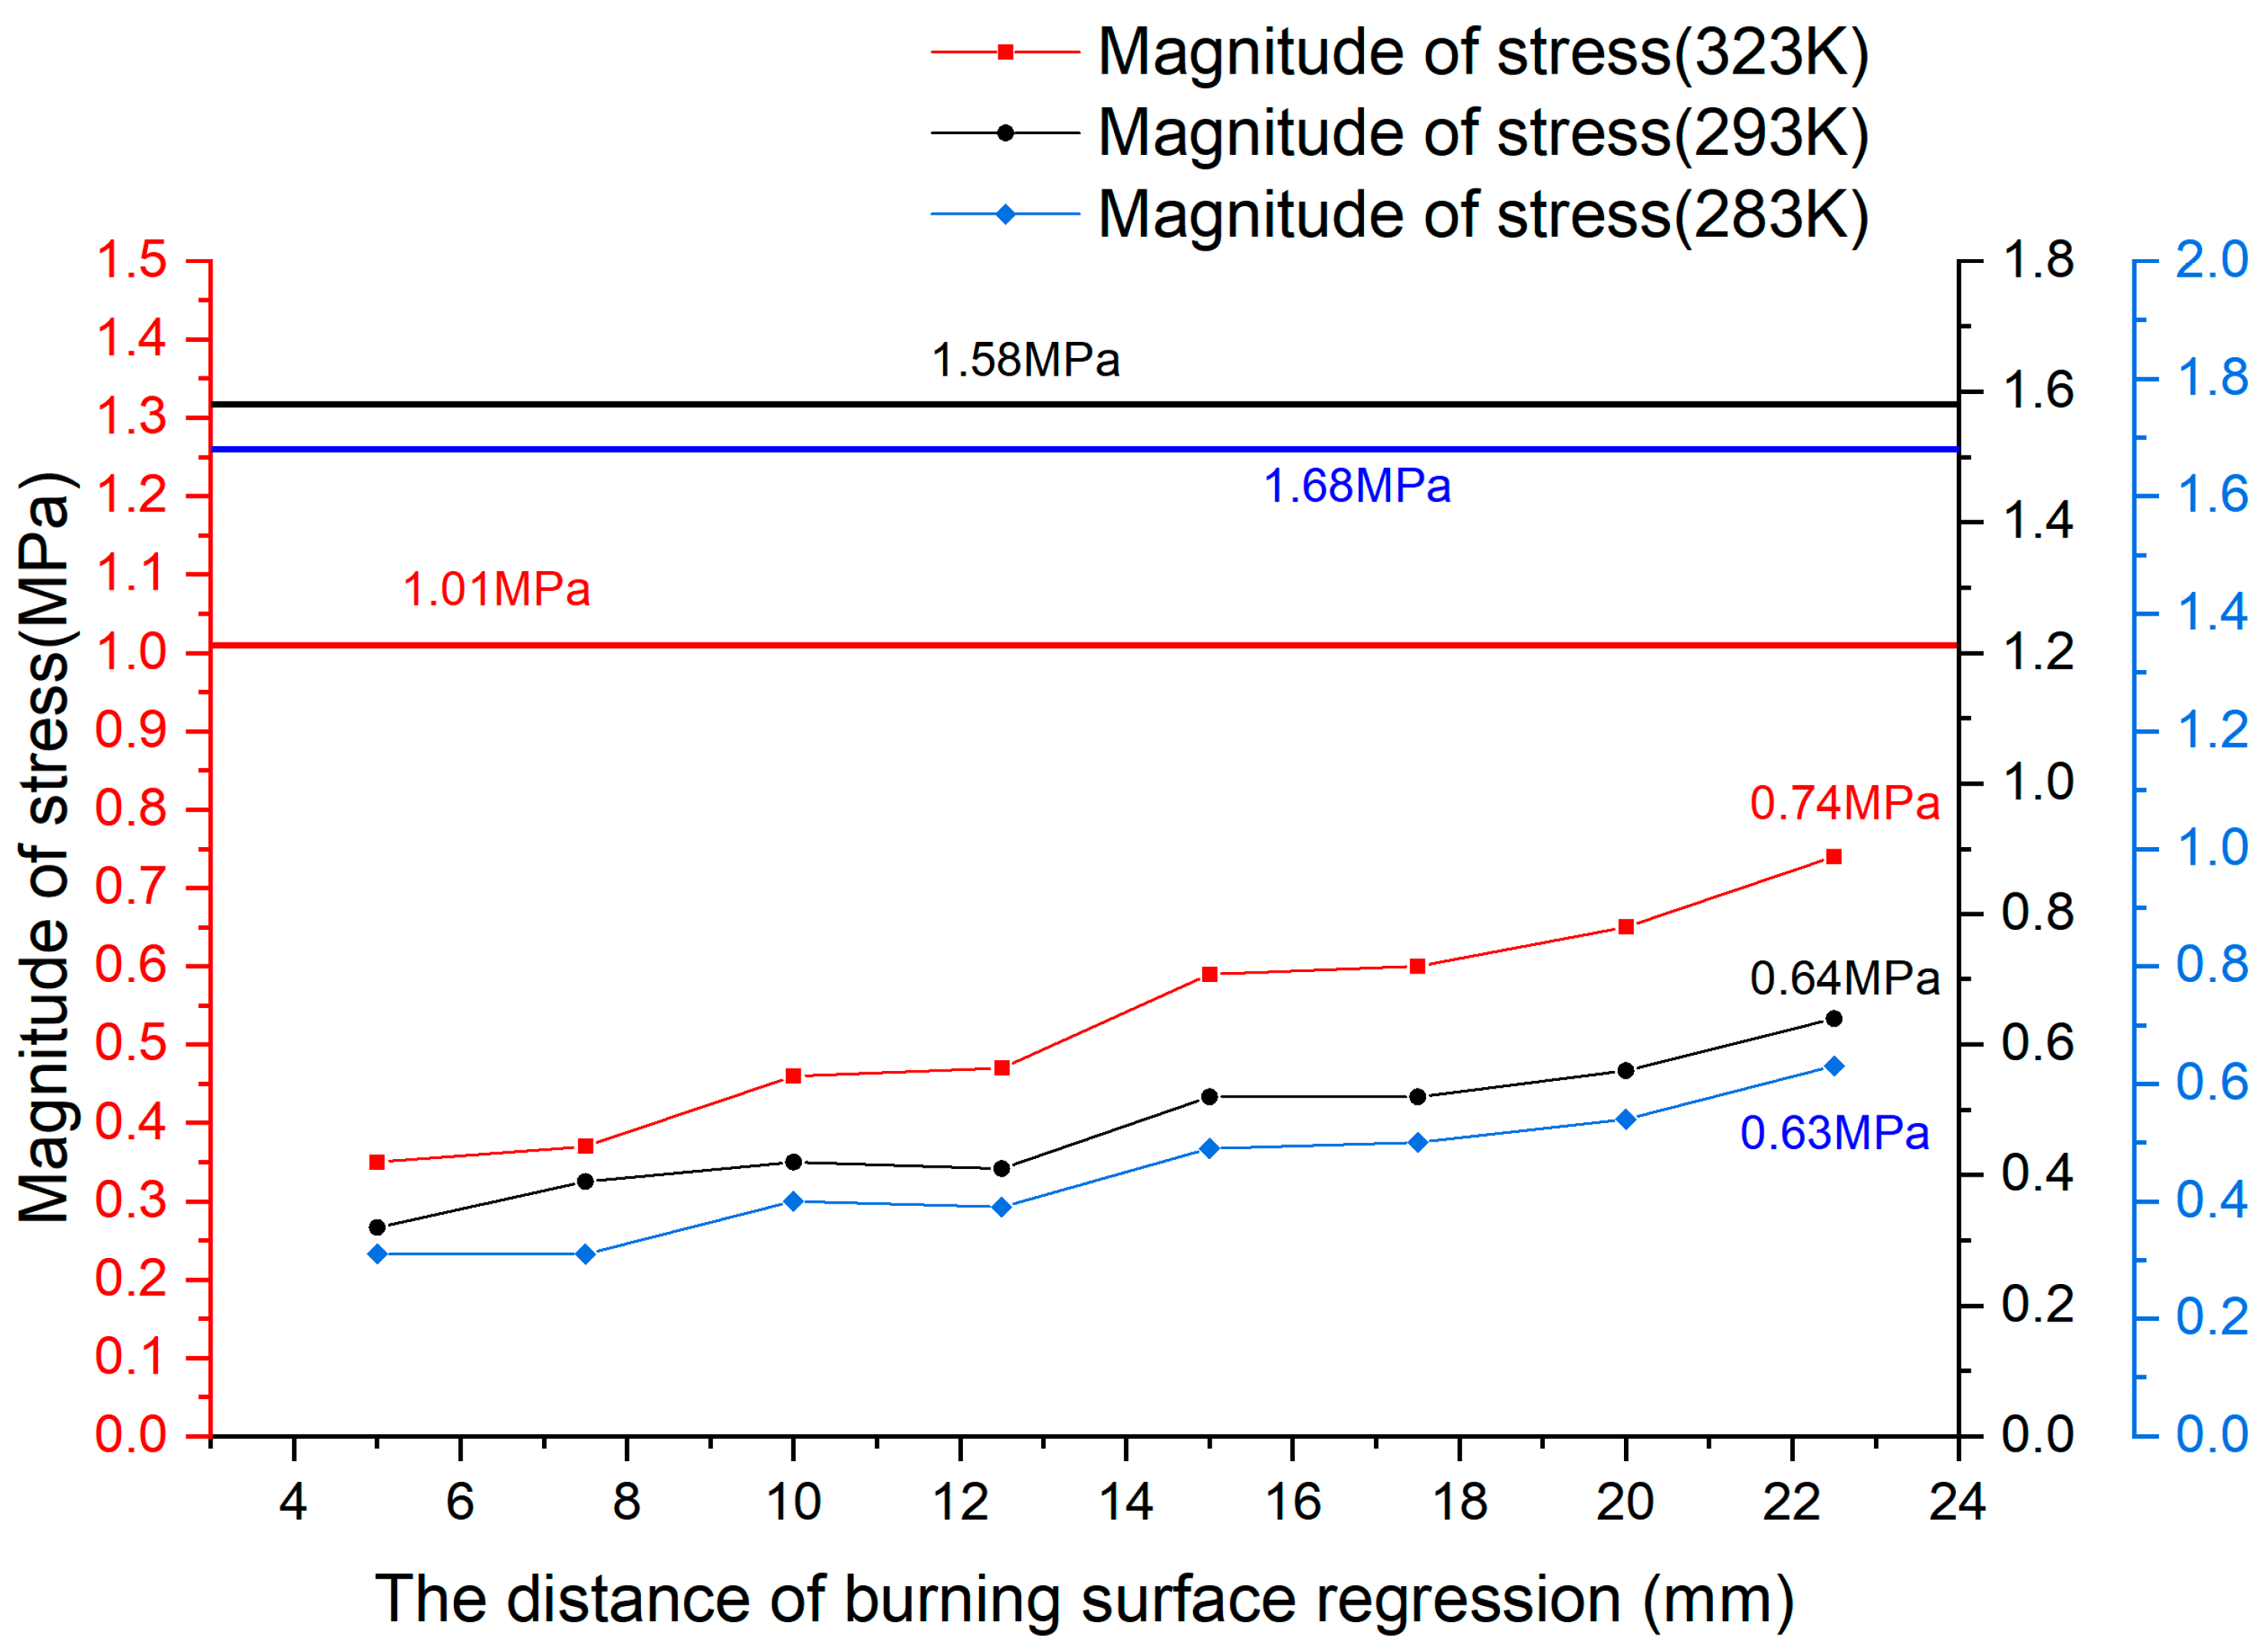
From Figure 8, it can be observed that as the burning surface retreats, the stress value of the grain gradually increases, reaching its maximum when the burning surface retreats by 22.5 mm. The maximum stress at 323 K is 0.7 MPa, which is below the ultimate stress threshold (1.01 MPa), the maximum stress at 293 K is 0.67 MPa, which is below the ultimate stress threshold (1.58 MPa), and the maximum stress at 283 K is 0.64 MPa, which is below the ultimate stress threshold (1.68 MPa), indicating that the grain does not experience stress failure.
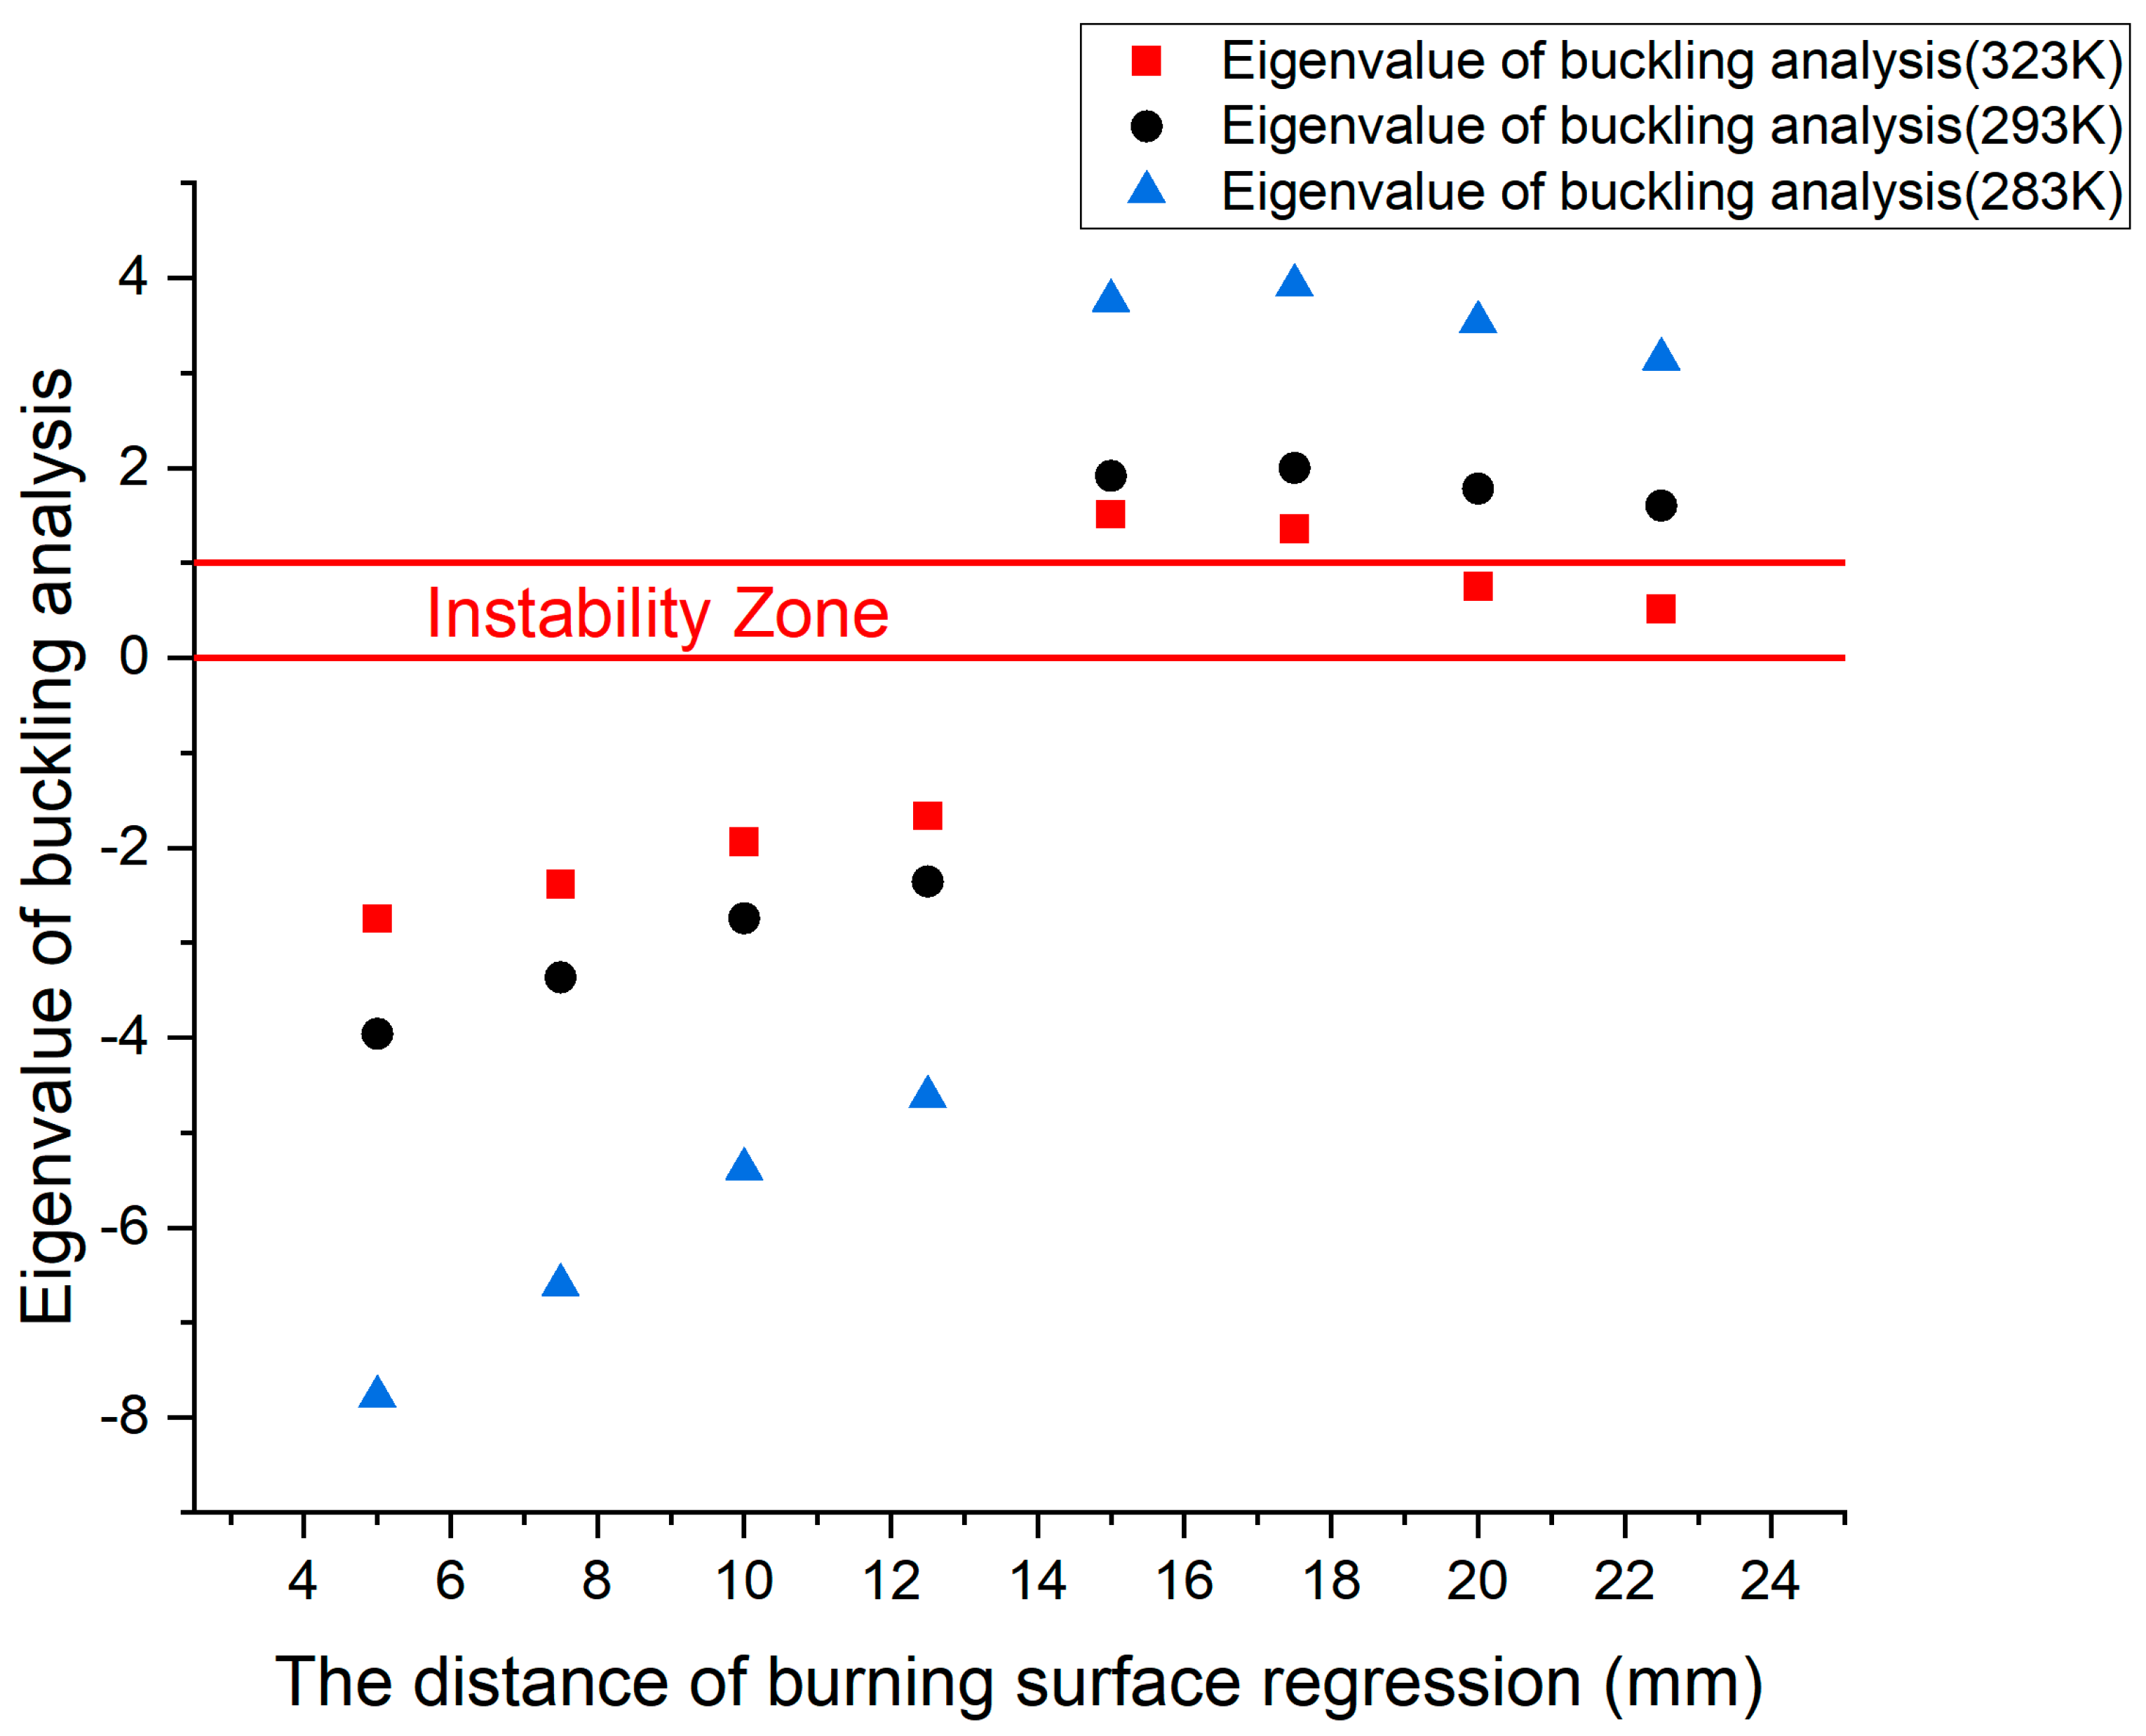
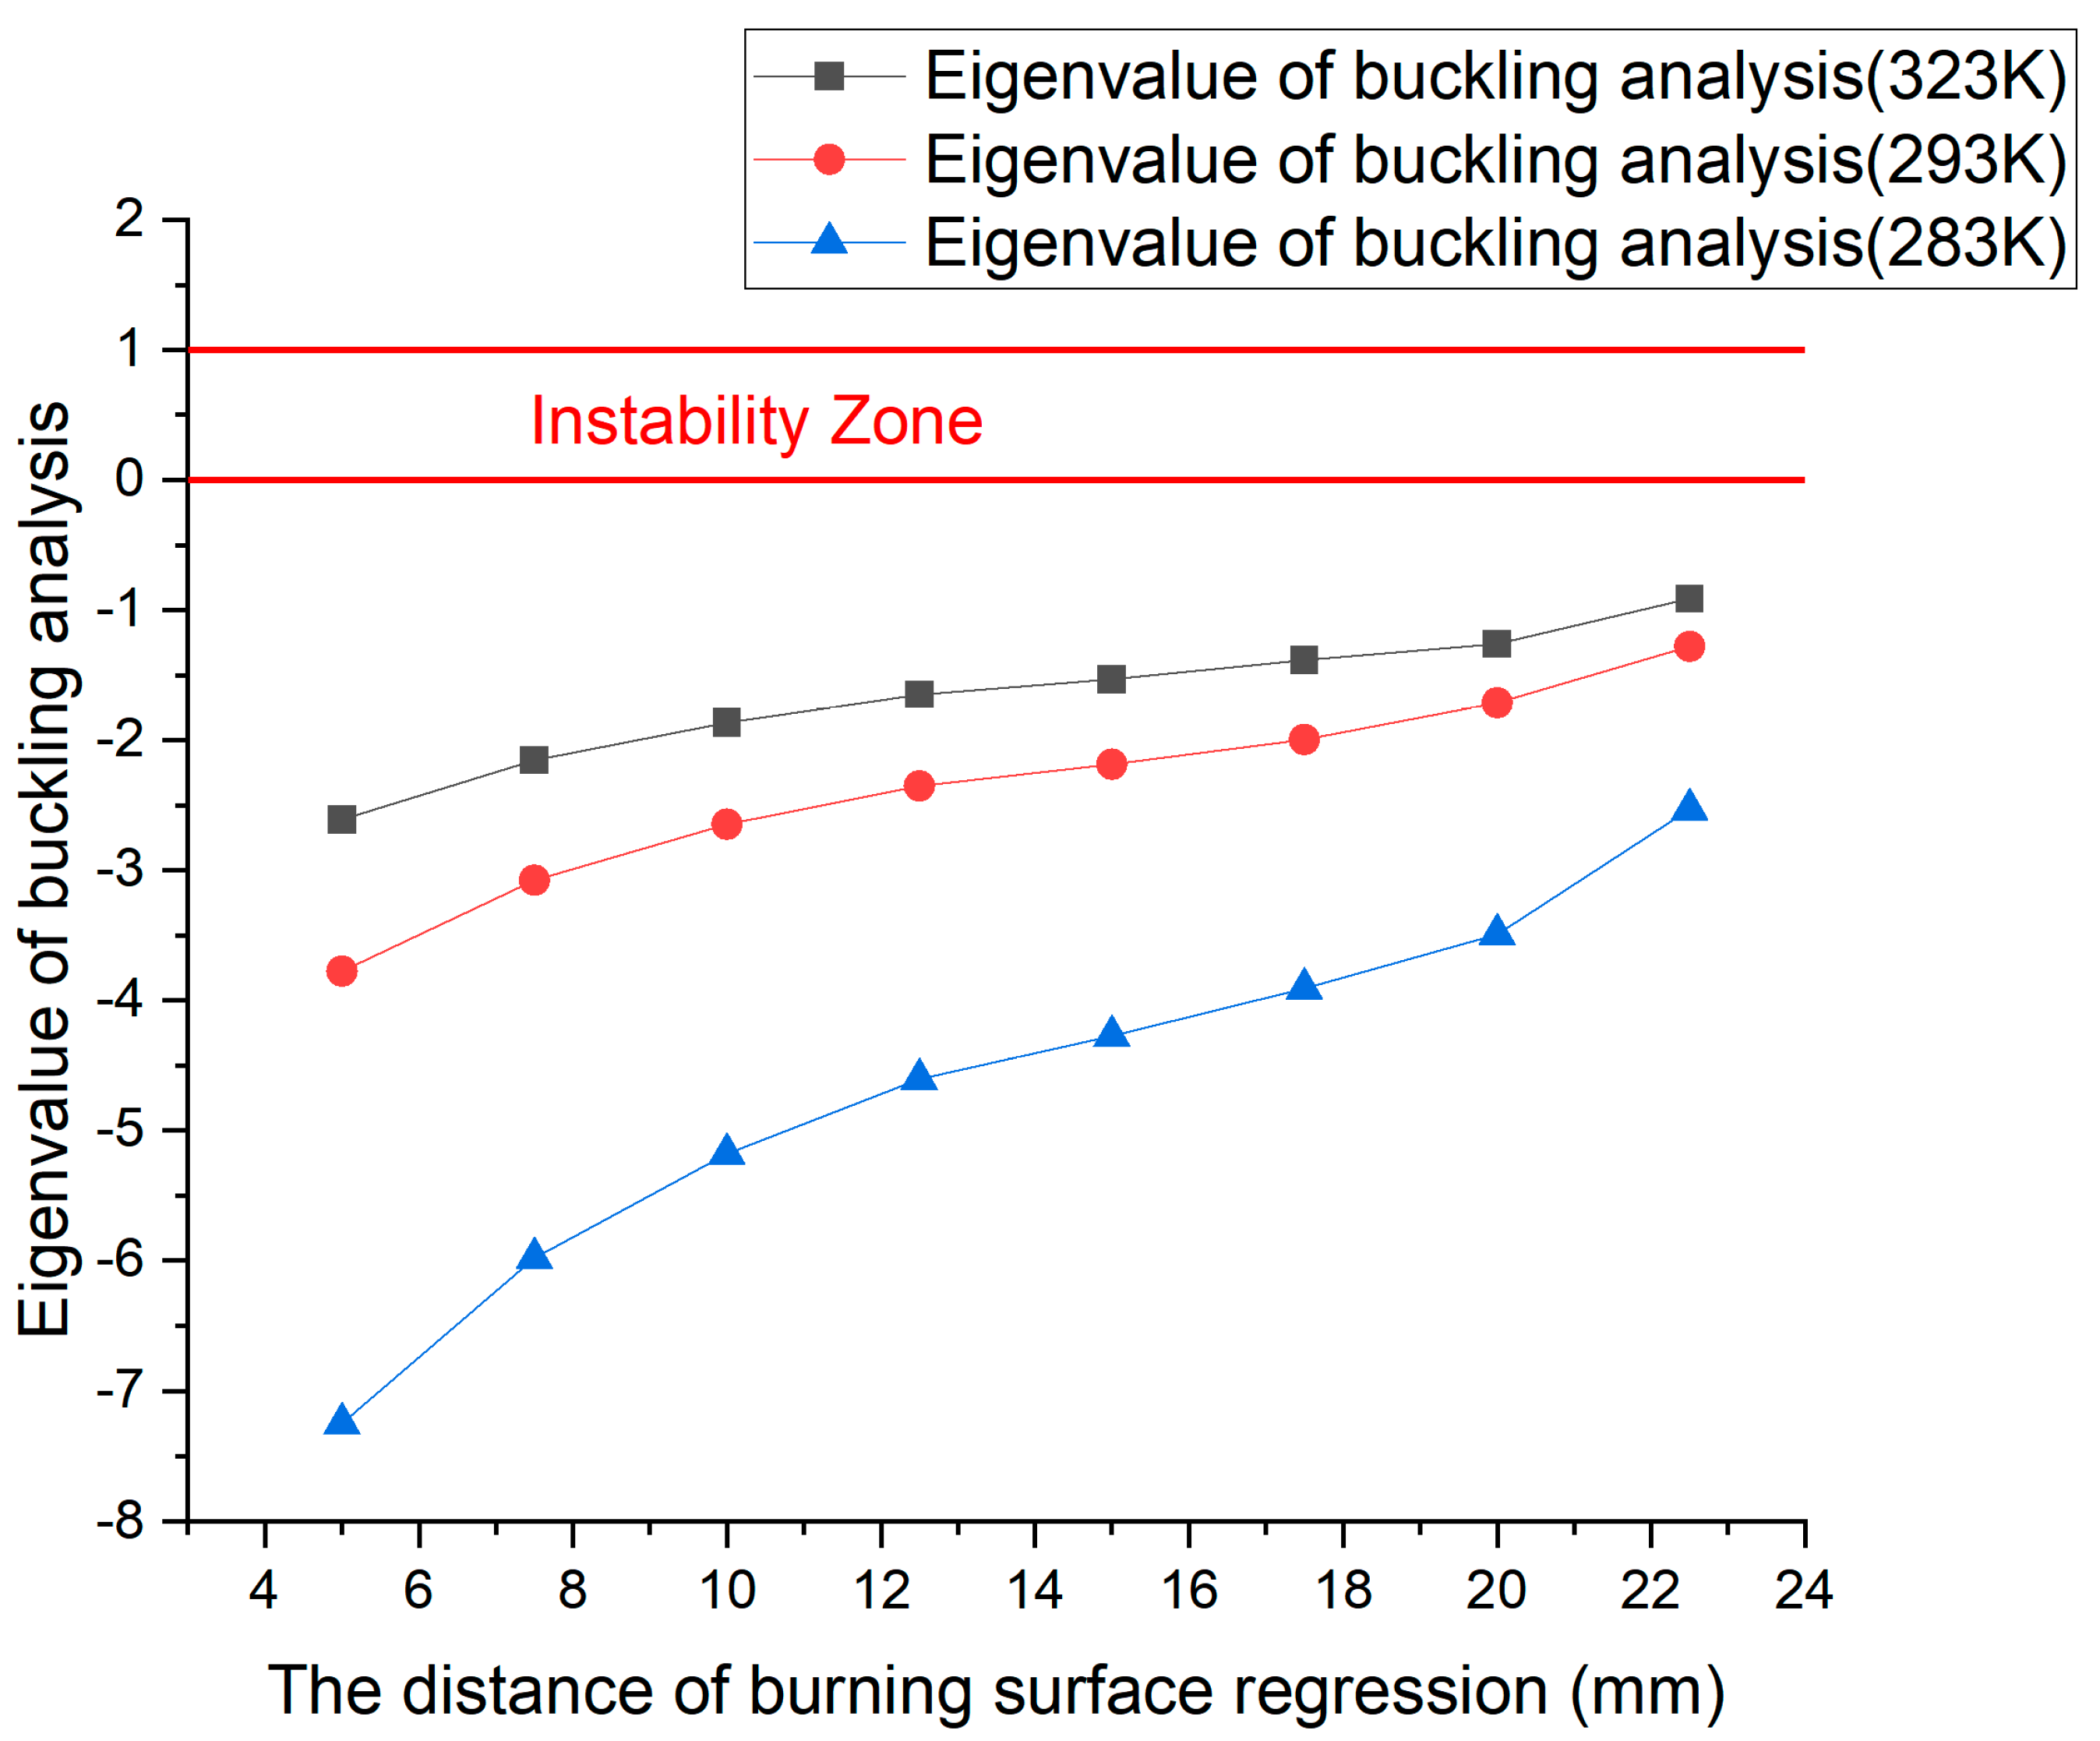
According to the principles of buckling analysis, the buckling eigenvalue represents the safety factor of the structure against instability. When the eigenvalue falls between 0 and 1, the structure becomes unstable, whereas a negative eigenvalue indicates stability. As depicted in Figure 9, with the regression of the burning surface, the buckling eigenvalue of the grain initially becomes negative and then transitions to a positive value and gradually diminishes. From Figure 9, we can see that the lower the temperature, the greater the eigenvalue of the buckling analysis and the less prone to instability of the grain. Once the burning surface regresses by 20 mm at 323 K, the buckling eigenvalue of the grain falls within the range of 0 to 1, signifying destabilization and consequential damage to structural integrity. In accordance with quasi-steady-state analysis, the pressure within the combustion chamber measures 12 MPa when the combustion surface retreats by 20 mm at 323 K, which closely aligns with the fluctuation position of the internal ballistic curve during high-temperature testing. By scrutinizing the pressure distribution of the burning surface in quasi-steady-state grain simulations, it is evident that during the initial stages of burning surface regression, the inner surface experiences higher pressure compared to the outer surface, causing outward expansion and tension in the grain. Consequently, the buckling analysis eigenvalue remains negative, indicating stability. However, as the burning surface continues to regress, the pressure on the outer surface surpasses that of the inner surface, leading to overall compression and inward contraction of the grain. Under this compression state, even minor load excitations can induce instability, thereby compromising the structural integrity of the grain.

5. Utilizing Non-Ablative Cladding Layers for Improvement

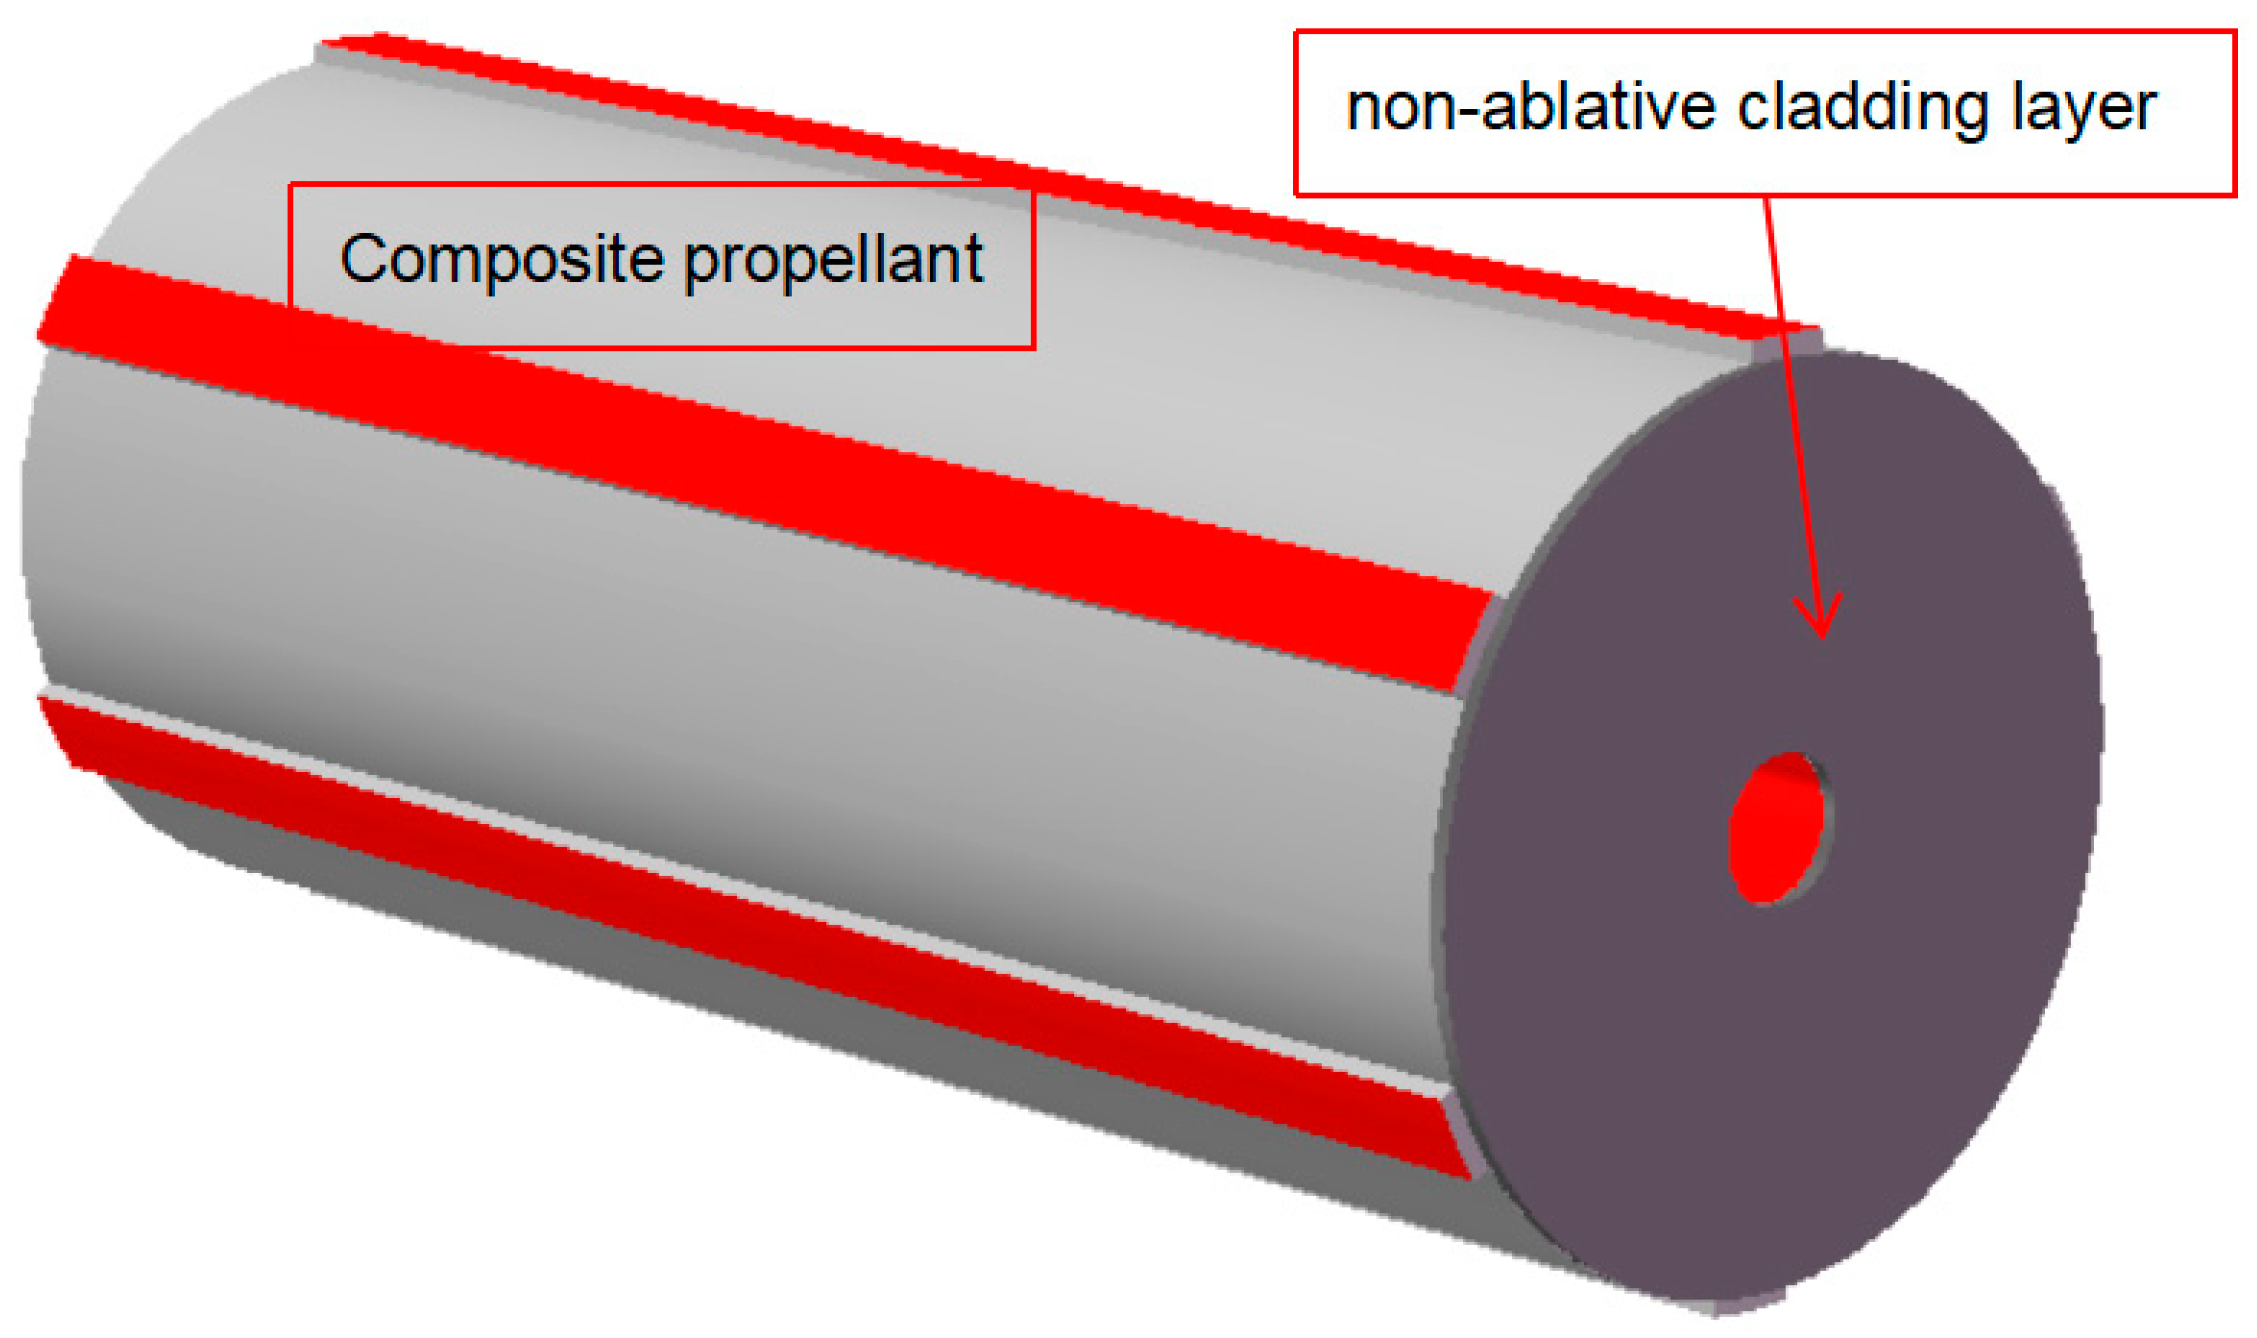
According to the simulation analysis, it is evident that the instability of the grain, caused by the imbalance between internal and external pressures, is the primary reason for the abnormal internal ballistic curve of the gas generator. Therefore, it is advisable to maintain the ventilation effect of the grain consistent with the regression of the combustion surface, mitigate the pressure imbalance between the inner and outer surfaces of the grain, and minimize the likelihood of grain instability to ensure its structural integrity. Consequently, a non-ablative cladding layer is chosen for improvement, as illustrated in the schematic in Figure 10. The three-dimensional diagrams of the grain at various regression times of the burning surfaces post-improvement are depicted in Figure 11.

5.1. Simulation Analysis of the Non-Ablative Cladding Layer Scheme

To assess the effectiveness of the non-ablative cladding layer for improvement, we employed the same simulation method to simulate the internal flow field at various regression times of combustion surfaces. The pressure distribution cloud diagrams of the combustion surfaces at 323 K are presented in Figure 12, while the pressure values of the inner and outer surfaces of the grain at different temperatures are depicted in Figure 13. Surface pressure data at different regression times at different temperatures were extracted for strength and buckling analyses of the grain. The simulation findings are illustrated in Figure 14 and Figure 15.
From the simulation results, it is observed that as the burning surface regresses, the high-pressure area on the grain’s surface gradually shifts from the middle section of the inner hole to the tail section. Consequently, the pressure on the inner hole’s surface consistently exceeds that on the outer surface and the pressure difference between the inner and outer surfaces gradually diminishes. At the same time, the lower the temperature, the smaller the pressure difference between the inner and outer surfaces of the grain.
From the stress diagram, we can observe that as the burning surface regresses, the stress of the grain gradually increases, reaching a maximum of 0.74 MPa when the burning surface retreats by 22.5 mm at 323 K. However, the stress experienced by the grain remains below the ultimate stress threshold, indicating that the grain would not undergo stress damage under all temperature conditions.
From the simulation results of the buckling analysis, it is evident that as the burning surface regresses, the absolute value of the buckling eigenvalue of the grain gradually decreases. However, all the buckling eigenvalues are negative, indicating that the grain remains stable. Analyzing the pressure distribution on the burning surface of the grain in the quasi-steady simulation reveals that when the non-ablative coating layer is applied, the pressure on the inner surface of the grain exceeds that on the outer surface, causing the grain to expand outward and be subjected to tension. Despite this, instability does not occur, ensuring the structural integrity of the grain.

5.2. Experimental Verification of the Non-Ablative Cladding Layer Scheme

The high-temperature test was conducted on the gas generator with a non-ablative cladding layer, yielding a new internal ballistic curve. This curve was used to verify the accuracy of the analysis regarding the abnormal behavior observed in the internal ballistic curve of the gas generator. The internal ballistic pressure curve obtained from the test is illustrated in Figure 16.
From Figure 16, it is evident that there is no pressure fluctuation in the interior ballistic curve of the combustion chamber during the high-temperature test of the improved gas generator. This observation suggests that the integrity of the grain remains intact, thereby validating the efficacy of the improvement and the accuracy of the abnormal analysis of the motor’s interior ballistic curve.

6. Conclusions

Given the abnormal structural integrity observed in the grain at the conclusion of the high-temperature test of the gas generator utilizing free-loading composite propellant, a series of analyses were conducted. These included quasi-steady state simulations of the internal flow field at various regression times of the burning surfaces, as well as strength and buckling simulations of the grain. The objective was to identify the root cause and propose improvement measures, such as the implementation of a non-ablative cladding layer, for subsequent simulation and experimental validation. The conclusions drawn are as follows.
Through quasi-steady state simulation analysis of the original structure, as well as strength and buckling analysis of the grain, it is observed that as the burning surface regresses, the maximum stress on the grain reaches 0.7 MPa at 323 K, which is below its ultimate stress of 1.01 MPa. Consequently, grain failure due to stress is not expected. And we found that the buckling eigenvalue falls within the instability zone at 323 K when the burning surfaces retreat by 20 mm. Meanwhile, examination of pressure distribution cloud diagrams for the inner and outer surfaces of the grain reveals that the imbalance between them results in compression of the composite propellant, leading to instability failure.
In the simulation of the gas generator utilizing the non-ablative cladding layer scheme, the maximum stress on the grain is 0.74 MPa at 323 K, indicating no stress-induced damage. The buckling eigenvalue of the grain remains negative, suggesting it will not fail. Additionally, there is no abnormal fluctuation observed in the interior ballistic curve during the high-temperature test. This indicates that the implementation of the non-ablative cladding layer maintains consistent ventilation effects on the grain, regardless of the regression of the burning surface, thereby ensuring the structural integrity of the composite propellant.
Therefore, for the free-loading composite propellant, particularly the tubular grain with a cladding layer, ensuring that the structural integrity remains intact despite variations in motor performance during operation is essential. The utilization of a non-ablative cladding layer can maintain consistent ventilation effects, thereby guaranteeing the reliability of the grain. This approach enhances the adaptability and reliability of free-loading composite propellants in various solid rocket motors and offers a novel concept for composite propellant grain design.

Author Contributions

Methodology, W.F.; Software, G.Z. and M.Z.; Validation, M.Z.; Investigation, Y.T.; Resources, Y.L.; Data curation, W.H.; Writing—original draft, G.Z. All authors have read and agreed to the published version of the manuscript.

Funding

This research was funded by [National Natural Science Foundation of China] grant number [52302479] and the APC was funded by [National Natural Science Foundation of China].

Data Availability Statement

Due to privacy or ethical restrictions, the data is unavailable.

Conflicts of Interest

The authors declare no conflict of interest.

References

  1. Hugget, C.; Bartley, C.E.; Mills, M.M. Solid Propellant Rockets; Princeton University Press: Princeton, NJ, USA, 2015; pp. 1–176. [Google Scholar]
  2. Wei, X.; Zhou, J.; Li, H.; Shu, H. Research progress on structural integrity analysis of solid propellant grain. J. Ordnance Equip. Mot. 2022, 1, 19–26. [Google Scholar] [CrossRef]
  3. Liu, M.; Xiong, L.; Huang, H. Experimental and numerical investigation on agglomeration of aluminum during combustion process of aluminized composite propellant. Therm. Sci. Eng. Prog. 2024, 49, 102505. [Google Scholar] [CrossRef]
  4. Zhang, P.; Han, W.; Zhou, D. Structural Integrity Assessment of an NEPE Propellant Grain Considering the Tension-Compression Asymmetry in Its Mechanical Property. Polymers 2023, 15, 3339. [Google Scholar] [CrossRef] [PubMed]
  5. Wu, W.; Fan, Z.; Yuan, J.; Shen, Z. Analysis of relaxation modulus, tension-compression properties and temperature sensitivity of solid propellant. J. Solid Rocket Technol. 2022, 45, 237–243. [Google Scholar]
  6. Zong, L.H.; Du, C.; Lu, S.; Yao, D.; Gao, J.; Sha, B.-L. Simulation on pressure cure of solid rocket motor grain. J. Solid Rocket Technol. 2015, 38, 653–656. [Google Scholar]
  7. Gong, J.; Jin, B.; Gong, W.; Deng, Z.; Zhang, Z. Numerical analysis on structural integrity of finocyl grain under ignition loading. J. Natl. Univ. Def. Technol. 2022, 44, 108–113. [Google Scholar]
  8. Liu, Z.; Zhou, Y.; Zhang, B. Structural integrity analysis on grains of solid rocket motor at low temperature ignition. J. Solid Rocket Technol. 2015, 38, 351–355. [Google Scholar]
  9. Değirmenci, E.; Evci, C.; Işık, H.; Macar, M.; Yılmaz, N.; Dirikolu, M.H.; Çelik, V. Thermo-mechanical analysis of double base propellant combustion in a barrel. Appl. Therm. Eng. 2016, 102, 1287–1299. [Google Scholar] [CrossRef]
  10. Deng, K.; Zhang, L.; Pang, A.; Yu, R.; Yang, L.; Xin, P. Analysis on structural integrity of a free loading solid propellant grains under ignition loading at low temperature. J. Solid Rocket Technol. 2018, 41, 428–434. [Google Scholar]
  11. Zheng, W.; Chen, J.-B.; Pei, J.-F.; Ma, L.; Wang, J.-N.; Song, X.-D.; Geng, C.-H. Experimental Study on Free Loading of Rocket Motor with Large Aspect Ratio. Chin. J. Explos. Propellants 2020, 4, 433–436, 441. [Google Scholar] [CrossRef]
  12. Zhang, Z.; Li, J.; Mei, K.; Wang, J.; Wang, N. Study on Factors Affecting Initial Pressure Peak in Solid Rocket Motor with Multiple Tubular grains. Propuls. Technol. 2020, 3, 632–641. [Google Scholar] [CrossRef]
  13. Liu, Y.; Wang, H.; Tao, R.; Zhu, D. Effects of ignition process on the internal ballistics of small-size solid rocket motor. Chin. J. Energetic Mater. 2013, 21, 75–79. [Google Scholar]
  14. Guan, D.; Li, S.; Liu, Z.; Wang, N. Influence of Lateral Acceleration on Ignition Transients of Solid Rocket Motor. Acta Armamentarii 2021, 42, 1877–1887. [Google Scholar]
  15. Chen, Z.; Han, W.; Zhang, Z.; Wu, M.; Fang, H. Experimental study on combustion instability in a large aspect ratio solid rocket motor. J. Solid Rocket Technol. 2022, 4, 631–638. [Google Scholar] [CrossRef]
  16. Zhang, X.; Gao, B.; Gan, X.; Ma, L.; Zhou, Y. Impacts of Flight Acceleration on Combustion Instability of Solid Rocket Motor. J. Astronaut. 2019, 40, 972–976. [Google Scholar]
  17. Hu, D.; He, G.; Liu, P.; Wang, Z. Study on combustion instability of solid rocket motor with finocyl grain. J. Solid Rocket Technol. 2010, 5, 502–506. [Google Scholar] [CrossRef]
  18. Du, J.; Yang, R.; Li, D.; Xv, Y. Stability analysis of reinforced concrete tower of MW grade wind turbine. J. Sol. Energy 2021, 3, 9–14. [Google Scholar] [CrossRef]
  19. Li, Y.B.; Pan, Q.; Huang, M.H.; Li, L. Set-based parametric modeling, buckling and ultimate strength estimation of stiffened ship structures. J. Cent. South Univ. 2019, 26, 1958–1975. [Google Scholar] [CrossRef]
  20. Kendall, R.P.; Votta, L.G.; Post, D.E.; Moyer, E.T.; Morton, S.A. Verification and Validation in CREATE Multiphysics HPC Software Applications. Comput. Sci. Mot. 2017, 19, 18–26. [Google Scholar] [CrossRef]
  21. Menter, F.R. Zonal two equation k-ω turbulence models for aerodynamic flows. In Proceedings of the 23rd Fluid Dynamics, Plasmadynamics, and Lasers Conference, Orlando, FL, USA, 6–9 July 1993. [Google Scholar]
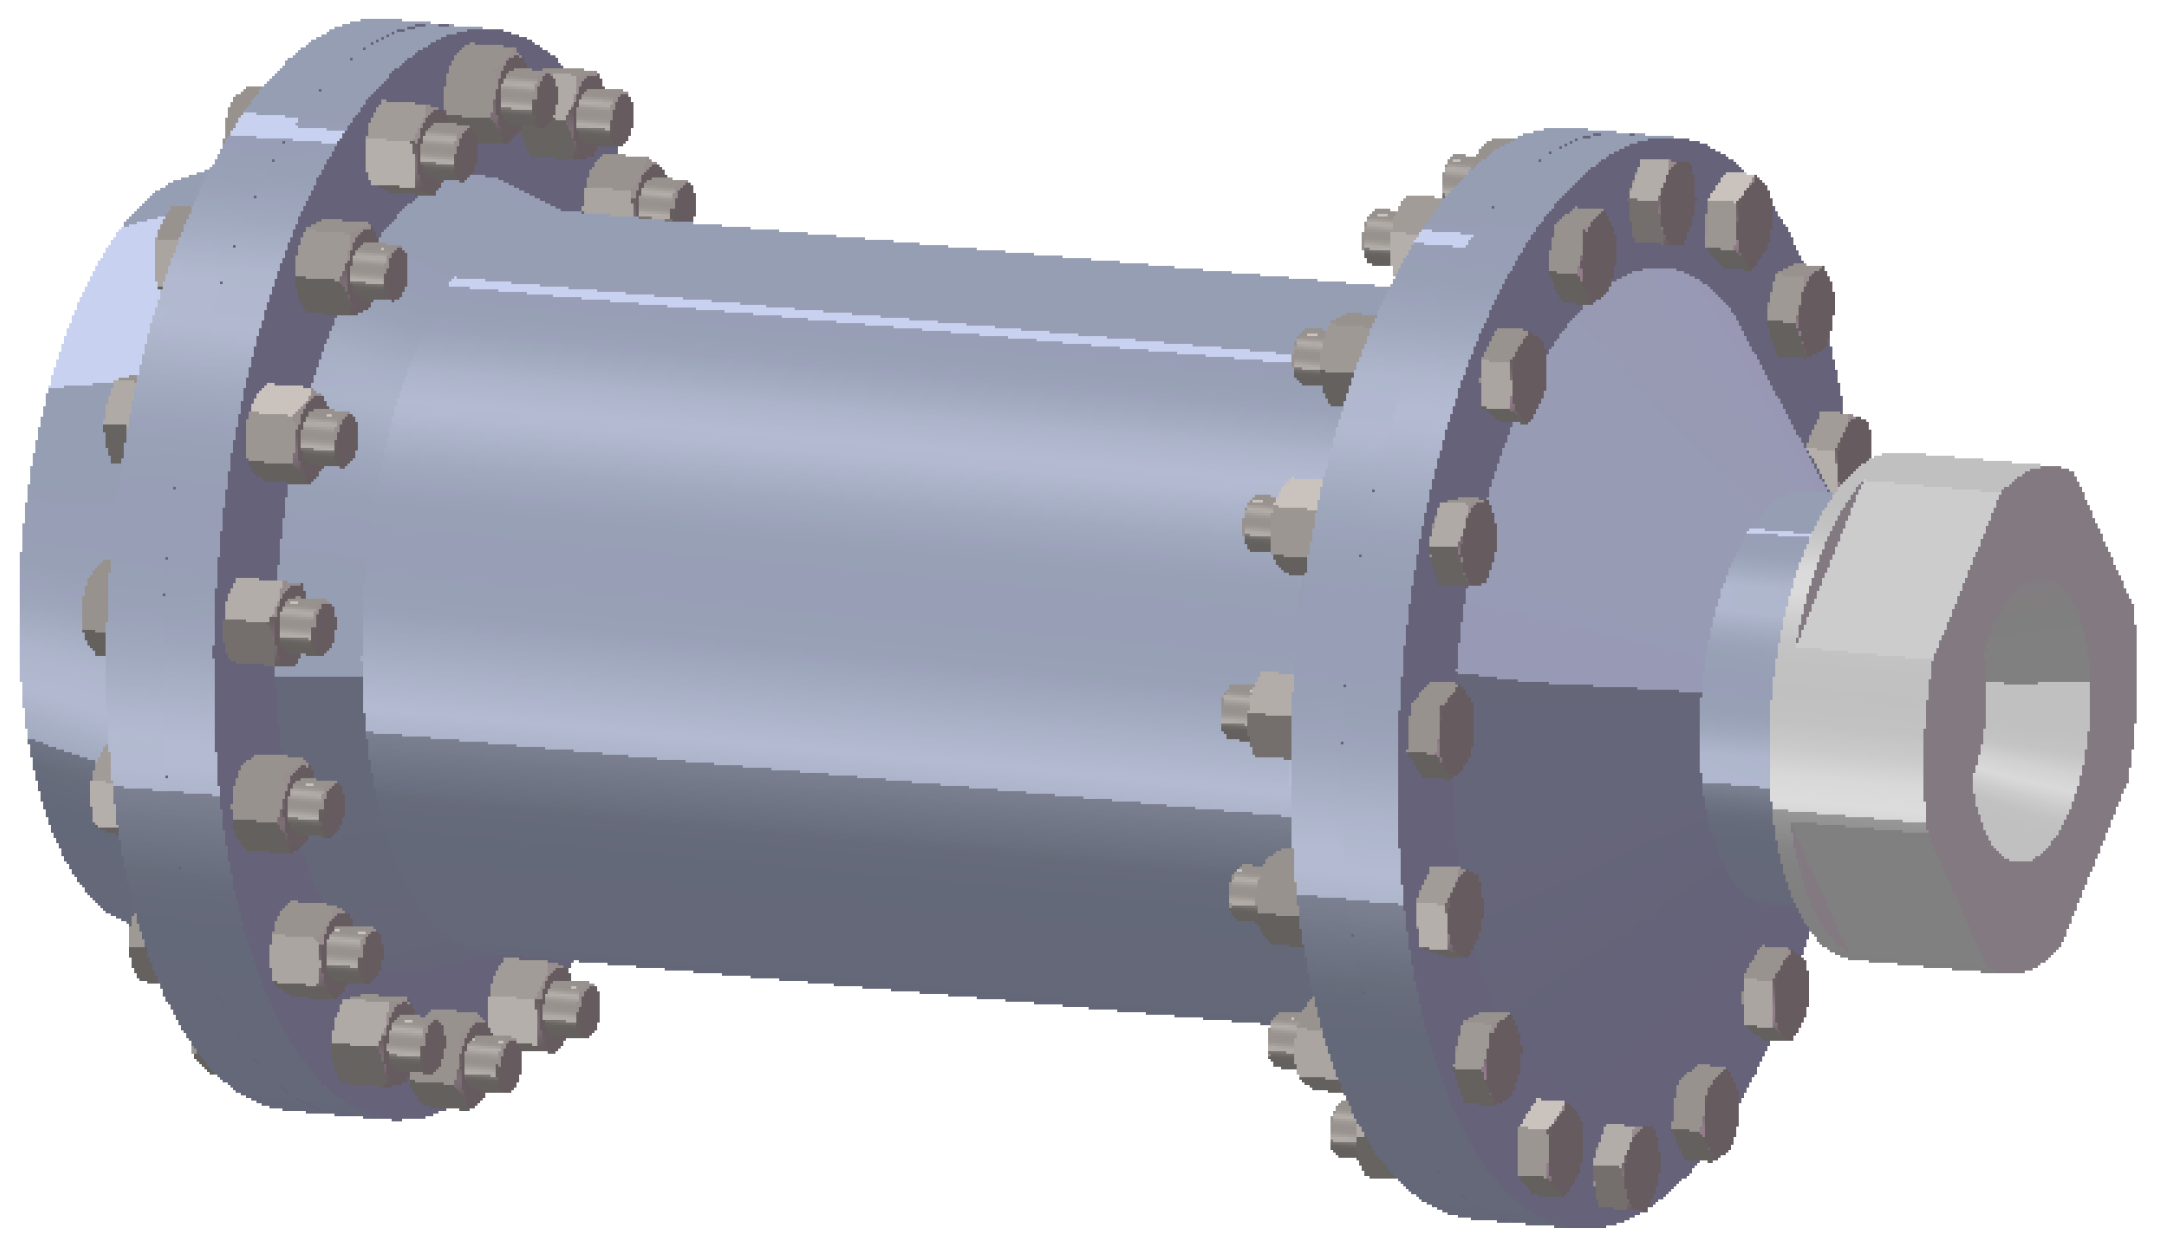
Figure 1. The designed gas generator.
Aerospace 11 00326 g001
Figure 2. Pressure curves across various temperature conditions.
Aerospace 11 00326 g002
Figure 3. A three-dimensional diagram of gear-shaped composite propellant.
Aerospace 11 00326 g003
Figure 4. Three-dimensional diagrams of grain at various regression times of burning surfaces: (a) Regress 5 mm; (b) Regress 7.5 mm; (c) Regress 10 mm; (d) Regress 12.5 mm; (e) Regress 15 mm; (f) Regress 17.5 mm; (g) Regress 20 mm; (h) Regress 22.5 mm.
Aerospace 11 00326 g004
Figure 5. Experimental pressure curves at normal temperature.
Aerospace 11 00326 g005
Figure 6. The pressure cloud diagrams of the combustion surface at various regression times at 323 K: (a) Regress 5 mm; (b) Regress 7.5 mm; (c) Regress 10 mm; (d) Regress 12.5 mm; (e) Regress 15 mm; (f) Regress 17.5 mm; (g) Regress 20 mm; (h) Regress 22.5 mm.
Aerospace 11 00326 g006
Figure 7. The pressure values of the inner and outer surfaces of the grain at various regression times of the burning surface at different temperatures.
Aerospace 11 00326 g007
Figure 8. The stress values of the grain at various regression times at different temperatures.
Aerospace 11 00326 g008
Figure 9. The buckling eigenvalues of grain at various regression moments at different temperatures.
Aerospace 11 00326 g009
Figure 10. Schematic of a non-ablative cladding layer.
Aerospace 11 00326 g010
Figure 11. The three-dimensional diagrams of the grain at different regression times of burning surfaces post-improvement: (a) Regress 5 mm; (b) Regress 7.5 mm; (c) Regress 10 mm; (d) Regress 12.5 mm; (e) Regress 15 mm; (f) Regress 17.5 mm; (g) Regress 20 mm; (h) Regress 22.5 mm.
Aerospace 11 00326 g011
Figure 12. The pressure cloud diagrams of the burning surfaces at various regression times at 323 K post-improvement: (a) Regress 5 mm; (b) Regress 7.5 mm; (c) Regress 10 mm; (d) Regress 12.5 mm; (e) Regress 15 mm; (f) Regress 17.5 mm; (g) Regress 20 mm; (h) Regress 22.5 mm.
Aerospace 11 00326 g012
Figure 13. The pressure values of the inner and outer surfaces of the grain at various regression times at different temperatures post-improvement.
Aerospace 11 00326 g013
Figure 14. The stress values of the grain at various regression times at different temperatures post-improvement.
Aerospace 11 00326 g014
Figure 15. The buckling eigenvalues of the grain at various regression times at different temperatures post-improvement.
Aerospace 11 00326 g015
Figure 16. Comparison of interior ballistic curves before and after high-temperature testing improvement.
Aerospace 11 00326 g016
Table 1. Parameters of the composite propellant and the gas.
ObjectsParametersValues
The composite propellantDensity/(kg/m3)1660
Burning rate under 10 MPa and 300 K/(mm/s)37
The pressure sensitivity coefficient n 0.3
The temperature sensitivity coefficient a T ¯ 0.0032
The gasThe total gas temperature Tc/(K)1380
The molecular weight/(g/mol)26.885
The specific heat capacity/(J/(Kg*K))2975.3
Table 2. Grid independence verification.
The Grid SizeNumber of GridsPressure Calculated by Simulation (MPa)
1.5 mm6,024,17812.51
2 mm4,208,42112.52
2.5 mm2,085,21612.51
3 mm1,090,03012.41
3.5 mm854,92712.29
4 mm722,31312.25
4.5 mm673,57712.25
5 mm573,43312.02
Table 3. Comparison of experimental and simulated pressure data.
The Ambient TemperaturePressure Calculated by Simulation (MPa)The Pressure Obtained from the Experiment (MPa)Error
283 K11.8912.686.2%
293 K12.5113.114.6%
323 K13.9514.614.5%
Table 4. Physical properties of the composite propellant at different temperatures.
The Ambient TemperatureThe Young’s Elastic Modulus (MPa)The Poisson’s RatioThe Ultimate Strength (MPa)
283 K150.4851.68
293 K80.4881.58
323 K30.4951.01
Disclaimer/Publisher’s Note: The statements, opinions and data contained in all publications are solely those of the individual author(s) and contributor(s) and not of MDPI and/or the editor(s). MDPI and/or the editor(s) disclaim responsibility for any injury to people or property resulting from any ideas, methods, instructions or products referred to in the content.