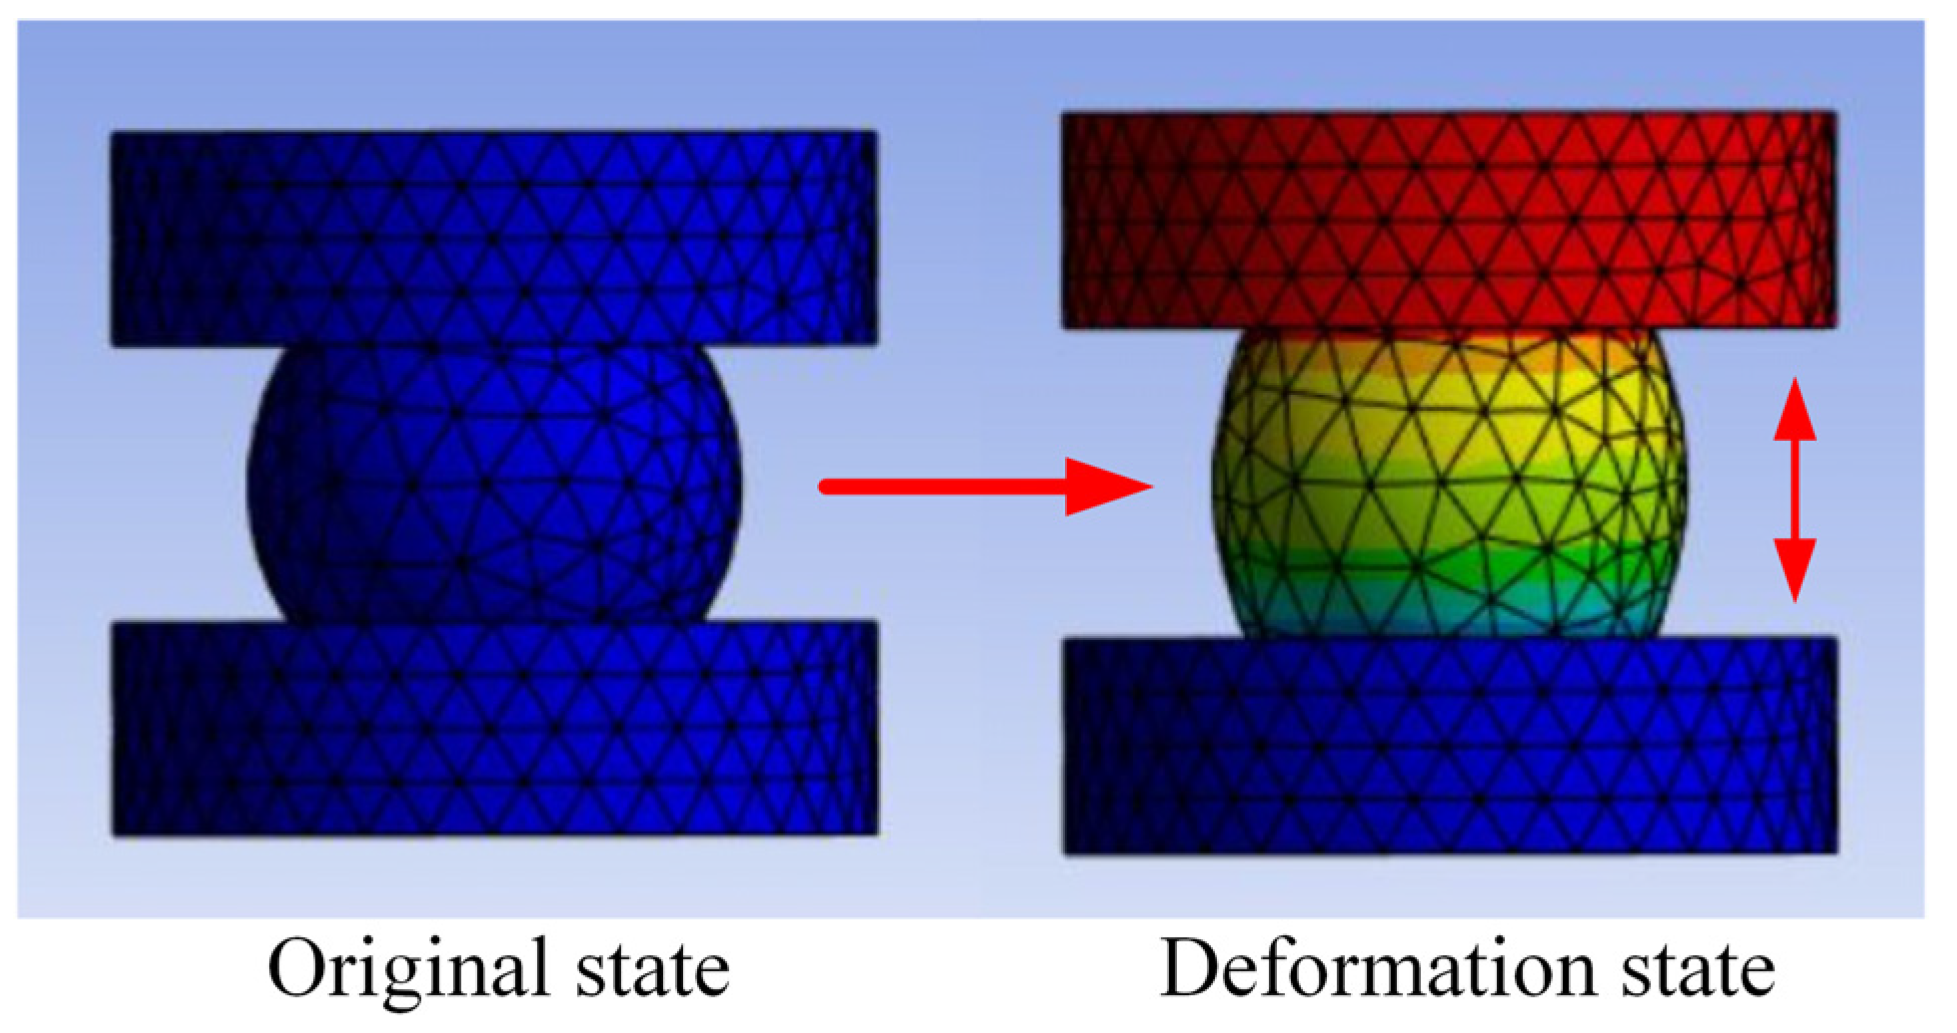
In practical applications, rubber ball compression exists in two compression states: static compression and dynamic compression. The overall structure exhibits dynamic stiffness and static stiffness. In the static state, there is no kinematic displacement difference between the moving mass of the CDVA and the main structure, and the contact state of the rubber ball does not change. The contact stiffness in this state is modeled and expressed by Hertzian contact theory. In the excited state, there is a displacement difference between the moving CDVA mass and the main structure, and this process breaks the compression state of the rubber ball in the static state, causing a change in the contact stiffness. The difference in displacement causes the rubber ball to produce an elastic recovery force in a static-to-dynamic transition over a period of time. During static compression, the rubber ball also generated a certain elastic restoring force due to its elastic–plastic properties, but the rubber ball was in equilibrium and the elastic restoring force was characterized by the contact stiffness. Therefore, to compensate for the excess of dynamic stiffness over static stiffness, the overall contact stiffness was corrected using a three-dimensional nonlinear elastic restoring force model for metal rubber materials.
3.1. Contact Stiffness
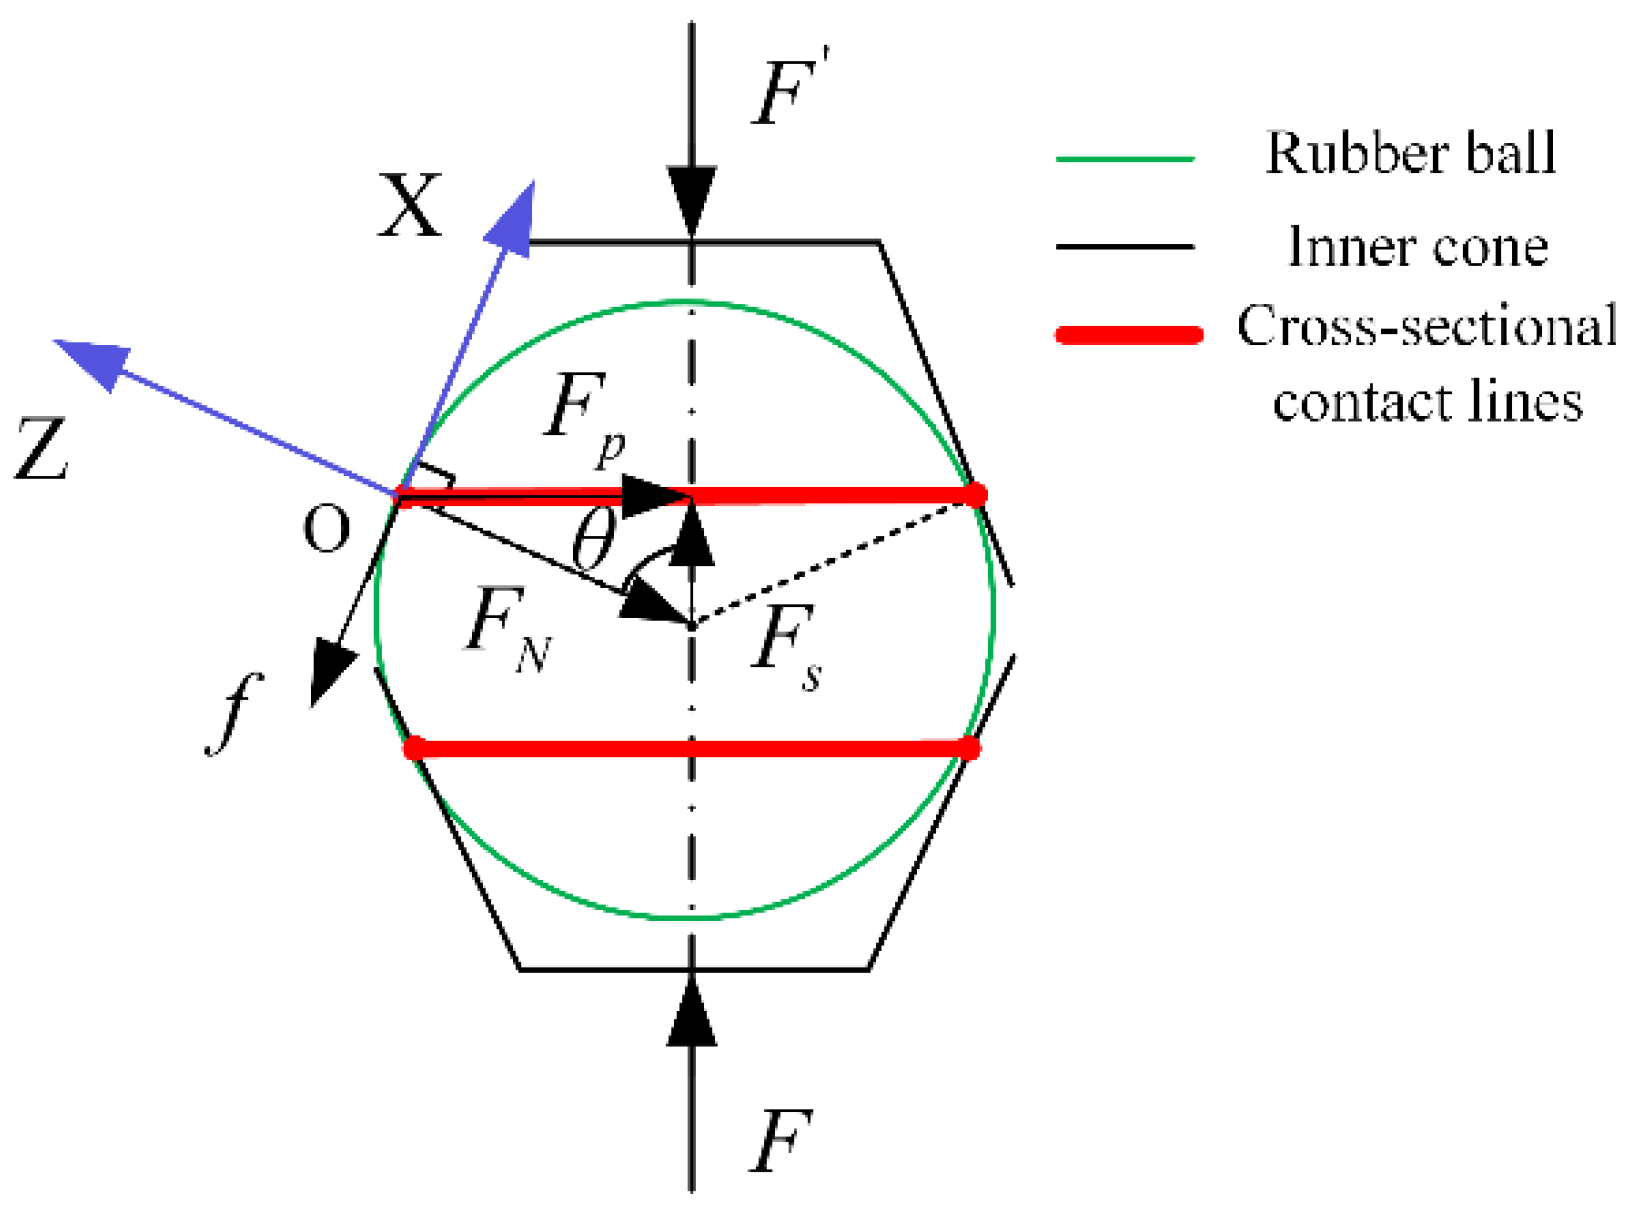
In this research, a theoretical model was developed based on contact mechanics and Hertz contact theory for the stiffness in the axial tension–compression mode produced by rubber ball contact. Some rubber ball modes can be excited to produce local resonance phenomena with the impact of high-frequency vibration, revealing a stiffness that is challenging to evaluate. Therefore, these higher-order modes were ignored. A diagram of the rubber ball in contact with the inner cone is shown in
Figure 3.
represents for the applied axial force,
is the reaction force,
is the normal force (force per unit circle length) on the contact line between the supporting inner cone and the rubber ball sphere, and
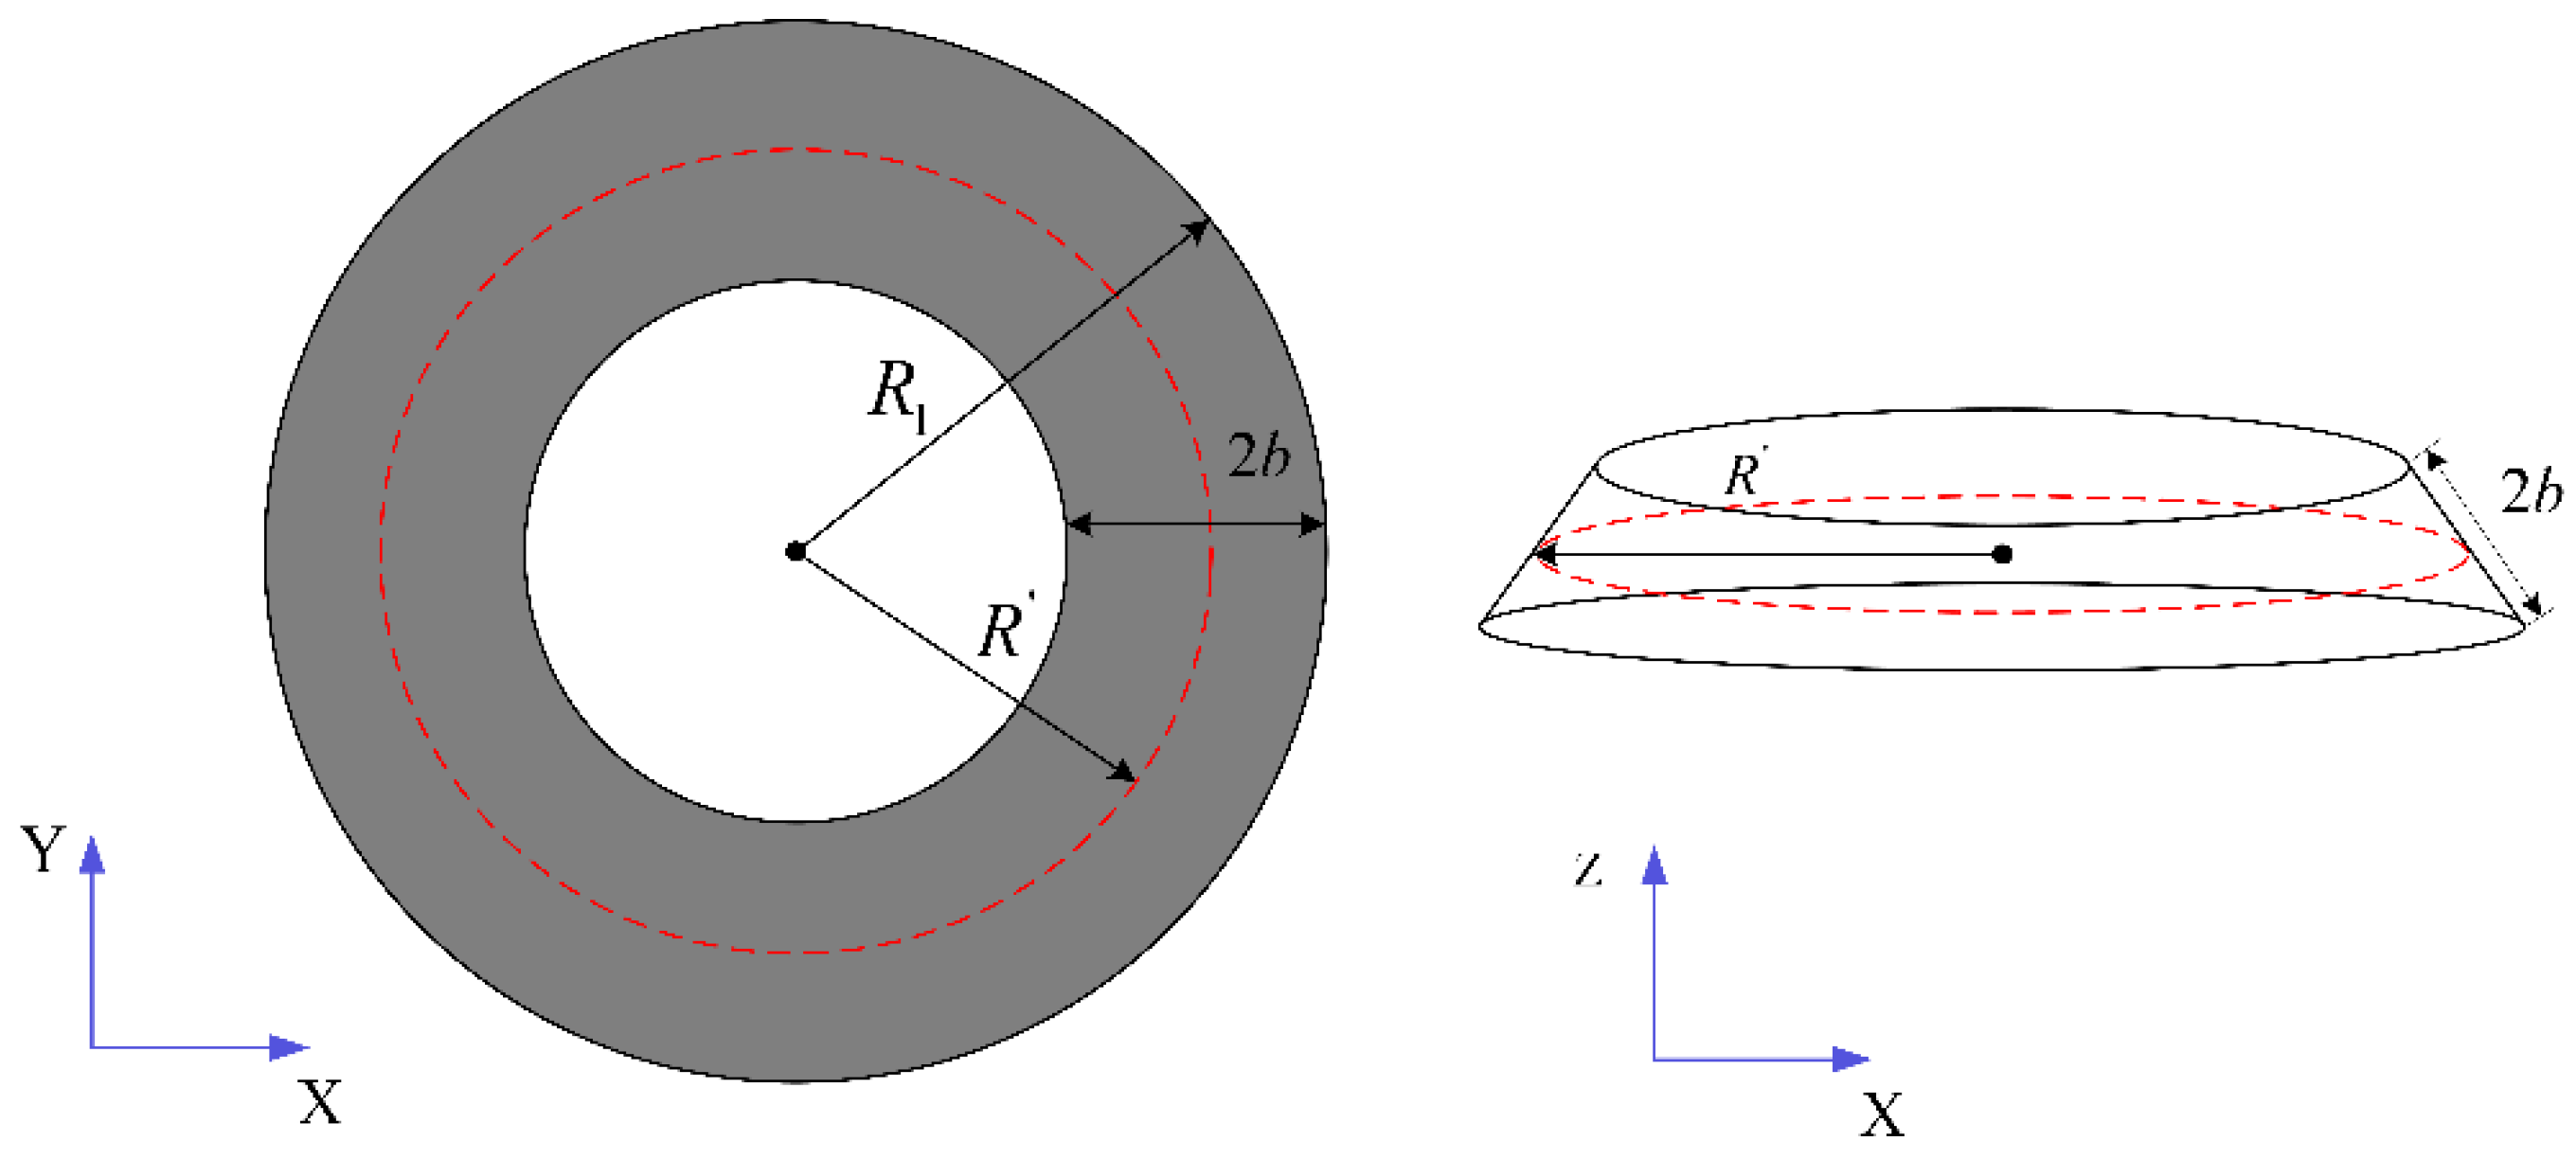
is the inner conical surface’s half-cone angle. The center of the contact area was used as the origin of the coordinates and the tangential and normal directions at the origin were used as the x and z axes, respectively, to establish a right-angle coordinate system. As the applied external force increased, the dynamic form of contact between the rubber ball and the inner conical surface changed from a linear contact to a conical ring with a surface. This was a non-coordinated contact mechanics problem. The contact deformation is shown in
Figure 4.
In
Figure 4,
is the radius of the rubber ball,
is the contact half-width of the conical belt ring, and
is the radius of the initial contact line.
Then, the relationship between
and
can be expressed as follows:
where
; then, we have
Letting the distribution function of the normal pressure on the contact surface be
, based on the Hertzian contact theory [
20,
21], the normal pressure distribution function on the contact surface can be expressed as follows:
where
is the equivalent modulus of elasticity,
.
,
,
and
are the moduli of elasticity and Poisson’s ratios of the main structure and the rubber ball, respectively.
The contact half-width of the conical ring belt surface is given by
The stress component generated by
at any point within the rubber ball is given by
In the contact mechanics formulation, Hooke’s law for plane strain for any contact surface pressure distribution yields the isotropic strain at any point in the entire rubber ball as
where
and
. The normal strain in the contact area of the rubber ball is expressed as follows:
The axial strain is given by
From Equations (1) to (9), the deflection–load relationship for the rubber ball can be derived without considering the effect of tangential friction. Differentiating this equation, the nonlinear stiffness produced by compression is given by
The rubber ball has two contact forms at the top and bottom with the same structural shape, and their stiffnesses are in series. The equation for calculating the total stiffness resulting from contact is expressed as follows:
The relationship between the modulus of elasticity and the rubber’s hardness value can be expressed, as in Equation (12) [
22], because hardness is frequently used to characterize the mechanical properties of rubber materials in engineering applications.
The contact stiffness can be obtained by combining Equations (1)–(12).
The effects of friction were omitted in the previously mentioned theoretical modeling, even though there was some friction present during application between the rubber and the structure’s contact surface. The value of the total contact stiffness would increase if the effect of friction was ignored. To decrease this margin of error, a stiffness correction factor
is presented in this paper. Additionally, in a rubber ball contact in the actual installation process, there will be a rubber ball axis and upper and lower contact surface connection axial misalignment of the situation, and these factors will ultimately cause the contact stiffness error. In this research, these factors are not considered. The actual contact stiffness is expressed as follows:
Figure 5 illustrates the contact stiffness variation curve obtained from a numerical simulation with each parameter adjustment.
In
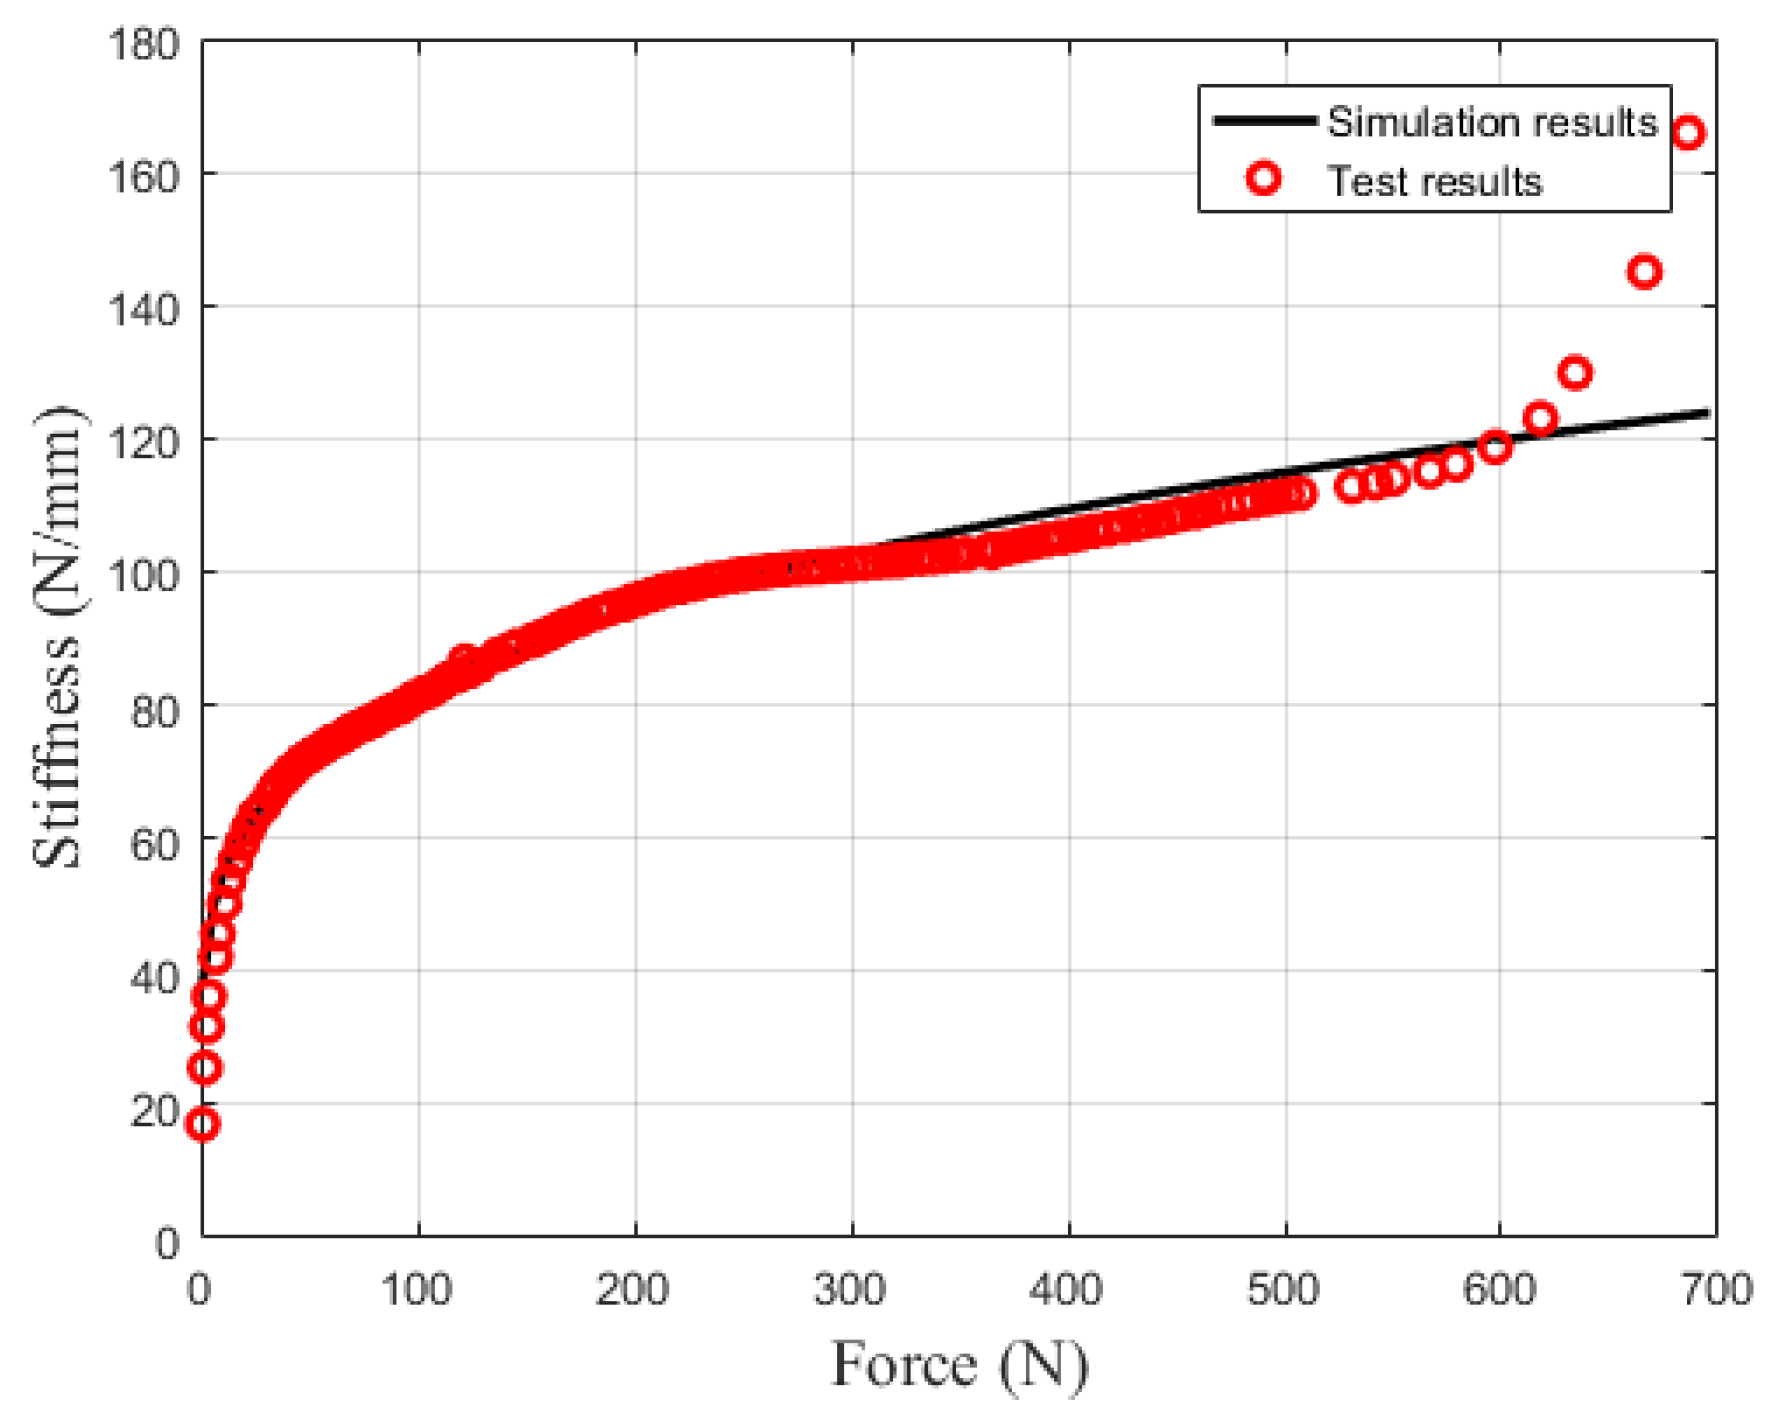
Figure 5, the contact stiffness curves resulting from each design factor exhibit nonlinear characteristics. As the compression force grew, as shown in
Figure 5a, the contact stiffness also increased, but the growth rate slowed down. As can be seen, the starting point of the stiffness coordinates does not begin at zero because even though the displacement normal to the contact zone was incredibly small, a certain amount of contact stiffness was generated when the rubber ball first made contact with the structure. The rubber ball and the structure were connected by contact, and both the contact region and the rubber ball had stiffness characteristics.
Figure 5b depicts a bifurcation in the rate of change in the contact stiffness with a variation in hardness, with a low rate of change in the stiffness in the hardness range of 0–80 and an exponential increase in stiffness in the 80–100 range. The overall stiffness fluctuated by large orders of magnitude, and the stiffness value was overly sensitive to changes in the hardness of the rubber ball in the 80–100 range. Furthermore, rubber ball hardness in actual engineering typically has a manufacturing variance of five hardness values, so it is not reasonable to use rubber ball hardness as an input for changes in stiffness. Similar to
Figure 5b, the change in contact stiffness caused by a change in the rubber ball radius had a large magnitude and a “concave” peak at the beginning of the change, making it harder to predict the stiffness in this range of values and reducing the overall controllable range. The curve for the change in contact stiffness with a half-cone angle in
Figure 5d roughly resembles a linear curve with an excellent degree of magnitude of variation. However, employing this value as an input to the stiffness variation would definitely result in multiple mechanical structural alterations to accommodate the variation in vibration, and would be less implementable. It is practical and logical to select the compression force as the input quantity for the stiffness change after considering the stability of the stiffness change generated by each parameter and the ease of implementation.
3.3. Two-Degree-of-Freedom Nonlinear Dynamics Model
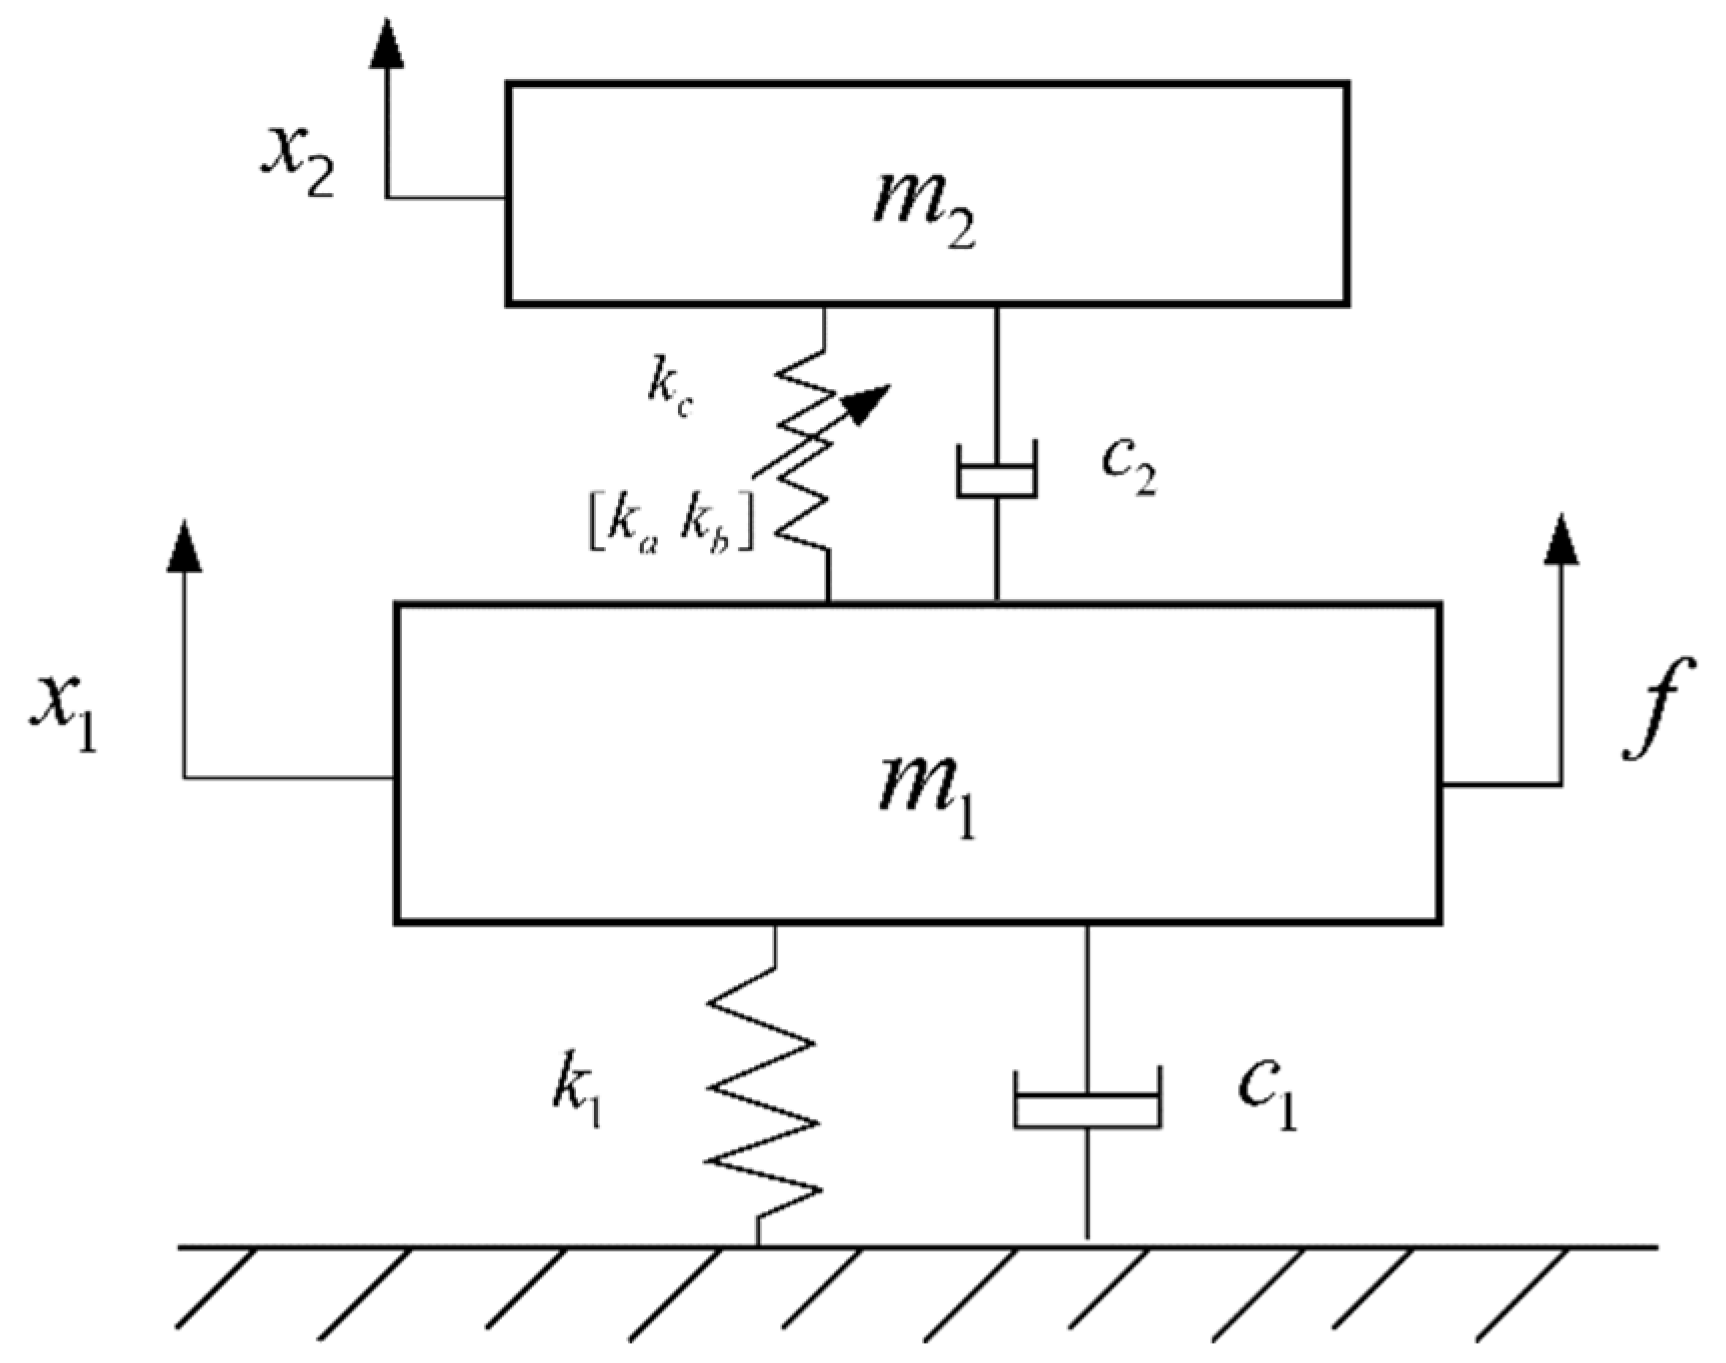
The equivalent dynamic model of the main vibration structure after the installation of the CDVA is shown in
Figure 6.
In
Figure 6,
is the mass of the main vibration structure,
is the mass of the dynamic vibration absorber,
is the contact stiffness produced by the compression of the rubber ball,
and
are elastic restoring force stiffness correlation coefficients,
is the damping of the main vibration structure,
is the damping of the rubber ball, that is, damping in the contact state, and
is the disturbance to the main structure.
The kinetic equations of the overall system are as follows:
Dimensionless quantities are introduced as follows:
Letting
be the new time measurement, then
. Equation (18) can be simplified as follows:
Then, letting
,
, and
, substituting these into Equation (19), and simplifying yield
The kinetic equation represented by Equation (20) is rewritten in matrix form as
where
In the kinetic equations, the nonlinear factors are reflected in both the contact stiffness term and the restoring force correlation term. Because it is difficult to find the analytical solution for the contact stiffness, it is replaced by a numerical solution expressed as an integral function. In this research, we focus on the influence of the nonlinear factors caused by the elastic restoring force of the rubber ball on the overall vibration absorption characteristics. In Equation (21), for the nonlinear factor
, the substitution of
can be expressed as
From Equation (22), it can be seen that the dynamic nonlinearity of the dynamic vibration absorber is related to the nonlinear term of the rubber ball’s restoring force stiffness, the excitation force applied to the main vibration structure and the stiffness of the main vibration structure. When the excitation amplitude of the main vibration structure is small or the stiffness of the main vibration structure is large, the overall dynamics show weak nonlinear characteristics. However, in practical engineering applications, the main vibration structure usually has a large structural stiffness, and the overall system exhibits excessively weak nonlinear characteristics. Therefore, the averaging method is used to solve the approximate response of the system dynamics.
The steady-state response of the main vibration structure after the installation of the CDVA is assumed to be
With respect to the time-slowing parameter,
, and
. To satisfy the requirements of the Van der Pol transformation and to obtain a functional form of the velocity similar to the linear case, the derivation of Equation (24) yields
The slow-change assumption is
Substituting Equations (24) and (25) into Equation (21) yields
Then, Equation (25) is multiplied by
, Equation (26) is multiplied by
, and the two resulting equations are added to obtain
Assuming that
and
are constants, Equation (27) is integrated over the interval of 0—
and averaged, as follows:
The following substitutions are made:
,
,
,
;
,
,
, and
. From Equation (28), we have
Similarly, Equation (25) is multiplied by
, Equation (26) is multiplied by
, and the two resulting equations are added to obtain
To obtain the steady-state solution of the system, Equations (29) and (30) must satisfy
. Subsequent simplification by combining the two equations yields
Equation (31) is a system of coupled nonlinear algebraic equations for
,
,
, and
, which can be solved numerically with respect to each parameter. There is then
and
, and Equation (31) is simplified and substituted into the two equations. Through a series of complex simplifications, the main vibration system steady-state response equation can be obtained as follows:
Equation (33) is a multiple algebraic equation solely for the steady-state response of the dynamic vibration absorber, and upon obtaining this equation, it can be substituted into Equation (32) to determine the steady-state response of the main vibration system. Since a single frequency of disturbance corresponds to multiple numerical solutions in nonlinear equations, it is essential to determine the amplitudes that can be achieved physically and to establish the stability of the solutions of the above nonlinear dynamic equation.
To analyze the stability of the solution, perturbation is carried out on Equations (29) and (30). The perturbed solution terms
and
are substituted into Equations (29) and (30), and the quadratic and higher-order terms are ignored. Then, the algebraic equation system that the amplitude and phase of the steady solution should satisfy can be obtained. The system of algebraic equations is transformed into the following form:
where
is the Jacobian matrix, given by
Based on the stability determination criterion, the stability analysis of the solution can be carried out by judging the eigenvalues of the Jacobian matrix of the system, and all the eigenvalues of the real part of the eigenvalues are negative which indicates that the constant solution is asymptotically stable [
26].
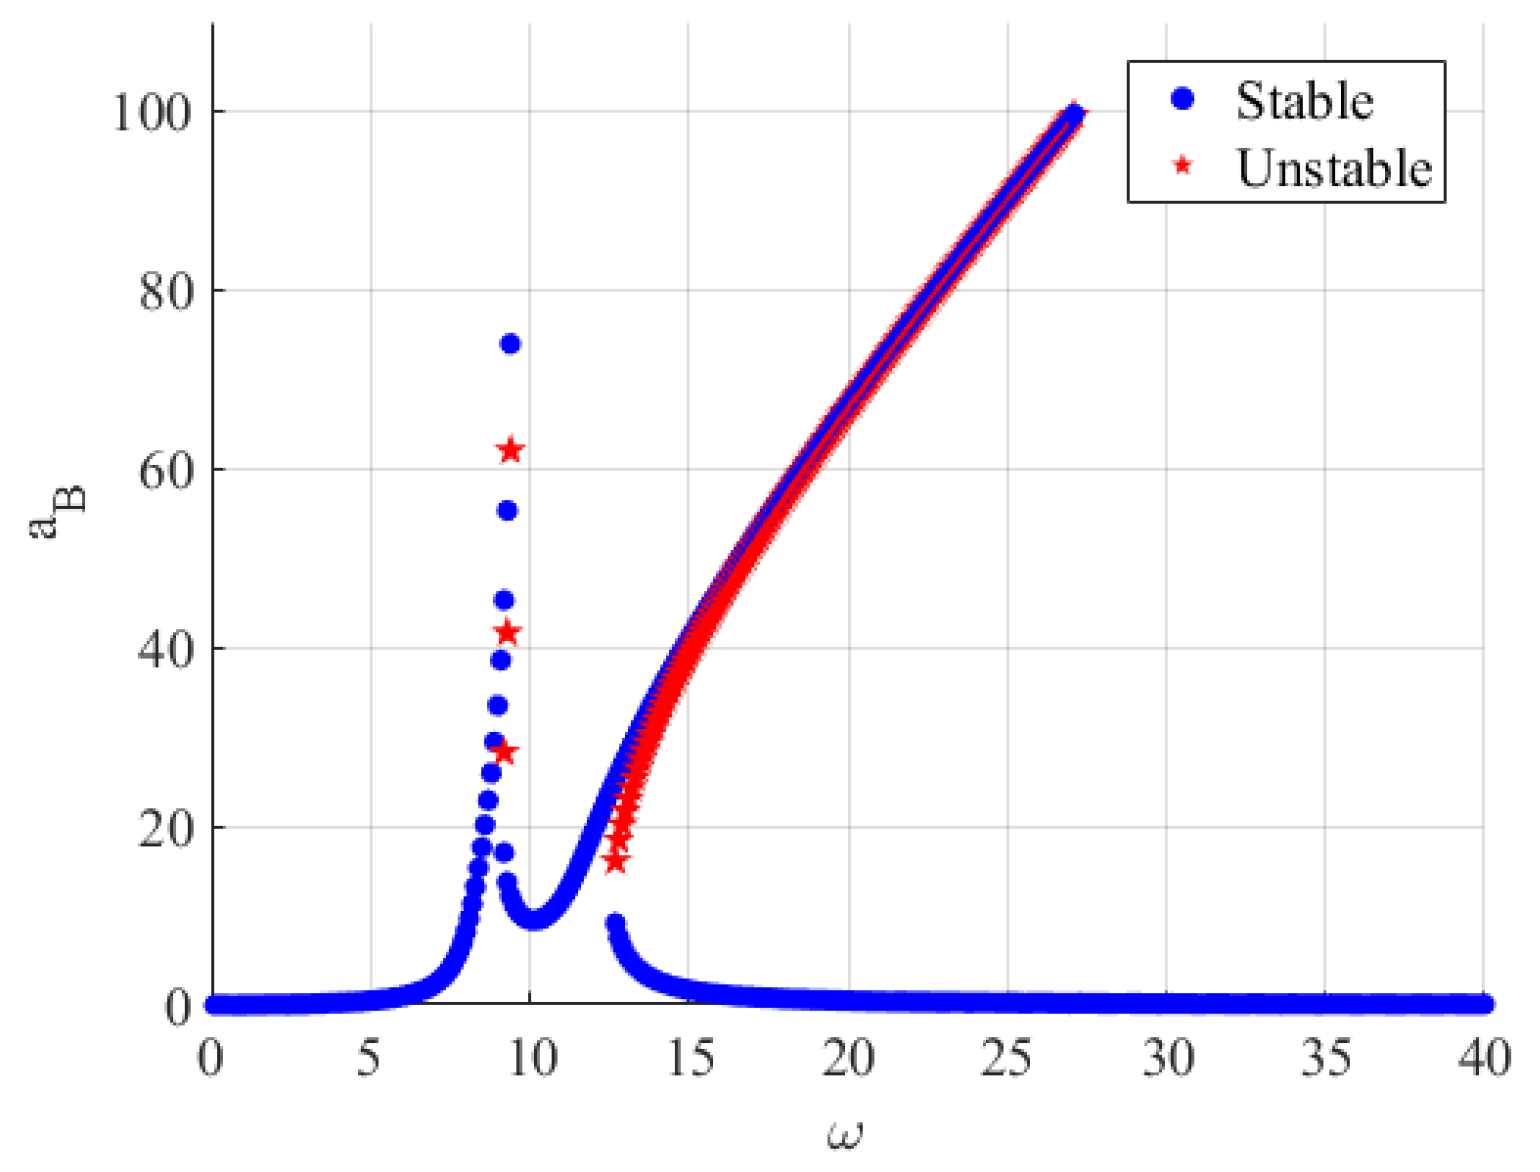
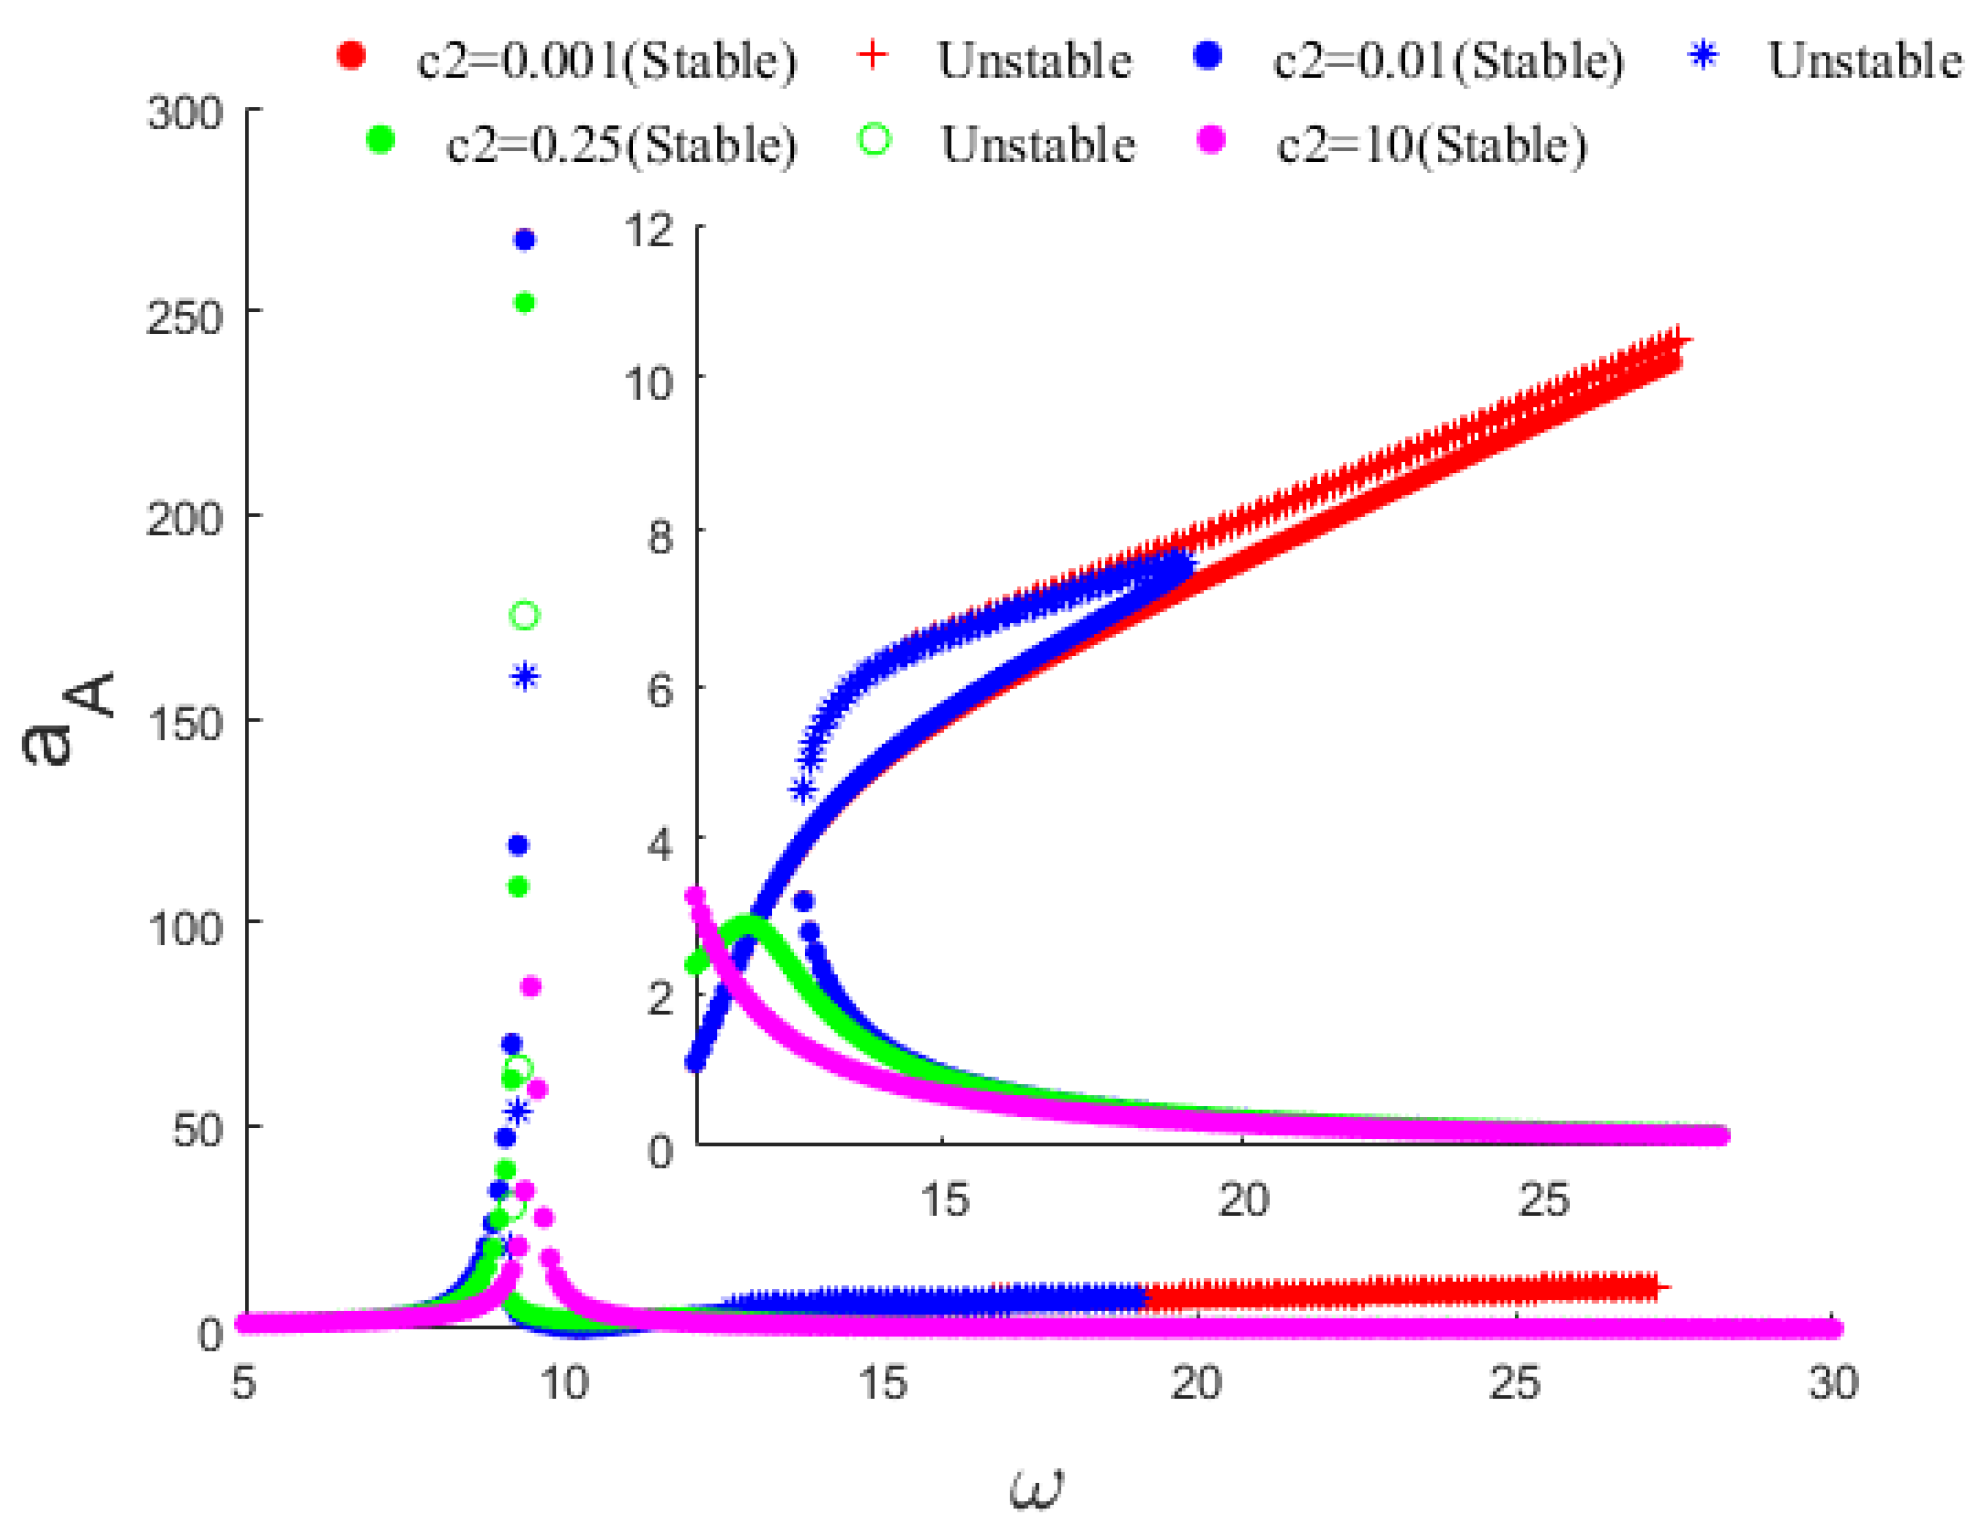
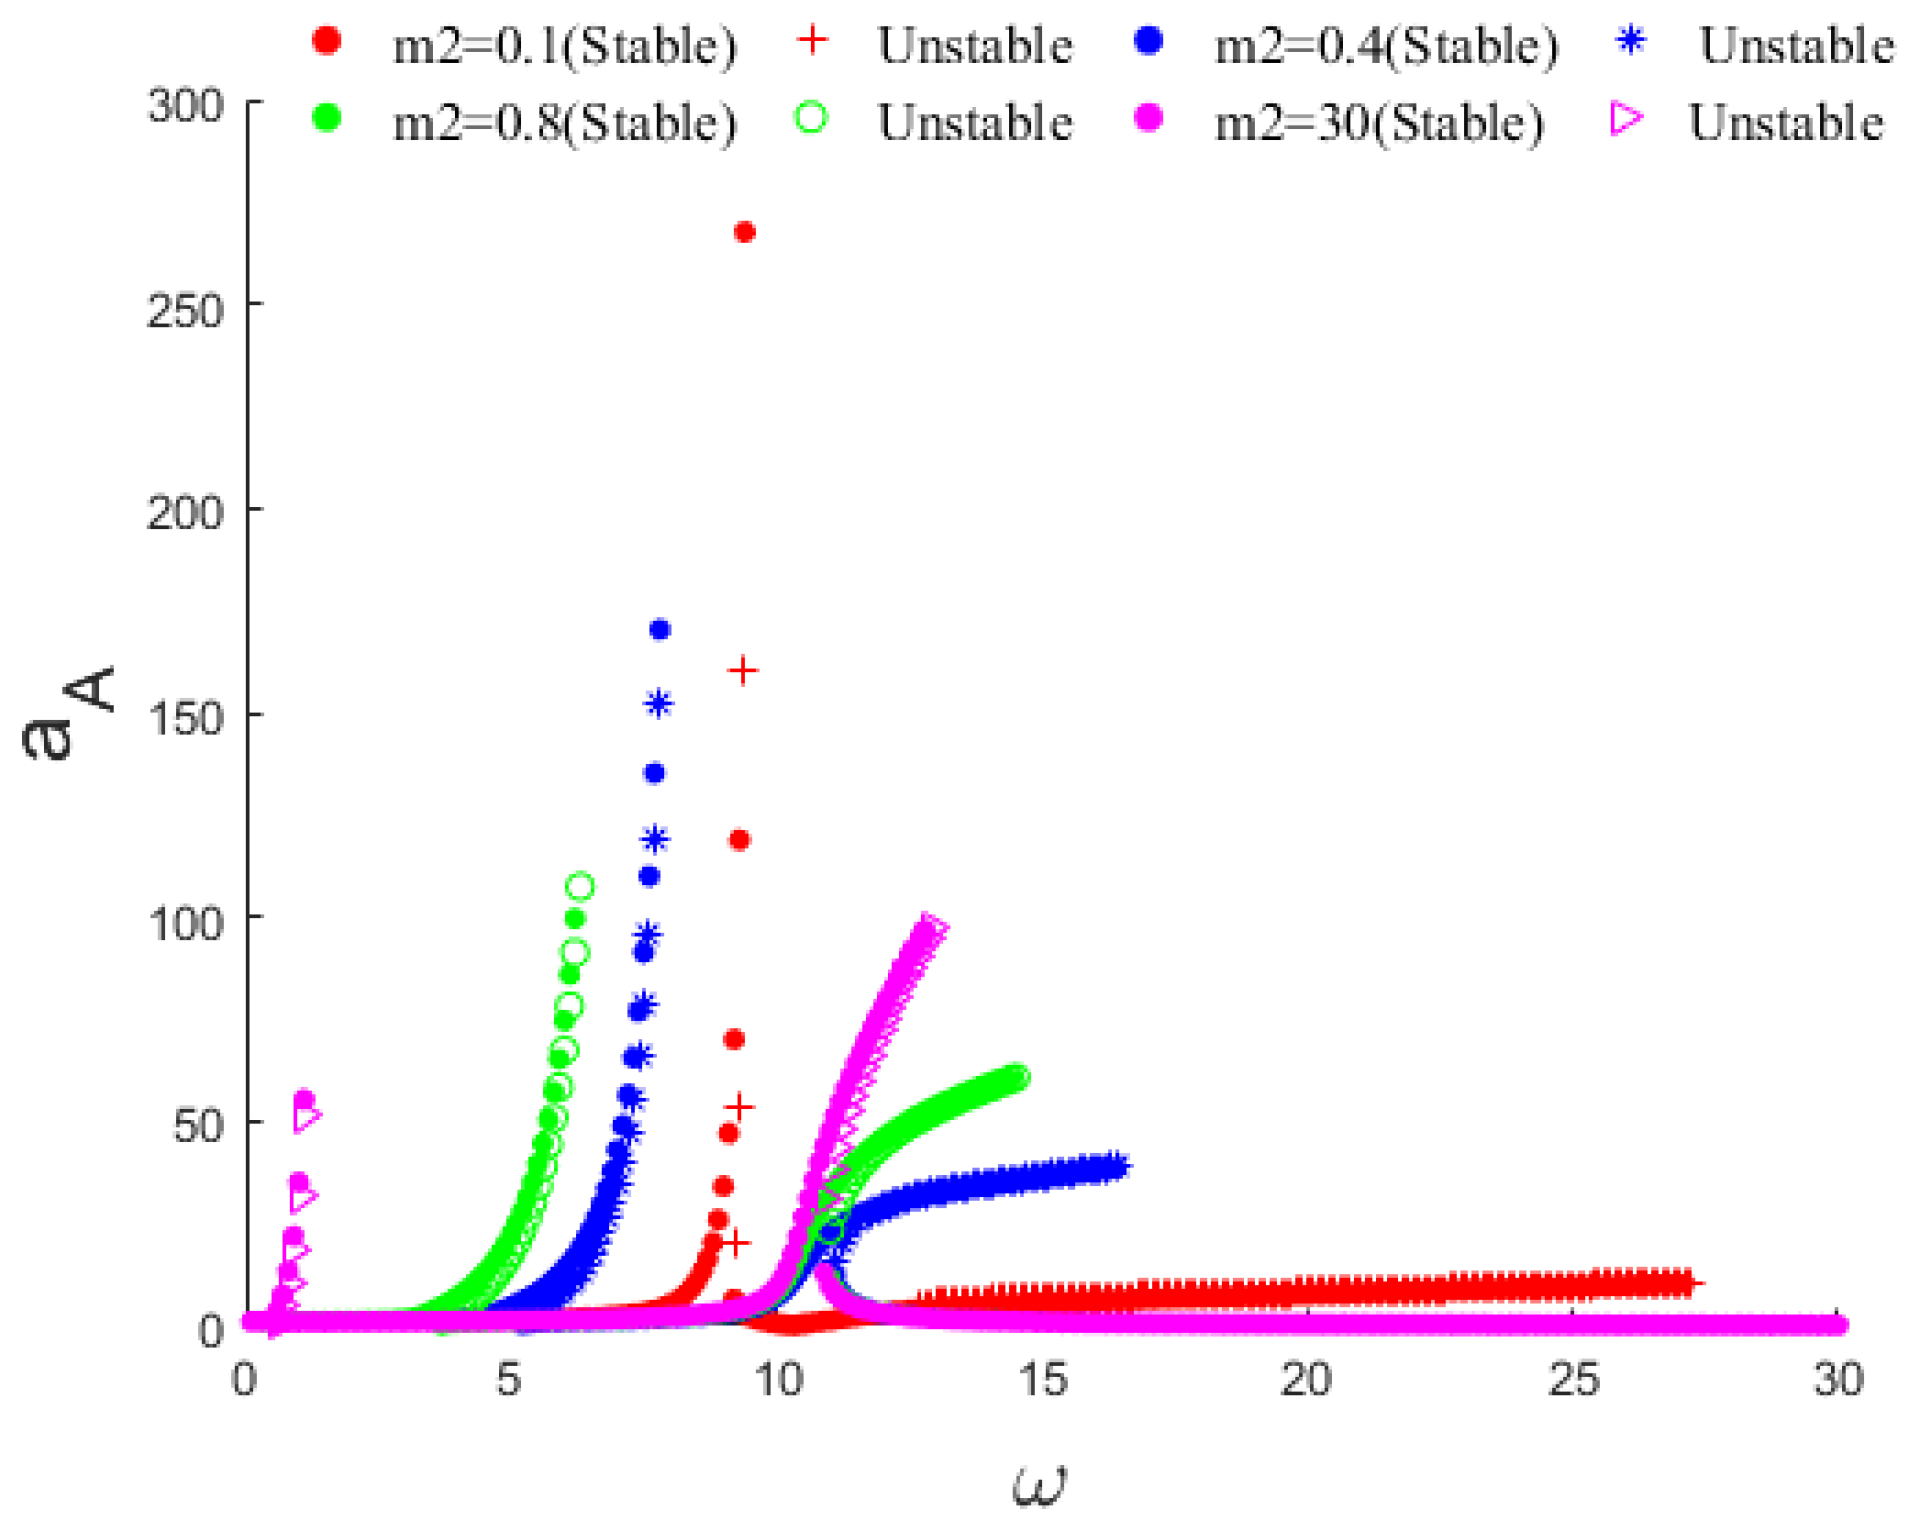
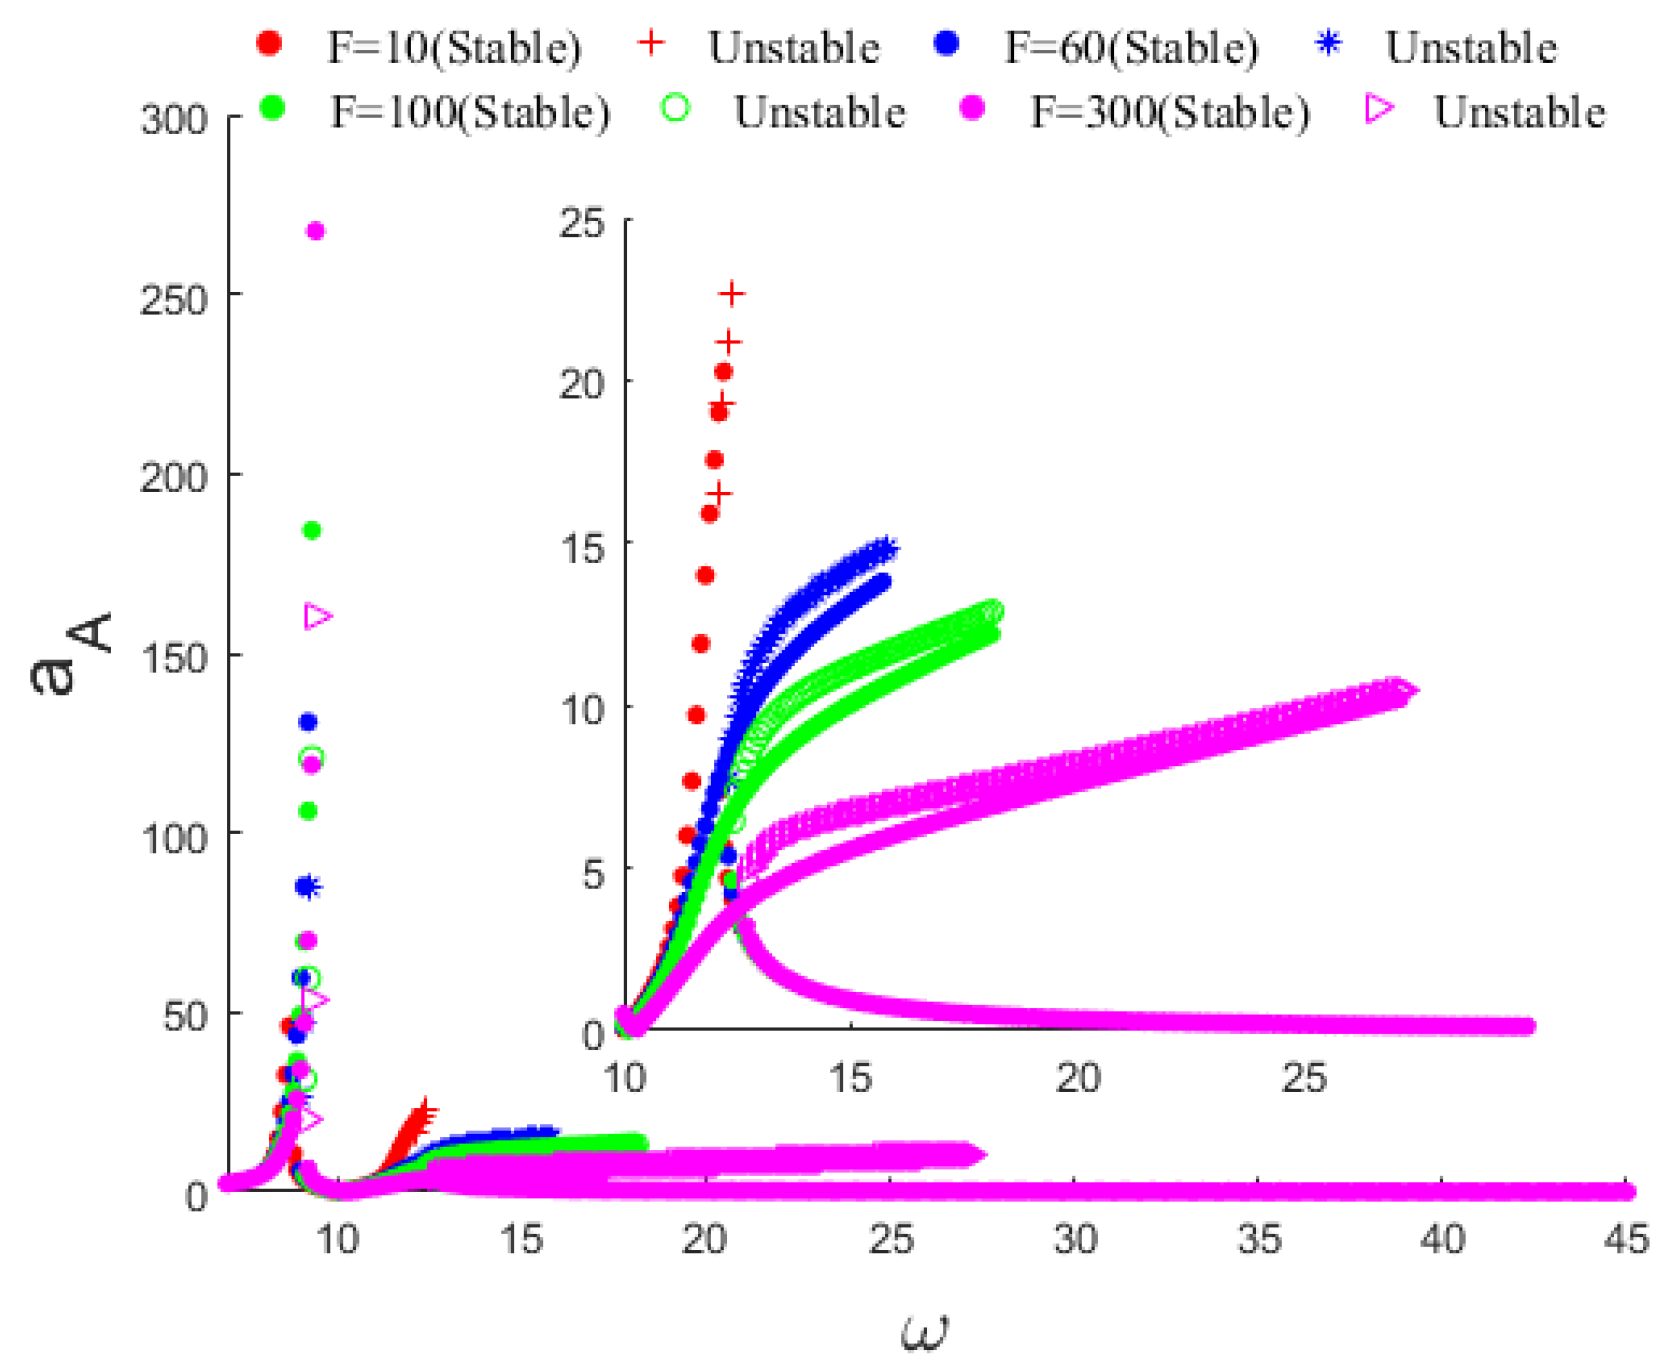
In this research, we used the vpasolve function in MATLAB to solve the dynamical equations of the coupled nonlinear system represented by Equations (32) and (33). The vpasolve function supports the numerical solution of polynomial functions and randomly selects initial values to obtain all numerical solutions within the prescribed range, making it a suitable technique for solving the coupled nonlinear system of equations in question. The frequency response curves for both the main vibration structure and the dynamic vibration absorber are shown in
Figure 7 and
Figure 8, which depict the stable and unstable points of the response amplitude for the specified parameters, which can be found in
Table 3.
From the frequency response diagrams of the main vibration structure and the dynamic vibration absorber, it can be seen that for the vibration excitation, the first-order modal vibration frequency response exhibits a “soft” stiffness nonlinear characteristic, while the second-order modal vibration frequency response exhibits a “hard” stiffness nonlinear characteristic. The overall frequency response curve shows obvious amplitude jumps and an unstable response. Similar phenomena of nonlinear characterization can also be observed in the literature [
27,
28,
29].
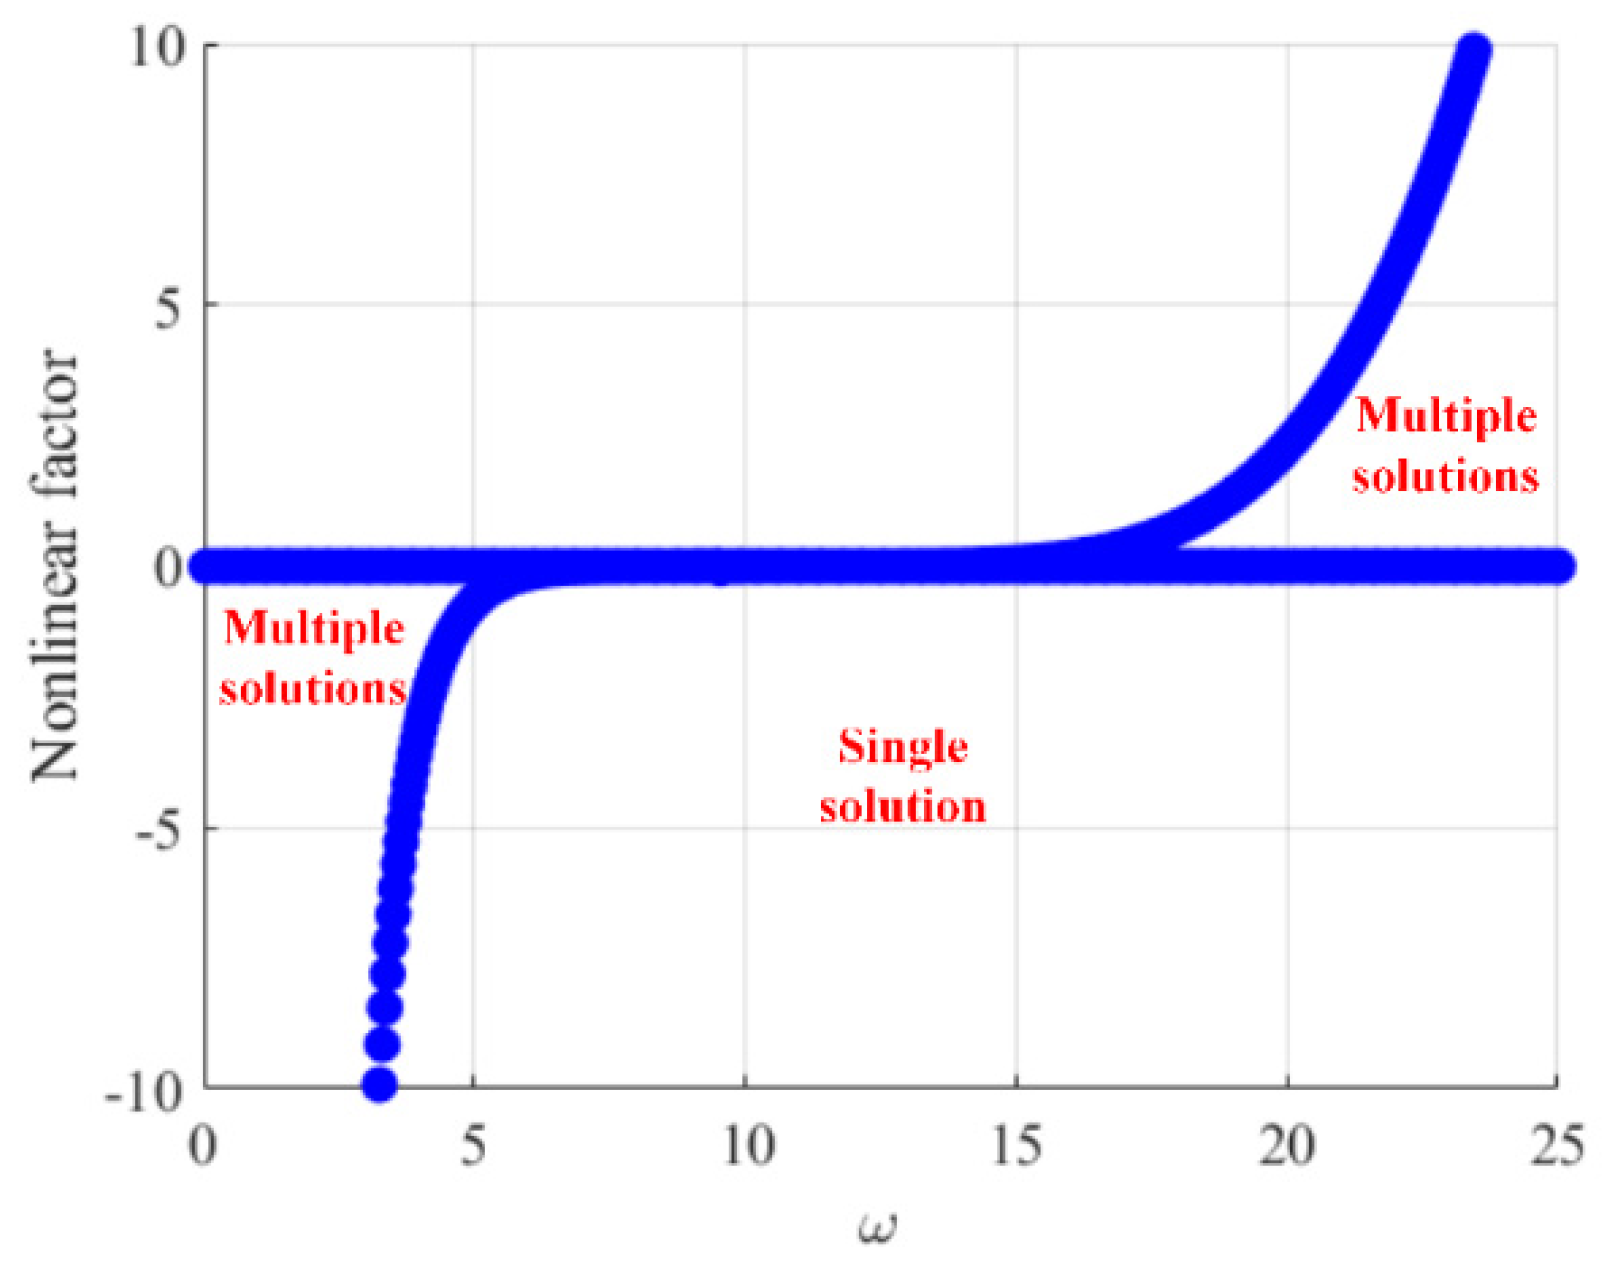
In the process of solving the system of nonlinear equations, we observed that there were both single and triple solutions for the vibration amplitude solution of the main vibration structure. This can also be seen in the above frequency response curves, indicating that the response of the main vibration system exhibited the saddle-knot bifurcation characteristic. The saddle-knot bifurcation diagram is shown in
Figure 9. This diagram was used to analyze the stability, as well as the variability properties of the solution.
As shown in
Figure 9, in the region of the curve encompassed by the excitation frequency and the corresponding nonlinear factor, there were three solutions for the displacement of the main vibration structure. In the other regions, there was only a single solution, which was consistent with the phenomenon shown in the frequency response curves. As the excitation frequency increased, the saddle-knot bifurcation condition was in the “single solution” region for the system’s own intrinsic property conditions, and the response of the main vibration structure continued to increase. When the amplitude solution of the main vibration structure reached the first saddle node, the structural response became unstable as a result of the bifurcation phenomenon. The saddle-node bifurcation condition then reached the “multi-solution” region, and the amplitude of the main vibration structure decreased sharply. Subsequently, the main vibration structure response “jumped” to the next stable region, representing the saddle-node bifurcation condition in the “single solution” region. As the frequency of excitation increased, the displacement response of the main vibration structure rose to its second peak after a brief decline. Subsequently, the entire system response reached the second saddle node. The structural response jumped to another unstable state and the saddle-node bifurcation condition came to another “multi-solution” region, where the system response amplitude jumped in the opposite direction (in the direction of decreasing frequency) to a stable point and thereafter ended at the second saddle node. Immediately after this, the response of the system during stabilization decreased in amplitude as the excitation frequency increased and eventually stabilized.

