Abstract
The spray and combustion characteristics of a gas-centered swirl coaxial (GCSC) injector used in oxidizer-rich staged combustion cycle engines were analyzed. The study focused on varying the recess ratio, presence of gas swirl, and swirl direction to improve injector performance. The impact of the recess ratio was assessed by increasing it for gas jet-type injectors with varying momentum ratios. Gas-swirl effects were studied by comparing injectors with and without swirl against a baseline of a low recess ratio gas injection. In atmospheric pressure-spray experiments, injector performance was assessed using backlight photography, cross-sectional imaging with a structured laser illumination planar imaging technique (SLIPI), and droplet analysis using ParticleMaster. Increasing the recess ratio led to reduced spray angle and droplet size, and trends of gas swirl-type injectors were similar to those of high recess ratio gas jet-type injectors. Combustion tests involved fabricating combustion chamber heads equipped with identical injectors, varying only the injector type. Oxidizer-rich combustion gas, produced by a pre-burner, and kerosene served as propellants. Combustion characteristics, including characteristic velocity, combustion efficiency, and heat flux, were evaluated. Elevated recess ratios correlated with increased characteristic velocity and reduced differences in the momentum–flux ratios of injectors. However, increasing the recess ratio yielded diminishing returns on combustion efficiency enhancement beyond a certain threshold. Gas swirling did not augment characteristic velocity but notably influenced heat flux distribution. The trends observed in spray tests were related to combustion characteristics regarding heat flux and combustion efficiency. Additionally, it was possible to estimate changes in the location and shape of the flame according to the characteristics of the injector.
1. Introduction
The bipropellant liquid rocket engine uses both an oxidizer and fuel as its propellant components, facilitating the design of various engine types [1]. Among these, the staged combustion cycle engine, employing turbo pumps, is notable for its high efficiency in rocket propulsion. In this configuration, the combustion gas from the pre-burner, which drives the turbo pump, serves as one of the propellants for the main combustion chamber, resulting in a combination of liquid and gas propellants supplied to the main combustion chamber [2,3]. In staged-combustion-cycle engines using hydrogen, gas-phase fuel-rich combustion gas and liquid-phase oxygen are typically supplied to the combustion chamber. Conversely, when kerosene is the chosen fuel, oxidizer-rich combustion gas in the gas phase and kerosene in the liquid phase are supplied to the combustion chamber [4]. Besides the staged combustion cycle, a combination of liquid and gas phase propellants is supplied to the main combustion chamber in scenarios employing an expander cycle, where the regenerative cooling of the combustion chamber operates at high temperatures [5]. The performance of fuel and oxidizer sprays, with the evaporation [6,7] and ignition of droplets [8,9] within the combustion chamber, significantly influence combustion efficiency. Consequently, the meticulous design of the injector [10], responsible for determining these spray characteristics, holds paramount importance. Injectors, facilitating the injection of both gas and liquid, can be categorized as collision or coaxial types, depending on the coaxial alignment of their nozzles. Coaxial injectors further subdivide into shear coaxial, gas-centered swirl coaxial (GCSC) injector, and liquid-centered swirl coaxial injector (LCSC) [11,12], based on the presence of swirl in the supplied propellant and the phase of the central nozzle.
In a GCSC injector, the gas and liquid nozzles are coaxially arranged, with gas injection occurring along the central axis while liquid swirls are supplied from a tangential hole around the gas nozzle. Extensive studies on GCSC injectors have been predominantly conducted in Russia and China, where expertise in developing staged combustion cycle engines using kerosene exists. Key factors influencing the characteristics of these injectors include the liquid swirl number, gas–liquid momentum–flux ratio, and recess length [12,13,14,15]. Research concerning injector characteristics has employed various experimental and numerical analysis methodologies [16]. Broadly, research direction encompasses analyses of steady-state performance and investigations into dynamic stability [17]. Experimental studies have assumed diverse forms, such as spray tests using surrogate fluids, spray tests employing actual propellants, and combustion tests. Im et al. [12] investigated spray-characteristic disparities between GCSC and LCSC injectors among coaxial injectors variants, employing gas–liquid momentum–flux ratio and recess ratio as variables in atmospheric-pressure spray tests. Variance in spray angle and droplet size distribution were noted, with LCSC injectors demonstrating self-pulsion traits under specific conditions. Anand et al. [18] examined changes in spray angle and droplet size concerning variations in swirl number and recess ratio under various momentum–flux ratios, evaluating the influence of variables. Canino et al. [19] analyzed the unsteady hydrodynamic characteristics of GCSC injectors using a numerical method and examined the influence of gas and liquid properties and geometry. Yang et al. [20] investigated droplet alternations with changes in the recess ratio of gas–liquid coaxial injectors using high-speed camera observation. Gao et al. [21] observed the spray modifications under high ambient-pressure conditions at the injector outlet through the change of breakup length and spray angle by theoretical, experimental, and numerical methods. Balance et al. [22] visualized the combustion field in a small-combustor experiment employing a gaseous oxygen–liquid kerosene propellant to observe flame shape and behavior. Wagner et al. [23] examined combustion-characteristic variations with changes in liquid swirl angle and recess ratio in a single-combustor combustion test of a GCSC injector.
Previous studies on GCSC injectors have emphasized design parameters such as the momentum–flux ratio and recess ratio as pivotal factors, leading to single-injector-level spray or combustion experiments. However, limited research has explored the relationship between spray and combustion characteristics through combustion tests closely simulating actual staged-combustion-cycle engine conditions using kerosene-oxidizer-rich combustion gas as a propellant. Moreover, studies confirming the influence of key parameters on combustion efficiency in actual combustion tests are lacking. In a previous study involving the author of [24], combustion performance was evaluated using a combustion chamber with varying injector momentum–flux ratios in a full-scale engine employing an oxidizer-rich staged-combustion cycle. However, isolating the impact of the injector was challenging due to the influences from factors like injector count, arrangement, regenerative cooling, and film cooling. Therefore, the author conducted another study [25] to examine the combustion characteristics of a reduced combustion chamber using only two injectors to validate increased combustion efficiency with a rising momentum–flux ratio. The study found that the rate of increase in combustion efficiency sharply declined based on the specific momentum ratio as approximately 23–25. Consequently, this study investigated an additional approach to enhance combustion efficiency by varying the recess ratio—a key parameter determining GCSC injector characteristics, with the previously identified momentum–flux ratio. Hence, the effect of elongating the recess length using injectors with differing momentum ratios was explored. Furthermore, the presence and direction of gas swirl were anticipated to exert a similar effect as the recess ratio owing to increased mixing and momentum transfer between gas and liquid phases. The relationship between spray test outcomes and combustion efficiency concerning injector shape alterations was analyzed.
2. Experimental Condition and Method
2.1. Experimental Condition
The experiment used four injector types, as shown in Figure 1. Given that the GCSC injector mixes gas and liquid within a designated length denoted as before expelling it from the injector outlet for combustion, the recess length emerges as a crucial shape variable significantly impacting combustion performance [18]. The recess length is defined as the dimensionless recess ratio (see Equation (1)). The recess ratio for the A-Jet and B-Jet injectors ranged from 0.5 to 2.5 as a primary design parameter, with subsequent characteristic variations being studied accordingly.
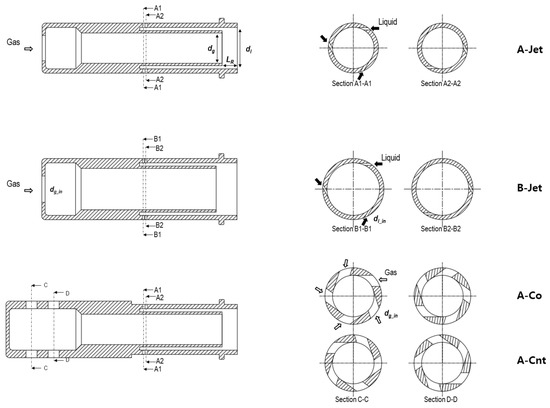
Figure 1.
Injector configuration and geometry.
Gases of all injectors were introduced through the central gas nozzle, whereas liquid was supplied through a tangential hole, creating a swirling flow within the annular space surrounding the gas nozzle. The liquid nozzle was configured as an open-type nozzle with the same diameter as the injector outlet, housing the inlet of the tangential hole. In the A and B-Jets, gas was injected into the central nozzle as a jet, with the momentum–flux ratio at the rated flow rate differing due to variations in gas-nozzle diameter. Consequently, the study aimed to elucidate the impact of changing recess ratios in injectors with differing momentum ratios. Conversely, gas injection in A-Co and A-Cnt injectors occurred as a swirl owing to its delivery through a tangential hole. To confirm the performance improvement due to the swirl of the gas without increasing the recess ratio, the recess ratio was fixed at 0.5, the smallest of the design conditions, and the characteristic change according to the presence and direction of the swirl was confirmed compared with A-Jet.
Table 1 presents the injector configuration. The momentum ratios of the A-Jet and B-Jet injectors, selected owing to their significant differences in momentum ratio among the injectors used in our previous study [25], are highlighted. The momentum ratio was calculated using the following equation: . The gas and liquid flow rates at the gas-nozzle exit were computed as follows: . The thickness of the liquid film for flow-rate determination was obtained using the open-type swirl injector-film thickness equation proposed by Fu et al. [13], which is expressed as follows:

Table 1.
Injector configuration.
Considering the rated conditions of the combustion test, with oxidizer-rich combustion gas mass flow rate and density at approximately 0.50 kg/s and 28 kg/m3, respectively, and fuel mass flow rate and density at approximately 0.16 kg/s and 728 kg/m3, respectively, the expected momentum ratio for each injector was calculated as . Subsequently, spray tests were conducted accordingly. Because the water flow test was performed under atmospheric pressure, the water flow rate was approximately 33% of the rated fuel flow rate used in the combustion test to ensure the gas speed did not reach supersonic levels under the stated conditions. Table 2 outlines the experimental conditions for the water flow and combustion tests.

Table 2.
Experimental conditions.
2.2. Experimental Method
The apparatus for the atmospheric pressure spray test is depicted in the image on the left side of Figure 2. The fluids used were compressed air and water—simulating oxidizer-rich combustion gas and kerosene, the actual combustion-test propellant. Water and air were stored in a high-pressure tank pressurized with compressed air, with a controller installed on the supply line to maintain a consistent and stable flow rate as per the test conditions. Liquid- and gas-flow rates were measured using a flow meter (S-flow; Alicat Scientific, USA). A digital camera (Canon EOS 6D, Japan, 6240 × 4160 pixels) with a stroboscopic light source (flash duration of 6 μs) and a 180 mm optical lens were used for backlight image acquisition for spray-shape analysis and spray-angle measurement. Droplet size, speed, and distribution were measured using the ParticleMaster imaging system provided by LAVISION. This system comprised a laser as the light source, a high-speed camera for measurement, and an optical device adjusting the light source according to conditions. A Nd:YLF laser (DM20-527, Photonics) with a wavelength of 527 nm and a high-speed camera (FASTCAM SA5, LAVISION, Germany) with a long-distance microscope were employed.
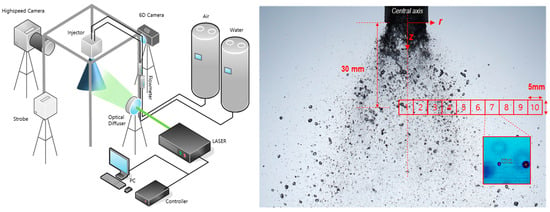
Figure 2.
Spray experiment device (left) and the measurement area of the ParticleMaster imaging system (right).
The spray image analysis involved determining a 30 mm axial distance from the injector outlet, deemed adequate for droplet segmentation. The radial distance covering the entire spray in each experimental case ranged from 45 to 50 mm. Hence, a 5 mm × 5 mm area divided into ten sections was designated for droplet size measurement using the ParticleMaster. The measurement area size was determined via a preprocessed droplet-size calibration process. Upon adjusting the focus and depth-of-field of the high-speed camera, the measurement area was determined to be sufficiently extensive to capture the reference point of the transparent plate positioned at the measurement point within the range of 20–1000 μm, facilitated by the proprietary software of the camera. Droplet measurement using the ParticleMaster involved a period of 0.15 s, during which 300 images were acquired in two sets at 3 µs intervals, achieving a speed of 2 kHz. Droplet velocity data were obtained from the displacement of droplets between two consecutive images within a set, and droplet information was consolidated by amalgamating results from all 300 sets. The structured laser illumination planar imaging technique (SLIPI) method was employed with a setup akin to that of ParticleMaster to attain detailed cross-sectional spray images. The scattered signal was captured from the side by directing a high-speed camera towards the laser sheet side, which was irradiated vertically using various optical lenses, differing from the optical diffuser used in ParticleMaster. The laser emitted structured layers at 3 µs intervals, sequentially eliminating multiple scattered signals detected during measurements to yield a pristine cross-sectional image.
Figure 3 illustrates the configuration of the combustion test apparatus and the combustion chamber. The pre-burner generated oxidizer-rich combustion gas directed to the oxidizer manifold of the combustion chamber. Positioned between the pre-burner and combustion chamber was an orifice and distribution plate, serving to uniformly mitigate pressure perturbations and regular flow. The combustion chamber, constructed in a separate type, comprised three sections: a head, cylinder, and nozzle, with a diameter of approximately 61.4 mm. Consistency in combustion conditions was ensured by employing the same cylinder and nozzle across all tests, with periodic inspections conducted to verify the absence of damage or deformation prior to each test. The combustion chamber head, fabricated using two injectors of identical type tailored to test site flow conditions and pre-burner specifications, featured injectors positioned at the same pitch-circle diameter (PCD) based on empirical distances during full-scale combustion chamber manufacturing. Unlike in spray tests, dual injectors are used; therefore, the tendency of combustion characteristics may include effects caused by interactions between injectors. Therefore, to reduce this effect and to mainly determine the effect of the injector design variables, the injector was placed at the same PCD under all test conditions, and the experiment was carried out under similar combustion pressures. The head surface was coated with a Zr mixture to prevent thermal damage, while the cylinder and nozzle were engineered to accommodate sufficient cooling water-flow rates, obviating the need for coating. Temperatures were measured at the following three locations to compute the heat flux of the combustion chamber through cooling water temperature along the combustor cooling channel: the nozzle-end inlet, the middle point of the cylinder and nozzle junction, and the cylinder-end outlet. Temperatures were averaged from readings obtained using four thermocouples installed at radial 90° intervals at each location to enhance accuracy.
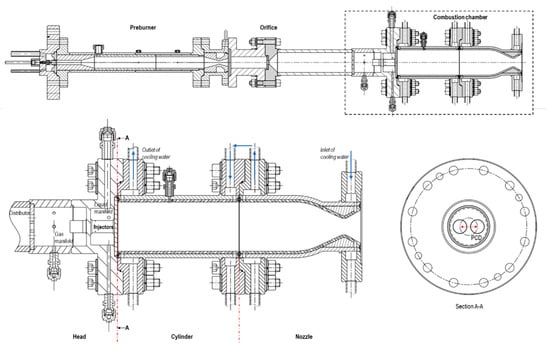
Figure 3.
Combustion test device and combustion-chamber configuration.
3. Results and Discussion
3.1. Spray Configuration
Figure 4 depicts a photograph confirming the spray shape for various recess ratios of A-Jet and B-Jet (0.5 and 2.5, respectively) and A-Co and A-Cnt (both 0.5). The left image illustrates the backlight spray captured with a digital camera, while the right image displays the spray cross-sectional image obtained via SLIPI. Observations revealed that differences in spray characteristics as recess ratios vary when comparing A-Jet and B-Jet injectors at identical supply flow rates but differing gas-nozzle diameters. At a recess ratio of 0.5, the clarity of the liquid film at the injector outlet was notable, with a considerable spray angle until film breakup, and larger droplets B-Jet injector (with smaller J) than the A-Jet injector (with larger J). Conversely, at a recess ratio of 2.5, the liquid film appeared to eject at a narrower angle from the injector outlet, lacking clarity and forming larger, conglomerated masses. This phenomenon was accentuated in the SLIPI image, where low recess ratios absorbed scattered light into the thick liquid film, rendering it dark. As the recess ratio increased, light intensity increased due to the thinning of the liquid film and droplet formation. Consequently, numerous small droplets were visible near the central axis approximately three times from the injector outlet, with the A-Jet (with larger J) exhibiting ligaments vertically torn by fast flow.
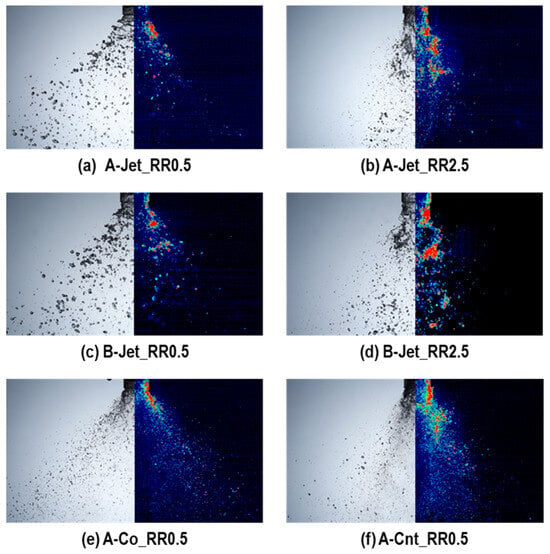
Figure 4.
Spray configuration (a,b) A-Jet_RR0.5, RR2.5, (c,d) B-Jet_RR0.5, RR2.5, (e,f) A-Co_RR0.5, Cnt_RR0.5.
We examined the change in the spray pattern based on the gas injection direction relative to the swirl, contrasting with that of the jet, for all recess ratios set at 0.5. A noticeable liquid film remained at the injector outlet for the A-Jet, absorbing light and appearing dark in the SLIPI image. The presence of liquid film resulted in a wide spray dispersion, with large droplets splitting along its extension. Analysis of the cross-sectional image revealed few droplets beyond the spray angle, with relatively small droplets moving inward toward the spray angle. Both A-Co and A-Cnt exhibited dense droplet concentration at the injector outlet, appearing bright in the cross-sectional image and indicating minimal liquid film presence. Both injectors displayed a substantial distribution of fine droplets compared with A-Jet, with a notable characteristic being the outward radiation of small droplets, particularly prominent in A-Co. Conversely, A-Cnt demonstrated a high density of small droplets directed relatively closer to the central axis. In A-Co, gas injection into the swirl resulted in a wider gas-injection angle compared with the jet, causing divided droplets within the injector to disperse over a wide angle along the gas-injection angle, dividing and dragging small droplets. However, in A-Cnt, where the gas-swirl direction opposed the liquid swirl, the swirl component decreased due to momentum exchange between the gas and liquid swirl direction during recess interaction. Consequently, it exhibited a shape where divided droplets drag downward at a narrower injection angle compared with A-Co.
3.2. Spray Angle
The distribution of droplets, influenced by the characteristics of each injector, can be inferred through spray-angle measurements [10]. While actual droplet distribution during combustion in high-pressure, high-temperature environments may diverge from atmospheric-pressure spray measurements, the trend of spray-angle variation with injector variables remains relevant. This spray distribution holds a significant influence on combustion performance and combustion-chamber wall cooling [12].
The image-processing method employed for measuring the spray angle is illustrated in Figure 5. Fifty raw images captured using the camera underwent conversion to grayscale, with correction for intensity gradients caused by lighting referencing the image without the spray. Subsequently, binary conversion was conducted using a suitable threshold, followed by the averaging of 50 binary images to obtain the average image. The position for spray-angle measurement in the average image was set approximately from the injector outlet, a location recognized for effectively portraying GCSC-injector trends [25]. The average image serves as a standard for determining the spray angle of the GCSC injector [26]. At the end of the injector, the liquid film spreads, owing to the interaction between the liquid film and the surrounding gas, and its changing angle can be observed under the influence of the central gas jet. However, A-Co and A-Cnt types exhibited broader spread due to swirls, unlike jet types emanating from within the liquid-swirl spray angle. Consequently, the phenomenon of small droplet dispersion across a wider spray angle during the division process was observed. The distribution of widely dispersed small droplets must be evaluated to accurately gauge the combustion impact. Hence, the spray angle was measured through the average image from 50 binary images and the cumulative image to consider the location of these droplets. While a minimal difference was observed between the accumulated and average images for A-Jet, a significant difference was observed for A-Co and A-Cnt, denoted as “accumulated” in Figure 6.

Figure 5.
Spray-angle-measurement process (raw → binary image → average image).
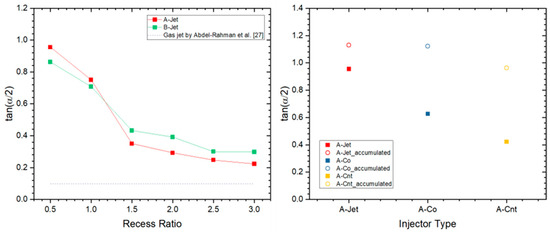
Figure 6.
Spray angle according to recess ratio (left) and gas-swirl (right).
Figure 6 depicts the variation in spray angle according to injector type. The spray angle of the A-Jet exceeded that of the B-Jet in the section with a recess ratio of 1.0. However, the injection angle of the B-Jet surpassed that of the A-Jet in the section with a recess ratio of 1.5. Both injectors exhibited a trend of decreasing spray angle as the recess ratio increased, with a notable shift occurring at a recess ratio of 1.5. This shift can be regarded as the primary factor influencing spray-angle variations corresponding to the respective recess ratios. At low recess ratios, the maintenance of the liquid film at the injector outlet, as previously observed in spray shape analyses, suggested a relatively substantial influence of the liquid swirl on the spray angle. It was supported by the larger injection angle of the A-Jet compared with the B-Jet. Im et al. [12] noted that as the momentum ratio increased, the liquid film thickness preceding injector injection decreased, resulting in increased circumferential speed. Consequently, the A-Jet exhibited a wider injection angle due to its higher J, while the B-Jet displayed a smaller angle owing to its lower J. This explains why the injection angle of the small-diameter A-Jet surpasses that of the B-Jet, indicating that the injection angle at low recess ratios remains significantly influenced by the liquid flow. However, the maintenance of the liquid film shape became challenging at high recess ratios, as evidenced by spray shape observations, with the liquid film thinning considerably due to gas momentum within the long recess space [19]. Therefore, the spray angle attributable to the liquid swirl at the injector outlet diminished, while the angle attributable to gas injection became prominent. Abdel-Rahman et al. [27] described the gas-injection area using a linear equation expressing the half-velocity position of the central axis relative to the distance from the nozzle end in gas jet flow with a Reynolds number similar to this experiment. The coefficient value was experimentally confirmed, yielding a gas-injection angle of approximately 0.097. At high recess ratios, both the A-Jet and B-Jet converged close to this gas-injection angle, indicating increased gas influence. This shift in spray angle served as a criterion for distinguishing between internal and external mixing, with the RR1.5 value denoted as , which changed the mixing mechanism, a notion that will be further supported by subsequent combustion test results.
A-Co and A-Cnt exhibited a limited mixing area within the injector at a recess ratio of 0.5. However, the gas and liquid are inferred to meet and mix vigorously at an earlier stage due to the wide injection angle of the gas resulting from the gas swirl. Observation of the spray image revealed minimal liquid film at the injector outlet, akin to a jet injector with a high recess ratio, indicating substantial gas influence even at a low recess ratio of RR0.5. The notably lower spray angle compared with that of the jet injector supports this hypothesis. In the case of A-Cnt, the spray angle was significantly smaller than that of A-Co, resembling the scenario of a jet with a high recess ratio. It suggests that the liquid and gas lose angular momentum to each other due to the opposite direction of the gas swirl relative to the liquid, causing the gas to be sprayed closer to a jet-like manner. However, in A-Co, where gas and liquid swirled in the same direction, a relatively small amount of gas momentum was transferred to the liquid. Despite the weakening of gas swirl intensity, the gas swirl remained relatively robust compared with A-Cnt, resulting in a relatively wide gas-injection angle. The spray angle measured using the average image corresponded to the area where relatively large droplets, constituting the majority of the flow rate, are sprayed, primarily influenced by the large axial momentum of the gas. Conversely, very small droplets spread across a wide injection angle along the gas flow, influenced by the radial momentum of the gas. In actual combustion scenarios, the distribution of these small droplets is of paramount importance because they evaporate to form a flame in regions mixed with oxidizer-rich gas. Therefore, the spray angle of small droplets was assessed through the accumulated image (Figure 6), revealing a larger spray angle than that of the A-Jet.
3.3. Velocity
Among the results of the injector spray experiment, the velocity of droplets is a crucial parameter warranting analysis because it elucidates droplet behavior under gas influence [10], particularly in gas–liquid injectors. Using the ParticleMaster, changes in droplet velocity within the measurement area were gauged via two sets of images captured at 3 μs intervals, enabling the computation of the average radial velocity value across all frames. A positive velocity_r value denotes the average radial velocity outward in the radial direction, while a positive velocity_z value signifies the average axial velocity away from the injector. The measurement of very small droplets below 20 µm may not be accurate; however, the mass fraction missed in the measurement is likely to be insignificant because the difference in the sum of the measured masses in all areas of each test condition is not large. Therefore, the results of the comparison between injectors are meaningful.
Figure 7 illustrates the average droplet velocity in the radial-axial direction when the recess ratios of the A-Jet and B-Jet injectors were the smallest and largest, respectively. Values near zero or approaching negative figures were evident for radial velocity within the 0–5 mm range proximate to the central axis of the injector. This indicates a limited outward dispersion of droplets due to the liquid-swirl flow injection, instead entrained toward the central axis by the gas jet. Conversely, positive values beyond 10 mm, less influenced by the gas, signify outward droplet spread. Radially, the liquid nozzle exhibited an approximately identical momentum across varying recess ratio conditions for both the A-Jet and B-Jet. A notable difference emerged regarding axial average droplet velocity within the 0–10 mm vicinity of the central axis, where the A-Jet—boasting a higher momentum ratio—exhibited velocities approximately three times faster than the B-Jet. Conversely, negligible disparity was observed beyond 15 mm, with speeds approximating 1–2 m/s, akin to the liquid injection velocity calculated from film thickness and flow rate. This region reflects the imperfect gas–momentum transfer. The trend continued with increasing recess ratios, particularly near the gas-impacted central axis, where both A-Jet and B-Jet injectors exhibited increasing droplet velocities from a further area, albeit at a diminishing rate compared with lower recess ratios. However, droplet velocity decreased slightly with increasing recess ratios, attributable to concentrated droplet formation near the central axis due to a narrow spray angle. This phenomenon, where larger average droplet sizes correlate with diminished velocity increments due to gas measurement transfer, warrants further elucidation in subsequent droplet size analyses because it significantly impacts combustion test heat flux outcomes.
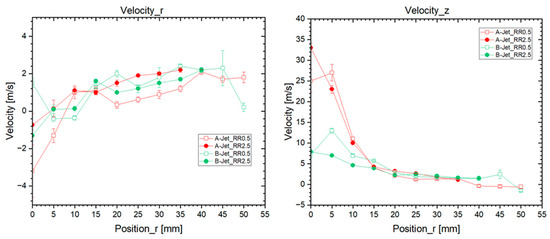
Figure 7.
Mean radial (left) and axial (right) velocities of droplets according to their position from the injector central axis for A-Jet and B-Jet of RR0.5 and RR2.5.
Figure 8 illustrates the average radial and axial droplet velocities of the A-Jet, A-Co, and A-Cnt injectors. The radial velocity data revealed that A-Co and A-Cnt, which used gas swirl, exhibited greater radial velocities than the A-Jet, which employed gas jet injection. Among the swirl injectors, A-Co demonstrated slightly higher radial velocity, likely attributed to the alignment of the gas swirl direction with that of the liquid. Consequently, the gas imparted relatively more radial momentum, facilitating efficient momentum transfer to the droplets. The differences among the injectors were pronounced within the inner 10 mm region: A-Jet and A-Cnt displayed negative velocities, indicating movement toward the central axis, while A-Co exhibited the opposite trend, suggesting an outward spread. This disparity emerges from the entrainment of droplets into gas flow direction; A-Jet and A-Cnt entrained droplets toward the central axis, while A-Co carried droplets outward with the gas flow, lessening their presence near the central axis. The trend was more evident regarding axial velocity, particularly within the 0–5 mm segment near the central axis, where A-Jet droplets displayed the highest velocity due to gas jet-–momentum transfer. A-Cnt exhibited significantly lower axial velocity, whereas A-Co demonstrated negligible axial velocity. This outcome highlights areas where gas influence is prominent. As previously noted, A-Jet with RR0.5 showed external mixing. Conversely, momentum transferred to droplets in the gas-swirl injector occurred uniformly across the area, with the most notable impact observed in the 10–20 mm section.
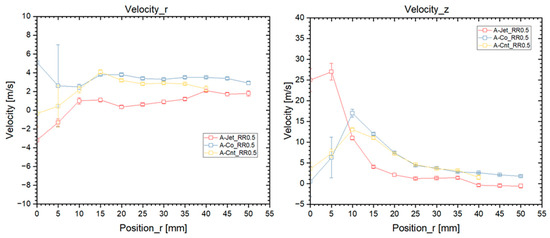
Figure 8.
Mean radial (left) and axial (right) velocities of droplets according to their position from the injector central axis for A-Jet, A-Co, and A-Cnt of RR 0.5.
3.4. Droplet Size and Mass Distribution
Droplet size, a crucial characteristic of injector spray, exhibited a strong correlation with combustion performance [28]. Various methods exist for calculating droplet size, with the Sauter mean diameter (SMD) being the most commonly used due to its effectiveness in representing spray characteristics. The SMD is derived from statistically processing droplets with a measurement area and is expressed by the following equation [10]: .
The SMD results serve as an indicator of fuel-evaporation rate and significant impact combustion characteristics [10]. However, the mixing properties of the fuel and oxidizer also exerted a direct influence on combustion outcomes. Hence, a mass distribution offering insights into the mixing characteristics was confirmed. While SMD results depict droplet size distribution radially, they do not encapsulate the actual flow rate distribution because they rely solely on average droplet diameter without considering the droplet count. Hence, a mass distribution based on droplet size and count was calculated. Given that the same flow rate was maintained across all experimental conditions, a dimensionless flow distribution was computed using the total flow rate for each experimental setting.
The SMD results corresponding to the smallest and largest recess ratios of the A- and B-Jets are depicted on the left side of Figure 9. At lower recess ratios, both injectors showed maximum SMD sizes within the 35–40 mm range, corresponding to the spray angle extension. This phenomenon probably occurred due to its minimal influence from gas emanating from the central axis, leading to droplet breakup through interaction with the surrounding atmosphere, akin to the process observed in a single-liquid-swirl injector. The SMD size decreased near the central axis (0 mm), with a distribution indicating a minimum value in this position. Notably, the minimum SMD at the central axis showcased a larger value in the B-Jet with a lower momentum ratio than in the A-Jet with a higher momentum ratio, reflecting enhanced droplet splitting facilitated by the momentum ratio. Notably, the SMD value at the central axis position (0 mm) increased with increasing recess ratio—a phenomenon elucidated further regarding SMD changes with recess. Furthermore, the maximum SMD decreased in both injectors as the recess ratio increased, accompanied by a shift in the measurement position of this maximum SMD towards the central axis, typically occurring at 15–20 mm. Consequently, droplets near the central axis increased as recess ratios increased at similar locations, while the average droplet velocity near the central axis (see Figure 7) decreased with increasing recess ratios. The mass fraction for each measurement area is illustrated on the right side of Figure 9. In both the A-Jet and B-Jet, the mass distribution showed spreading across a wide area at lower recess ratios and more confined formation close to the central axis at higher recess ratios. Considering that the area influenced by the gas (Figure 7) spans approximately 15 mm from the central axis, the mass distribution of the gas is inferred to be concentrated in this area. The mixing characteristic at low recess ratios, far from the central axis, was inadequate, while the mixing characteristic improved the high recess ratio where the mass distribution approached the central axis. A comparison of the SMD outcomes with the mass distribution findings showed that the positions with the highest mass fraction did not align with the maximum SMD position. Therefore, further analysis is necessary to interpret the results using the representative SMD corresponding to the high mass fraction, as detailed in a subsequent section.
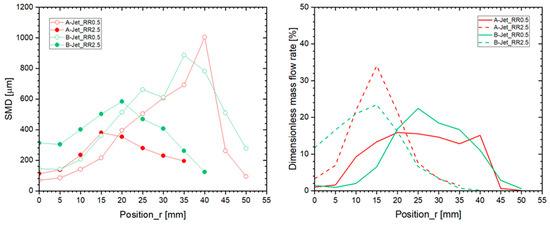
Figure 9.
SMD (left) and dimensionless mass distribution (right) according to their position from the injector central axis for A-Jet and B-Jet of RR0.5 and RR2.5.
The SMD results for A-Jet, A-Co, and A-Cnt are presented on the left side of Figure 10, revealing changes based on the presence and direction of the gas swirl supplied to the injector. The presence of gas swirls resulted in smaller values than A-Jet throughout the measured area, with A-Cnt displaying smaller values compared with A-Co and the position of the maximum value closer to the central axis. The maximum SMD size ranged between 200 and 300 µm, with the SMD across the entire region identified at a level similar to that of RR2.5 in A-Jet. Additionally, the center of the mass distribution of A-Co and A-Cnt aligned closely with the center of the SMD compared with the mass distribution results depicted on the right side of Figure 10. This resemblance to the high recess ratio of the gas jet injector suggests that the presence of swirls in the gas has a similar effect despite the low recess ratio. Estimating the gas mass distribution for mixing characteristics proves challenging in the current experiment compared with gas jets. However, the spray angle results measured through the cumulative image in Figure 6 showed that a gas mass distribution occurred from 45 to 50 mm, indicating improved mixing characteristics compared with gas jets.
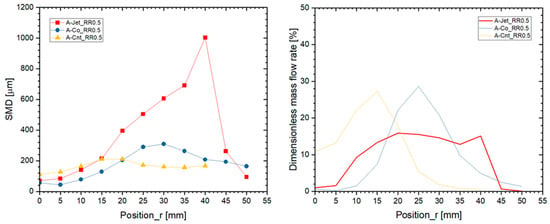
Figure 10.
SMD (left) and dimensionless mass distribution (right) according to their position from the injector central axis for A-Jet, A-Co, and A-Cnt of RR 0.5.
Figure 11 illustrates the variation in the SMD at the maximum SMD and at the central axis position of 0 mm based on the recess ratio. The result of the spray test according to the recess ratio of the A-Jet and B-Jet are summarized in Table 3. The maximum SMD decreased with an increasing recess ratio, with a gradually diminishing rate of decrease. A-Jet demonstrated a faster decrease to a smaller size than B-jet, likely attributed to the smoother entrainment due to faster gas velocity and more easily divided droplets, owing to the large momentum ratio. Conversely, the SMD at the central axis position (0 mm) generally showed a trend of increase with increasing recess ratio in both the A-Jet and B-Jet. Similarly, Davanlou et al. [29] observed that droplet size decreased as the distance from the injector along the axis in a single swirl injector increased, merging due to droplet collision beyond a certain distance. Therefore, the number of droplets smoothly divided from within the recess increased gradually in the region close to the central axis with increasing recess ratio via a similar mechanism, increasing droplet size due to a combination caused by a collision between multiple droplets. However, directly linking the change in droplet size to the combustion phenomenon proved challenging as it engaged in the combustion process following mixing with gas before the combination of these droplets occurred during actual combustion.
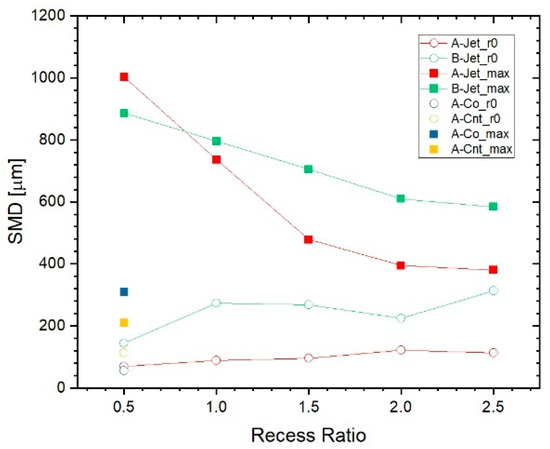
Figure 11.
Max SMD and SMD of central axis according to recess ratio.

Table 3.
Summary of spray tests according to recess ratio.
3.5. Combustion Characteristics
Identical components were employed in the combustion chamber to assess the impact of combustion on the shape change of the injector, with only the head containing the injector being replaced. The experiment was replicated twice under consistent conditions across approximately all instances to enhance result reliability, and analysis was conducted using the mean value. The propellants employed in the combustion test comprised oxidizer-rich combustion gas and kerosene, with mixture ratios of the pre-burner and combustion chamber calculated as follows: , . The combustion pressure maintained in the combustion chamber for all experiments was 33.2 ± 0.5 bar, with and averaging 60.5 ± 3 and 2.96 ± 0.05, respectively. In instances where data from tests involving A-Co and A-Cnt were limited due to premature termination, analysis was conducted using the average value of 1 s within the 4–5 s interval, facilitating comparisons. Conversely, steady data was acquired in other tests using the average value of 1 s in the 9–10 s interval, just preceding the conclusion (see Figure 12).
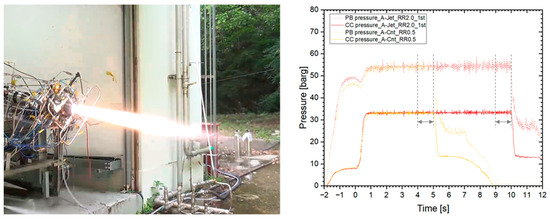
Figure 12.
Result of combustion tests.
The combustion performance was assessed by comparing the characteristic velocity (), which can be straightforwardly derived from the combustion-chamber pressure (), nozzle-throat area (), and propellant flow rate (. The characteristic velocity serves as a crucial metric for evaluating combustion performance—irrespective of the nozzle shape of the combustion chamber—because it is directly related to specific impulse [2,23].
The actual observed was lower than its ideal reachable value due to factors such as incomplete combustion or heat loss. Additionally, slight variations in the mixing ratio across different test cases also contributed to this influence. Therefore, the combustion efficiency, defined as the ratio of the theoretical characteristic velocity achievable under each test condition to the actual characteristic velocity obtained in the test, is expressed as [23,30]. The properties required to calculate under each test condition were determined using the NASA CEA code. Furthermore, can be expressed by Equation (4) [30].
where T represents the temperature of the combustion chamber, R denotes the universal gas constant, M signifies the molecular weight of the combustion gas, and γ indicates the specific heat ratio.
The heat flux of the combustion chamber was measured as another metric to assess the changes in combustion characteristics and flame distribution. It was analyzed by dividing it into two parts, cylindrical and nozzle, and calculated based on the temperature changes in each section of the coolant flowing through the cooling channel of the nozzle and cylindrical parts. The heat flux was determined using Equation (5) [31,32,33].
where Cp represents the specific heat of the cooling water, ṁ denotes the flow rate of the cooling water, ΔT indicates the temperature rise of the cooling water in each section, and A is the area of the inner surface of each part of the combustion chamber.
Figure 13 illustrates the variations in characteristic velocity and combustion efficiency with an increase in the recess ratios of the A-Jet and B-Jet. The trends observed in combustion efficiency and characteristic velocity were analogous. When the recess ratio of the A-Jet was 0.5, the characteristic velocity measured 1710 m/s, with a corresponding combustion efficiency of 0.984. The characteristic velocity was 1724.5 m/s at a recess ratio of 2.0, while the combustion decreased to 0.90. Similarly, the characteristic velocity for the B-Jet was 1702.8 m/s with a recess ratio of 0.5, yielding a combustion efficiency of 0.980. At a recess ratio of 2.0, the characteristic velocity increased to 1723.4 m/s, and the combustion efficiency improved to 0.990. In both injectors, the combustion efficiency increased as the recess ratio increased, with the rate of increase in combustion efficiency gradually diminishing as the recess ratio increased. Additionally, the combustion efficiency displayed minimal increments beyond a recess ratio of 1.5. However, the combustion efficiency values of the A-Jet and B-Jet were approximately identical. The actual combustion test showed that the momentum ratio of the injector ranged between J = 27.5–31 for the A-Jet and J = 13.6–15 for the B-Jet. This substantial difference in momentum ratio resulted in a noticeable reduction in the characteristic velocity discrepancy, which was approximately 7.2 m/s at a recess ratio of 0.5, gradually diminishing to less than 1 m/s from a recess ratio of 1.5. This observation suggests that the recess ratio is a crucial factor in injector design. The recess ratio exerted a significant influence on combustion efficiency than the momentum ratio beyond a certain threshold. The specific recess ratio, deemed as a critical reference point (), was identified as 1.5. This finding aligns with the , which delineates the alteration in the mixing mechanism, as evidenced in the previous spray angle results. Moreover, this underscores the limited expectation for substantial improvements in combustion efficiency beyond .
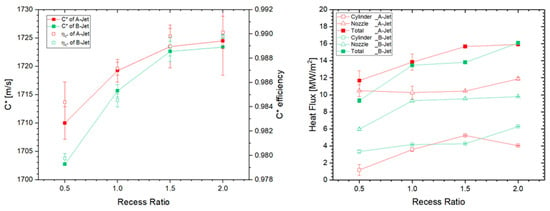
Figure 13.
Characteristic velocity and combustion efficiency (left) and heat flux (right) for A-Jet and B-Jet.
Observing the mass-distribution change depicted in Figure 9, discerning a significant difference between the A-Jet and B-Jet proves challenging, suggesting a lack of significant variance in mixing efficiency. This observation arises from the center of the mass distribution gravitating towards the central axis of the injector, similarly for both cases. Consequently, a representative value that effectively characterized each experimental condition was ascertained through the SMD results, which are indicative of droplet division and evaporation rates. Specifically, the SMD at the central point of the mass distribution was designated as the corresponding value and denoted as the SMD at the mass peak (see Figure 14). The decrease in SMD indicates smoother droplet division and enhanced droplet evaporation rates. Hence, the observed decrease in SMD at the mass peak due to an increase in the recess ratio appears to correlate with improved combustion efficiency. Furthermore, this decline in SMD at the mass peak exhibited a tendency to decrease with increasing recess ratio, mirroring the trend observed in the combustion efficiency. Although directly estimating combustion efficiency from this SMD at the mass peak is not feasible, the significance lies in the potential to extrapolate the combustion test trend from data acquired during the spray test phase concerning recess-ratio augmentation.
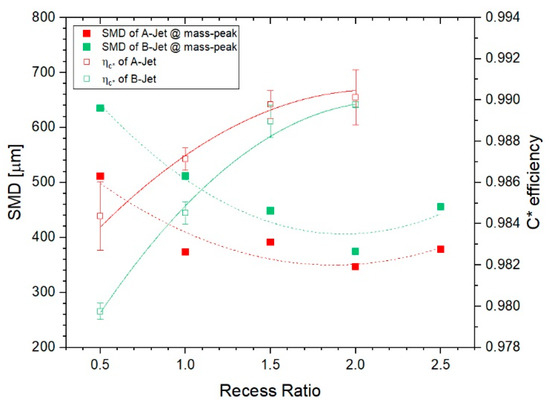
Figure 14.
SMD at mass-peak and combustion efficiency as a function of recess ratio.
The total heat flux showed a tendency to increase, mirroring the increase observed in combustion efficiency for both the A-Jet and B-Jet. Heat flux correlates with the flame temperature of the combustion gas [30], and the parallel increase in combustion efficiency suggests a convergence towards complete combustion. At low recess ratios, the heat flux of A-Jet surpassed that of B-Jet by approximately 2.3 MW/m2; however, the minimal disparity was evident from recess RR1 onwards, with RR2 exhibiting comparable values, excluding RR1.5. This phenomenon likely stems from changes in the heat flux between the nozzle and cylinder sections in response to changes in the recess ratio. The nozzle part appears diminutive in the relatively sluggish B-Jet due to the backward flame extension from the high moment ratio of A-Jet. As the recess ratio and combustion efficiency increased, the heat flux became concentrated within the narrow confines of the nozzle neck, increasing the heat flux. Consequently, the disparity between A-Jet and B-Jet decreased owing to this intricate interplay. In the cylindrical segment, prior research by the author indicates that injectors with lower momentum ratios and larger gas diameters exhibit lower gas velocities, resulting in the flame being unable to extend backward and instead being drawn forward, indicating increased heat flux at RR0.5 [25]. The flame was drawn forward as the recess ratio increased, facilitating smoother division and mixing and increasing the heat flux value in the cylindrical segment. Concerns regarding injector damage due to increased heat load stemming from flame pull were assuaged. However, no damage was incurred occurred in any of the experiments. This can be attributed to the predominance of flame stretching backward due to the high gas speed (see Figure 7), which outweighs the pull of the flame surface resulting from the decrease in SMD and the enhancement in mixing characteristics. Nonetheless, further investigation is warranted because a heat load conducive to injector damage may arise under conditions featuring a specific momentum ratio lower than that of the B-Jet.
Figure 15 illustrates the outcomes concerning the characteristic velocity and combustion efficiency for A-Jet, A-Co, and A-Cnt. Their characteristic velocities were 1703.3 ± 2.9 m/s, 1705.7 ± 2.9 m/s, and 1702.9 ± 2.9 m/s, respectively. The combustion efficiencies of all three were 0.980. Characteristic velocity or combustion efficiency did not differ significantly despite the presence of the gas swirl. However, this lack of difference does not necessarily imply uniform combustion efficiency; another factor likely contributes. This conjecture can be substantiated through heat flux results, where a noticeable contrast emerged between total heat flux with and without the gas swirl. Specifically, this contrast for the A-Jet was 11.6 MW/m2, where it stood at 21.3 and 22.8 MW/m2 for A-Co and A-Cnt, respectively, approximately double the magnitude. Conversely, no significant difference was observed in the heat flux outcomes for the nozzle. As mentioned earlier, the axial gas speed at the central axis tended to be marginally higher than in cases with gas swirls. Therefore, the substantial difference in total heat flux predominantly stemmed from the cylinder part, which is likely linked to the larger cylinder part heat flux of the B-Jet RR0.5 compared with A-Jet. This inference correlates with the observed large spray angle of small droplets due to gas accumulation images of A-Co and A-Cnt in the preceding section, possibly influenced by the flow of combustion gas. This relationship is corroborated by Figure 16, presenting the results of gas flow analysis under identical combustion chamber shapes and gas-supply conditions via fluent computational fluid dynamics. The density was approximately 26.5 kg/m3 when the air supplied to the manifold was at a pressure of approximately 43 bar and the temperature was 490 K. The flow of gas was analyzed when injected into the combustion chamber space of 33 bar. Although the cold-gas analysis outcomes lack combustion reaction data, they aid in deducing combustion gas flow based on gas-swirl characteristics. In the gas-jet scenario, gas velocity maintained an extended axial trajectory. However, in the swirl scenario, rapid gas flow expansion toward the wall near the injector outlet was evident due to the gas swirl, engendering a high-flow-rate recirculation area formation between the head surface and cylinder. Therefore, this accelerated combustion gas flow markedly amplified cylinder heat flux, resulting in head surface damage, as depicted in Figure 16. Such damage occurred uniformly in both A-Co and A-Cnt, reinforcing the notion that damage direction in the head-facing view aligns with the respective gas-swirl flow direction of each head.
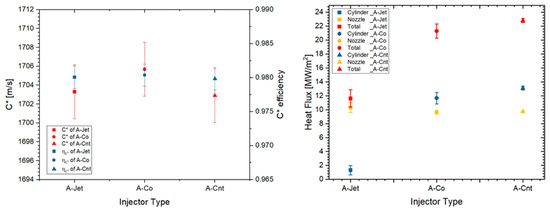
Figure 15.
Characteristic velocity and combustion efficiency (left) and heat flux (right) for A-Jet, A-Co, and A-Cnt.
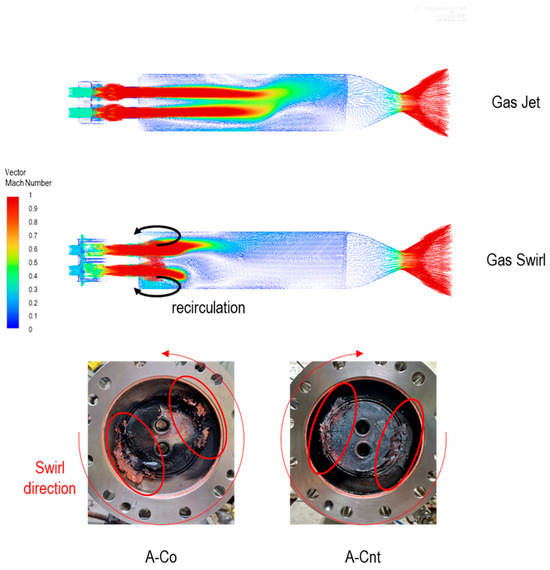
Figure 16.
Gas velocity fields by fluent and image of the damaged head.
The heat flux in the combustion chamber in regenerative cooling increases the enthalpy of the propellant, which serves as the cooling fluid, thereby enhancing combustion efficiency. However, during cooling and discharge through cooling water, the absorbed heat flux by the cooling water does not bolster combustion efficiency; instead, it leads to a loss thereof. Werling et al. [30] showed that the combustion efficiency was reduced due to heat loss. In the case of A-Co and A-Cnt, where the heat flux disparity compared with A-Jet was twofold, one can presume that the actual combustion efficiency would surpass that of the A-Jet if the heat loss to the exterior of the combustion chamber remains similar to that of the A-Jet even with an increased heat transfer owing to the combustion gas recirculation area. This avenue will be investigated in forthcoming research. Nonetheless, an increase in combustion efficiency can be anticipated without a recess increase when employing a gas-swirl injector in a full-scale engine for the inner position of the injector array or in conjunction with film cooling.
4. Conclusions
The variables modified to enhance the performance of the GCSC injector encompassed the recess ratio, swirl gas supply, and swirl direction. The spray characteristics of the injector were assessed through an atmospheric-pressure spray test. We found that variations in the momentum ratio did not yield significant differences in the spray angle. However, we noticed a discernible trend of decreasing spray angle with increasing recess ratio. This trend was particularly notable at a specific recess ratio of 1.5, denoting the transitional point where mixing mechanisms shifted. Gas swirls showed a smaller spray angle than gas jets, aligning with the observed trend in the high recess ratio of the gas jet types. This phenomenon increased the interaction between liquid and gas in the recess space pre-injection, increasing the influence of the gas. The direction of the gas swirl was found to counteract its angular momentum, opposite to that of the liquid, resulting in a reduced spray angle. Analysis of the droplet behavior, influenced by the gas, revealed changes in average axial velocity with increasing recess ratio. While the maximum velocity decreased owing to larger droplet size, velocities increased away from the central axis. Notably, the average axial velocity in the outer 10 mm region surpassed that of the gas jet with gas swirl, while it exceeded throughout in the radial direction. The gas swirl also showed a trend closer to the jet in the opposite direction to the liquid swirl. The maximum droplet size decreased with increasing recess ratio, while droplet distribution increased near the central axis. Gas swirls resulted in SMD sizes akin to those seen with the largest recess ratio in gas jet injectors. Conversely, when the gas swirl direction opposed the liquid swirl, droplet distribution was smaller and closer to the central axis.
In the combustion test, uniformity was ensured by affixing the same cylinder and nozzle, with only the head modified to accommodate two identical injectors corresponding to each injector type. Combustion characteristics were evaluated based on characteristic velocity and combustion efficiency, revealing no significant deviations in their trends. As the recess ratio increased, combustion efficiency increased, albeit with a decreasing rate of increase. The difference in combustion efficiencies between injectors with differing momentum flux ratios decreased with higher recess ratios, converging to negligible differences at a specific recess ratio (, akin to spray-angle results.
The results from both the spray and combustion tests showed several interconnected areas of significance. Particularly noteworthy was the similarity observed between the SMD at the center of mass distribution and the trend of increasing combustion efficiency with higher recess ratios. This alignment is of considerable importance because it suggests that trends in combustion efficiency can be preliminarily assessed through relatively straightforward spray tests—a process considerably more manageable than conducting combustion tests. Additionally, the identification of the critical recess ratio, corroborated by both spray and combustion tests, holds significant implications for the future design of GCSC injectors. This critical ratio represents a pivotal value where differences in injector design momentum ratios have minimal impact, and subsequent increases in combustion efficiency become marginal. Moreover, the potential for enhanced combustion efficiency with gas swirls was validated, underscoring the importance of addressing heat load issues arising from spray and flame configurations. These findings are instrumental in information decisions regarding the placement and efficacy of such injectors. Future research endeavors aim to delineate the constraints associated with a further increase in the recess ratio under lower momentum-ratio conditions. Additionally, efforts will focus on mitigating damage caused by recirculation within the combustion chamber of gas swirl injectors, facilitating the exploration of higher recess ratios.
Author Contributions
Conceptualization, J.L.; methodology, J.L. and I.L.; software, I.L.; validation, J.L., I.L. and S.W.; formal analysis, J.L.; investigation, J.L.; resources, J.L., I.L., S.W., Y.H. and Y.Y.; data curation, J.L. and S.W.; writing—original draft preparation, J.L.; writing—review and editing, J.L., I.L. and Y.Y. All authors have read and agreed to the published version of the manuscript.
Funding
This research was supported by Research on Preceding Technologies for High Performance in Liquid Rocket Engines, sponsored by the Korea Aerospace Research Institute [grant number FR24A00].
Data Availability Statement
The data presented in this study are available on request from the corresponding author.
Acknowledgments
This research was supported by the Preceding Technologies Research Program at the Korea Aerospace Research Institute and the Institute of Advanced Aerospace Technology at Seoul National University.
Conflicts of Interest
The authors declare no conflicts of interest.
References
- Sutton, G.P. History of Liquid Propellant Rocket Engines; American Institute of Aeronautics & Astronautics: Reston, VA, USA, 2005. [Google Scholar]
- Huzel, D.K.; Huang, D.H. Modern Engineering for Design of Liquid-Propellant Rocket Engines; American Institute of Aeronautics & Astronautics: Reston, VA, USA, 1992. [Google Scholar]
- Sutton, G.P.; Biblarz, O. Rocket Propulsion Elements, 7th ed.; John Wiley & Sons: Nashville, TN, USA, 2016. [Google Scholar]
- Zandbergen, B.T.C. Modern Liquid Propellant Rocket Engines; American Institute of Aeronautics & Astronautics: Reston, VA, USA, 2000. [Google Scholar]
- Ha, D.; Roh, T.-S.; Huh, H.; Lee, H.J. Development Trend of Liquid Hydrogen-Fueled Rocket Engines (Part 1: Performance and Operation). Int. J. Aeronaut. Space Sci. 2022, 24, 131–145. [Google Scholar] [CrossRef]
- Amri, R.; Rezoug, T. Numerical Study of Liquid Propellants Combustion for Space Applications. Acta Astronaut. 2011, 69, 485–498. [Google Scholar] [CrossRef]
- Glynne-Jones, P.; Coletti, M.; White, N.M.; Gabriel, S.B.; Bramanti, C. A Feasibility Study on Using Inkjet Technology, Micropumps, and MEMs as Fuel Injectors for Bipropellant Rocket Engines. Acta Astronaut. 2010, 67, 194–203. [Google Scholar] [CrossRef]
- Betelin, V.B.; Smirnov, N.N.; Nikitin, V.F.; Dushin, V.R.; Kushnirenko, A.G.; Nerchenko, V.A. Evaporation and Ignition of Droplets in Combustion Chambers Modeling and Simulation. Acta Astronaut. 2012, 70, 23–35. [Google Scholar] [CrossRef]
- Smirnov, N.N.; Betelin, V.B.; Kushnirenko, A.G.; Nikitin, V.F.; Dushin, V.R.; Nerchenko, V.A. Ignition of Fuel Sprays by Shock Wave Mathematical Modeling and Numerical Simulation. Acta Astronaut. 2013, 87, 14–29. [Google Scholar] [CrossRef]
- Kang, Z.; Wang, Z.-G.; Li, Q.; Cheng, P. Review on Pressure Swirl Injector in Liquid Rocket Engine. Acta Astronaut. 2018, 145, 174–198. [Google Scholar] [CrossRef]
- Yang, L.-J.; Fu, Q.-F. Stability of Confined Gas-Liquid Shear Flows in Recessed Shear Coaxial Injectors. J. Propuls. Power 2012, 28, 1413–1424. [Google Scholar] [CrossRef]
- Im, J.; Cho, S.; Yoon, Y.; Moon, I. Comparative Study of Spray Characteristics of Gascentered and Liquid-Centered Swirl Coaxial Injectors. J. Propul. Power 2010, 26, 1196–1204. [Google Scholar] [CrossRef]
- Fu, Q.-F.; Yang, L.-J.; Qu, Y.-Y. Measurement of Annular Liquid Film Thickness in an Open-End Swirl Injector. Aerosp. Sci. Technol. 2011, 15, 117–124. [Google Scholar] [CrossRef]
- Kulkarni, V.; Sivakumar, D.; Oommen, C.; Tharakan, T.J. Liquid Sheet Breakup in Gas-Centered Swirl Coaxial Atomizers. J. Fluids Eng. 2010, 132, 011303. [Google Scholar] [CrossRef]
- Schumaker, S.A.; Danczyk, S.A.; Lightfoot, M.D.A. Effect of swirl on gas-centered swirlcoaxial injectors. In Proceedings of the 47th AIAA/ASME/SAE/ASEE Joint Propulsion Conference & Exhibit, San Diego, CA, USA, 31 July–3 August 2003. [Google Scholar]
- Wang, X.; Zhang, L.; Li, Y.; Yeh, S.-T.; Yang, V. Supercritical Combustion of Gas-Centered Liquid-Swirl Coaxial Injectors for Staged-Combustion Engines. Combust. Flame 2018, 197, 204–214. [Google Scholar] [CrossRef]
- Pomeroy, B.; Sisco, J.; Eckstein, J.; Anderson, W. Characterization of Gas-Centered Swirl-Coaxial Injector Stability in a Subscale Multi-Element Combustor. In Proceedings of the 44th AIAA/ASME/SAE/ASEE Joint Propulsion Conference & Exhibit, Hartford, CT, USA, 21–23 July 2008; American Institute of Aeronautics and Astronautics: Reston, VA, USA, 2008. [Google Scholar]
- Anand, R.; Ajayalal, P.; Kumar, V.; Salih, A.; Nandakumar, K. Spray and atomization characteristics of gas-centered swirl coaxial injectors. Int. J. Spray Combust. Dyn. 2017, 9, 127–140. [Google Scholar] [CrossRef]
- Canino, J.; Heister, S.; Garrison, L. Hydrodynamic modeling of oxidizer-rich staged combustion injector flow. In Proceedings of the JANNAF (Joint Army Navy NASA Air Force) Joint Propulsion Meeting, Las Vegas, NV, USA, 10–14 May 2004; pp. 1–11. [Google Scholar]
- Yang, L.-J.; Ge, M.-H.; Zhang, M.-Z.; Fu, Q.-F.; Cai, G.-B. Spray Characteristics of Recessed Gas-Liquid Coaxial Swirl Injector. J. Propuls. Power 2008, 24, 1332–1339. [Google Scholar] [CrossRef]
- Gao, Y.; Kang, J.; Ying, S.; Huang, K.; Su, L.; Tong, Y.; Lin, W. Effect of ambient pressure on the performance of a gas-centered swirl coaxial injector. AIP Adv. 2023, 13, 055320. [Google Scholar] [CrossRef]
- Balance, H.C.; Bibik, O.; Cook, T.S.; Danczyk, S.; Schumaker, S.A.; Yang, V.; Lieuwen, T.C. Optical Diagnostics in a High-Pressure Combustor with Gaseous Oxygen and Kerosene. J. Propuls. Power 2019, 35, 13–25. [Google Scholar] [CrossRef]
- Wagner, R.; Soller, S.; Kau, H.P.; Martin, P.; Maeding, C. Influence of injector Element design on heat transfer. In Proceedings of the 42nd AIAA/ASME/SAE/ASEE Joint Propulsion Conference & Exhibit, Sacramento, CA, USA, 9–12 July 2006. [Google Scholar] [CrossRef]
- Woo, S.; Lee, J.; Han, Y.; Yoon, Y. Experimental Study of the Combustion Efficiency in Multi-Element Gas-Centered Swirl Coaxial Injectors. Energies 2020, 13, 6055. [Google Scholar] [CrossRef]
- Lee, J.; Woo, S.; Lee, I.; Han, Y.; Yoon, Y. Characteristics of spray and combustion in gas-centered swirl coaxial injector with varying gas nozzle diameter. Acta Astronaut. 2024, 215, 631–641. [Google Scholar] [CrossRef]
- Kang, Z.; Li, Q.; Zhang, J.; Cheng, P. Effects of Gas Liquid Ratio on the Atomization Characteristics of Gas-Liquid Swirl Coaxial Injectors. Acta Astronaut. 2018, 146, 24–32. [Google Scholar] [CrossRef]
- Abdel-Rahman, A.A.; Chakroun, W.; Al-Fahed, S.F. LDA Measurements in the Turbulent Round Jet. Mech. Res. Commun. 1997, 24, 277–288. [Google Scholar] [CrossRef]
- Jedelsky, J.; Jicha, M. Energy Considerations in Spraying Process of a Spill-Return Pressure-Swirl Atomizer. Appl. Energy 2014, 132, 485–495. [Google Scholar] [CrossRef]
- Davanlou, A.; Lee, J.D.; Basu, S.; Kumar, R. Effect of Viscosity and Surface Tension on Breakup and Coalescence of Bicomponent Sprays. Chem. Eng. Sci. 2015, 131, 243–255. [Google Scholar] [CrossRef]
- Werling, L.K.; Hassler, M.; Lauck, F.; Ciezki, H.K.; Schlechtriem, S. Experimental Performance Analysis (C* & C* Efficiency) of a Premixed Green Propellant Consisting of N2O and C2H4. In Proceedings of the 53rd AIAA/SAE/ASEE Joint Propulsion Conference, Atlanta, GA, USA, 10–12 July 2017; American Institute of Aeronautics and Astronautics: Reston, VA, USA, 2017. [Google Scholar]
- Ahn, K.; Kim, J.; Choi, H. Effects of Injector Recess on Heat Flux in a Combustion Chamber with Cooling Channels. Aerosp. Sci. Technol. 2014, 37, 110–116. [Google Scholar] [CrossRef]
- Soller, S.; Wagner, R.; Kirchberger, C.; Kau, H.P.; Martin, P.; Maeding, C. Characterisation of combustion and heat transfer using GOX/kerosene in a single-element rocket combustor. In Proceedings of the 41st AIAA/ASME/SAE/ASEE Joint Propulsion Conference & Exhibit, Tucson, AZ, USA, 10–13 July 2005; American Institute of Aeronautics and Astronautics: Reston, VA, USA, 2005. [Google Scholar]
- Soller, S.; Wagner, R.; Kau, H.-P.; Martin, P.; Maeding, C. Characterisation of Main Chamber Injectors for GOX/Kerosene in a Single Element Rocket Combustor. In Proceedings of the 41st AIAA/ASME/SAE/ASEE Joint Propulsion Conference & Exhibit, Tucson, AZ, USA, 10–13 July 2005; American Institute of Aeronautics and Astronautics: Reston, VA, USA, 2005. [Google Scholar]
Disclaimer/Publisher’s Note: The statements, opinions and data contained in all publications are solely those of the individual author(s) and contributor(s) and not of MDPI and/or the editor(s). MDPI and/or the editor(s) disclaim responsibility for any injury to people or property resulting from any ideas, methods, instructions or products referred to in the content. |
© 2024 by the authors. Licensee MDPI, Basel, Switzerland. This article is an open access article distributed under the terms and conditions of the Creative Commons Attribution (CC BY) license (https://creativecommons.org/licenses/by/4.0/).