
Optimal Sizing of Fuel Cell and Battery in a Direct-Hybrid for Electric Aircraft

Institute for Energy Conversion and Storage, Universität Ulm, 89081 Ulm, Germany
*
Author to whom correspondence should be addressed.
†
These authors contributed equally to this work.
Aerospace 2024, 11(3), 176; https://doi.org/10.3390/aerospace11030176
Submission received: 18 January 2024
/
Revised: 20 February 2024
/
Accepted: 21 February 2024
/
Published: 23 February 2024
Abstract
:The climate impact of aviation can be reduced using powertrains based on hydrogen fuel cells and batteries. Combining both technologies in a direct-hybrid without a DC/DC converter is a promising approach for light-weight systems. Depending on the power demand, both the fuel cell and battery are used to provide power or only the fuel cell is connected to the powertrain. The system voltage in a direct-hybrid is determined by the fuel cell and battery, but the performance of fuel cells is affected by low-ambient pressure at high altitudes and the battery voltage is affected by state of charge and discharge rate. Taking this into account, the presented work demonstrates how a direct-hybrid system must be designed based on a scaled mission profile of a 40-seater aircraft. The fuel cell and battery are configured and sized according to the power demand in different flight phases while considering voltage limits given by the powertrain. The energy requirement from the fuel cell and the battery is calculated for a flight based on a realistic mission profile and different battery and fuel cell configurations are evaluated. By optimizing the battery and fuel cell size, the energy required from the battery was reduced by 57% and the total weight of the fuel cell and battery was reduced by 11%.
1. Introduction
Aviation enables the fast and easy transport of people and goods over long distances. However, the increase in air travel also leads to an increase in the environmental impact of aviation, with aviation-related greenhouse gas emissions contributing to climate change [1,2,3]. To address this issue, the aviation industry is currently exploring new technologies that help to reduce or eliminate harmful and climate-active emissions from aircraft. Two very promising technologies are all-electric or hybrid-electric aircraft [4,5]. All-electric aircraft based on batteries as the energy carrier enable emission-less flight. However, they are limited in their range due to the high weight of batteries. Electric aircraft using hydrogen as fuel can fly longer distances and still reduce their emissions considerably [4,6,7,8]. Emissions of particles, hydrocarbons, sulfur compounds and aromatics are completely eliminated and the only emission is water vapor [9]. H2O in the atmosphere also causes a warming effect, but the duration of stay is only in the order of hours to days [10].
The combination of a fuel cell (FC) and battery in a hybrid propulsion system results in a setup [5,11] that avails itself of the high specific power of lithium-ion batteries and the high specific energy content of hydrogen [12,13]. This promising sustainable aviation approach can help mitigate the environmental impact of short- and intermediate-distance air travel and make it more environmentally friendly. The storage of hydrogen on board an aircraft comes with its own challenges due to hydrogen’s low volumetric energy density of 600 kWh/m3 at 200 bar [14], and its high gravimetric energy density of 33 kWh/kg [15]. The development of suitable tanks as well as the integration into the aircraft is currently an important research topic [16,17]. The usual approach is to connect the fuel cell and the battery into a hybrid system with the help of one or even two DC/DC converters that adapt the voltage levels of both energy sources to that of the load [18]. There are several studies on the design and sizing of components using DC/DC converters. For example, Ceschia et al. present a numerical design method for a hybrid system with DC/DC for ground application [19] and Bassman et al. propose a sizing optimization of a DC/DC-based hybrid system with respect to operational costs [20]. Park et al. also sized a fuel cell battery hybrid system containing a DC/DC for eVTOL [21,22].
In a direct-hybrid, however, the fuel cell and the battery are connected directly and without the help of a DC/DC converter that adapts different voltages levels to that of the powertrain [5,11]. Removing the DC/DC converter has the potential to improve the reliability, power density and the efficiency of the system [23]. Safety is crucial in aviation. The hardware as well as the control of a DC/DC converter is complex [24,25] and unless a redundant DC/DC converter is used, it represents a single point of failure. A fewer number of critical components, as in a direct-hybrid, results in a more reliable and safer system. Removing the DC/DC can also increase the power density of the system. Adding a DC/DC converter to a system adds weight, not only the weight of the DC/DC converter itself, but also of auxiliaries like cooling. Even though DC/DC converters can have a relatively high efficiency of over 96%, considerable losses occur if the full propulsive power has to be converted [26]. The resulting heat has to be removed and the cooling of the DC/DC converter is necessary in adding to the cooling demand of the entire system. A bigger cooling system adds weight to the total-hybrid propulsion system as well as additional drag due to the heat exchanger that transfers the heat to the surrounding air [27].
In a direct-hybrid, the system voltage of the powertrain for propulsion depends on the sizing and operational behavior of the fuel cell and battery. The fuel cells and batteries both change their operating voltage levels at different operating conditions, which strongly affects the behavior of a direct-hybrid system and therefore the available performance [28,29]. Designing those two components for a direct-hybrid requires a detailed knowledge of the exact fuel cell and battery behavior. In particular, the voltage power curves of the fuel cell and the battery at different operating conditions are of interest. Aircraft operate at different altitudes, resulting in the powertrain being exposed to varying ambient pressures [30]. These low operating pressures strongly affect the performance of a non-pressurized fuel cell. At low-ambient pressures, the fuel cell power at the same voltage level decreases [31,32,33]. The voltage level of the battery is almost independent of pressure but is determined by the state of charge and the discharge rate [34]. The influence of the operating parameters on the behavior of fuel cell and battery needs to be considered, as well as any voltage limitations of additional powertrain components like the inverter/motor unit or auxiliaries and, of course, the power required for a specific flight mission profile [29]. Cruise altitude and required power during cruise are therefore relevant factors for the sizing of the fuel cell system. During cruise, the aircraft should only be powered by the fuel cell to enable a long flight range and to make the best use of the high specific energy of hydrogen. During flight phases with a high-power demand like take-off and climb, the battery power supports the fuel cell power. Due to the short duration of these flight phases, however, the energy content of the batteries can be comparatively low and the lower specific energy of batteries is not that significant. To ensure that during cruise the entire power is provided by the fuel cell, a power management system [5,11] consisting of switches is required that can disconnect the battery if necessary. For additional low power systems and auxiliaries which require voltage at a much lower level (e.g., 28 V) like the avionic system, DC/DC converters are still required. These, however, will be much smaller and lighter than a DC/DC converter that converts the entire propulsive power.
The concept of a direct-hybrid has been described previously [5]. There are studies on the design of a direct-hybrid system consisting of a fuel cell and a battery. For example, Jarry et al. described a model-based, numerical sizing approach for a direct-hybrid system for aviation in a non-propulsive function. The fuel cell is modeled via a polarization curve but the influence of varying ambient pressure in aviation is not considered [35]. The influence of battery SOC and operational pressure of the fuel cell on the characteristic hybrid curves has been examined previously [28,29]. However, the consequences with regard to the required sizes of fuel cell and battery as well as the optimal configuration for a propulsive direct-hybrid system for aviation have not been examined yet. In this work it is demonstrated how the fuel cell system and the battery in a direct-hybrid system can be designed and optimized for a known mission power profile, taking into account the relevant behavior of the fuel cells and the batteries. After a first preliminary calculation of a hybrid configuration, the size of battery and fuel cell are optimized to reduce oversizing. After defining different possible system configurations that can meet the power demand of a specific mission profile, it is examined how the different hybrid configurations affect the required energy amount that is provided by the battery during take-off and climb, as well as the resulting hydrogen consumption. In addition to this, the fuel cell and battery weight for the different configurations is analyzed and compared.
2. Direct-Hybrid
The combination of a battery and a fuel cell in a hybrid provides a propulsion system that delivers high power when the demand peaks, while taking advantage of the high specific energy of hydrogen during phases with a lower demand. In a direct-hybrid, the fuel cell and the battery are connected to a powertrain, as shown schematically in Figure 1, without the use of a DC/DC converter. Diodes are installed to prevent the current from flowing backwards into the fuel cell or the battery. If a charging function of the battery is to be included in the system, the diode in the battery path has to be bypassed or eliminated.
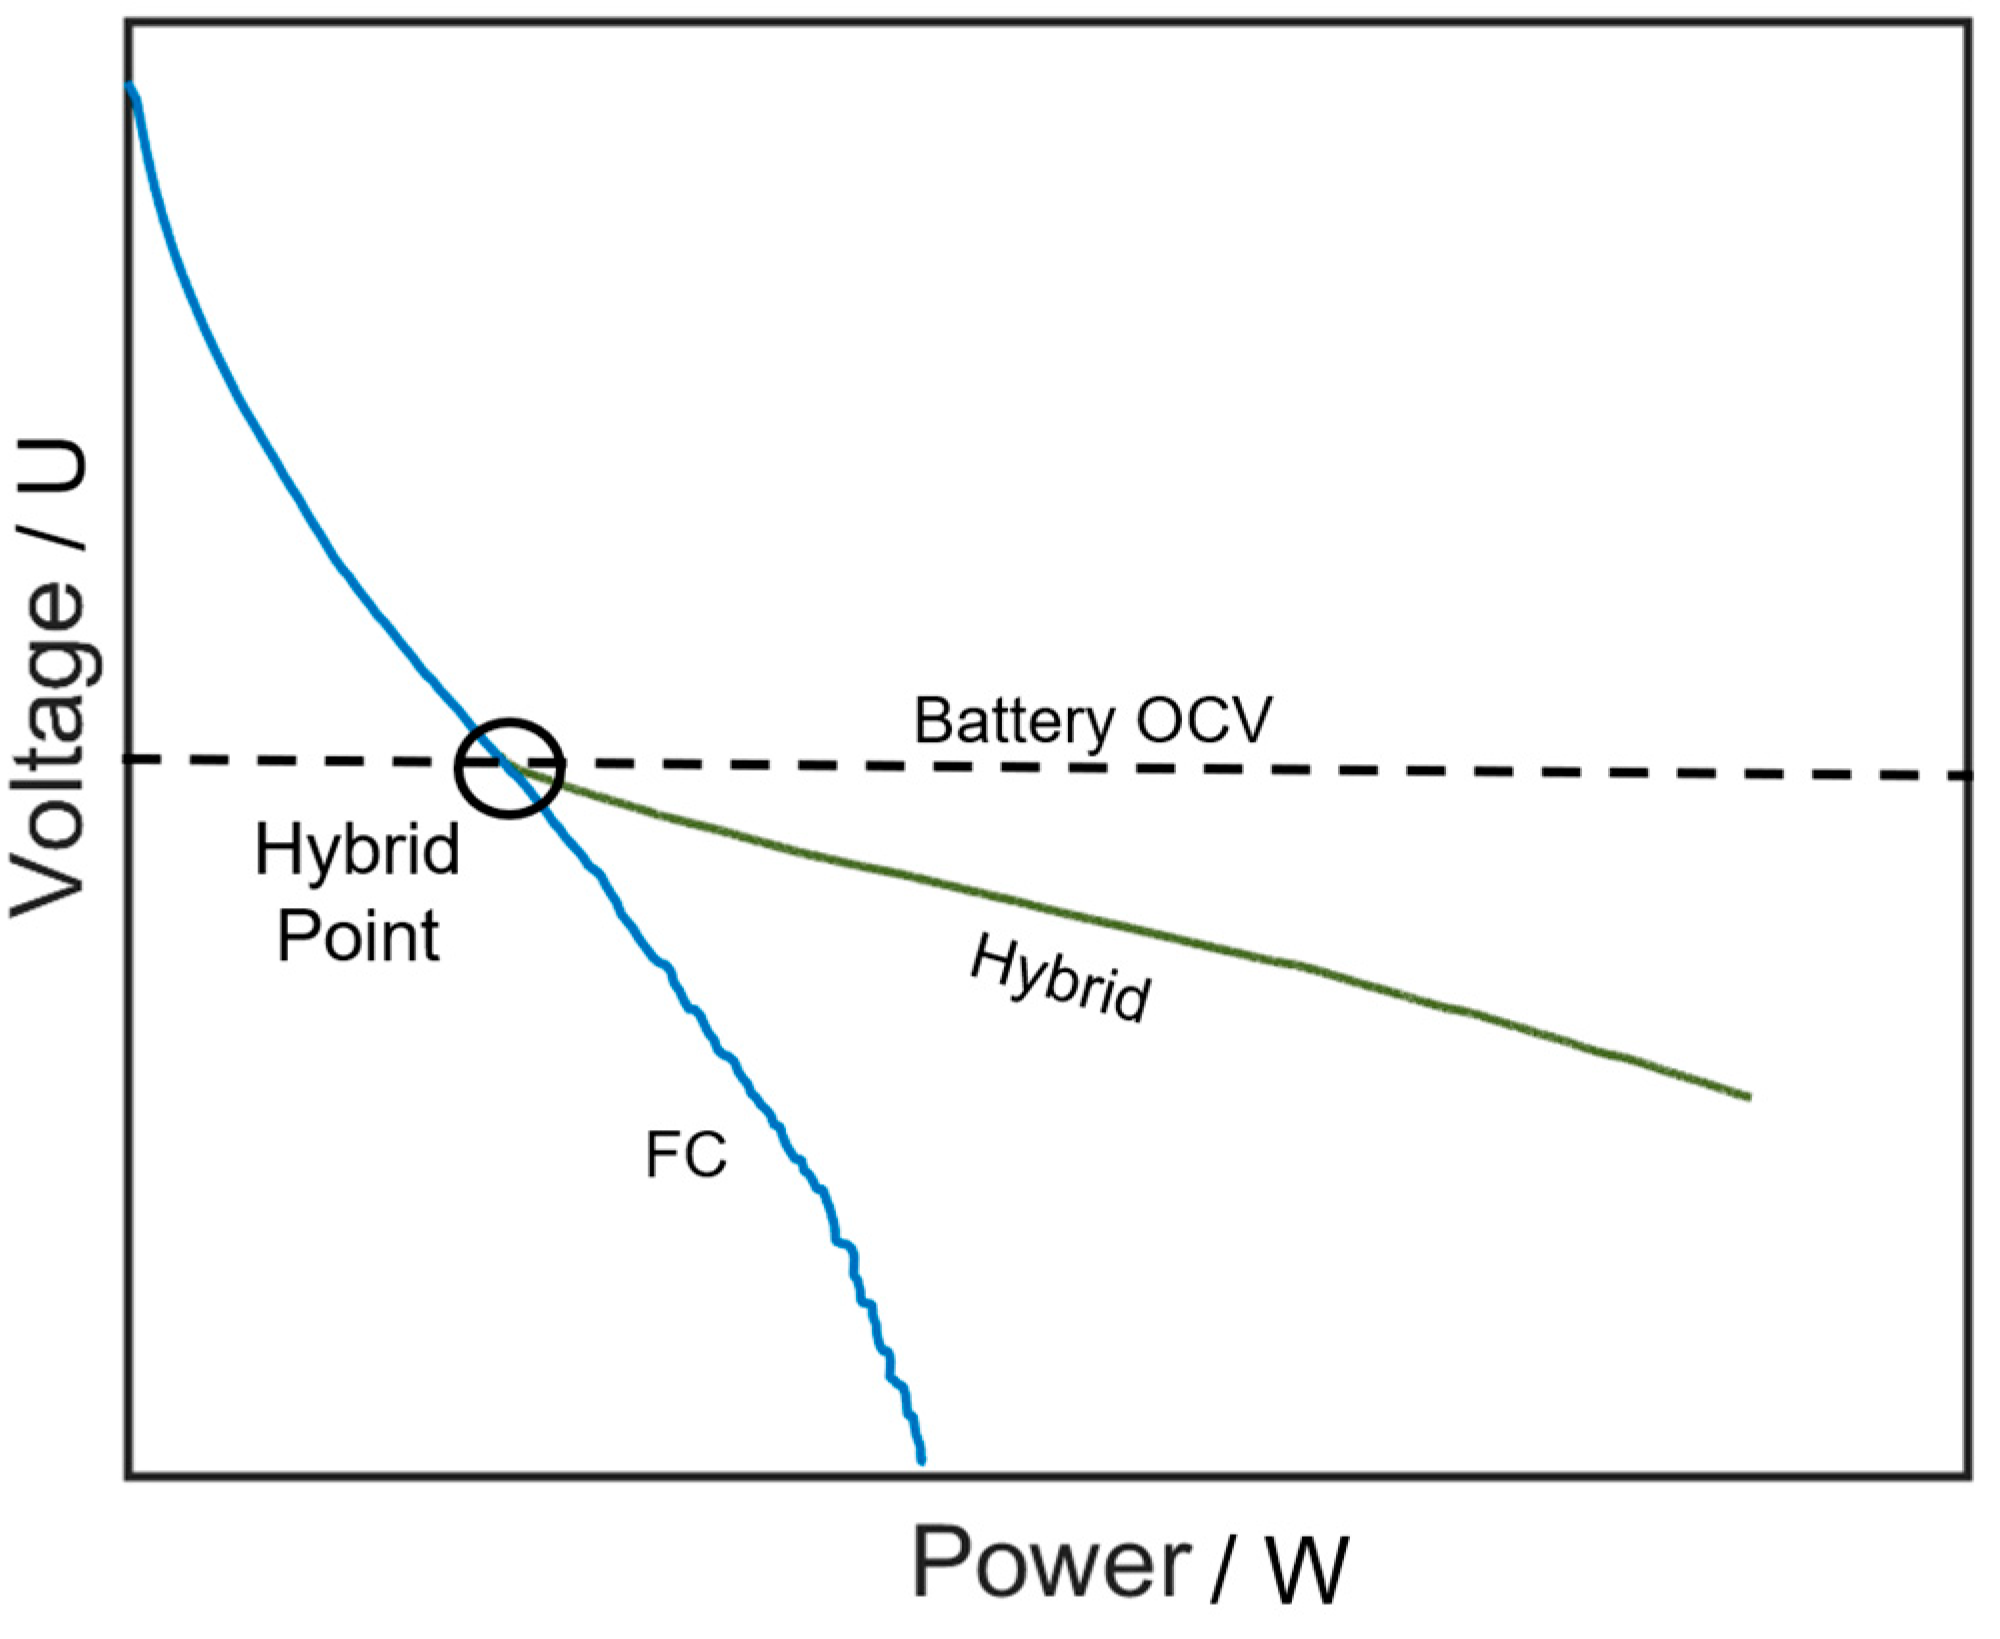
In a setup as shown in Figure 1, the voltage levels in the system are determined by the voltage levels of the fuel cell and the battery. Figure 2 schematically shows the characteristic curve of a fuel-cell-only system (blue line) and the characteristic curve for a direct-hybrid system (green line) in which the fuel cell is combined with a battery in the configuration as shown in Figure 1. The graphic also shows the open circuit voltage (OCV) of the battery.
At low power levels, only the fuel cell supplies power. As power demand increases, the fuel cell voltage decreases in the hybrid system until it reaches the OCV of the battery. At this point, referred to as the hybrid point, the battery begins to deliver power as well. At higher power levels (to the right side of the hybrid point in Figure 2), both the fuel cell and the battery supply power, resulting in a less pronounced gradient of the characteristic curve compared to a fuel-cell-only curve as well as a higher power output. Connecting the battery to the system stabilizes the voltage level, which leads to a higher system voltage level at the same power due to the voltage of the battery [29].
If the battery is used during cruise, it is discharged which reduces the range of flight. To maximize the utilization of the fuel cell during long-term low power phases and save the energy from the battery for flight phases with high power demand, the battery can be disconnected from the system by opening the switch that connects it to the powertrain (see Figure 1). When the switch is opened, the entire power is drawn from the fuel cell. In the case of high-power outputs (to the right side of the hybrid point) this leads to a lower voltage at the equivalent power level than in hybrid mode, as can be seen from Figure 2. Still, the battery should be disconnected whenever the fuel cell is capable of delivering the power on its own.
3. Hybrid Data Base
The behavior of a direct-hybrid system, composed of a fuel cell and a battery, depends on the characteristics of these two components. To select the ideal size of these two components for them to match the necessary power during all flight phases, a detailed knowledge of the behavior of the fuel cell and the battery at different operating conditions is required. The following section sums up the relevant fuel cell and the battery behavior.
3.1. Fuel Cell
When the altitude increases during flight, the ambient pressure decreases, as described by the International Standard Atmosphere [30]. The decreasing ambient air pressure directly affects the cathode pressure in a non-pressurized fuel cell system, which in turn affects fuel cell performance [11,31,32].
To obtain pressure dependent data for the fuel cell, experimental data that were presented previously for 300 mbar, 500 mbar, 700 mbar, and 950 mbar [28] were used. The data were linearly interpolated for pressure values between the measured ones. The fuel cell data are based on a PEM (proton exchange membrane) fuel cell stack consisting of 100 single cells with a rated power of 10 kW (type HD10, Cummins Inc., Columbus, IN, USA) with a current rating of 190 A, and a voltage range from 50 to 100 VDC.
Figure 3 shows the voltage over power curves for one single fuel cell at different operating pressures (based on the HD10 stack) [36]. The pressures shown correspond to altitudes between ground level (950 mbar) and 25,000 ft (376 mbar). The figure shows the expected decrease in power with lower pressure. For a fuel cell, a minimum operating voltage is usually defined to prevent excessive aging. For the following considerations a minimum cell voltage of 0.6 V is assumed. This is marked as a red line in Figure 3. According to the international standard atmosphere, the ambient temperature decreases as well at high altitude [30]. For the presented considerations, it is assumed that with respect to temperature and humidity, the air is preconditioned before it enters the fuel cell and the influence of temperature and humidity is therefore not considered.
In a fuel cell system, many cells can be connected in series to form a stack. Connecting cells in series increases the voltage level of the system. Several stacks can be electrically connected to each other in series or in parallel. A parallel connection leads to a higher power output due to higher currents at the same voltage level. The optimal choice between serial or parallel connection depends on the specific requirements of the application, such as the desired voltage level and the power output for the particular application, e.g., flight mission.
3.2. Battery
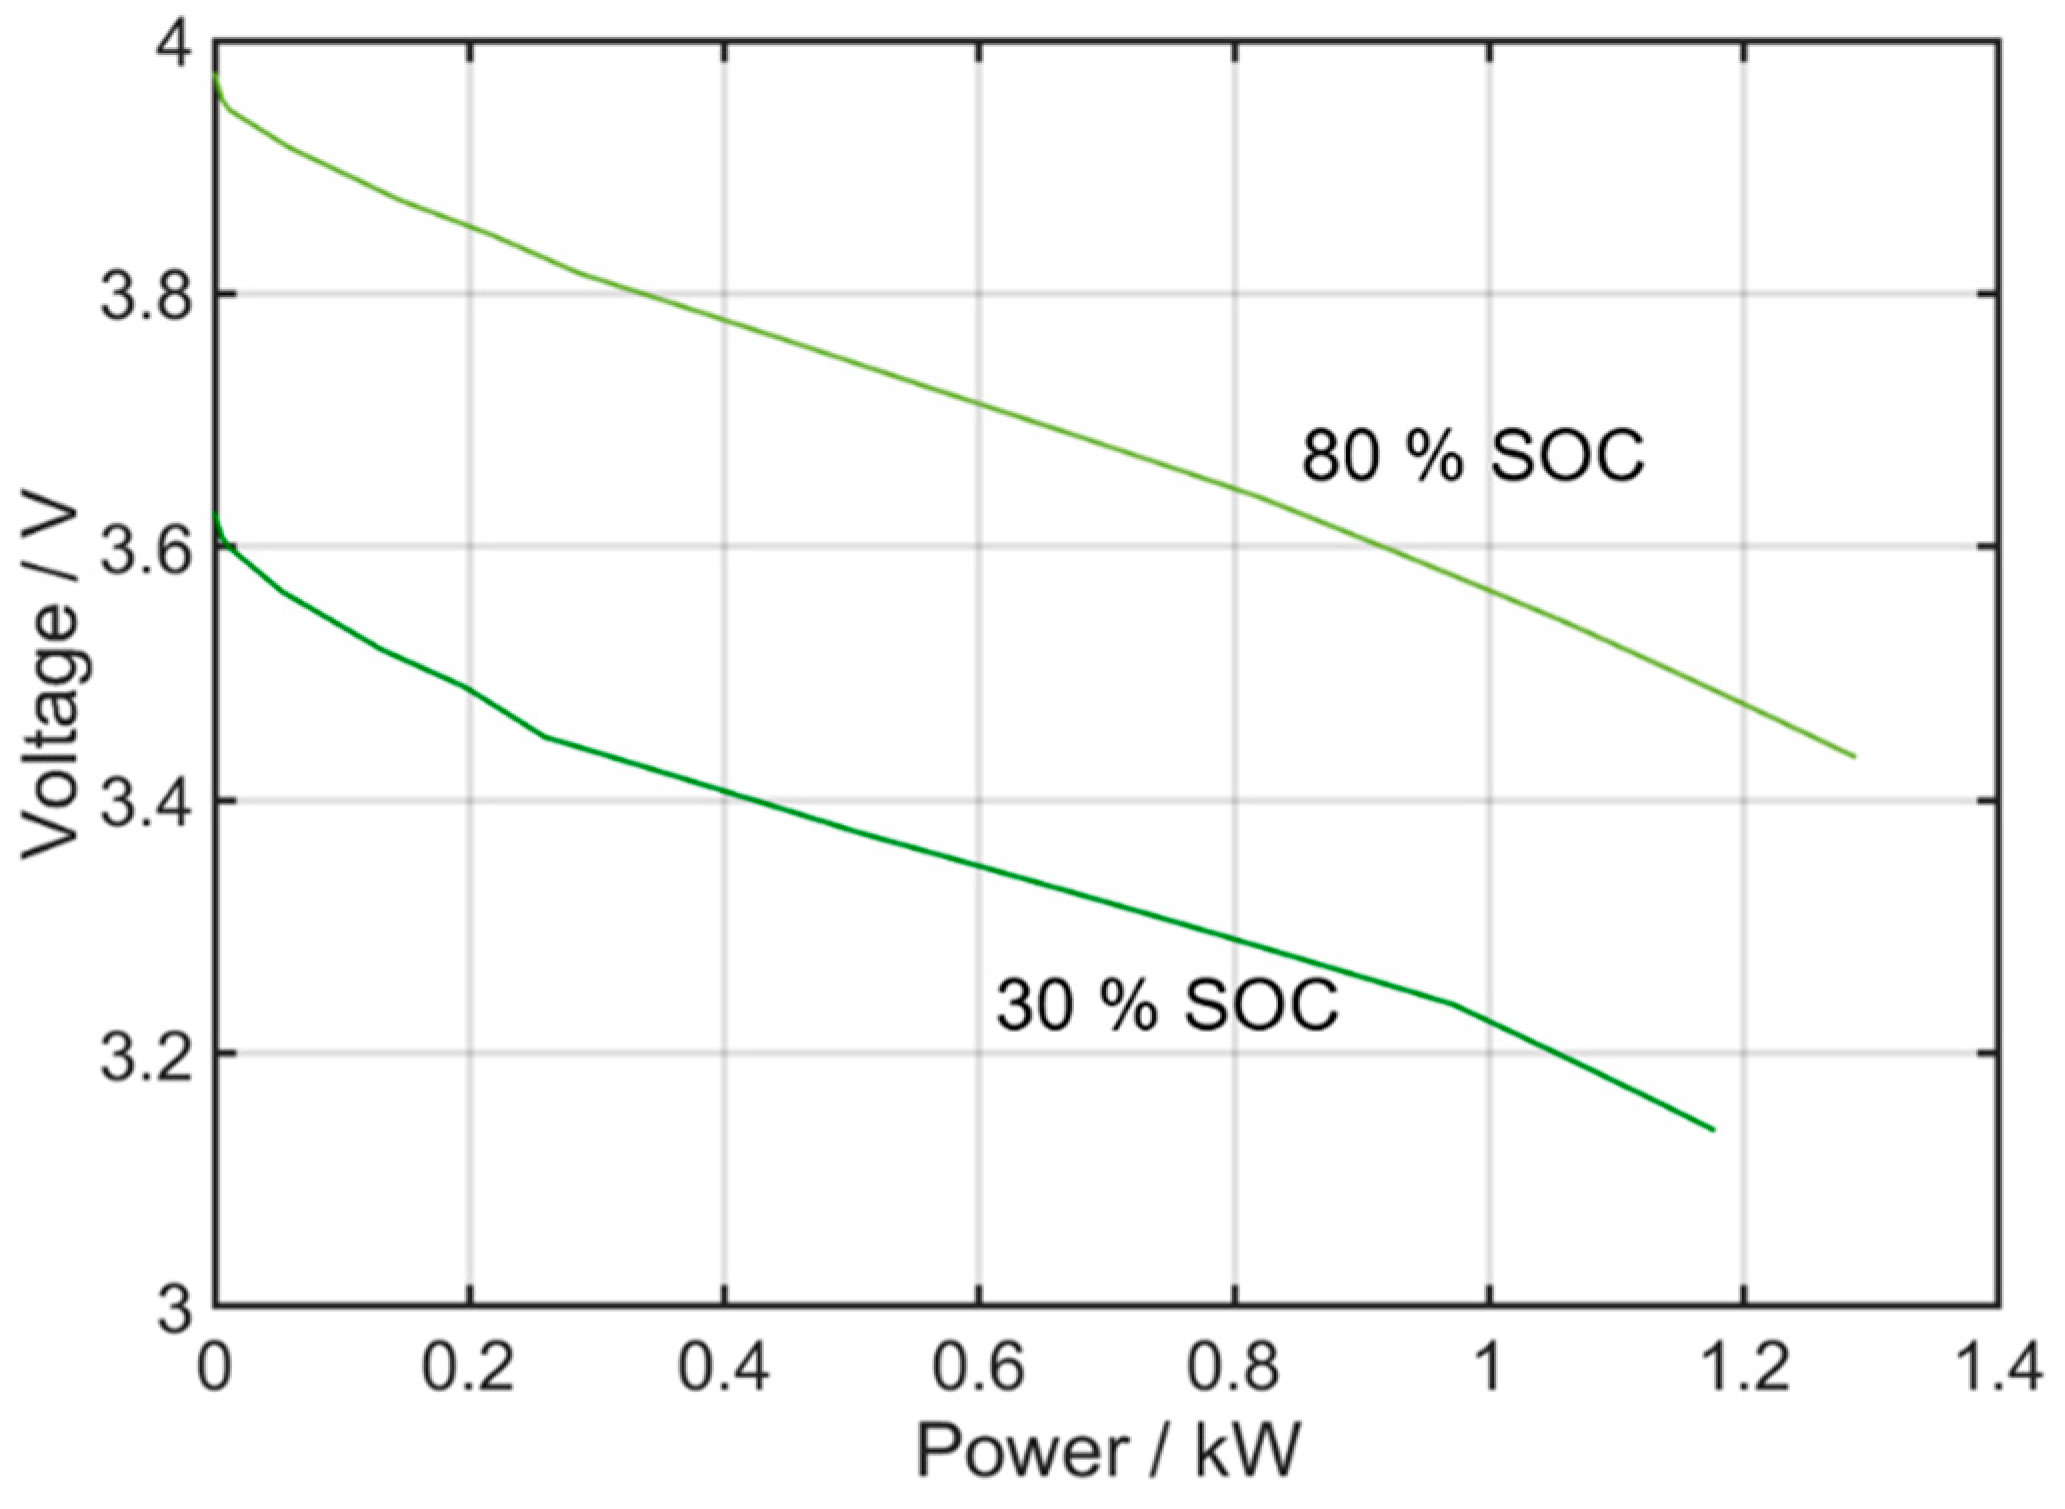
Since in a direct-hybrid there is no DC/DC to adapt the voltage levels of the fuel cell and battery, the voltage levels of these two components must match in any load scenario. The voltage of a battery changes strongly with the state of charge (SOC) and the discharge rate, as can be seen in Figure 4 which shows the voltage of a lithium-ion battery cell plotted against the cell power for two different SOC levels (30% and 80%). The data in Figure 4 are based on previously published data of a single battery cell (type SLPB120255255, 75 Ah pouch, Kokam Co., Ltd., Suwon, Republic of Korea) [29]. It can be seen that a lower state of charge leads to a lower voltage and to a reduced maximum power.
As for a fuel cell, a battery pack can be made by connecting several cells in parallel or series, in order to obtain the desired voltage and current characteristics. To be able to discharge the battery pack over the desired SOC range, the battery pack voltage must match the fuel cell and powertrain voltage across this SOC range. Due to safety aspects, a minimum SOC is required for takeoff; therefore, the minimum allowed SOC is the relevant parameter for choosing the size of the battery pack for a direct-hybrid system.
4. Mission Profile
The parameters of the flight mission, its cruising altitude and required take-off and cruise power determine the requirements for the powertrain. The altitude has a direct impact on the operating conditions (especially the cathode pressure) that the fuel cell is exposed to. The maximum power is determined by the take-off power which is the power output that the direct-hybrid system must deliver, while the cruise power determines the power that must be provided from the fuel cell only.
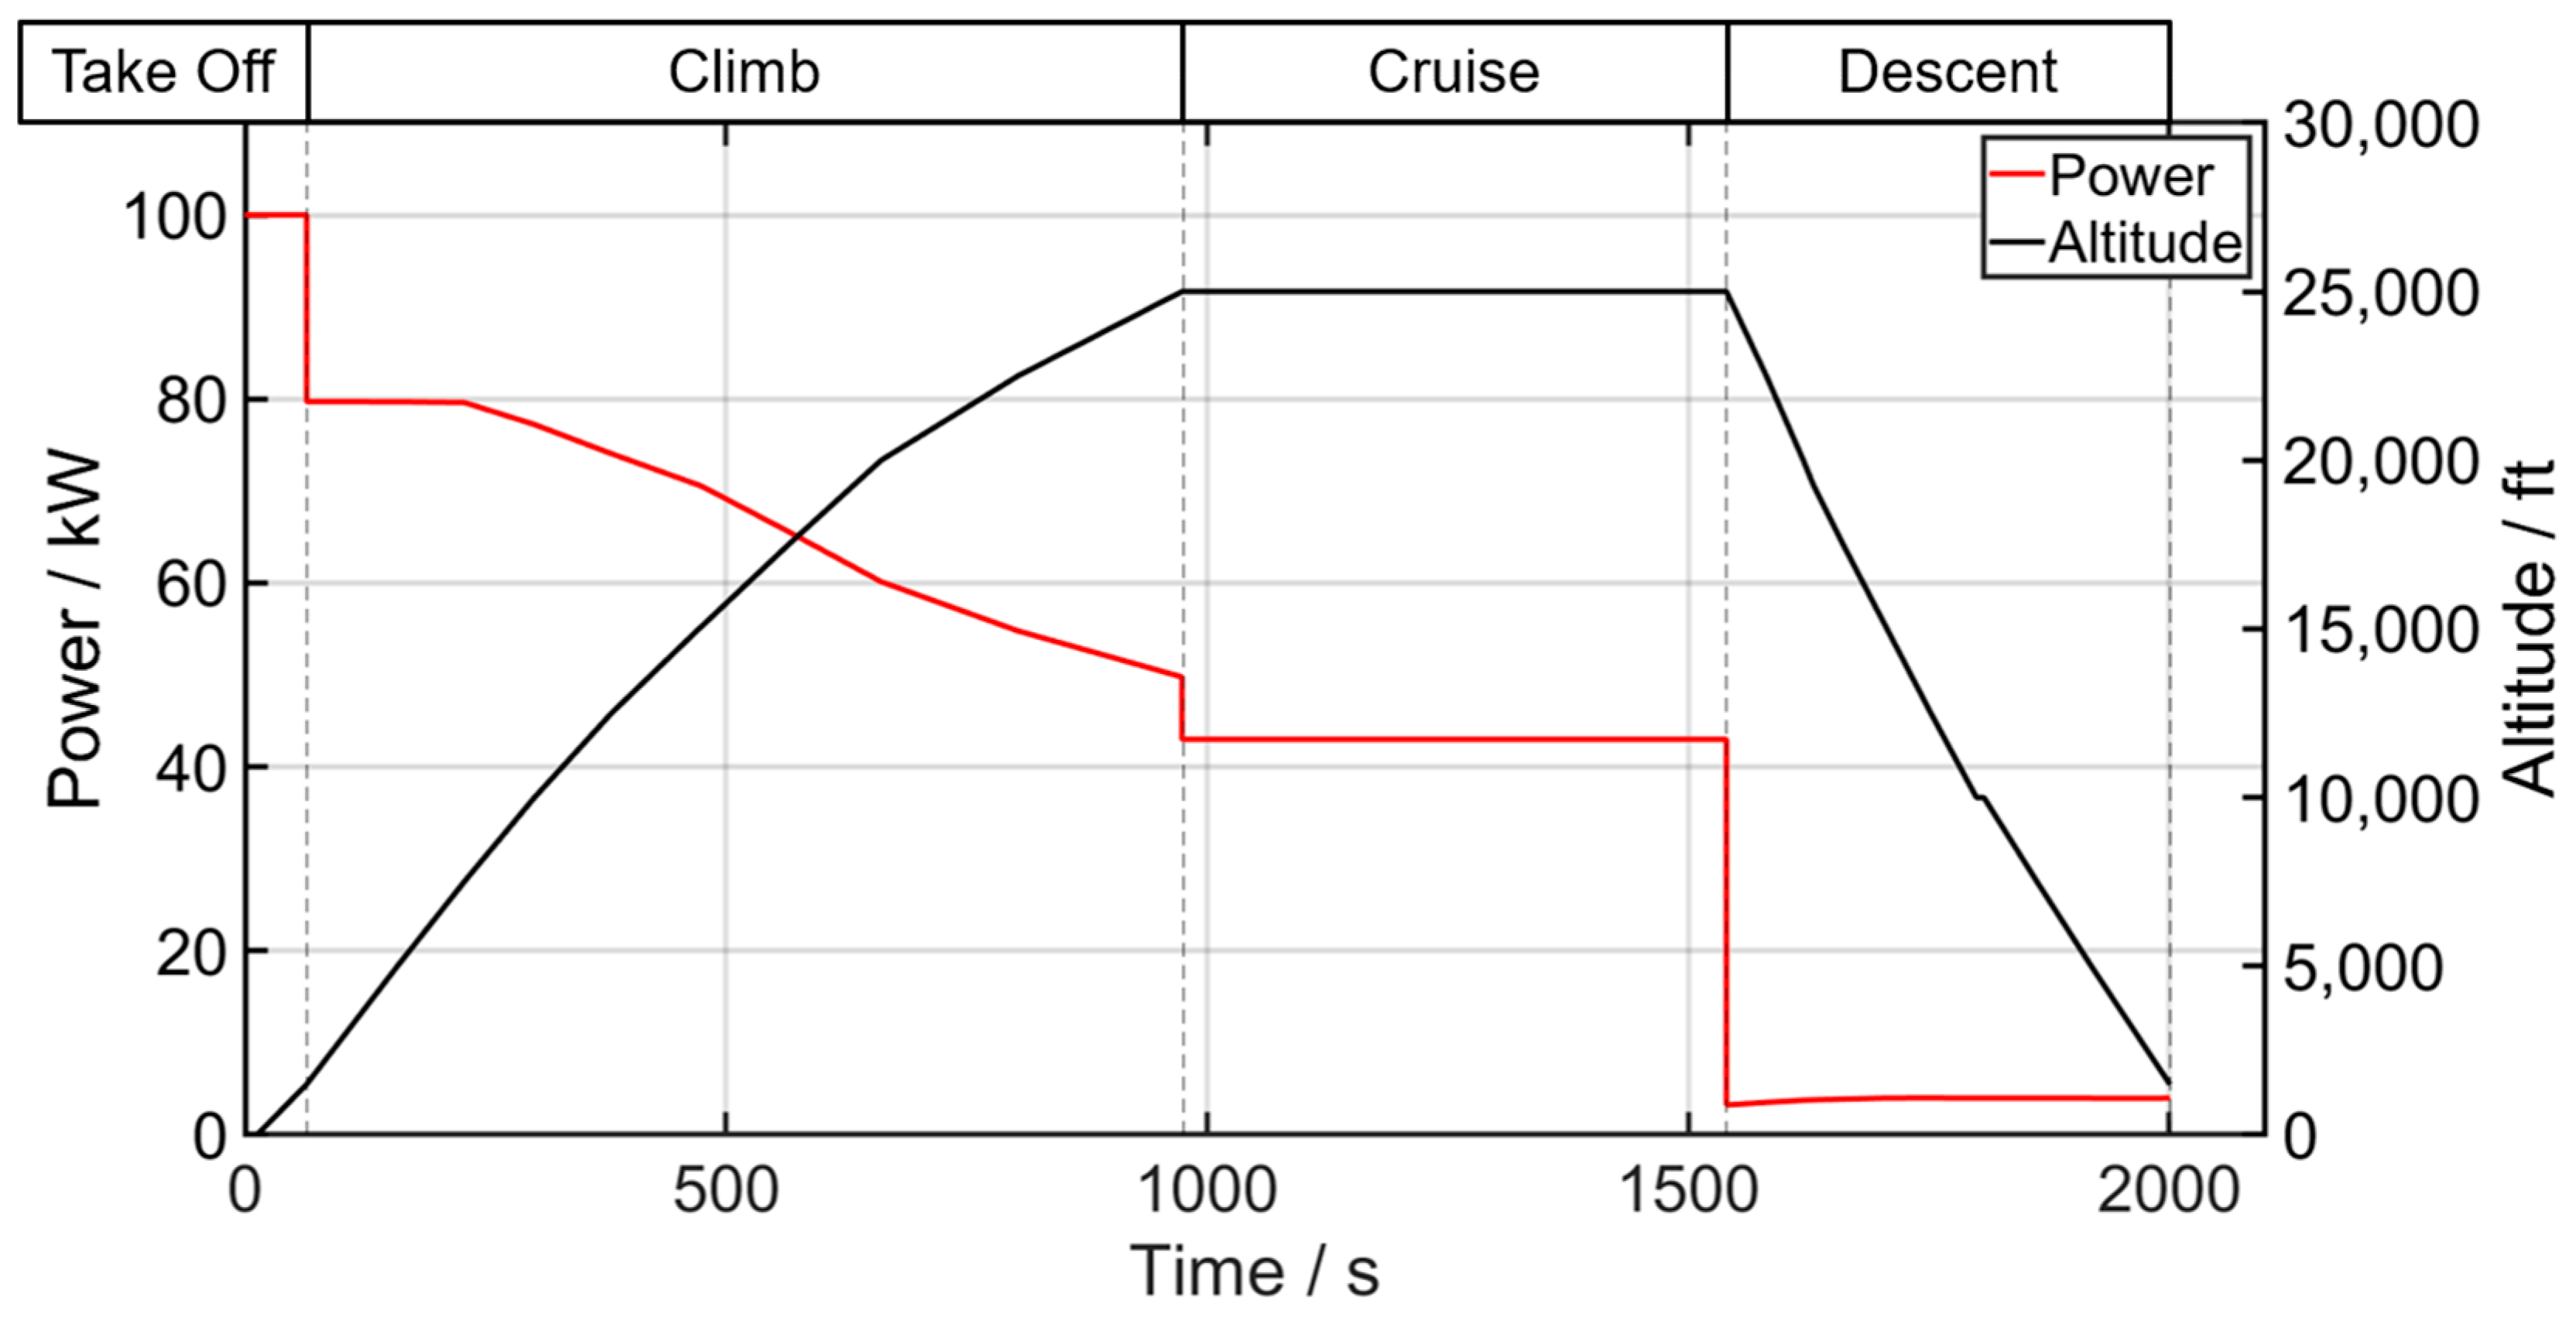
To demonstrate the process in which a direct-hybrid system can be designed, an example mission profile based on the shaft power of a 40-seater aircraft of the Do328 class was used. The cruising altitude considered was 25,000 ft, which corresponds to an ambient pressure of 376 mbar [30]. The original mission profile, with a maximum power of 4096 kW was provided by Deutsche Aircraft GmbH. The shaft power profile was scaled down to a maximum power of 100 kW, as can be seen in Figure 5, to stay within the limits of the lab setup for later experimental analysis [29]. For upscaling and meeting the higher power demand of for example the Do328, the used hybrid module, consisting of fuel cell system and battery, would be implemented multiple times to meet the total required power. This modular approach also aids with the required redundancy in aviation.
The profile from Figure 5 consists of four sections: take-off, climb, cruise, and descent. The shown cruise phase is shortened and can be extended based on the distance that the aircraft should travel or the amount of hydrogen that is available. During cruise, it is advisable to provide full power only from the fuel cell system to fully use the high specific energy of hydrogen and increase the range of the all-electric aircraft. During take-off and climb, when additional power is needed, the additional power is supplied by the battery that has a high specific power. This makes it possible to avoid the oversizing of the fuel cell. During descent there is a low power demand. This can easily be met by the fuel cell alone and it is also possible to recharge the battery.
5. Sizing of a Direct-Hybrid System
Based on the experimental battery and fuel cell data introduced in chapter 3 and the mission data from chapter 4, different possible hybrid configurations were calculated. The methodology used for determining the necessary fuel cell and battery size and for optimizing the configuration is explained in in the following chapter.
5.1. Design Point: Fuel Cell
During the cruise phase the fuel cell should be designed in such a way as to be able to supply the entire required propulsive power on its own. To decide on the necessary number of single fuel cell cells to achieve this, the cruise power has to be divided by the power output of a single fuel cell under cruise conditions. This is shown in Equation (1). The power output of a single cell at flight conditions is 35.5 W for the examined fuel cell as shown in Figure 3.
According to this calculation, at an ambient pressure of 376 mbar, 1211 cells are required for a cruise power of 43 kW that is shown in Figure 5. In the examined direct-hybrid system, there is no DC/DC converter to adjust the voltages. Therefore, it is necessary to ensure that the voltage levels of the fuel cell and the rest of the powertrain match. Other electrical components in the powertrain, like the inverter and motor, typically have a maximum and minimum voltage at which they can be operated. The fuel cell needs to be designed to stay within these voltage limits of the powertrain as well.
The process diagram in Figure 6 shows schematically the overall procedure and separate steps of designing the fuel cell according to a mission profile and the voltage limits of the powertrain. Beside the upper and lower voltage limits of the powertrain and , the OCV of a single fuel cell cell at ground level , as well as the voltage and the power of a fuel cell cell under cruise conditions have to be known to start the design process.
The first step of the sizing methodology shown in Figure 6 starts by calculating the number of fuel cell cells in series to stay above the minimum voltage. This is shown in block 1 of Figure 6. The minimum allowed voltage of the powertrain determines the minimum number of cells that must be connected in series. For the presented example, a maximum powertrain voltage of = 500 V and a minimum powertrain voltage of = 300 V have been assumed as shown in Figure 7. Since the number of cells connected in series determines the voltage, Equation (2) is used to decide on the necessary number of serial fuel cell cells. Here, is the minimum allowed voltage of a single fuel cell cell at cruise conditions under load which is defined to be 0.6 V for this example.
The calculation in this first step ensures that the voltage of the fuel cell system does not drop below the minimum voltage of the powertrain during operation.
The second step in block 1 of Figure 6 is that the maximum voltage of the fuel cell system is now compared to the maximum allowed voltage of the powertrain . The maximum voltage of the fuel cell is given by multiplying the maximum voltage of a single fuel cell cell () with the calculated number of serial cells . If the maximum fuel cell voltage is below , the third and last step is to calculate the number of fuel cells connected in parallel according to Equation (3).
However, if the maximum voltage of the fuel cell exceeds the maximum powertrain voltage , the number of serial cells has to be modified and recalculated taking the upper voltage limit into account. In this case, the process follows the path from block 1 into block 2 in Figure 6. In block 2, a new number of single fuel cell cells in series is calculated using Equation (2), but instead of the minimum powertrain voltage the maximum powertrain voltage is used.
It is also possible to exchange the order of blocks 1 and 2 marked in Figure 6. This would lead to a higher overall voltage for the hybrid. Instead of using the minimum voltage of the powertrain as reference for determining the size the fuel cell, the maximum voltage of the powertrain and the OCV of a single fuel cell is used in this case to calculate the number of serial cells (block 2). Afterwards, the resulting voltage of the fuel cell system under cruise conditions is compared to the minimum voltage of the powertrain as described in block 1. If the voltage is within the limits of the powertrain, the parallel sizing can be completed in the next step. However, if the fuel cell voltage under cruise conditions is now lower than the minimum allowed voltage of the powertrain, the operation point of the fuel cell for cruise conditions needs to be changed, a higher value for the voltage at cruise needs to be defined and the design process started again from the beginning.
In the presented example case, 500 single fuel cells must be electrically connected in series to achieve the minimum voltage of the powertrain during cruise. But in order to achieve the desired cruise power, a minimum of 1211 cells are needed in total. Therefore, the fuel cell system must also be scaled in parallel. By adding cells in parallel, the power output of the fuel cell at the same voltage level is increased. Equation (3) is used to determine the number of cells in parallel (). Here, is the number of cells connected in series, is the desired cruise power, and is the power output of a single fuel cell cell at cruise conditions.
For a PEM fuel cell stack with 500 cells in series and a cruise power of 43 kW, the calculation from Equation (3) yields a necessary number of 2.42 parallel fuel cell stacks. Since a fuel cell cannot be divided, three parallel stacks are used for the system. This rounding leads to an oversizing of the fuel cell system, which can only be avoided by choosing or designing a different fuel cell, for example, with a different cell size.
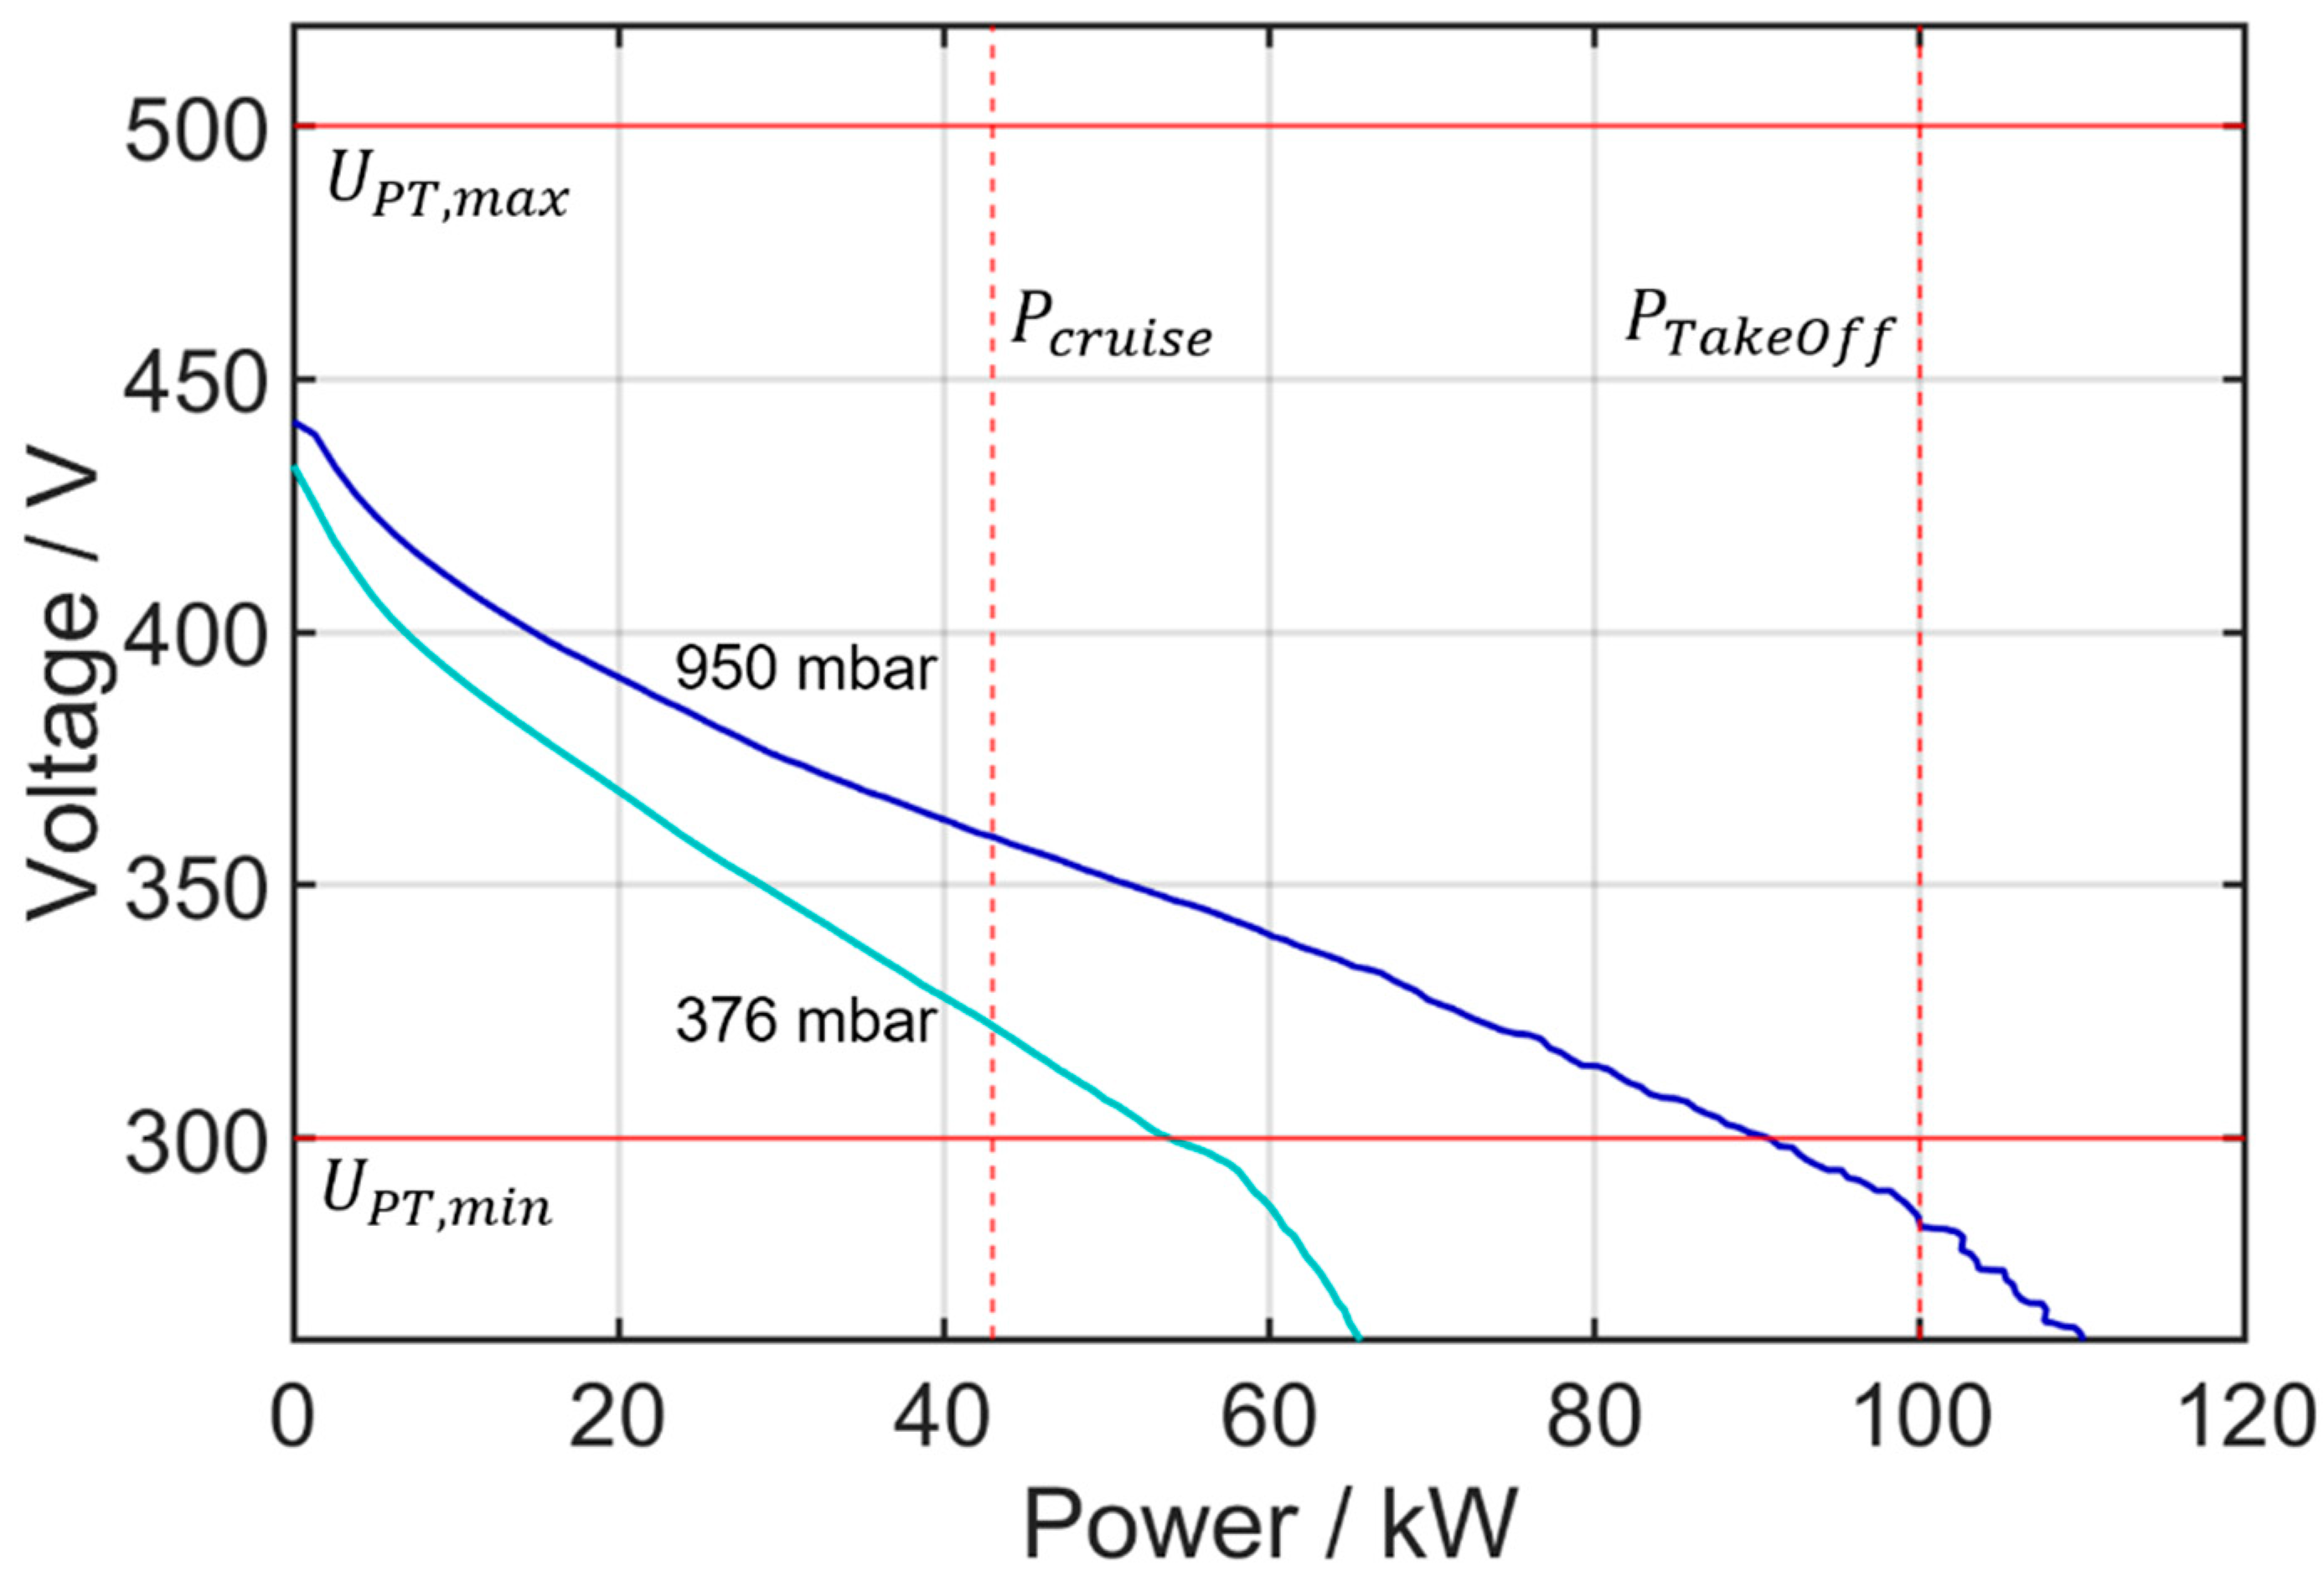
Figure 7 shows the fuel cell characteristic curves of the system as designed above (with 500 cells in serial and three stacks in parallel) for two different pressure levels. The operation on ground is represented by an ambient pressure of 950 mbar, while 376 mbar corresponds to the pressure at the assumed cruise altitude of 25,000 ft. The graph also shows the minimum and maximum voltage of the powertrain that is defined by the limits of the inverter, as well as the required cruise and take-off power.
It can be seen in Figure 7 that the voltage–power curves of the fuel cell system do not exceed the voltage limits of the powertrain at cruise power, confirming the correctness of the calculated number of fuel cells in series. Considering the characteristic fuel cell curve at 376 mbar, it can be seen that the fuel cell will deliver 53 kW when , is reached. This is more than the required 43 kW for cruise as defined in Figure 5. However, looking at the curve for ground level at a pressure of 950 mbar, the fuel cell can only deliver 90 kW until , is reached, which is less than the desired 100 kW take-off power defined by the mission profile. Therefore, hybridization with a battery is required.
5.2. Design Point: Battery
Once the fuel cell system has been defined, designing the battery size is a direct consequence of the previously made considerations on designing the fuel cell system. In order to fulfill the take-off power requirement, the fuel cell is combined with the battery in a hybrid system. To determine the size of the battery, the maximum and minimum state of charge (SOC) for take-off must be defined and set. For the presented example, a maximum of SOC of 80% and a minimum SOC of 30% have been chosen.
To ensure the minimum voltage of the powertrain () is met, the battery is scaled according to its minimal voltage at minimal take-off SOC (). The battery has its lowest voltage at the maximum current at 5 C ( = 3.14 V at 30% SOC as can be seen from Figure 4). To calculate the number of battery cells in series, the minimal powertrain voltage is divided by as shown in Equation (4). For the examined example, this leads to a number of 96 battery cells connected in series.
The fuel cell battery configuration obtained through the sizing method presented in this chapter for the example mission profile consists now of three parallel fuel cell stacks with 500 serial cells as well as 96 serial battery cells. The design process considered the low pressure influence of the fuel cell as well as the different voltages at different SOC levels of the battery. This configuration will be refered to as hybrid 1 in the following chapters.
6. Analysis and Optimization of the Designed Direct-Hybrid System
6.1. Analysis of the Designed Hybrid
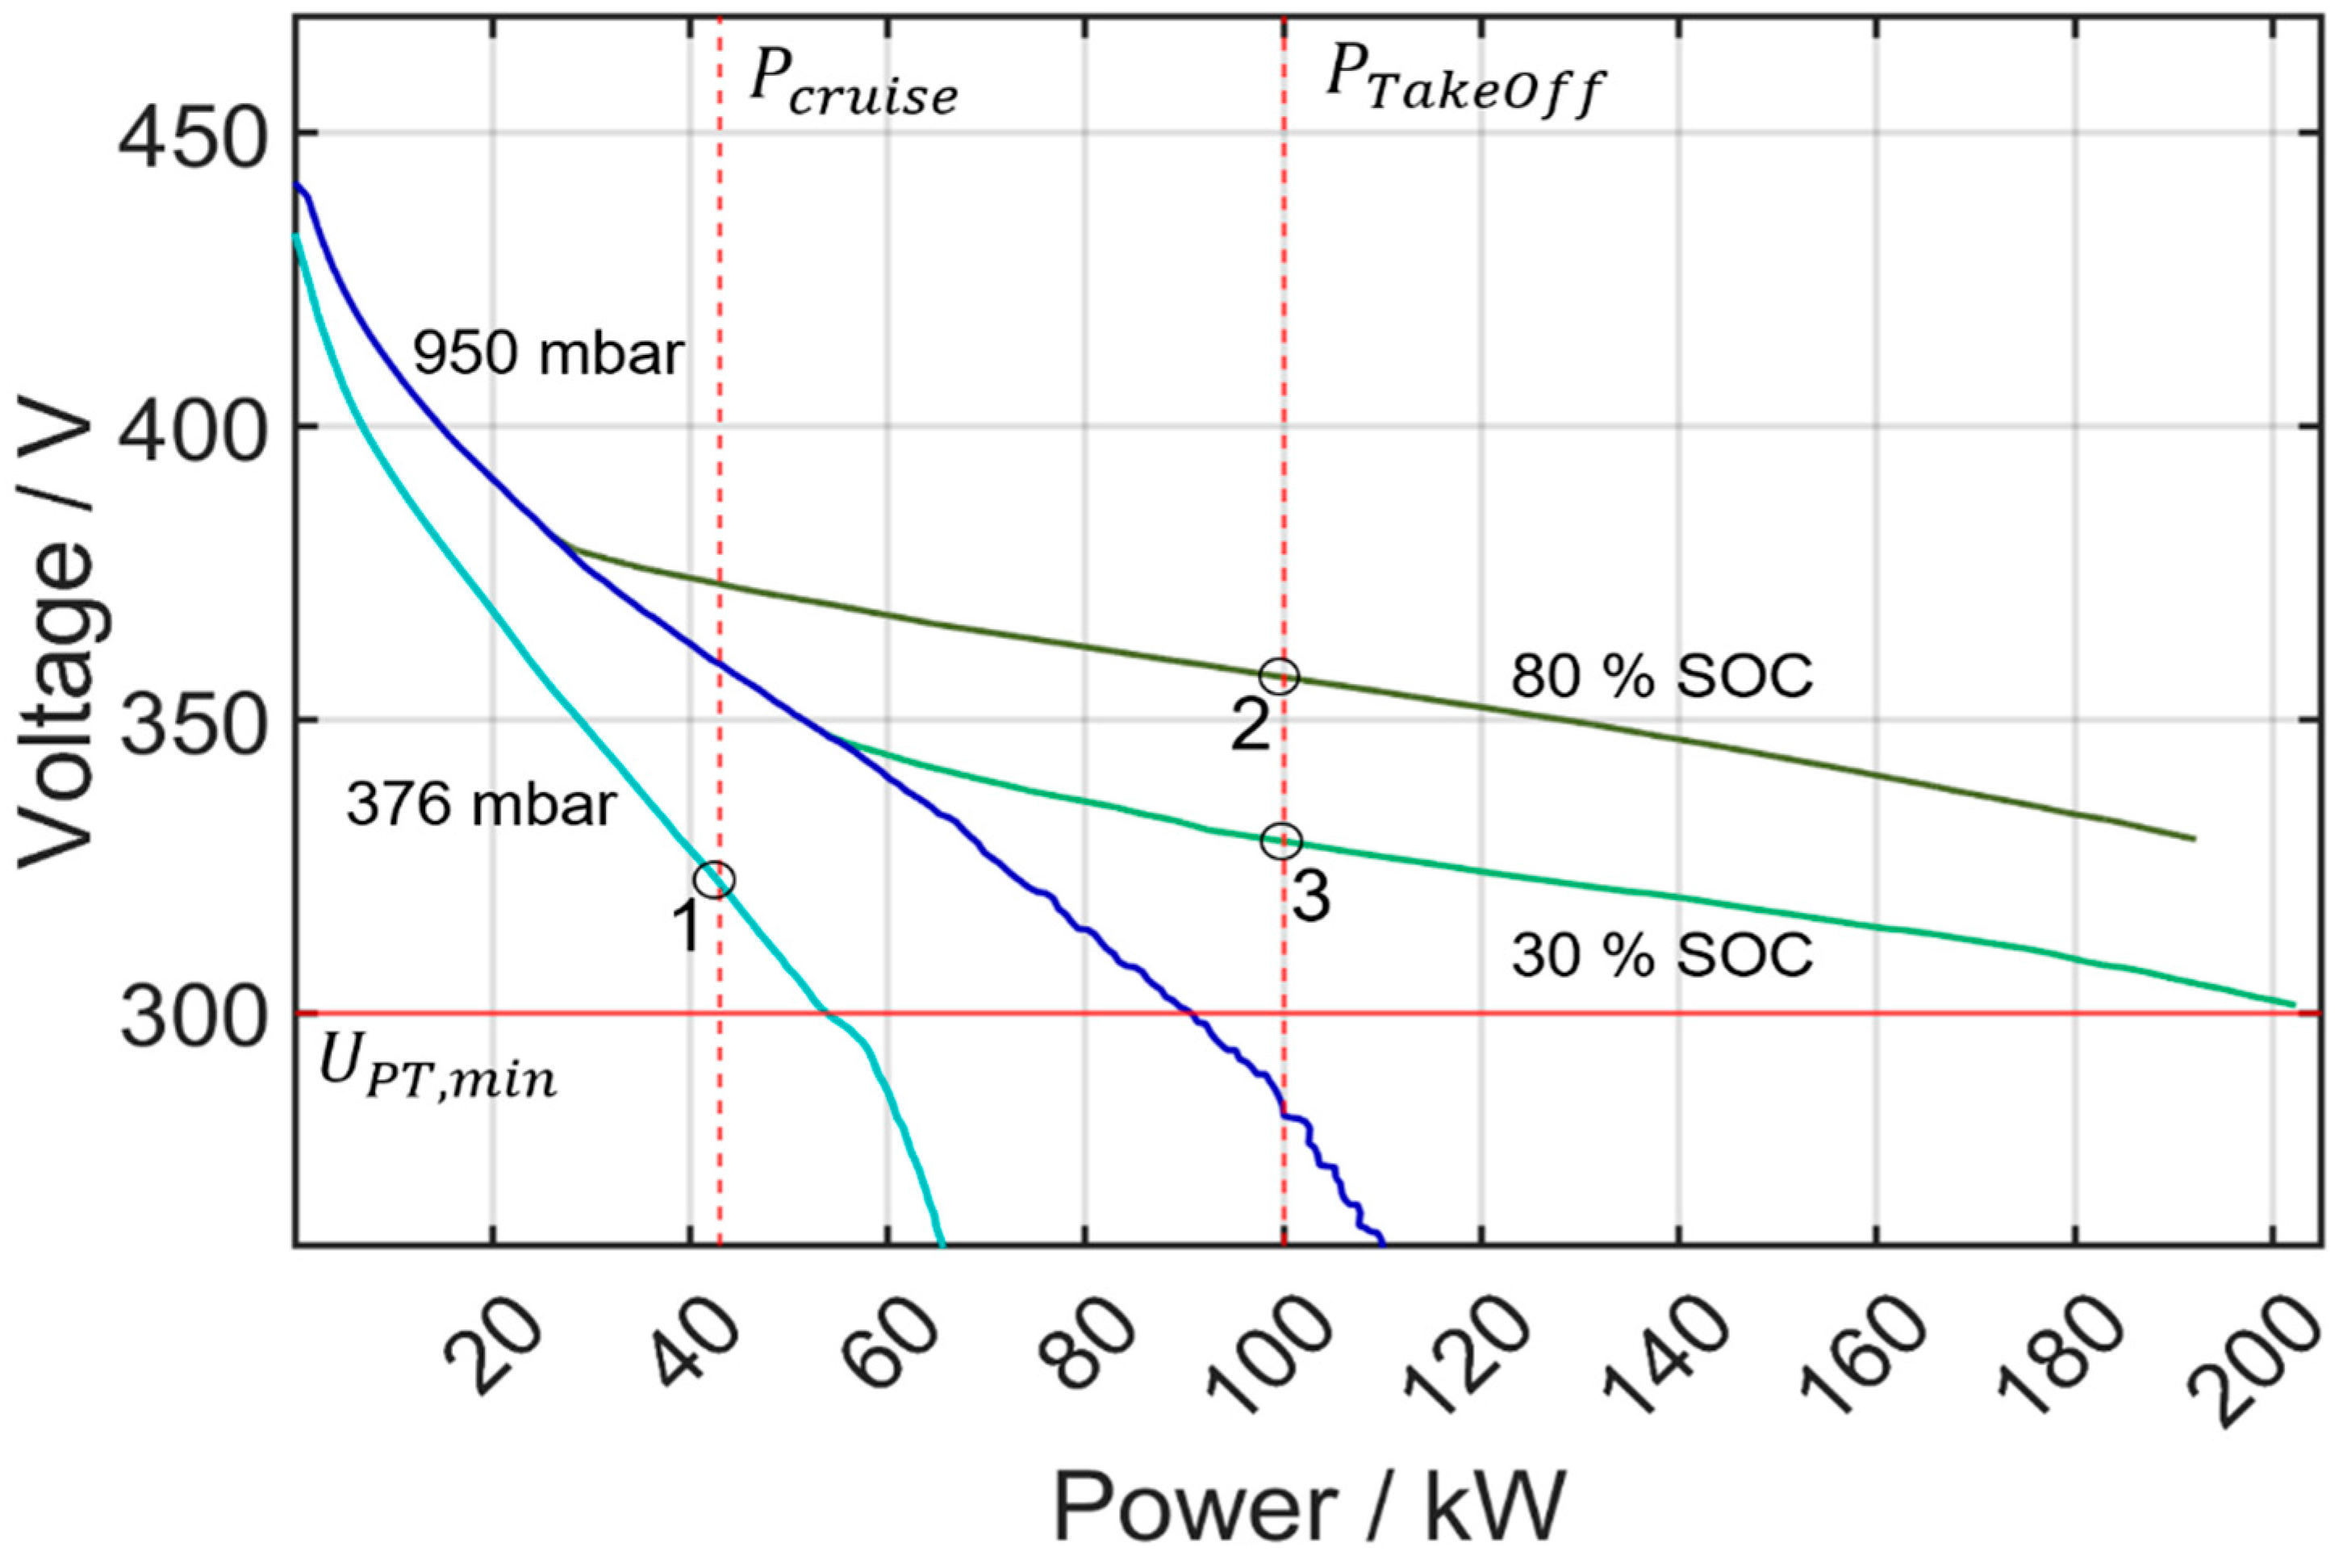
The characteristic voltage–power hybrid curves for the system consisting of a number of 500 serial fuel cells, three parallel fuel cell stacks and 96 serial battery cells, as determined in the previous section, are shown in Figure 8. The figure shows the characteristic fuel cell curves at 950 mbar (dark blue) and 376 mbar (light blue) and the resulting hybrid curves at 950 mbar ambient pressure for 80% (dark green) and 30% SOC (light green). The required take-off and cruise power are marked with dotted red lines, as well as the minimum voltage of the powertrain of 300 V (red solid line). It is shown that at cruise conditions (at a pressure of 376 mbar), the fuel cell can deliver 53 kW at the minimum powertrain voltage, which is equal to the minimum operating voltage of the fuel cell. A power of 53 kW is 24% higher than the required 43 kW for cruising. To avoid this oversizing, a different fuel cell with a different cell power output would be required. This could be achieved by a different cell technology or a different cell area. The operating point of the fuel cell during cruise is marked as point 1 in Figure 8. Due to the oversizing of the fuel cell, the voltage at 43 kW fuel cell power is higher (322 V) than the required minimum voltage of 300 V.
Figure 8 also shows that the take-off power of 100 kW at ground level can only be provided in the hybrid configuration (green). For a lower battery SOC, the hybrid voltage is lower (compare point 2 and 3). It can be seen from Figure 8 that both SOC levels are capable of delivering and even exceeding the required take-off power. At 80% SOC, the hybrid system is capable of delivering 192 kW, which is a little less than twice as high as the power required for take-off. At 30% SOC, the system can deliver 202 kW. Interestingly, the hybrid system is capable of delivering more power at a lower SOC. This phenomenon in a direct-hybrid system can be explained as follows: As the voltage level of the battery and therefore the system voltage decreases, the fuel cell provides higher currents, which results in higher power being delivered from the fuel cell. For the take-off power of 100 kW and 80% battery SOC (point 2) the hybrid voltage is 357 V, which is above the voltage during cruise when the power is provided by the fuel cell alone (compare point 1), even though cruise takes place at lower powers. This effect is characteristic for a direct-hybrid system. The direct-hybridization of a fuel cell with a battery enlarges the power range and increases the voltage level at a certain power. At take-off power (100 kW) and at 30% SOC a voltage of 329 V is reached (point 3), which is still above the minimum voltage of 300 V. The batteries are not operated at their maximum current rate in this operating point and therefore provide a higher voltage than assumed for the first sizing of the battery in the previous section. Consequently, the size of the battery can be reduced.
6.2. Analysis of the Hybrid with Optimized Battery Size
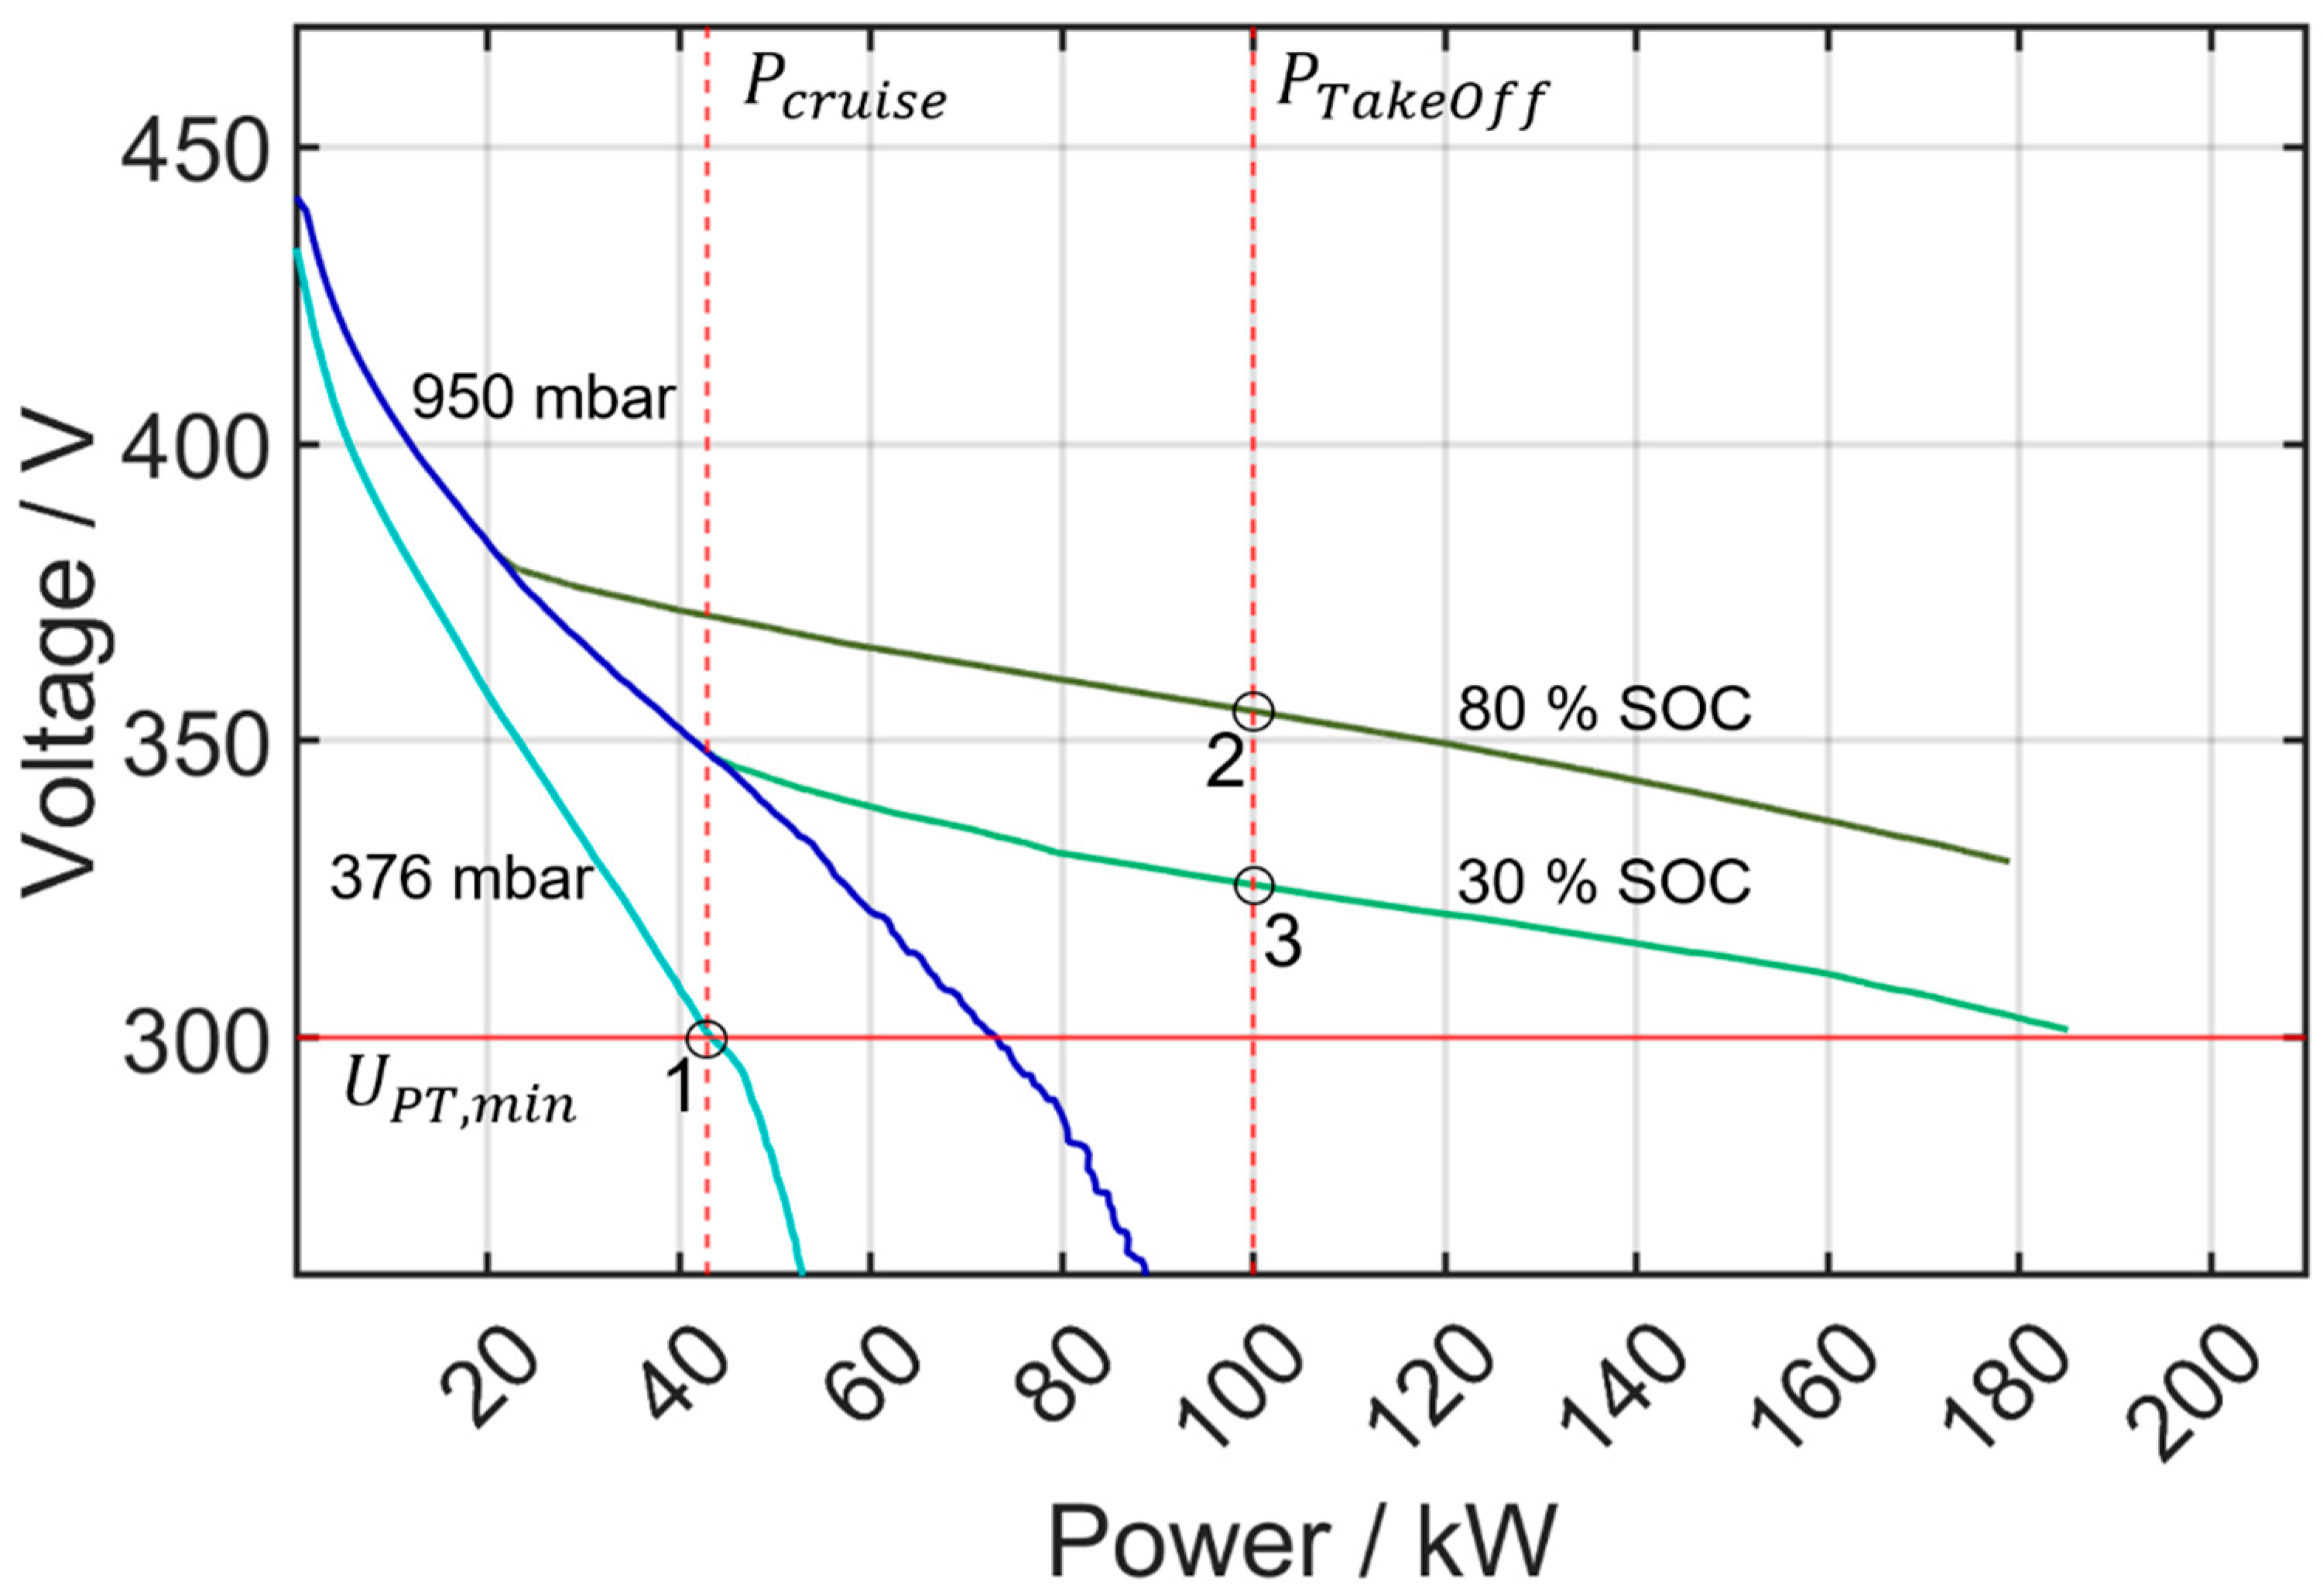
Since the battery does not discharge with its maximum current for the previous layout of the battery, the voltage level is higher than required. For the examined case it is possible to reduce the number of cells by 11, from 96 to 85 serial cells. Figure 9 shows the hybrid curves for the system with the reduced battery size, with the number of battery cells being 85. The fuel cell curves (blue) are the same as those in Figure 8, while the hybrid curves (green) are now located at lower voltage levels due to the reduced cell number of the battery. The voltage at cruise power (point 1) is the same as the cruise voltage in Figure 8 (329 V). At the lowest take-off SOC of 30% and the take-off power of 100 kW, the voltage now equals exactly the minimum voltage of the powertrain (point 3) of 300 V.
Reducing the size of the battery results in a lower battery voltage, which leads to a hybrid point at lower voltage levels (compare Figure 8 (point 2 and 3) and Figure 9 (point 2 and 3)). For a SOC of 80%, the hybrid voltage at 100 kW power is now reduced by 34 V to 323 V. The reduced number of battery cells in series also leads to a reduced voltage of the hybrid point. At the previous hybrid configuration with 96 battery cells the hybrid point is at 379 V (as seen in Figure 8); with 85 battery cells the voltage of the hybrid point is reduced to 336 V. This corresponds to a change of 43 V. A lower voltage of the hybrid point leads to a higher power delivery from the fuel cell before the battery starts contributing. This causes a higher power share of the fuel cell.
If the hybrid voltage at take-off power is already at the minimum powertrain voltage (Figure 9, point 3) and power is drawn from the hybrid, the battery will be further discharged. An even lower SOC results in a lower hybrid voltage for the same power. This means that the voltage drops below the minimum voltage of the powertrain and the initial take-off power of 100 kW is only available at the beginning. After that, the power must be reduced in order to remain above the minimum voltage of the propulsion system. A reduction in power during take-off does not necessarily mean that the aircraft will stop climbing. In fact, according to the mission profile in Figure 5, the aircraft is still climbing with a shaft power of 50 kW. However, the possible rate of climb will be lower. The low take-off SOC of 30% should therefore only be used for take-off in the event of a go-around, i.e., if the first landing attempt fails. To analyze the impact on the climb rate in a potential go-around, flight simulations would be required, which are not part of the design of this direct-hybrid system.
The resulting hybrid configuration from this optimization step consists of three parallel fuel cell stacks with 500 serial cells each and a battery with 85 cells connected in series. This configuration will be referred to as hybrid 2 in the following chapters.
6.3. Fuel Cell Optimization
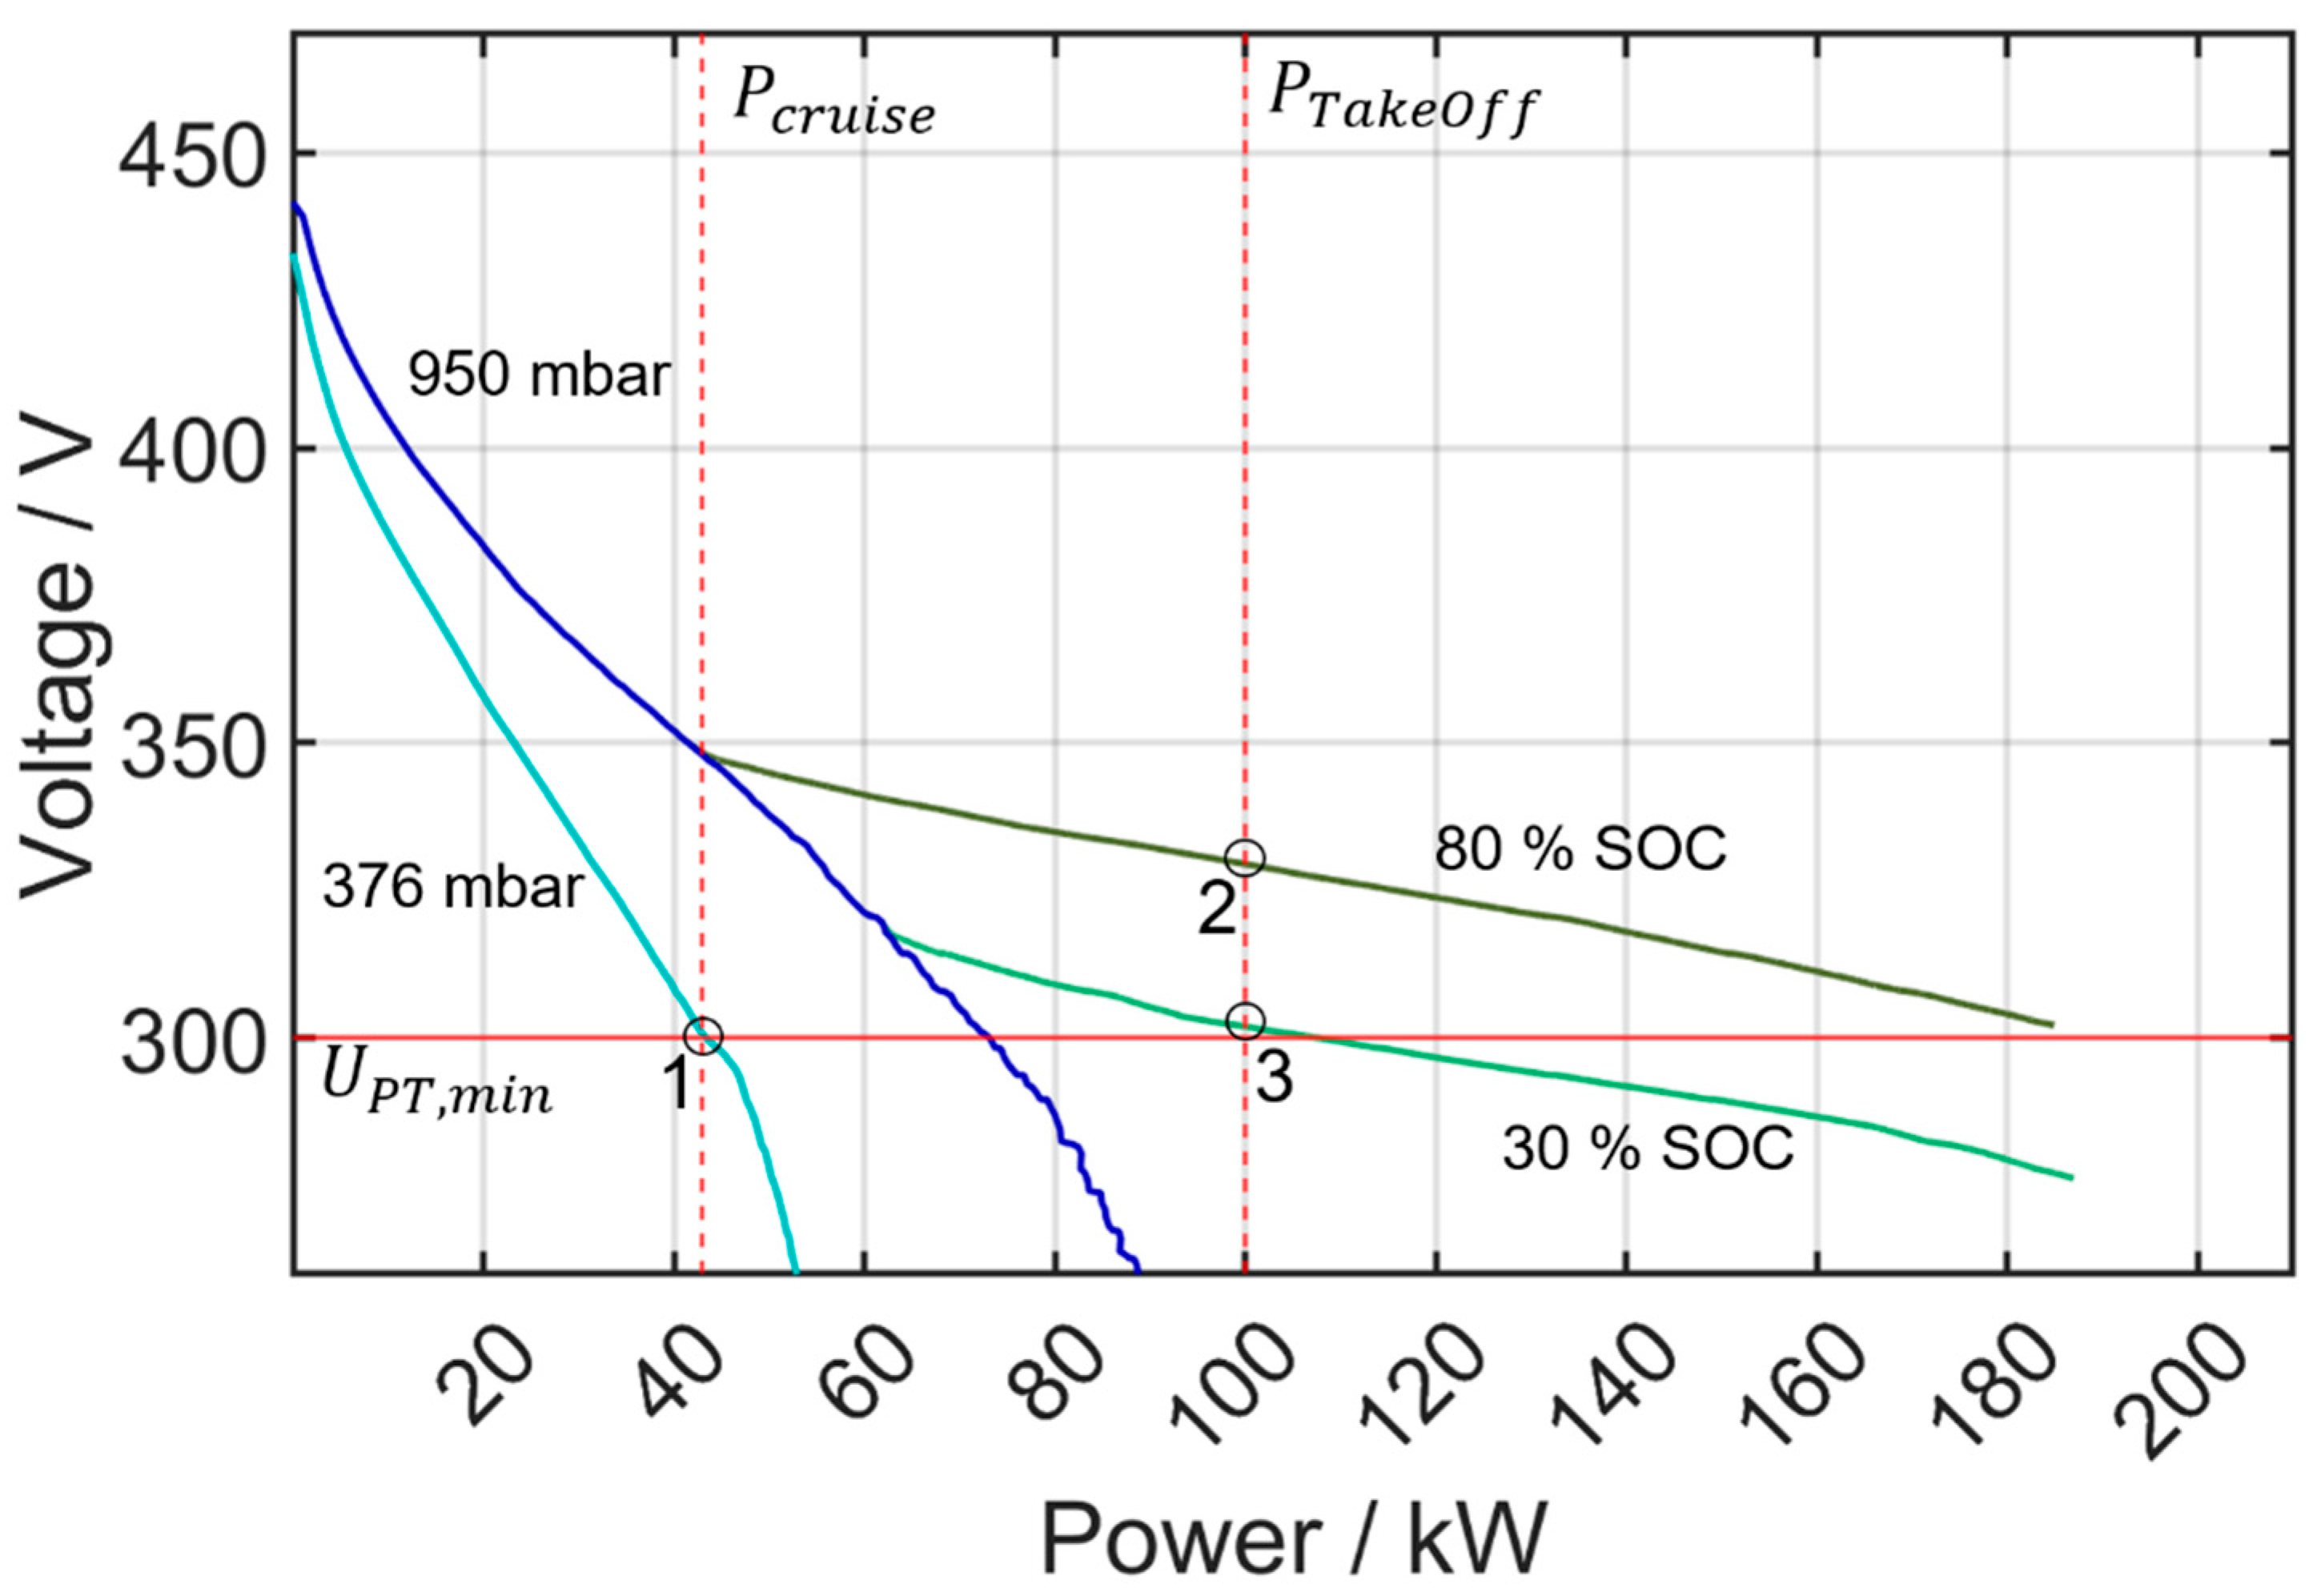
When the fuel cell was designed as described in the corresponding section above, the ideal parallel scaling of the fuel cell was found to be 2.42. A scaling like this requires a new fuel cell design, for example, with a different active area or different cell power density. Changing the cell area of a fuel cell stack makes a new stack design necessary. For the following considerations it is assumed that a redesign of the cell area and therefore a parallel scaling of the fuel cell of 2.42 is possible. This corresponds to a reduction in the cell area of 19% and the power–voltage characteristics were adapted accordingly. The resulting hybrid curves for a system with the scaled and optimized fuel cell configuration are shown in Figure 10. Here, the fuel cell curves at 950 mbar and 376 mbar are plotted (blue), as well as the hybrid curves at 950 mbar, 80% and 30% (green). The operation points for cruise and take-off power as well as the minimum allowed system voltage are marked as well.
The resulting hybrid configuration results in 2.4 fuel cell stacks (redesign of the stack required) in parallel with 500 serial fuel cells each. The battery was kept at 96 serial cells. This configuration will be referred to as hybrid 3 in the following chapters.
As discussed before, the fuel cell should supply the whole power required for cruise (43 kW) under cruise conditions above the minimum voltage of the powertrain (300 V). The fuel cell was sized according to this operation point; therefore, the fuel cell voltage now matches the minimum voltage of the powertrain at 43 kW (point 1).
Figure 10 also shows the characteristic curves of the designed hybrid, when the fuel cell is hybridized with 96 battery cells as calculated in Section 5. The system is capable of delivering the required power of 100 kW for take-off. The operation points for a SOC of 30% and 80% at 100 kW are marked in the figure (point 2 and 3). Both points are above the minimum voltage of 300 V and thereby exceed the required power. As a consequence, the size of the battery can be reduced, similar to the previously examined case with the bigger fuel cell.
However, due to the reduced fuel cell, the battery cannot be reduced by the same number as before. A reduction of 11 cells would lead to a voltage beneath the minimum voltage at 100 kW. To meet the voltage requirements at 100 kW and 30% SOC, the battery is reduced by a number of 8 cells to 88 cells in this case. The obtained hybrid configuration from this optimization step consists of 2.4 fuel cell stacks (redesign of the stacks required) with 500 serial cells each and a battery with 88 serial cells. This configuration will be referred to as hybrid 4 in the following chapters. The corresponding hybrid behavior can be seen in Figure 11. The fuel cell curves and the operation point at 43 kW are the same as in Figure 10 (blue curves and point 1). The reduction in the battery size leads again to a reduced hybrid point voltage, which leads to an increase in provided fuel cell power before the battery contributes. As before, the hybrid voltage at 30% SOC and 100 kW is equal to the minimum voltage of the powertrain (operation point 3). At 80% SOC, the voltage is higher at 329 V (point 2).
These considerations show that the reduction in the fuel cell size leads to an increased battery. Compared to the original fuel cell size, the battery size for the optimized fuel cell system increases by a number of three cells after optimizing the battery.
In chapter 6 the designed hybrid of chapter 5 was analyzed and optimized. At first, the battery size was optimized by reducing the serial amount of battery cells by 11. In a second step the fuel cell size was optimized by reducing the parallel amount of fuel cells from 3 to 2.42. For this fuel cell size, the battery size was optimized by starting with the original battery size of chapter 5 with 96 cells. After the optimization of the battery size for the optimized fuel cell, a battery size of 88 cells was found to be best.
7. Mission Profile Analysis
In order to analyze the performance and contribution of the fuel cell and the battery during different phases of the flight for the different direct-hybrid systems defined in chapters 5 and 6, a flight mission was calculated with the scaled power profile from Figure 5 and a shortened cruise time of 300 s. The flight mission calculation was implemented in Matlab. For each second of the mission profile the corresponding hybrid curve and the operation point was calculated. The power usage was integrated over time to obtain the energy used. For each hybrid configuration discussed in Section 5 and Section 6, an energy calculation over the complete mission profile was performed. The hybrid configurations are again summarized in Table 1, where the respective fuel cell and battery configurations are shown.
Hybrid 1 was designed considering the minimum voltage of the fuel cell at cruise conditions and assuming that a parallel scaling of the fuel cell can only be completed in whole numbers as described in chapter 5. The battery configuration was determined by setting the minimum battery voltage at its highest discharge rate to the minimum voltage of the powertrain.
For hybrid 2, the battery size was optimized to exactly match the minimum voltage of the powertrain of 300 V at 100 kW with a 30% SOC by reducing the number of serial cells by 11 in comparison to hybrid 2.
For hybrid 3, the fuel cell size was reduced by assuming that a parallel scaling of the stack by 2.4 is possible. This corresponds to a new stack development with a different active area of the cells.
In hybrid 4, the battery size was also adjusted to match the smaller fuel cell size, by reducing the number of cells by eight (hybrid 3).
Figure 12 shows the results of the flight calculations as a stacked area plot. To refer to the different hybrid configurations in the plot, the numbering from Table 1 is used. For each calculation, the SOC of the battery was set to 80% at the beginning. The graph is vertically divided into four sections representing the different flight phases. After climb, the battery is disconnected and all power is supplied by the fuel cell for cruise and descent. The blue areas in Figure 12 visualize the fuel cell power of each hybrid configuration. The red area is always provided by the battery. The graph shows that during take-off, the battery power is highest compared to the lower power levels during climb. When the power demand is reduced, the battery share decreases. During cruise the propulsive power is provided by the fuel cell in all cases, since the battery is disconnected. During take-off and climb, however, hybrid configuration 2 has the highest share of fuel cell power, while in hybrid configurations 1, 3 and 4, less power is provided from the fuel cell during take-off and climb than during cruise. It can also be seen that during take-off, the fuel cell power increases slightly. This is due to the fact that the battery is discharged and its voltage decreases accordingly. This effect can be observed for all hybrid configurations but is strongest for hybrid 3 (power increase from the fuel cell of 1.7 kW). For hybrid 2, the increase of fuel cell power during take-off is only 0.9 kW. At the beginning of the climb phase, there is a period of constant power at 80 kW. During this period, the proportion of battery power increases while the fuel cell contribution for all hybrids considered in this study decreases. During the climb phase, the aircraft gains altitude (see Figure 5) which results in a decrease in ambient pressure. This in turn decreases the fuel cell power as shown in Figure 3. The power supplied by the fuel cell at higher altitudes decreases for the same system voltage, and a greater proportion of the power needs to be supplied by the battery.
Hybrid configurations 1 and 2 both operate with three parallel fuel cell stacks. When the battery size is reduced from 96 (hybrid 1) to 85 (hybrid 2) cells, a strong increase in the fuel cell contribution can be seen. An increased fuel cell share results in a lower amount of energy being drawn from the battery and therefore less energy needs to be stored in the battery. Over the entire calculated mission, 22.9 kWh of energy is consumed. For hybrid 1 (that uses a 96-cell battery and three parallel fuel cell cells), the battery will in total provide 8.1 kWh of energy during take-off and climb. For hybrid 2 with the reduced battery size of 85 cells, the energy provided by the battery during take-off and climb is only 3.5 kWh. This is a 57% reduction in energy provided by the battery. The energy used from the battery and the SOC after take-off and climb for all four hybrids are given in Table 1. For all calculations, the battery SOC at the start of the calculation is 80%. For hybrid 1 (with 96 battery cells), the SOC drops to 52.7% at the end of the climb phase. For hybrid 2 with the reduced battery of 85 cells, the SOC after the climb is 67.2%. Despite the smaller battery, the SOC at the end of the climb phase for this configuration is higher than for hybrid 1.
Hybrid 3 and 4 both have an exemplarily designed and reduced fuel cell, which is not commercially available. The number of serial cells remained the same, but the connection in parallel was scaled down to correspond to 2.42 parallel cells. The power distribution was calculated for hybrid 3 with a battery size of 96 cells and for hybrid 4 with 88 battery cells. The results are also shown in Figure 12 (hybrid 3 and 4). Again, the power contribution of the fuel cell increases as the number of battery cells decreases and due to the higher contribution from the fuel cell, the energy provided by the battery decreases. For hybrid 3 with 96 battery cells, 9.6 kWh is drawn from the battery. For hybrid 4 with only 88 cells, 6.6 kWh are provided by the battery. This corresponds to a reduction of 31%. For hybrid 3 with 96 cells, the SOC drops to 47.2% after take-off and climb which is the lowest of all four systems. For hybrid 4 with 88 battery cells, the SOC after climb is at 55.7%. Here again, it is interesting to note that a reduction in battery size results in a higher SOC after take-off and climb due to the higher contribution from the fuel cell.
The hybrid configurations 1 and 3 differ in their fuel cell sizes but have the same battery size (96 cells). It can be seen from Figure 12 that a smaller fuel cell leads to a higher contribution from the battery during take-off and climb. The energy required from the battery during take-off and climb is 1.5 kWh higher for hybrid 3 with the reduced fuel cell size than for hybrid 1. The parallel scaling of hybrid 3 is smaller, resulting in a steeper polarization curve. The steeper fuel cell curve leads to less current being provided by the fuel cell at a certain voltage, which in turn results in an increased battery share in a direct-hybrid system.
When comparing hybrid configuration 2 and 4, which have differently sized fuel cells and a minimized battery each, the same effect on the power share of the fuel cell is seen. The fuel cell power contribution of hybrid 4 with the smaller fuel cell system (2.42 parallel cells) is lower compared to hybrid 2 with the larger fuel cell (3 parallel cells). This results in an increased usage of the battery. For take-off and climb, 3.1 kWh more energy is required from the battery for hybrid configuration 4 compared to hybrid 2.
The results demonstrate the need for optimizing the battery system and the potential for weight reduction while optimizing performance. Minimizing the size of the battery will reduce the weight of the system and can therefore increase the range or payload of a direct fuel cell hybrid aircraft. However, a smaller battery will require a larger fuel cell and an optimum, with respect to performance and weight, needs to be found. Aiming for a large fuel cell alone will not necessarily result in a light-weight system. To examine how the optimization of the fuel cell and the battery sizes can lead to a light-weight system, the weight for each system was assessed. The battery used for the considerations above is a high energy cell and one cell weighs 1.53 kg. For the fuel cell, a power-to-weight ratio of 3 kW/kg is assumed, which corresponds to an intermediate value of the range given by Tashie-Lewis et al. [37] for state-of-the-art systems. To calculate the fuel cell weight, the rated power of the fuel cell is used and divided by the specific power of 3 kW/kg.
In Table 1, the resulting calculated weights of the fuel cell, the battery and the total weight for each hybrid configuration are shown. By reducing the number of battery cells from 96 cells to 85/88 cells, the weight of the battery cells is reduced by 16.8 kg/12.2 kg. Reducing the parallel scaling of the fuel cell from 3 to 2.42 parallel cells leads to a weight reduction of 9.7 kg. It can be seen from Table 1 that hybrid 4 is the lightest configuration, despite the fact that hybrid 4 has a larger battery and smaller fuel cell compared to hybrid 2. Table 1 also shows the total calculated hydrogen consumption over the examined mission duration for each configuration. The hydrogen consumption was calculated from the fuel cell current, assuming an anode stoichiometry of one. The smallest amount of hydrogen is consumed in hybrid 3, which required 0.74 kg for the calculated mission. The highest amount of hydrogen, which is 1.12 kg, is consumed with hybrid 2. This is a difference of 0.38 kg compared to hybrid 3. However, the data from Table 1 shows that the correct sizing of fuel cell and battery has a much higher weight saving potential compared to the saving in hydrogen weight. Minimizing the weight of the propulsion system in an electric aircraft is important, since weight has a quadratic impact on the required power to maintain steady level flight and a heavier propulsion system reduces the payload [38]. The detailed sizing and analysis of the fuel cell and battery is therefore important for optimizing the performance in an all-electric aircraft.
This chapter showed how the designed hybrids (1–4) behave during a realistic mission with regard to the power and energy consumption out of the fuel cell and the battery. It was found that the different configuration showed a different share of fuel cell and battery contribution during take-off and climb. For all four systems the fuel cell share increased as the battery discharged; however, this effect is stronger when the overall battery contribution is greater. It was also observed for all configurations that the fuel cell power share decreased as the aircraft climbed due to lower ambient pressures. When comparing the different configurations, it was found that a smaller battery led to a higher SOC after climb, since more energy was provided from the fuel cell. Therefore, the smaller batteries maintained a higher SOC after climb. The weight analysis of the different configurations showed that the smallest battery does not automatically lead to the lightest system. Oversizing the fuel cell in order to reduce the size of the battery does therefore not lead to a lighter system. Assessing the weight of the consumed hydrogen for the different configurations showed that any savings on hydrogen were small in comparison to the weight saving potential due to an optimal sizing of the fuel cell and battery. The obtained configurations and results are valid for the examined flight profile. A different ratio between the maximum power demand at take-off and during cruise will result in different fuel cell and battery sizes.
8. Conclusions
In a fuel-cell-based direct-hybrid system, a fuel cell and a battery are connected in parallel without a DC/DC converter. The voltage levels in the system are therefore directly determined by the choice and design of the fuel cell and battery. The presented work introduces a new method to determine and optimize the size of the fuel cell and battery in a direct-hybrid for aviation, considering the varying behavior of the battery and the fuel cell due to battery SOC and pressure dependency of the fuel cell. The method was used for designing several possible hybrid configurations, which were then compared with respect to weight and energy consumption from the battery and fuel cell.
A direct-hybrid system, based on the operational data of a PEM fuel cell (type HD10, Cummins Inc., Columbus, IN, USA) and a lithium-ion battery (type SLPB120255255, 75 Ah pouch, Kokam Co., Ltd., Suwon, Republic of Korea), was designed and optimized to fit the power demand of a realistic flight mission power profile. The power profile was based on the shaft power of a 40-seater aircraft of the Do328 class, which was scaled down to 100 kW.
The direct-hybrid system was designed so that both the fuel cell and the battery provide power during high power phases like take-off and climb. During the lower power phases like cruise and descent, the battery is disconnected and the fuel cell alone supplies power in order to make the best use of the high specific energy of hydrogen and to enable a long flight range. For a non-pressurized fuel cell system, the pressure dependent performance at high altitudes must be considered. As there is no DC/DC converter in this hybridization concept, the voltages of the fuel cell and the battery must match, and voltage boundaries of other components in the powertrain like the inverter motor system must not be exceeded.
A method on how this is achieved was presented and used to determine the required fuel cell size for the exemplary system. Based on the voltage limits of the powertrain and the characteristic fuel cell curves at low pressures, it was found that 500 fuel cells in series are required. In order to meet the cruising power demand of 43 kW at a cruising altitude of 25,000 ft, a parallel scaling of the 500-cell fuel cell stack of at least 2.4 is required. A parallel scaling of 2.4 is only possible with a stack redesign. Therefore, two fuel cell configurations were chosen for further analysis: One with three 500-cell stacks in parallel and one with a 2.4 scaling.
For determining the battery size, the dependency of battery voltage on SOC and discharge rate was considered. A maximum and minimum SOC of 80% and 30%, respectively, were considered and by setting the minimum voltage of the battery at its highest discharge rate to the minimum voltage of the powertrain, a required battery size of 96 serial cell was calculated. It was found, however, that in the hybrid system this method led to an oversized system. By adapting the battery size to the minimum voltage of the hybrid powertrain at take-off power instead, the battery size could be reduced to 85 battery cells for 3 parallel fuel cell stacks and to 88 for 2.4 parallel fuel cell stacks. The reduction in the size of the fuel cell therefore led to an increase in the minimal size of the battery.
To analyze the performance of the different hybrid configurations during take-off and climb, flight calculations were then performed. By analyzing the energy and power contributions from the fuel cell and battery, it was shown that for a system with three parallel fuel cells reducing the battery from 96 to 85 cells reduced the energy provided by the battery by 57%, resulting in a higher SOC after climb for the smaller battery (67% instead of 53%). This shows that by reducing the battery size while maintaining the fuel cell size, the battery energy usage is reduced and the SOC after climb can be increased because the fuel cell’s contribution increases. Similarly, a scaled down fuel cell and constant battery size increased the battery usage during take-off and climb leading to a lower SOC after climb. For the scaled fuel cell system (corresponding to 2.42 parallel fuel cells) the battery share increased compared to three parallel fuel cell cells by 19% when combined with 96 battery cells.
The reduction in weight is important for aircraft performance and flight range. By optimizing battery and fuel cell sizes, the weight of those two components can be minimized while still meeting power requirements and voltage limits. The weights for the different hybrid configurations were assessed and the hybrid configuration with 2.42 parallel fuel cell cells and 88 battery cells was found to be the lightest of all the systems, even though it was not the configuration with the smallest battery. It is the system where first the fuel cell and then the battery were optimized to be as small as possible, while staying within the voltage limits.
The results show a method how the fuel cell and battery in a direct-hybrid can be designed for a specific application and power profile, considering the altitude and its influence on fuel cell performance, the dependency of the battery performance on SOC and current, as well as the current and voltage limitation of the powertrain. It also shows how the fuel cell and battery size can be optimized in order to reduce the weight of the system while meeting the performance requirements. In future, the influence of varying operating temperatures as well as the dynamic behavior of the system and the consequence that might have on the sizing of the components should be examined as well.
Author Contributions
Conceptualization: T.G., R.F. and C.W.; Methodology: T.G., R.F. and C.W.; Investigation: T.G.; Resources: C.B., C.W. and J.K.; Supervision: C.W. and C.B.; Writing—Original Draft Preparation, T.G. and C.W.; Writing—Review and Editing: C.W., C.B., R.F. and J.K.; Project Administration: C.B.; Funding Acquisition: C.W., C.B. and J.K. All authors have read and agreed to the published version of the manuscript.
Funding
This research was funded by the German Federal Ministry for Digital and Transport as part of the project Go4Hy2 (03B10703A).
Institutional Review Board Statement
Not applicable.
Informed Consent Statement
Not applicable.
Data Availability Statement
The data presented in this study are available on request from the corresponding author.
Acknowledgments
The authors want to thank Florian Troeltsch and Carsten Riediger from Deutsche Aircraft GmbH for their collaboration and providing mission data.
Conflicts of Interest
The authors declare no conflicts of interest.
Abbreviations
| Battery cell number in series | |
| Number of fuel cell cells | |
| Number of serial fuel cell cells | |
| Number of parallel fuel cell cells | |
| Cruise power | |
| Take-off power | |
| Fuel cell cruise power | |
| Minimum battery voltage at minimum take-off SOC | |
| Maximum powertrain voltage | |
| Minimum powertrain voltage | |
| Fuel cell cruise voltage | |
| FC | Fuel cell |
| OCV | Open circuit voltage |
| PEM | Proton-exchange membrane fuel cell |
| SOC | State of charge |
| Bat | Battery |
| HD10 | Fuel cell stack, type HD10, Cummins Inc., USA |
| eVTOL | electric Vertical Take-Off and Landing aircraft |
References
- Anger, A.; Köhler, J. Including Aviation Emissions in the EU ETS: Much ado about Nothing? A Review. Transp. Policy 2010, 17, 38–46. [Google Scholar] [CrossRef]
- Olsthoorn, X. Carbon Dioxide Emissions from International Aviation: 1950–2050. J. Air Transp. Manag. 2001, 7, 87–93. [Google Scholar] [CrossRef]
- Terrenoire, E.; Hauglustaine, D.A.; Gasser, T.; Penanhoat, O. The Contribution of Carbon Dioxide Emissions from the Aviation Sector to Future Climate Change. Environ. Res. Lett. 2019, 14, 084019. [Google Scholar] [CrossRef]
- Schefer, H.; Fauth, L.; Kopp, T.H.; Mallwitz, R.; Friebe, J.; Kurrat, M. Discussion on Electric Power Supply Systems for All Electric Aircraft. IEEE Access 2020, 8, 84188–84216. [Google Scholar] [CrossRef]
- Hoenicke, P.; Ghosh, D.; Muhandes, A.; Bhattacharya, S.; Bauer, C.; Kallo, J.; Willich, C. Power Management Control and Delivery Module for a Hybrid Electric Aircraft using Fuel Cell and Battery. Energy Convers. Manag. 2021, 244, 114445. [Google Scholar] [CrossRef]
- Gao, Y.; Jausseme, C.; Huang, Z.; Yang, T. Hydrogen-Powered Aircraft: Hydrogen–Electric Hybrid Propulsion for Aviation. IEEE Electrif. Mag. 2022, 10, 17–26. [Google Scholar] [CrossRef]
- Su-Ungkavatin, P.; Tiruta-Barna, L.; Hamelin, L. Biofuels, Electrofuels, Electric or Hydrogen?: A Review of Current and Emerging Sustainable Aviation Systems. Prog. Energy Combust. Sci. 2023, 96, 101073. [Google Scholar] [CrossRef]
- Ansell, P.J. Hydrogen-Electric Aircraft Technologies and Integration: Enabling an Environmentally Sustainable Aviation Future. IEEE Electrif. Mag. 2022, 10, 6–16. [Google Scholar] [CrossRef]
- Huete, J.; Nalianda, D.; Zaghari, B.; Pilidis, P. A Strategy to Decarbonize Civil Aviation: A Phased Innovation Approach to Hydrogen Technologies. IEEE Electrif. Mag. 2022, 10, 27–33. [Google Scholar] [CrossRef]
- Kollmuss, A.; Crimmins, A.M. Carbon Offsetting & Air Travel Part 2: Non-CO2 Emissions Calculations; SEI Discussion Paper; Stockholm Environment Institute: Stockholm, Sweden, 2010. [Google Scholar] [CrossRef]
- Nishizawa, A.; Kallo, J.; Garrot, O.; Weiss-Ungethüm, J. Fuel Cell and Li-Ion Battery Direct Hybridization System for Aircraft Applications. J. Power Sources 2013, 222, 294–300. [Google Scholar] [CrossRef]
- Lubitz, W.; Tumas, W. Hydrogen: An Overview. Chem. Rev. 2007, 107, 3900–3903. [Google Scholar] [CrossRef] [PubMed]
- Diouf, B.; Pode, R. Potential of Lithium-Ion Batteries in Renewable Energy. Renew. Energy 2015, 76, 375–380. [Google Scholar] [CrossRef]
- Brinner, A.; Philipps, F. Hydrogen as the Fuel of the Future—Production; Purification; Storage. In Proceedings of the Motor & Umwelt, Graz, Austria, 6–7 September 2001. [Google Scholar]
- Møller, K.T.; Jensen, T.R.; Akiba, E.; Li, H.-W. Hydrogen—A sustainable energy carrier. Prog. Nat. Sci. Mater. Int. 2017, 27, 34–40. [Google Scholar] [CrossRef]
- Massaro, M.C.; Biga, R.; Kolisnichenko, A.; Marocco, P.; Monteverde, A.H.A.; Santarelli, M. Potential and technical challenges of on-board hydrogen storage technologies coupled with fuel cell systems for aircraft electrification. J. Power Sources 2023, 555, 232397. [Google Scholar] [CrossRef]
- Burschyk, T.; Cabac, Y.; Silberhorn, D.; Boden, B.; Nagel, B. Liquid hydrogen storage design trades for a short-range aircraft concept. CEAS Aeronaut. J. 2023, 14, 879–893. [Google Scholar] [CrossRef]
- Bhattacharya, S.; Anagnostou, D.; Schwane, P.; Bauer, C.; Kallo, J.; Willich, C. A Flexible DC–DC Converter with Multi-Directional Power Flow Capabilities for Power Management and Delivery Module in a Hybrid Electric Aircraft. Energies 2022, 15, 5495. [Google Scholar] [CrossRef]
- Ceschia, A.; Azib, T.; Bethoux, O.; Alves, F. Optimal design methodology for sizing a fuel cell/battery hybrid power source. Proc. Inst. Mech. Eng. Part A J. Power Energy 2021, 235, 3–16. [Google Scholar] [CrossRef]
- Bassam, A.M.; Phillips, A.B.; Turnock, S.R.; Wilson, P.A. Sizing optimization of a fuel cell/battery hybrid system for a domestic ferry using a whole ship system simulator. In Proceedings of the 2016 International Conference on Electrical Systems for Aircraft, Railway, Ship Propulsion and Road Vehicles & International Transportation Electrification Conference (ESARS-ITEC), Toulouse, France, 2–4 November 2016; IEEE: Piscataway, NJ, USA, 2016; pp. 1–6, ISBN 978-1-5090-0814-8. [Google Scholar]
- Park, J.; Lee, D.; Lim, D.; Yee, K. A refined sizing method of fuel cell-battery hybrid system for eVTOL aircraft. Appl. Energy 2022, 328, 120160. [Google Scholar] [CrossRef]
- Park, J.; Lee, D.; Yee, K. Development of Fuel Cell/Battery Hybrid System Sizing Methodology for eVTOL Aircraft. In AIAA AVIATION 2022 Forum, Proceedings of the AIAA AVIATION 2022 Forum, Chicago, IL, USA, Virtual, 27 June–1 July 2022; American Institute of Aeronautics and Astronautics: Reston, VA, USA, 2022; ISBN 978-1-62410-635-4. [Google Scholar]
- Bataller-Planes, E.; Lapena-Rey, N.; Mosquera, J.; OrtÍ, F.; Oliver, J.Á.; GarcÍa, Ó.; Moreno, F.; Portilla, J.; Torroja, Y.; Vasic, M.; et al. Power Balance of a Hybrid Power Source in a Power Plant for a Small Propulsion Aircraft. IEEE Trans. Power Electron. 2009, 24, 2856–2866. [Google Scholar] [CrossRef]
- Li, B.; Riaz, S.; Zhao, Y. Experimental Validation of Iterative Learning Control for DC/DC Power Converters. Energies 2023, 16, 6555. [Google Scholar] [CrossRef]
- Wang, S.; Zhou, C.; Riaz, S.; Guo, X.; Zaman, H.; Mohammad, A.; Al-Ahmadi, A.A.; Alharbi, Y.M.; Ullah, N. Adaptive fuzzy-based stability control and series impedance correction for the grid-tied inverter. Math. Biosci. Eng. 2023, 20, 1599–1616. [Google Scholar] [CrossRef] [PubMed]
- Chen, H.; Kim, H.; Erickson, R.; Maksimovic, D. Electrified Automotive Powertrain Architecture Using Composite DC–DC Converters. IEEE Trans. Power Electron. 2017, 32, 98–116. [Google Scholar] [CrossRef]
- Rheaume, J.M.; MacDonald, M.; Lents, C.E. Commercial Hybrid Electric Aircraft Thermal Management System Design, Simulation, and Operation Improvements. In Proceedings of the 2019 AIAA/IEEE Electric Aircraft Technologies, Indianapolis, IN, USA, 19–22 August 2019. AIAA Conference Paper Number: 2019-4492. [Google Scholar]
- Graf, T.; Fonk, R.; Paessler, S.; Bauer, C.; Kallo, J.; Willich, C. Low Pressure Influence on a Direct Fuel Cell Battery Hybrid System for Aviation. Int. J. Hydrog. Energy, 2023; in press. [Google Scholar] [CrossRef]
- Graf, T.; Fonk, R.; Schröter, J.; Hoenicke, P.; Bauer, C.; Kallo, J.; Willich, C. Investigation of a Fuel Cell Hybrid System with a New Modular Test Bench Approach for an All Electric Hybrid Power Train Systems. J. Energy Storage 2022, 56, 105999. [Google Scholar] [CrossRef]
- Young, T.M. (Ed.) International Standard Atmosphere (ISA) Table. In Performance of the Jet Transport Airplane: Analysis Methods, Flight Operations and Regulations; Wiley: Hoboken, NJ, USA, 2017; pp. 583–590. [Google Scholar]
- Wang, L.; Husar, A.; Zhou, T.; Liu, H. A Parametric Study of PEM Fuel Cell Performances. Int. J. Hydrogen Energy 2003, 28, 1263–1272. [Google Scholar] [CrossRef]
- Werner, C.; Busemeyer, L.; Kallo, J. The Impact of Operating Parameters and System Architecture on the Water Management of a Multifunctional PEMFC System. Int. J. Hydrogen Energy 2015, 40, 11595–11603. [Google Scholar] [CrossRef]
- Qin, Y.; Du, Q.; Fan, M.; Chang, Y.; Yin, Y. Study on the Operating Pressure Effect on the Performance of a Proton Exchange Membrane Fuel Cell Power System. Energy Convers. Manag. 2017, 142, 357–365. [Google Scholar] [CrossRef]
- Hoenicke, P.; Khatri, R.; Bauer, C.; Osama, M.; Kallo, J.; Willich, C. Influence of Low Pressures on the Performance of Lithium Ion Batteries for Airplane Applications. J. Electrochem. Soc. 2023, 170, 60541. [Google Scholar] [CrossRef]
- Jarry, T.; Lacressonnière, F.; Jaafar, A.; Turpin, C.; Scohy, M. Modeling and Sizing of a Fuel Cell—Lithium-Ion Battery Direct Hybridization System for Aeronautical Application. Energies 2021, 14, 7655. [Google Scholar] [CrossRef]
- Graf, T.; Fonk, R.; Bauer, C.; Willich, C. Dimensioning of a Direct Fuel Cell Battery Hybrid System for an All-Electric Aircraft. In Proceedings of the AIAA AVIATION 2023 Forum, San Diego, CA, USA, 12–16 June 2023. [Google Scholar] [CrossRef]
- Tashie-Lewis, B.C.; Nnabuife, S.G. Hydrogen Production, Distribution, Storage and Power Conversion in a Hydrogen Economy—A Technology Review. Chem. Eng. J. Adv. 2021, 8, 100172. [Google Scholar] [CrossRef]
- Spakovszky, Z. Unified: Thermodynamics and Propulsion. Available online: https://web.mit.edu/16.unified/www/FALL/thermodynamics/notes/ (accessed on 22 November 2023).
Figure 1.
Schematic direct-hybrid connection of a fuel cell and a battery to a powertrain.
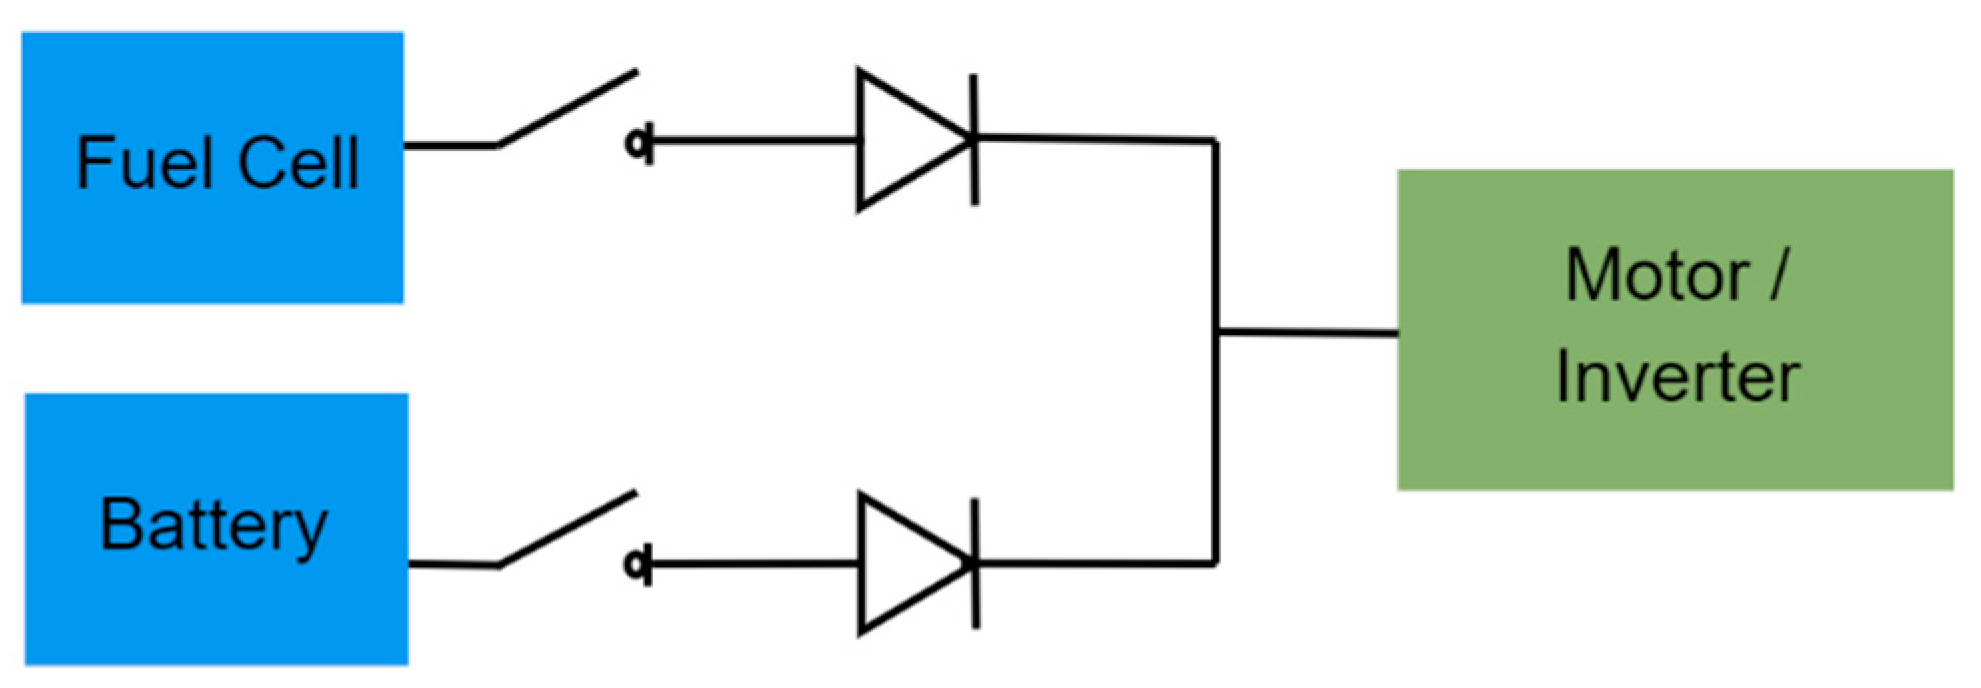
Figure 2.
Schematic of a direct-hybrid voltage characteristic curve consisting of a fuel cell and a battery (green) and the corresponding fuel cell polarization curve (blue) over power. Battery OCV is shown as dotted line and the hybrid point is marked with a circle.
Figure 2.
Schematic of a direct-hybrid voltage characteristic curve consisting of a fuel cell and a battery (green) and the corresponding fuel cell polarization curve (blue) over power. Battery OCV is shown as dotted line and the hybrid point is marked with a circle.

Figure 3.
Voltage over power of a single PEM fuel cell (based on HD10, Cummins Inc., Columbus, IN, USA) at different ambient pressure levels. Minimum allowed cell voltage is marked in red [36].
Figure 3.
Voltage over power of a single PEM fuel cell (based on HD10, Cummins Inc., Columbus, IN, USA) at different ambient pressure levels. Minimum allowed cell voltage is marked in red [36].
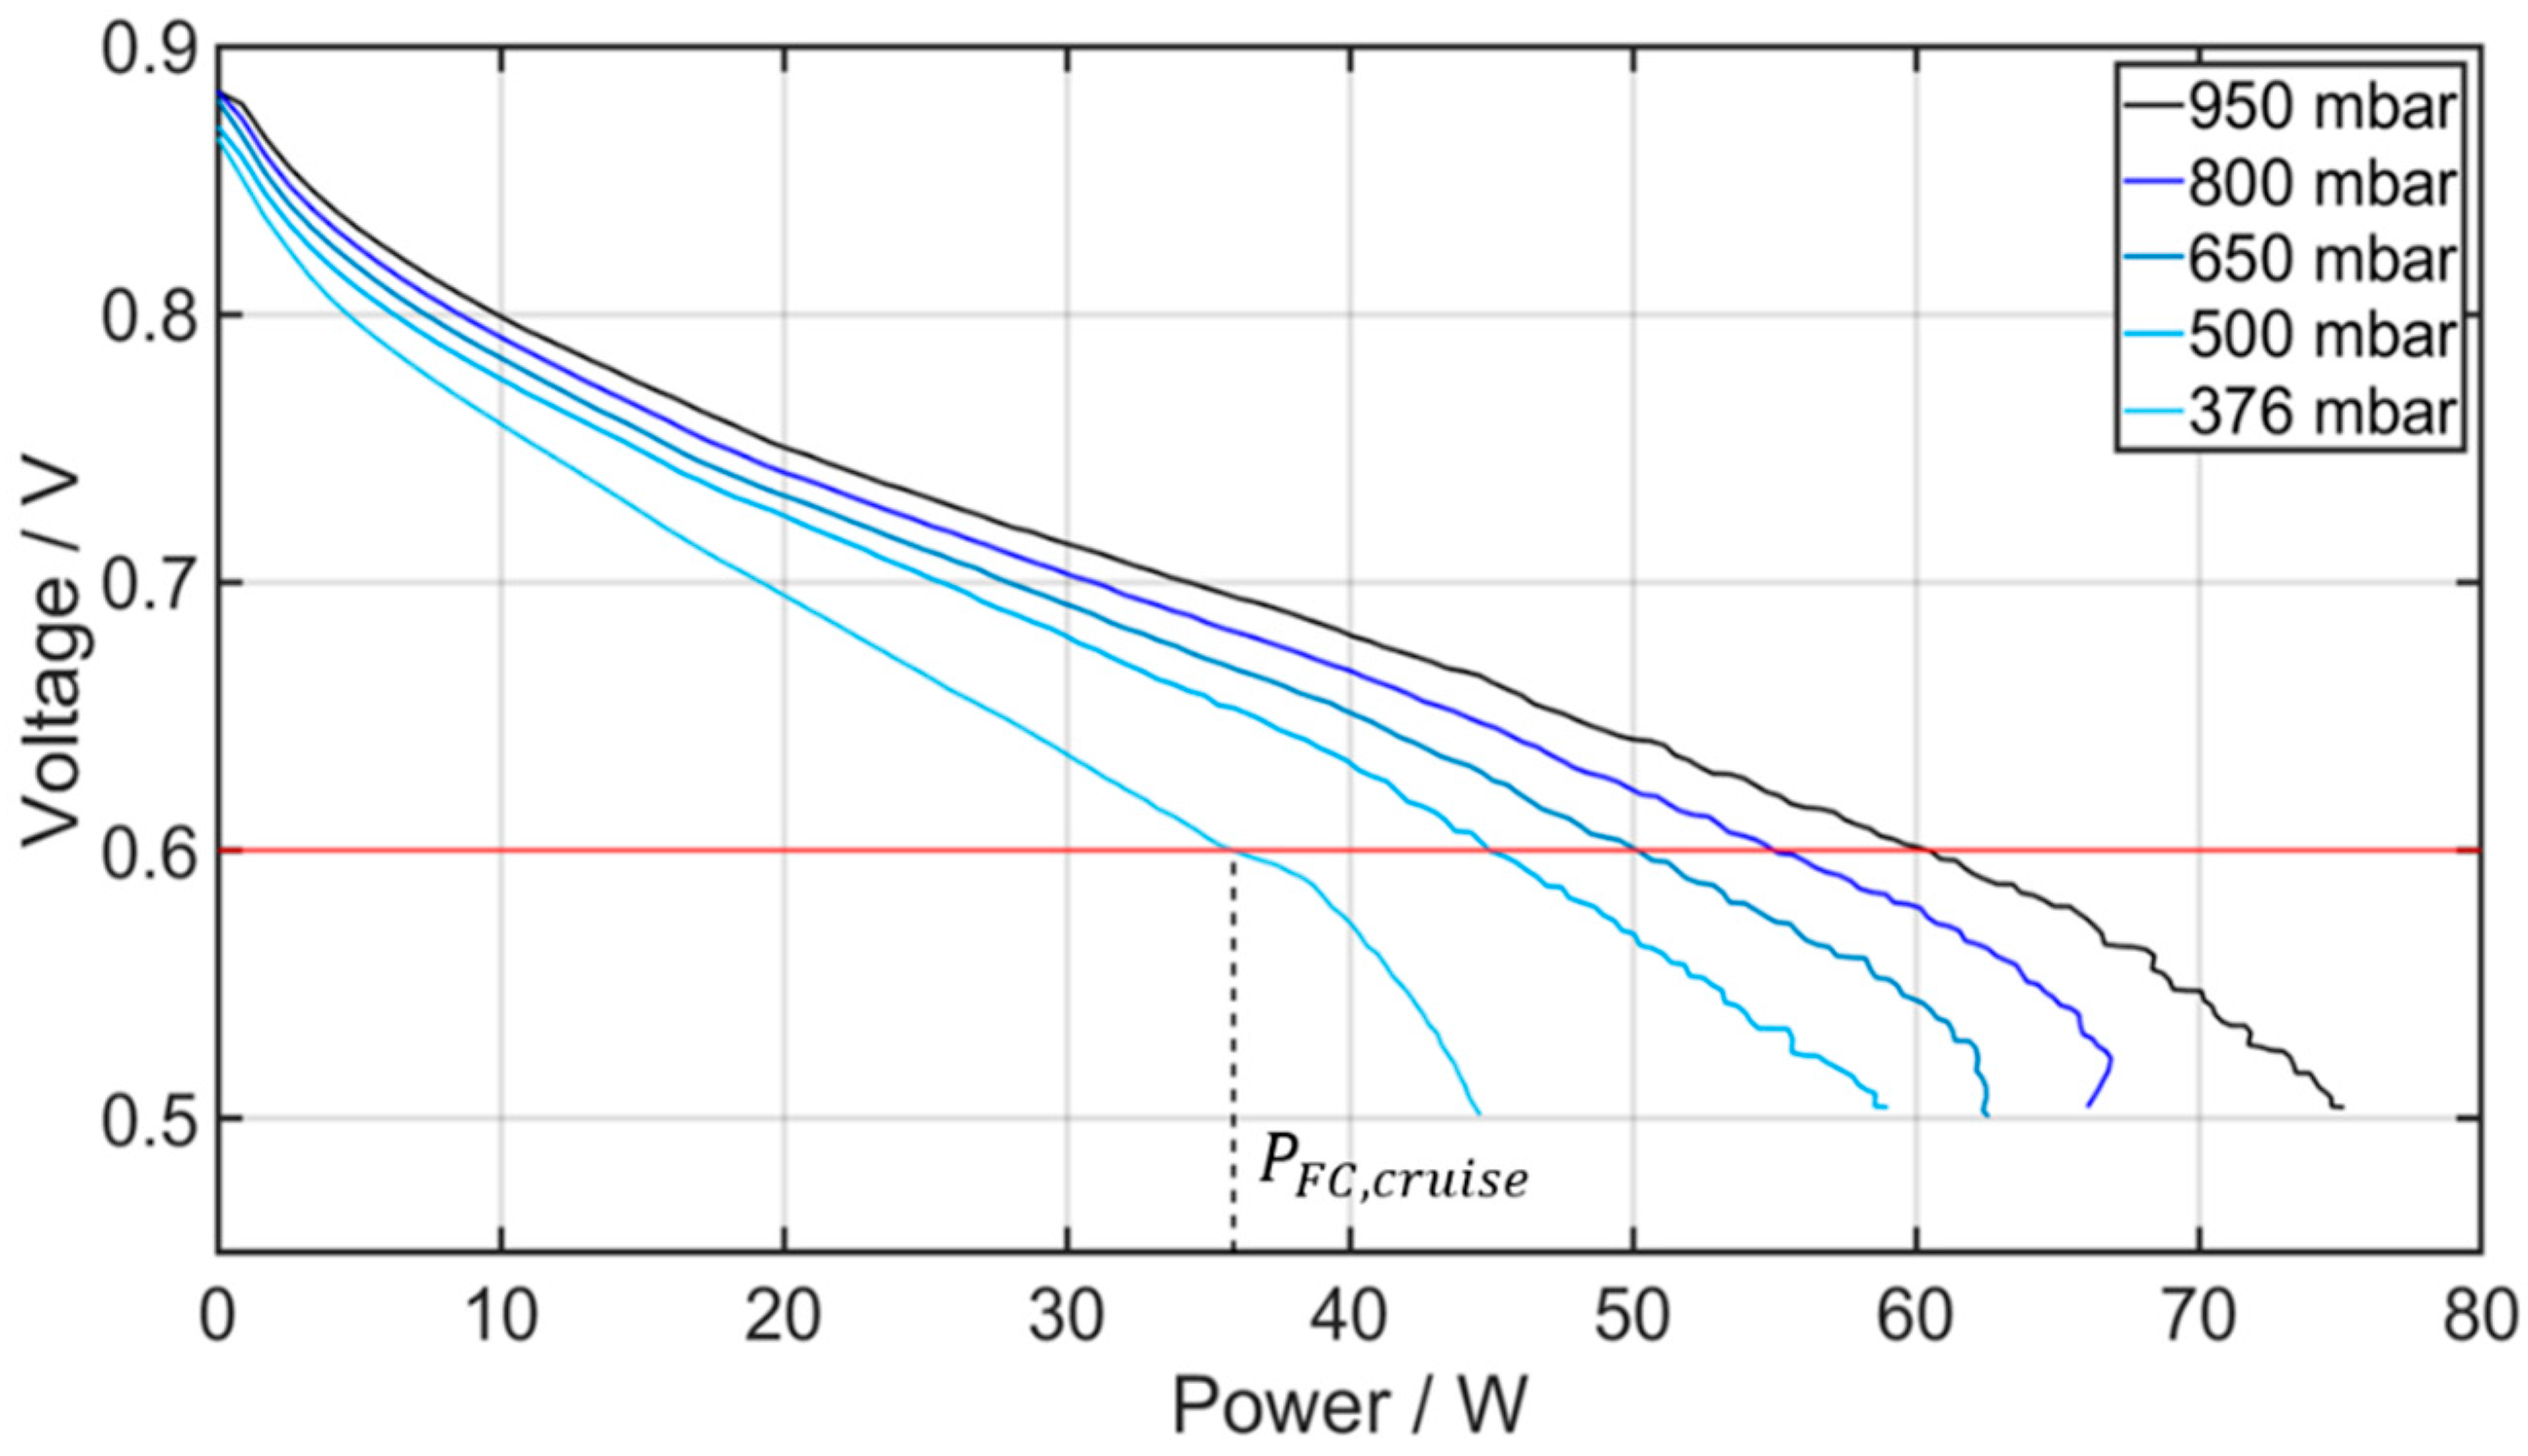
Figure 4.
Voltage over power at 30% and 80% SOC of a pouch Li-Ion battery cell (type SLPB120255255, 75 Ah pouch, Kokam Co., Ltd., Suwon, Republic of Korea).
Figure 4.
Voltage over power at 30% and 80% SOC of a pouch Li-Ion battery cell (type SLPB120255255, 75 Ah pouch, Kokam Co., Ltd., Suwon, Republic of Korea).

Figure 5.
Exemplary scaled down mission profile with an assumed cruise altitude of 25,000 ft.

Figure 6.
Schematic display of the fuel cell design process for a given fuel cell, powertrain and mission.
Figure 6.
Schematic display of the fuel cell design process for a given fuel cell, powertrain and mission.
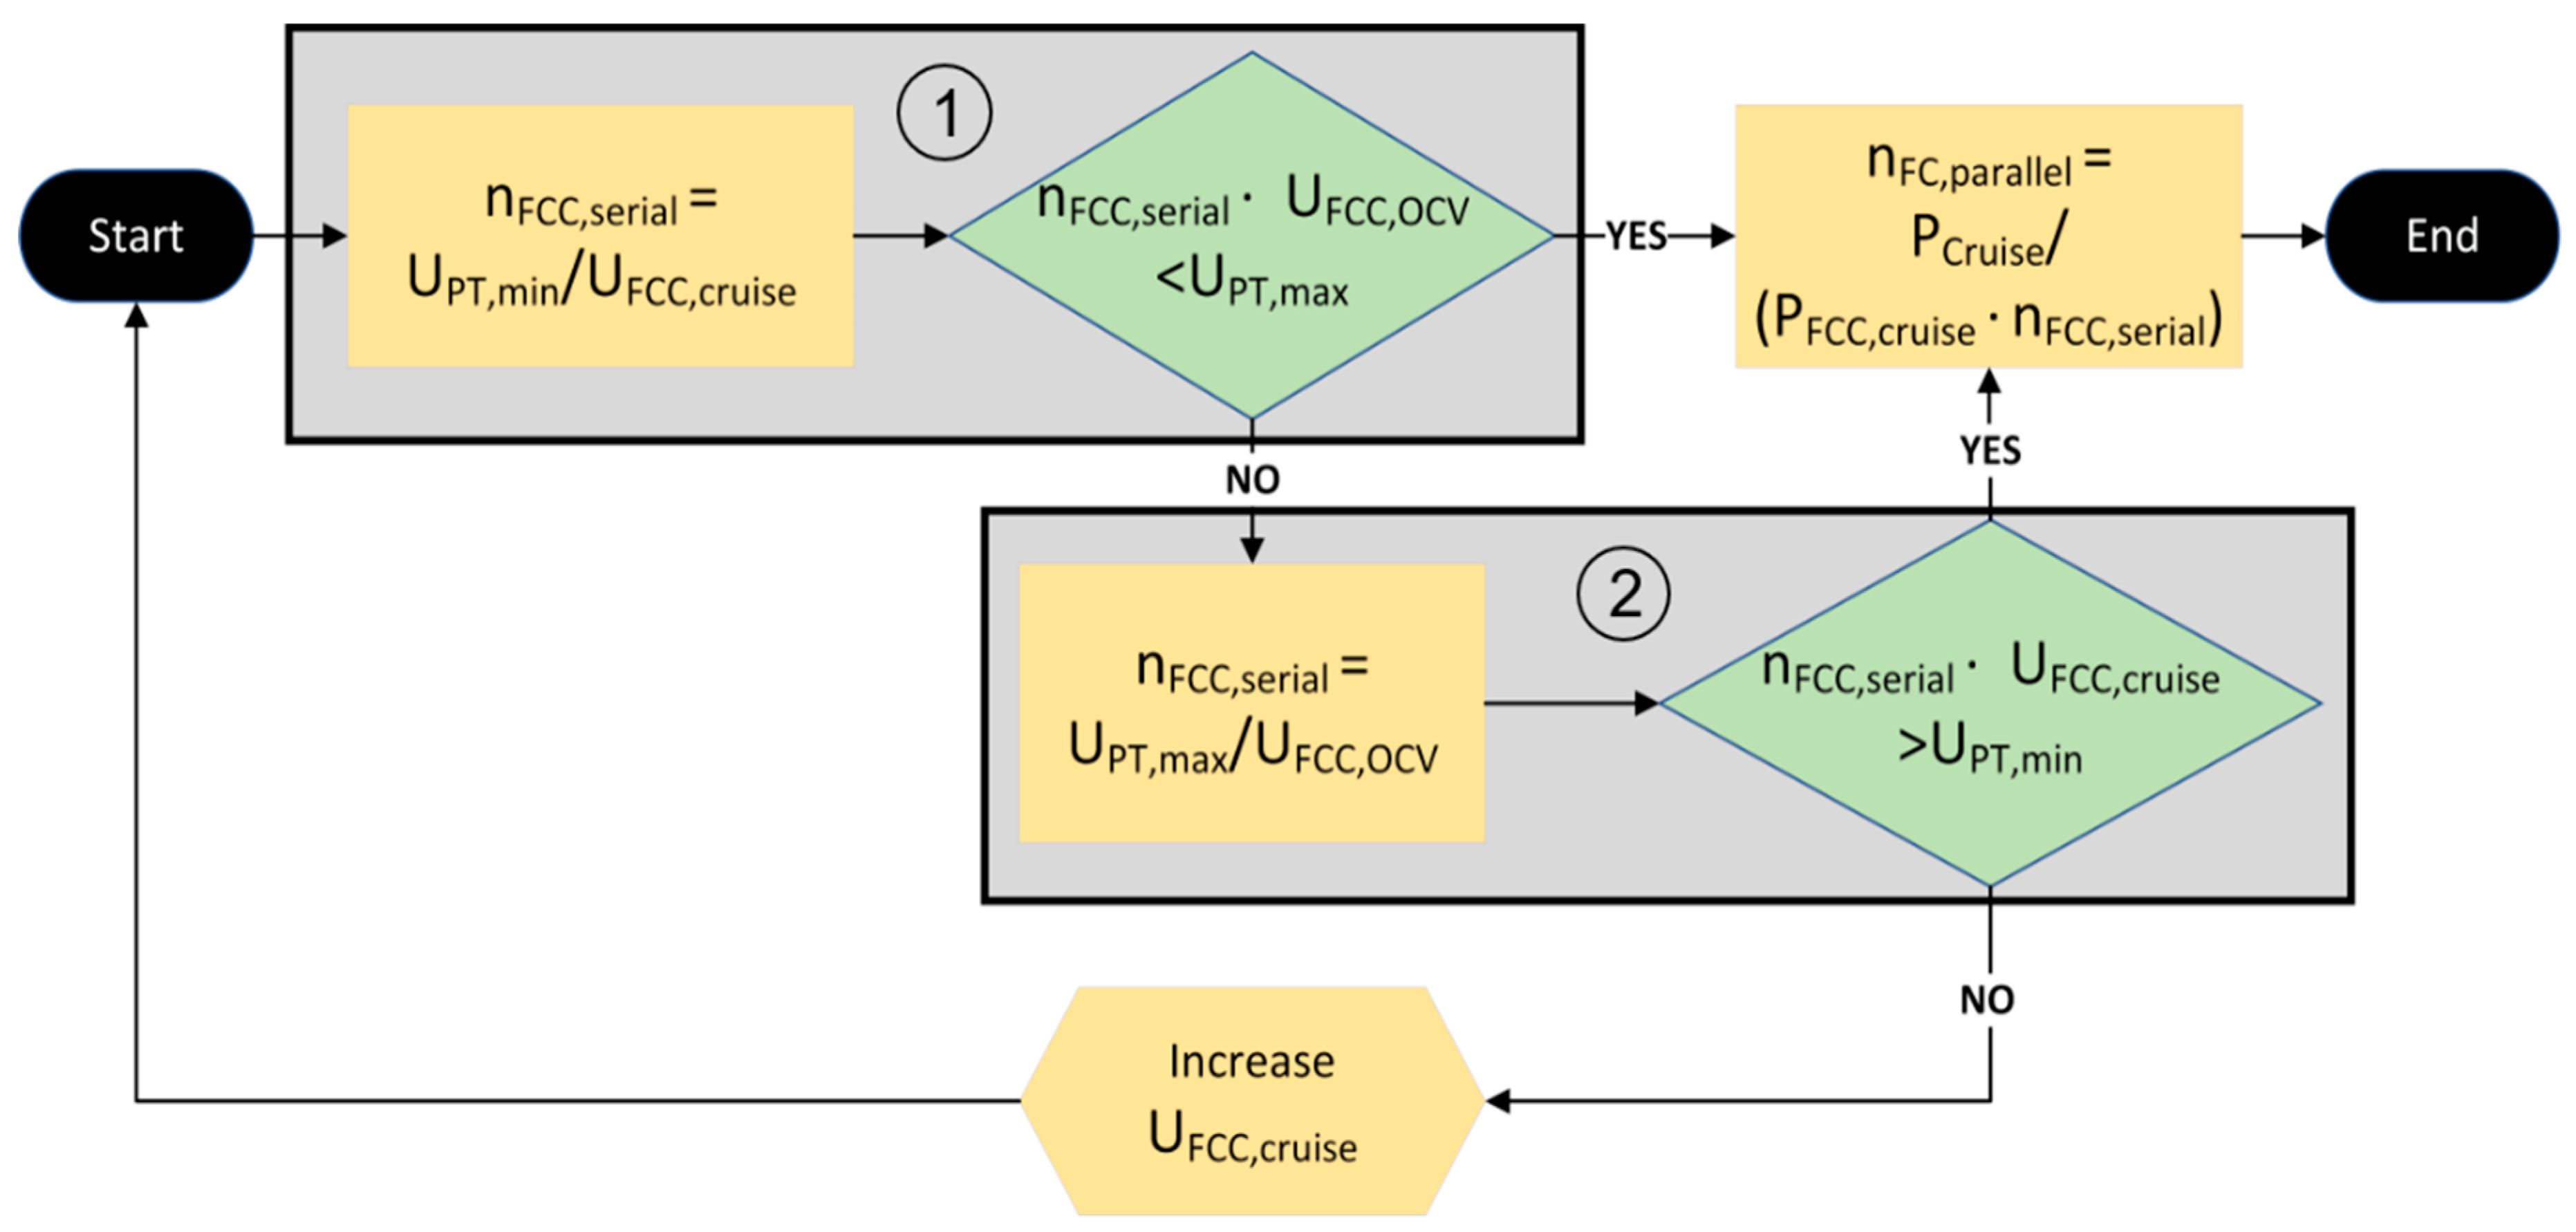
Figure 7.
Characteristic curves of a fuel cell system with 500 cells in series and 3 stacks in parallel at 950 mbar (dark blue) and 376 mbar (light blue) with voltage limits of the powertrain in red and take-off and cruise power marked with dotted lines.
Figure 7.
Characteristic curves of a fuel cell system with 500 cells in series and 3 stacks in parallel at 950 mbar (dark blue) and 376 mbar (light blue) with voltage limits of the powertrain in red and take-off and cruise power marked with dotted lines.

Figure 8.
Hybrid curve of the designed hybrid with 500 serial and 3 parallel fuel cell cells combined with 96 battery cells; operation points at cruise conditions (circle 1) and operation points for take-off at two different SOC stages are marked (circles 2 and 3). Characteristic fuel cell curves for 950 mbar (dark blue) and 376 mbar (light blue) and characteristic battery curves in hybrid configuration for 80% (dark green) and 30% (light green) SOC.

Figure 9.
Hybrid curves with an optimized battery with 500 serial and 3 parallel fuel cell cells combined with 85 battery cells; operation points at cruise conditions (circle 1) and operation points for take-off at two different SOC stages are marked (circle 2 and 3). Characteristic fuel cell curves for 950 mbar (dark blue) and 376 mbar (light blue) and characteristic battery curves in hybrid configuration for 80% (dark green) and 30% (light green) SOC.
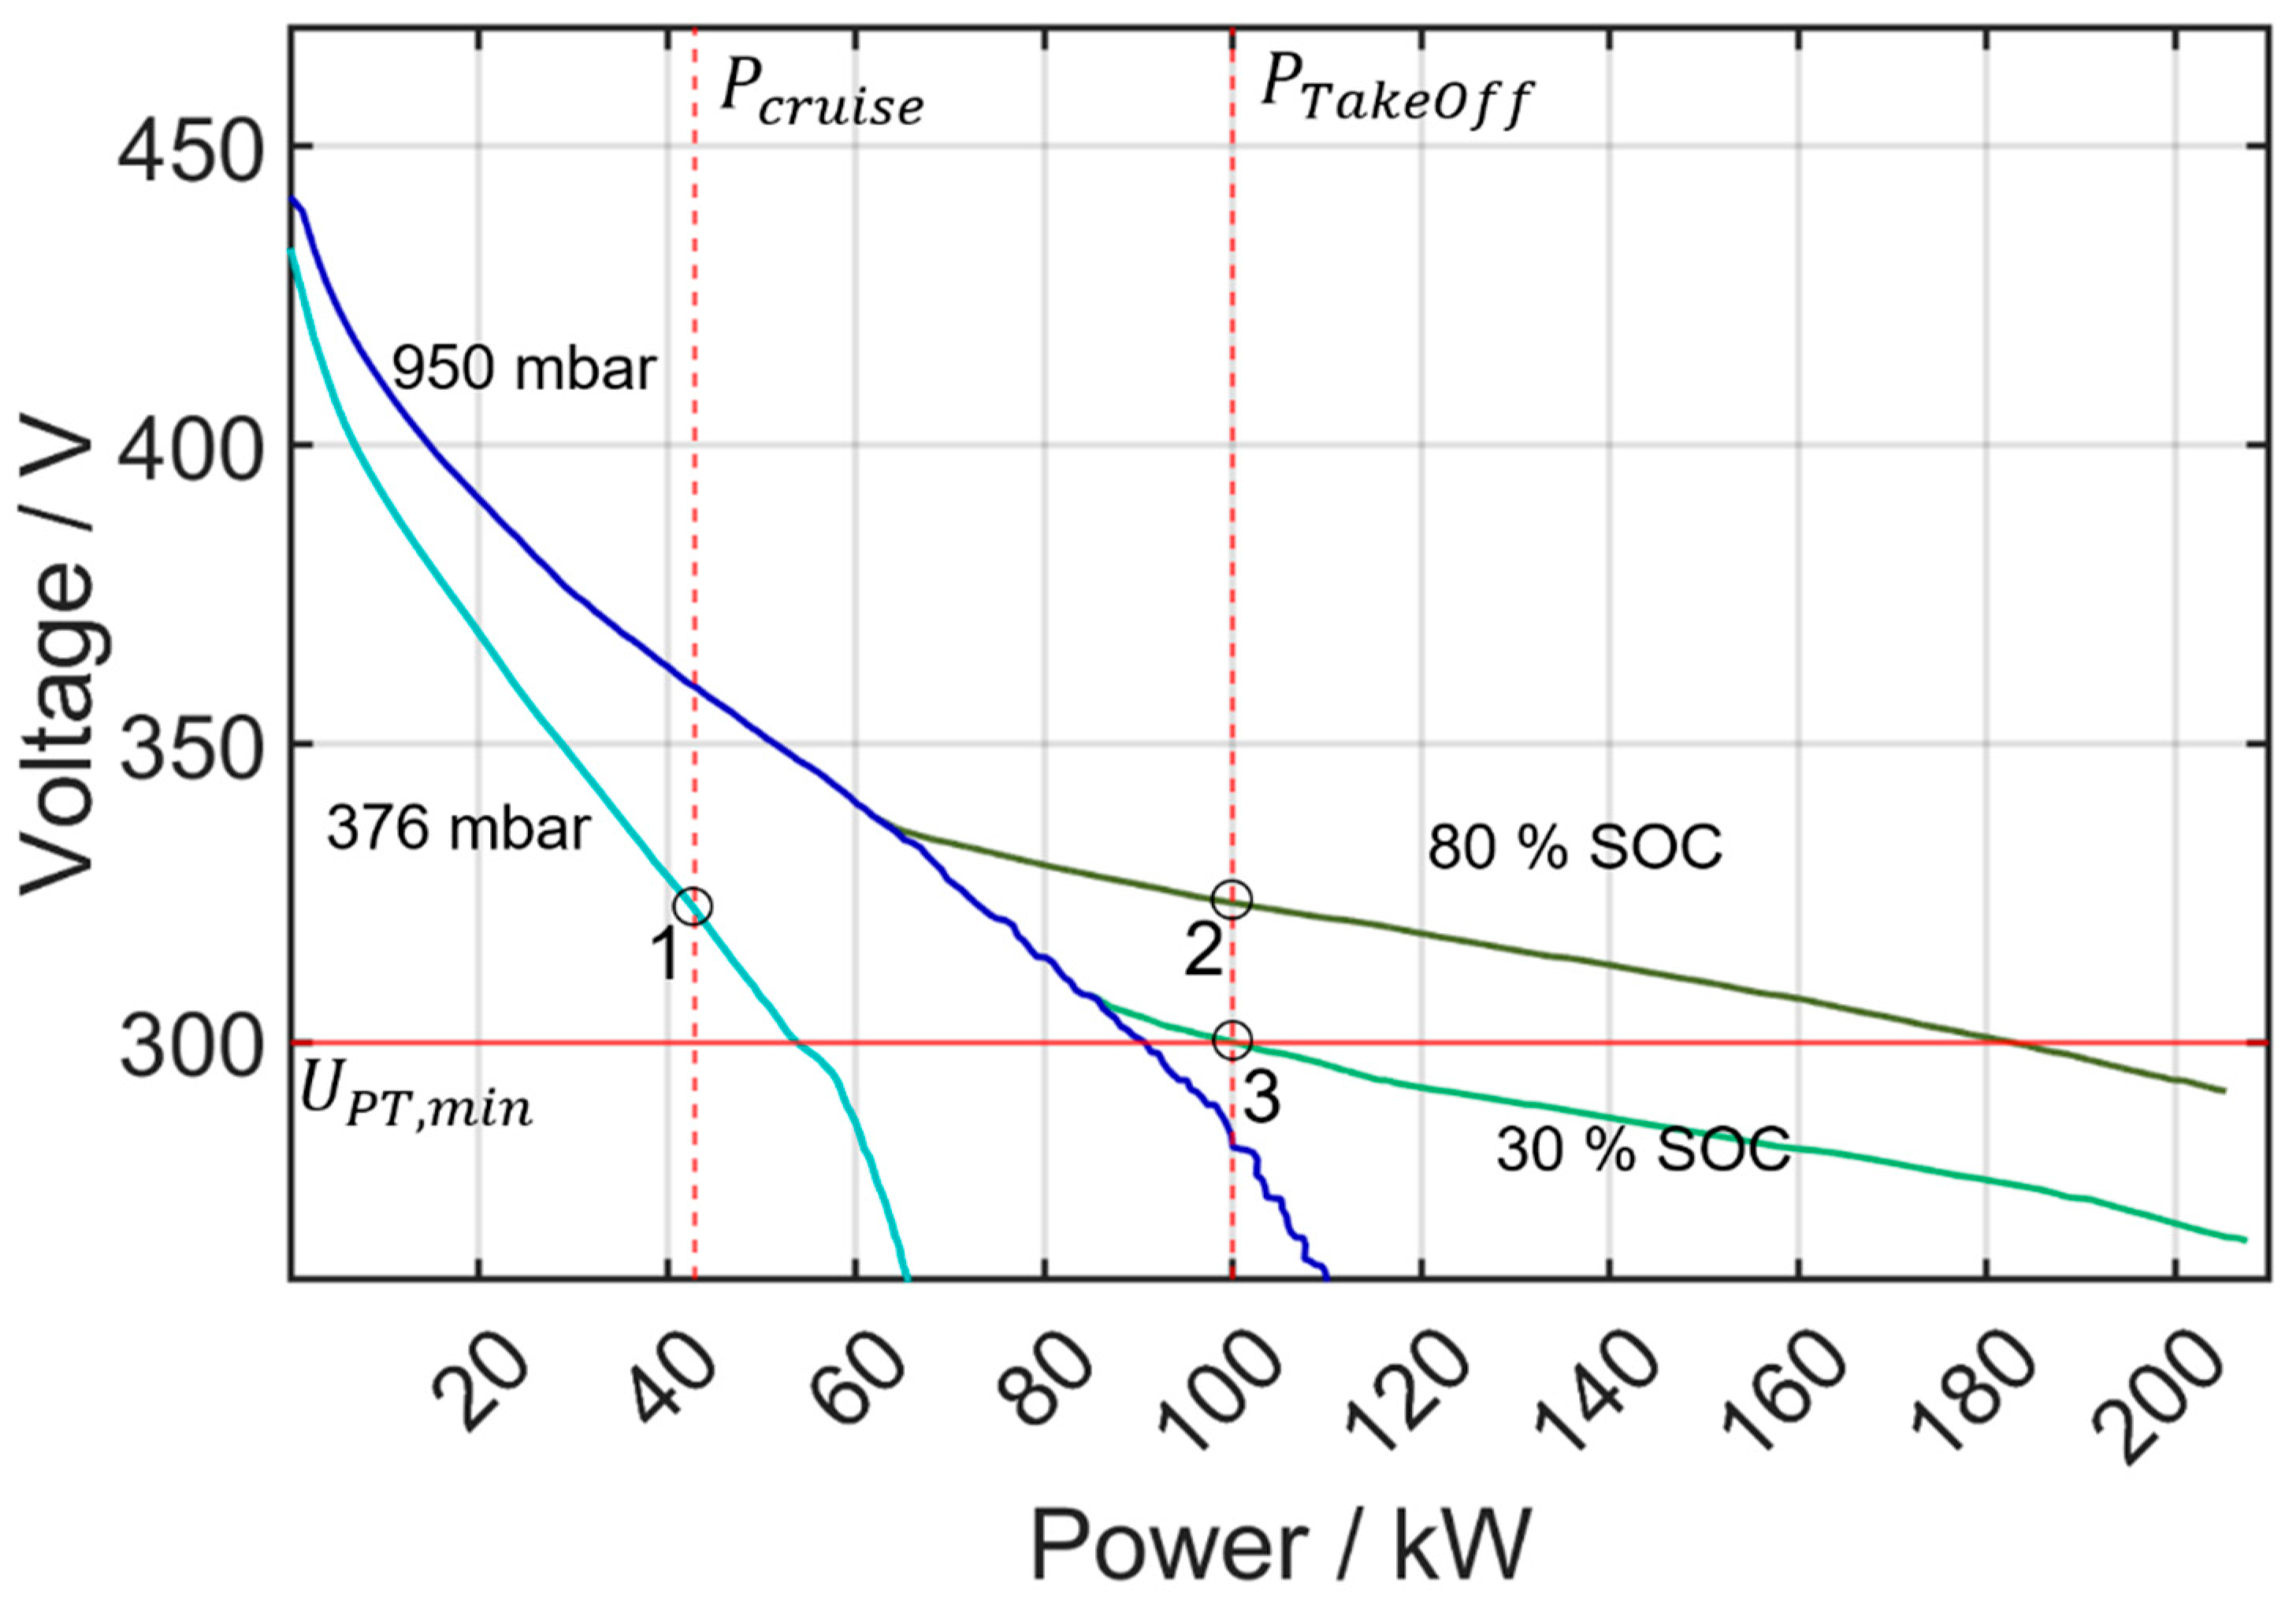
Figure 10.
Hybrid curves with 500 serial and 2.42 parallel fuel cell cells combined with 96 battery cells; operation points at cruise conditions (circle 1) and operation points for take-off at two different SOC stages are marked (circles 2 and 3). Characteristic fuel cell curves for 950 mbar (dark blue) and 376 mbar (light blue) and characteristic battery curves in hybrid configuration for 80% (dark green) and 30% (light green) SOC.

Figure 11.
Hybrid curves with 500 serial and 2.42 parallel fuel cell cells combined with 88 battery cells; operation points at cruise conditions (circle 1) and operation points for take-off at two different SOC stages are marked (circles 2 and 3). Characteristic fuel cell curves for 950 mbar (dark blue) and 376 mbar (light blue) and characteristic battery curves in hybrid configuration for 80% (dark green) and 30% (light green) SOC.

Figure 12.
Power contribution from fuel cell and battery during different flight phases for the 4 examined hybrid configurations from Table 1. Dotted lines separate the flight phases take-off, climb, cruise and descent.
Figure 12.
Power contribution from fuel cell and battery during different flight phases for the 4 examined hybrid configurations from Table 1. Dotted lines separate the flight phases take-off, climb, cruise and descent.

Table 1.
Overview of the different hybrid configurations; configuration, hydrogen used during the mission, SOC after climb and energy used from the battery during take-off and climb, as well as the calculated weight of the different systems.
Table 1.
Overview of the different hybrid configurations; configuration, hydrogen used during the mission, SOC after climb and energy used from the battery during take-off and climb, as well as the calculated weight of the different systems.
| Hybrid | 1 | 2 | 3 | 4 | |
|---|---|---|---|---|---|
| Fuel cell | serial | 500 | 500 | 500 | 500 |
| parallel | 3 | 3 | 2.42 | 2.42 | |
| Battery | serial | 96 | 85 | 96 | 88 |
| parallel | 1 | 1 | 1 | 1 | |
| SOC after climb | % | 53 | 67 | 47 | 56 |
| Energy used from battery during take-off and climb | kWh | 8.1 | 3.5 | 9.6 | 6.6 |
| H2 consumption | kg | 0.8 | 1.12 | 0.74 | 0.95 |
| Weight in kg | FC | 50 | 50 | 40.3 | 40.3 |
| Battery | 146.9 | 130.0 | 146.9 | 134.6 | |
| Total | 196.9 | 180.0 | 187.2 | 174.9 |
Disclaimer/Publisher’s Note: The statements, opinions and data contained in all publications are solely those of the individual author(s) and contributor(s) and not of MDPI and/or the editor(s). MDPI and/or the editor(s) disclaim responsibility for any injury to people or property resulting from any ideas, methods, instructions or products referred to in the content. |
© 2024 by the authors. Licensee MDPI, Basel, Switzerland. This article is an open access article distributed under the terms and conditions of the Creative Commons Attribution (CC BY) license (https://creativecommons.org/licenses/by/4.0/).
Share and Cite
MDPI and ACS Style
Graf, T.; Fonk, R.; Bauer, C.; Kallo, J.; Willich, C. Optimal Sizing of Fuel Cell and Battery in a Direct-Hybrid for Electric Aircraft. Aerospace 2024, 11, 176. https://doi.org/10.3390/aerospace11030176
AMA Style
Graf T, Fonk R, Bauer C, Kallo J, Willich C. Optimal Sizing of Fuel Cell and Battery in a Direct-Hybrid for Electric Aircraft. Aerospace. 2024; 11(3):176. https://doi.org/10.3390/aerospace11030176
Chicago/Turabian StyleGraf, Tobias, Robin Fonk, Christiane Bauer, Josef Kallo, and Caroline Willich. 2024. "Optimal Sizing of Fuel Cell and Battery in a Direct-Hybrid for Electric Aircraft" Aerospace 11, no. 3: 176. https://doi.org/10.3390/aerospace11030176
Note that from the first issue of 2016, this journal uses article numbers instead of page numbers. See further details here.