Abstract
This study experimentally explored the effects of equivalence ratio settings on ethanol fuel combustion oscillations with a laboratory-scale combustor. A contrary flame equivalence ratio adjusting trend was selected to investigate the dynamic characteristics of an ethanol atomization burner. Research findings denote that optimizing the equivalence ratio settings can prevent the occurrence of combustion instability in ethanol burners. In the combustion chamber, the sound pressure amplitude increased from 138 Pa to 171 Pa and eventually dropped to 38 Pa, as the equivalence ratio increased from 0.45 to 0.90. However, the sound pressure amplitude increased from 35 Pa to 199 Pa and eventually dropped to 162 Pa, as the equivalence ratio decreased from 0.90 to 0.45. The oscillation frequency of the ethanol atomization burner presents a migration characteristic; this is mainly due to thermal effects associated with changes in the equivalence ratio that increase/decrease the speed of sound in burnt gases, leading to increased/decreased oscillation frequencies. The trend of the change in flame heat release rate is basically like that of sound pressure, but the time-series signal of the flame heat release rate is different from that of sound pressure. It can be concluded that the reversible change in equivalence ratio will bring significant changes to the amplitude of combustion oscillations. At the same time, the macroscopic morphology of the flame will also undergo significant changes. The flame front length decreased from 25 cm to 18 cm, and the flame frontal angle increased from 23 to 42 degrees when the equivalence ratio increased. A strange phenomenon has been observed, which is that there is also sound pressure fluctuation inside the atomized air pipeline, and it presents a special square waveform. This study explored the equivalence ratio adjusting trends on ethanol combustion instability, which will provide the theoretical basis for the design of ethanol atomization burners.
1. Introduction
As a renewable and sustainable biofuel, ethanol is widely used in combustion equipment such as internal engines and industrial boilers, providing heat and power. Therefore, how to achieve clean combustion and efficient utilization of ethanol is crucial for achieving carbon neutrality [1]. As a representative of alcohol-based fuels, ethanol has good application prospects and helps alleviate the fossil fuel crisis [2]. However, the combustion process of ethanol is complex and involves many influencing factors; it is especially prone to combustion instability, which poses serious challenges to the safe and clean operation of the combustion system [3,4]. Unsteady combustion instability, also referred to as combustion oscillation, has emerged as a common problem in modern engines that use atomization–combustion technologies and will seriously threaten the safety operation or development progress of the combustion engine [5]. Therefore, it is urgent to investigate the causes, measurement methods, diagnosis, and optimization control of the unstable ethanol atomization–combustion process [6,7]. Although scholars have been able to use passive methods to suppress the instability of ethanol atomization–combustion and have achieved good results [8,9], the causes of ethanol atomization–combustion oscillations have not been fully elucidated. Only by revealing the mechanism of ethanol atomization–combustion oscillations can it be possible to suppress ethanol combustion oscillations from the source rather than passively suppressing them when combustion oscillations occur, which will greatly shorten the development progress of renewable ethanol burners.
Mastering the dynamic process of ethanol atomization–combustion is the key to suppressing the source of combustion oscillations [10]. However, in reality, the combustion process of liquid or gas combustion reacts quickly and is very sensitive to changes in specific combustion parameters, making it difficult to obtain the main variables that cause combustion oscillations [11,12]. These parameters typically include combustion air volume [13,14], burner power, fuel type, burner geometry, etc. In the actual operation of ethanol burners, it is usually necessary to change the air volume of the burner to improve burner efficiency and reduce pollutant emissions, accompanied by an increase or decrease in burner load [15]. Unlike other variables, the flame equivalence ratio not only reflects the proportion of fuel and air well, but the oscillation of the flame equivalence ratio is also one of the main reasons for the occurrence of combustion instability [16]. Therefore, using the trend of changes in flame equivalence ratio as a research variable has representativeness. This study aims to explore the influence of the contrary flame equivalence ratio on the instability of ethanol atomization–combustion to provide a reference for better understanding and suppressing ethanol fuel combustion oscillations.
Scholars have extensively studied the influence of flame equivalence ratio on the unstable process of liquid fuel atomization–combustion. To grasp the characteristics of flame oscillation, it can be seen that the importance of the flame equivalence ratio cannot be ignored in the atomization–combustion process of liquid fuel. Yi et al. [17] studied the flame structure and combustion instability characteristics in a turbulent combustor and denoted that with decreasing equivalence ratios at the approach of lean blowout, the flame ring shrinks in diameter and gradually converges to the axis. Semlitsch et al. [18] numerically explored the equivalence ratio perturbations on flames and found flame parameters would influence the nonlinear heat release rate estimation and its modeling. Meanwhile, Prieur et al. [19] clarified that equivalence ratio perturbations would cause a hysteresis phenomenon in annular combustors. Lee et al. [20] presented the quantitative measurements of equivalence ratio fluctuations during unstable combustion and revealed that the heat release and pressure fluctuations occur predominately at the fundamental frequency of the instability. Sun et al. [21] investigated the nonlinear dynamic features of self-sustained thermoacoustic oscillations in a premixed swirling combustor, and the Hopf supercritical and period-doubling bifurcation behaviors are experimentally observed with increased equivalence ratio. The above research indicated that the distribution of flame heat release was crucial in the process of liquid spray combustion. Zhang et al. [22] studied the combustion characteristics and flame development process, and due to the low total equivalence ratio and heat release quantity of pure ethanol spray, the overall flame brightness of ethanol spray is weaker. Ruan et al. [23] explored the combustion stability characteristics in liquid-fueled combustors and revealed that the flame would shift from stable to unstable modes under a wide range of equivalence ratios. Soundararajan et al. [24] explored the equivalence ratio fluctuations during liquid fuel atomization–combustion and clarified that combustion instability amplitude or frequency would alter after experiencing small fluctuations in the equivalence ratio. Pillai et al. [25] tested the fuel atomization and flow rate fluctuations on spray combustion instabilities in liquid-fueled combustors. Then, this team revealed that an unstable flame would lead to temporal fluctuations in fuel droplet diameter distribution. Ahn et al. [26] studied combustion dynamics in a laboratory-scale liquid-fuel combustor operated with Jet A-1 fuel and pointed out that the oscillation amplitude, frequency, and phase differences of combustion instability could be changed.
The above research indicates that the equivalence ratio of liquid spray flames is closely related to combustion dynamics. Therefore, it is necessary to explore the impact of changes in flame equivalence ratio on combustion instability. Liu et al. [27] presented the numerical evidence of multiple bifurcations in thermoacoustic instability when decreasing the flame equivalence ratio from fuel-rich to fuel-lean. Similarly, Wang et al. [28,29] indicated that the fluctuation or variation of the flame equivalence ratio will lead to the evolution of combustion oscillation modes, posing a challenge to the suppression of combustion instability. More importantly, Xue et al. [30] found that as the flame equivalence ratio increased, the flame oscillation pattern gradually shifted from one mode to another mode. Therefore, it is necessary to explore the dynamic characteristics of ethanol spray combustion instability when the flame equivalence ratio changes in the opposite direction, which can help design a reliable ethanol burner with reliable performance. Accordingly, it can also help to grasp the response mechanism of unstable ethanol atomization–combustion, thereby achieving a better suppression of combustion oscillation.
Therefore, this study focuses on studying the dynamic response mechanism of unstable ethanol atomization–combustion when the flame equivalence ratio changes in a completely different direction, aiming to reveal the mechanism by which the fluctuation trend in the flame equivalence ratio induces oscillation. By obtaining the response trend in combustion dynamics when the ethanol flame equivalence ratio changes inversely, the engine design department can improve the adjustment strategy of the ethanol atomization burner and assist in the development of low-carbon ethanol atomization burners. At the same time, mastering the evolution dynamics of ethanol flames can also help prevent oscillation in engines, thereby improving the safety and reliability of combustion systems.
In this research, the time-series signal, oscillation amplitude, oscillation frequency, and the flame macrostructure of ethanol combustion instabilities are experimentally and theoretically studied. The flame equivalence ratio φ of the combustion system was studied while keeping the thermal power, the ethanol flow rate, and the burner geometry unchanged. The combustion experiment was constructed in a laboratory-scale liquid-fuel combustor operated with ethanol fuel. Eleven equivalence ratios of the flame were taken in this study, and the equivalence ratio ranged from 0.45 to 0.95; this corresponds to the lean premixed combustion of actual atomized combustors. In this study, the equivalence ratio of the ethanol atomization flame gradually increased from 0.45 to 0.95 and then gradually decreased from 0.95 to 0.45. During this process, the sound pressure oscillation signal, the heat release rate fluctuation signal, and the morphological changes in the flame in the combustion chamber were synchronously measured and recorded. This research aimed to reveal the contrary equivalence ratio adjusting trends on ethanol combustion dynamics to achieve a better suppression effect of combustion instability in modern ethanol engines. At the same time, it provides a reference for the safe operation of ethanol burners. This study is organized as the following steps: The model ethanol combustor setup, experimental apparatus and procedures, and the data processing method are described in Section 2. The analysis and discussions of experiment results are presented in Section 3. Finally, the key findings and prospects of this study are summarized in Section 4.
2. Experimental Apparatus and Procedures
The combustion experiment of this research was conducted on a laboratory-scale ethanol atomization combustor. Detailed burner design characteristics and measuring instruments are displayed in Figure 1. In this research, the atomizing air of the ethanol nozzle is supplied with an air compressor (FREEMAN, PE20V15G), and the airflow rate was regulated with an Alicat gas flow meter (MCR-250SLPM). During the experiment, the ethanol flow rate and atomization airflow rate were kept constant to ensure that the burner thermal power remained constant. The air required for combustion is supplied by a high-pressure vortex air pump (PAMPAS, 250w), and the air flow rate was regulated with an Alicat gas flow meter (LZB-50, 16–160 m3/h). Ethanol used for combustion is supplied from ethanol fuel tanks, with a concentration of 99.95%. At the bottom of the burner, eight combustion air inlets are reserved. The combustion chamber is made of high-temperature-resistant and transparent quartz glass, with holes reserved for measuring the dynamic pressure of the combustion chamber.
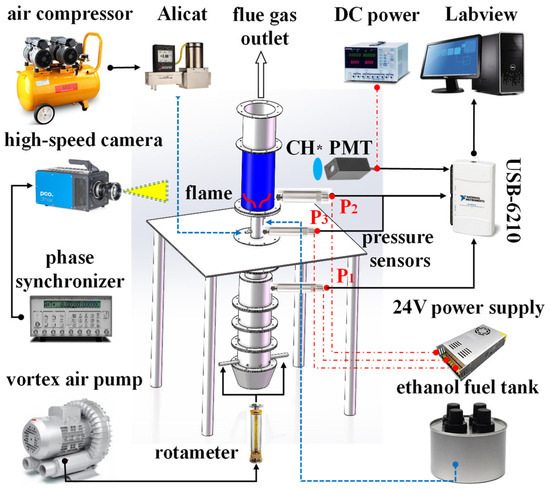
Figure 1.
Design of the laboratory-scale ethanol atomization combustor. The measuring instruments of the experiment are presented.
During the experiment, the burner is placed vertically with combustion air entering from the bottom and ethanol mist entering from the middle. The flue gas generated from ethanol combustion is discharged from the upper end of the burner. Except for the area used to measure the flame heat release rate and capture the flame images, the entire quartz glass combustion chamber is wrapped with insulation cotton to reduce the heat dissipation losses of the combustor. In this study, the length of the burner was set as 1350 mm, and there were three pressure measurement holes drilled in the wall of the combustor. These pressure-measuring holes are located on the side wall of the quartz combustion chamber, the inlet section of the burner, and the intake pipe of ethanol atomization air, respectively. By adjusting the airflow of the rotameter, the flame equivalence ratio φ can be varied from 0.45 to 0.95, increasing or decreasing by 0.5 each time. Because the atomization–combustion process usually uses a large excess air coefficient to lower the combustion temperature and suppress the generation of NOX, the flame equivalence ratios investigated in this study are all below 1.0. The self-excited frequency of this combustor is below the cut-off frequency; thus, the ethanol atomization combustor can be treated as a one-dimensional structure.
A high-speed camera (AOS series) was used for catching flame images, and the camera was triggered with a digital delay pulse generator (STANFORD DG645). A photomultiplier tube (HAMAMATSU) was used to measure the fluctuation of the flame heat release rate. And the photomultiplier tube is powered by a programmable DC power supply (Gwinstek). The front section of the PMT (photomultiplier tube) is equipped with a CH* signal filter. Three high-frequency dynamic sound pressure sensors (CYG-400) were used to measure combustion acoustic oscillations. The sound pressure sensors are powered by a 24 V DC power supply (MEAN WELL, LRS-100-24). The fluctuation signals of flame heat release rate and sound pressure are both transmitted through signal transmission lines to the high-frequency dynamic data acquisition card (National Instruments, USB-6210) and then collected and stored in real-time by Labview software installed in the computer (Labview 2022). The properties of ethanol are summarized in Table 1.

Table 1.
Fuel characteristics of ethanol.
During the combustion experiments, the burner thermal power was kept constant at 4 kW. In Figure 2, to stabilize the atomization flame, the burner adopts swirl blades with a swirl angle of 55 degrees. The diameter of the ethanol atomizing nozzle is 0.5 mm. This ethanol nozzle is made of stainless steel and the working pressure is 0.1 to 0.4 MPa. The intake pipe diameter of ethanol atomization air is 10 mm, with a sound pressure sensor installed. Some combustion conditions are set as shown in Table 2.
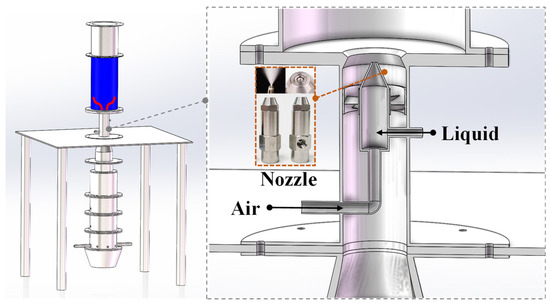
Figure 2.
Sectional view of the ethanol atomizing nozzle.

Table 2.
Combustion conditions of this study.
3. Results
3.1. Characteristics of Sound Pressure
The aim of the study was to clarify the fluctuation of sound pressure inside the ethanol atomization burner under different flame equivalence ratio variation trends. Figure 3a,b show the variation tendency of sound pressure amplitude in the combustion chamber (referred to as chamber in Figure 3) and the air inlet section (referred to as inlet in Figure 3). It can be seen that both the combustion chamber and the air inlet section have a consistent trend in the amplitude of sound pressure. The flame equivalence ratio φ firstly increased from 0.45 to 0.95, then decreased from 0.95 to 0.45. In this research, the sampling frequency of the high-frequency dynamic data acquisition card is 20,000 Hz. Firstly, as the flame equivalence ratio φ gradually increases, it can be inferred from Figure 3a that the sound pressure amplitude in the combustion chamber gradually increases from 138 Pa to 171 Pa as the equivalence ratio φ rises from 0.45 to 0.55. However, the sound pressure amplitude in the combustion chamber decreased from 171 Pa to 38 Pa as the equivalence ratio φ rose from 0.55 to 0.95. When it comes to the air inlet section, Figure 3a shows that the sound pressure amplitude in the air inlet section gradually increases from 128 Pa to 158 Pa as the equivalence ratio φ rises from 0.45 to 0.55. However, the sound pressure amplitude in the air inlet section decreased from 158 Pa to 35 Pa as the equivalence ratio φ rose from 0.55 to 0.95. At a certain equivalence ratio, there exists a maximum sound pressure amplitude value during the combustion of ethanol. This feature can provide a reference for effective control of ethanol atomization–combustion oscillation. In addition, as the flame equivalence ratio gradually decreases, it can be inferred from Figure 3b that the sound pressure amplitude in the combustion chamber gradually increases from 35 Pa to 199 Pa as the equivalence ratio φ drops from 0.95 to 0.55. However, the sound pressure amplitude in the combustion chamber decreased from 199 Pa to 162 Pa as φ continued to drop from 0.55 to 0.45. When it comes to the air inlet section, Figure 3b shows that the sound pressure amplitude in the air inlet section gradually increases from 35 Pa to 186.5 Pa as the equivalence ratio φ drops from 0.95 to 0.55. However, the amplitude in the air inlet section decreased from 186.5 Pa to 153 Pa as the equivalence ratio φ dropped from 0.55 to 0.45. Overall, when the equivalence ratio φ decreases, the average oscillation amplitude generated is higher than that when it gradually increases.
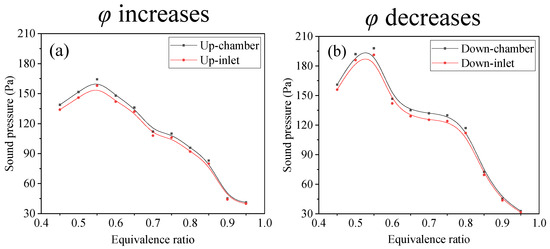
Figure 3.
Effects of different flame equivalence ratio φ variation trends on the sound pressure amplitude in the combustion chamber and air inlet section; the φ varies from 0.45 to 0.95. (a) The equivalence ratio increases. (b) The equivalence ratio decreases.
Figure 3a,b also indicate that by optimizing the equivalence ratio of the actual ethanol atomization–combustion process, combustion instability can be effectively controlled. Although the variation trend in ethanol atomization flame equivalence ratio is different, the variation trend in combustion oscillation amplitude is relatively consistent. To further elucidate the variation pattern of sound pressure amplitude, the difference in sound pressure between the combustion chamber and the air inlet section is calculated and plotted. In Figure 4, it is found that a single hump-type curve can be obtained when the equivalence ratio gradually increases from 0.45 to 0.95. However, the variation curve presents a double hump-type curve when the equivalence ratio gradually decreases from 0.95 to 0.45. When the flame equivalence ratio φ is less than 0.8, the sound pressure amplitude difference between the combustion chamber and the air inlet section is greater than 8 Pa. When the flame equivalence ratio φ is greater than 0.8, the difference between the combustion chamber and the inlet section is less than 8 Pa. This also indicates that the higher of flame equivalence ratio, the lower the oscillation amplitude of ethanol atomization–combustion. Due to the hysteresis phenomenon of combustion oscillation, once the combustion oscillation is formed and then regulated by the change equivalence ratio, excessive adjustment of system parameters is required to exit the oscillation, which may cause mode transition of combustion oscillation. Every time the flame equivalence ratio is adjusted, it will wait for 3 min before starting to collect combustion oscillation parameters. It can be seen that the dynamic characteristics of combustion oscillations under different equivalence ratios are inconsistent; this is mainly due to thermal effects associated with changes in the equivalence ratio that increase/decrease the speed of sound in burnt gases, leading to increased/decreased oscillation frequencies.
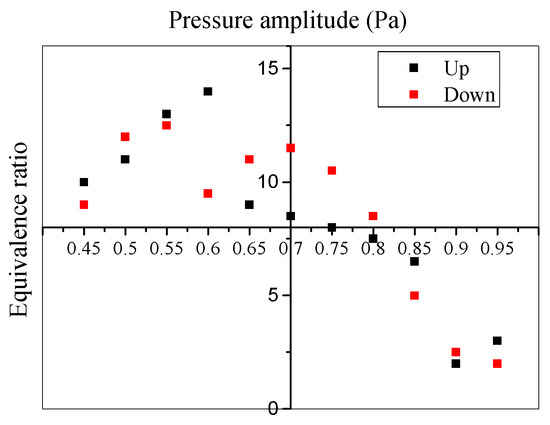
Figure 4.
Effects of different flame equivalence ratio φ variation trends on the sound pressure amplitude in the combustion chamber and air inlet section; the φ varies from 0.45 to 0.95.
The main reason for the sound pressure amplitude variation trends can be attributed to the variation in air volume, which directly alters the reaction kinetics of ethanol atomization flames in the combustion chamber. In Figure 3, as the equivalence ratio φ gradually changes to 0.55, the ethanol atomization flame has the highest intensity of oscillation amplitude. This is because the combustion air completely alters the dynamic process of ethanol atomization flame, resulting in severe thermoacoustic coupling under the condition of an equivalence ratio of 0.55, thereby stimulating higher oscillation amplitudes. According to the Rayleigh criterion of the thermoacoustic coupling process, the absolute phase difference between sound pressure and flame heat release rate is less than 90 degrees [5]. When the air volume of the burner changes, the air passes through the swirl blades and generates swirling flow; then, the swirling flow mixes with the atomized droplets and is ignited in the combustion chamber. During this process, the medium convection time, mixing time, and chemical reaction time are all changed, resulting in changes in the phase difference and delay time of the combustion oscillation process, ultimately leading to the evolution of oscillation intensity. Exploring the sound pressure amplitude difference between the upstream chamber and the downstream air inlet section may provide noise reduction guidance for the burner, effectively eliminating sound pressure fluctuations in the intake section [31]. Furthermore, the sound waves inside the burner propagate between the intake section and the combustion chamber, which may play a critical role in sustaining ethanol combustion instability.
The detailed value of sound pressure oscillation frequency at several different equivalence ratios is displayed in Figure 5. This study explored the effects of φ variations on the flame oscillation frequency in the combustion chamber; four flame equivalence ratios were selected, φ = 0.45 in Figure 5a, φ = 0.60 in Figure 5b, φ = 0.75 in Figure 5c, and φ = 0.90 in Figure 5d. By performing FFT (fast Fourier transform) analysis on the obtained sound pressure time-series signal in the combustion chamber, the main frequency of combustion oscillations under different flame equivalence ratios was obtained. At the flame equivalence ratio of 0.45 and 0.60, the oscillation frequencies were 163 Hz and 162 Hz, respectively. In Figure 5a,b, the oscillations were all greater than 160 Hz. However, at the flame equivalence ratio of 0.75 and 0.90, the oscillation frequencies were 159 Hz and 157 Hz, respectively. In Figure 5c,d, the oscillations were all greater than 160 Hz. At the same time, it can be seen that when the flame equivalence ratio is low, the main frequency of combustion oscillation is more obvious, while when the equivalence ratio increases, the FFT results of combustion oscillation show that the main frequency is no longer obvious, indicating the occurrence of many secondary oscillations during ethanol combustion. Figure 5 also indicates that when the equivalence ratio of the ethanol atomization flame is lower, the burner not only faces the problem of lean combustion and extinguishing but is more likely to trigger intense combustion oscillations, and the safety of the burner is affected by combustion oscillations. The reason for oscillation frequency changing is closely related to the mode transition of flame dynamics. Due to the relationship between the oscillation frequency of flames and the wavelength of sound waves, variation in air volume directly changes the coupling process between sound waves and flame heat release rate, as well as the delay time of combustion oscillation.
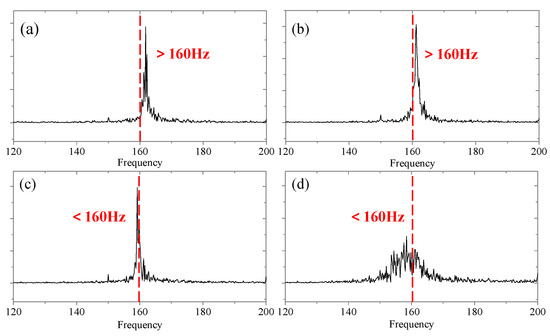
Figure 5.
Effects of different flame equivalence ratio φ on sound oscillation frequency in combustion chamber, φ = 0.45 in (a), φ = 0.60 in (b), φ = 0.75 in (c), and φ = 0.90 in (d).
To accurately evaluate the impact of equivalence ratio settings on the ethanol atomization–combustion dynamics, the time-series signal from high-frequency dynamic pressure sensors was collected and analyzed. In Figure 6, four flame equivalence ratios were selected, φ = 0.45 in Figure 6a, φ = 0.60 in Figure 6b, φ = 0.75 in Figure 6c, and φ = 0.90 in Figure 6d. These working conditions correspond to the oscillation frequency in Figure 5. This study directly used the voltage signal of pressure sensors to analyze the characteristics of sound pressure oscillation and captured a 0.05 s time series of voltage signals. Compared to the results in Figure 6a with Figure 6d, the oscillation amplitude and frequency are higher at extremely low equivalence ratios than when the equivalence ratio is close to 1.0. From Figure 6, it can also be seen that at low equivalence ratios, the electrical signal of sound pressure oscillation is relatively regular, close to the sine waveform. However, at high equivalence ratios, the electrical signal of sound pressure oscillation fluctuates and becomes no longer regular. This is also consistent with the evolution law of the oscillation frequency mode transition presented in Figure 5. Ethanol flame dynamics and combustion instability are mainly induced by equivalence ratio variation, and these combined effects cause changes in the wavelength and oscillation period of sound waves, finally resulting in changes in the oscillation frequency. At the same time, as the air volume changes, the instantaneous flow field becomes more complex under combustion instability conditions [32], which will cause the evolution of the vortex-shedding process that greatly affects the flow field in the combustion chamber.
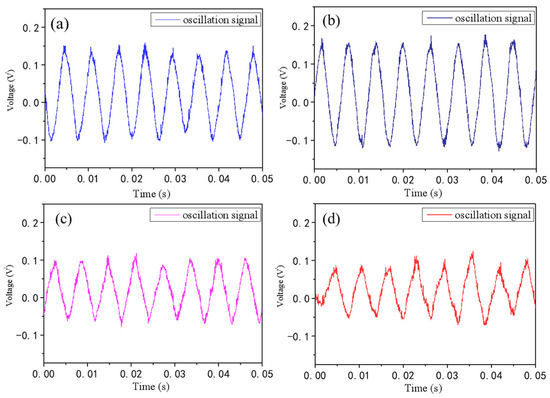
Figure 6.
Effects of different flame equivalence ratio φ on the time-series signal of sound pressure, φ = 0.45 in (a), φ = 0.60 in (b), φ = 0.75 in (c), and φ = 0.90 in (d).
Because the thermoacoustic oscillation of ethanol combustion undergoes mode transition over time, the wall temperature of the combustion chamber gradually increases with the combustion process. Boundary effects also affect the combustion oscillation mode. In this study, the flame equivalence ratio was gradually increased from 0.45 to 0.90, and after staying for 3 min, the oscillation parameters of the flame equivalence ratio gradually decreased from 0.90 to 0.45 were measured. Therefore, there was an instantaneous change in the combustion oscillation mode when the equivalence ratio was maintained at 0.90.
From the results plotted in Figure 3, Figure 4, Figure 5 and Figure 6, it can be seen that the ethanol atomization flame will bring significantly different combustion oscillation intensities, oscillation frequencies, and oscillation modes at different equivalence ratios. Mastering the causes and dynamic characteristics of ethanol atomization–combustion oscillation has theoretical and practical significance for designing a safe and efficient ethanol burner. However, the oscillation intensity of ethanol atomization–combustion does not vary linearly with the flame equivalence ratio but exhibits strong nonlinear evolution characteristics. By the way, identifying how to obtain the equivalence ratio that may cause the strongest oscillation intensity is a necessary condition for improving the safety of practical combustion systems. This is because the process of ethanol atomization–combustion involves many factors, so it is necessary to conduct in-depth research on the causes of combustion dynamics.
3.2. Dynamics of Flame Heat Release Rate
The fluctuation of the flame heat release rate is the source of combustion oscillation excitation. Therefore, to explore the dynamic characteristics of ethanol atomization–combustion, Figure 7, Figure 8 and Figure 9 studied the amplitude, frequency, and time-series signal variation characteristics of flame heat release rate fluctuation. Figure 7a shows the distribution density of the flame heat release rate in the combustion chamber, while the equivalence ratio varies from 0.40 to 1.0. While the equivalence ratio increases or decreases, the flame heat release rate and combustion chamber sound pressure signal are synchronously collected. To present the intensity distribution of flame heat release rate more accurately, the flame equivalence ratio increases or decreases by 0.1 each time. It can be inferred from Figure 7 that the flame heat release rate gradually decreases as the flame equivalence ratio φ increases from 0.40 to 1.0. This is different from the sound pressure amplitude in Figure 3. The fluctuation intensity of the flame heat release rate gradually decreases and eventually slows down as the equivalence ratio φ increases. However, the flame heat release rate gradually increases as the flame equivalence ratio φ decreases from 1.0 to 0.55. This is consistent with the maximum sound pressure amplitude in Figure 3. The fluctuation intensity of the flame heat release rate gradually decreases as the equivalence ratio φ decreases from 0.55 to 0.40. The intensity of the flame heat release rate drops from 2.6 arb.units to 0.6 arb.units as the equivalence ratio rises from 0.4 to 1.0, and the flame heat release rate rises from 0.6 arb.units to 3.8 arb.units as the equivalence ratio drops from 1.0 to 0.55, then continues to decrease from 3.8 to 2.7 as φ drops to 0.40.
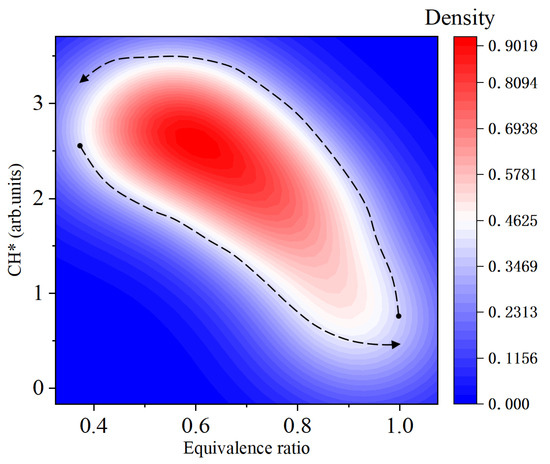
Figure 7.
Effects of different flame equivalence ratios φ on the distribution density of flame heat release rate in the combustion chamber.
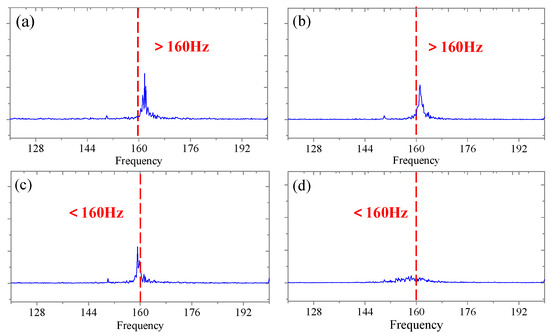
Figure 8.
Effects of different flame equivalence ratio φ on the oscillation frequency of flame heat release rate, φ = 0.45 in (a), φ = 0.60 in (b), φ = 0.75 in (c), and φ = 0.90 in (d).
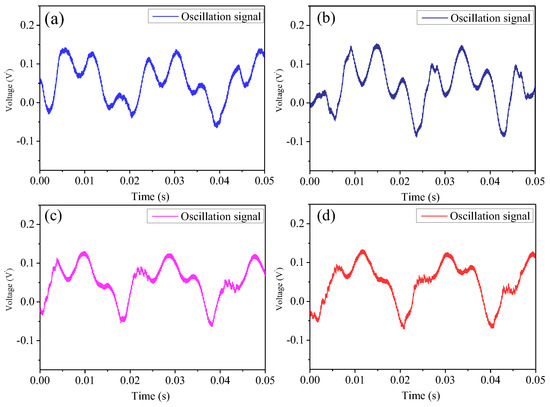
Figure 9.
Effects of different flame equivalence ratio φ on the time-series signal of CH*, φ = 0.45 in (a), φ = 0.60 in (b), φ = 0.75 in (c), and φ = 0.90 in (d).
Similar to Figure 5, the detailed value of flame heat release rate oscillation frequency at several different equivalence ratios was displayed in Figure 8. To be consistent with the combustion conditions in Figure 5, four flame equivalence ratios were selected, φ = 0.45 in Figure 8a, φ = 0.60 in Figure 8b, φ = 0.75 in Figure 8c, and φ = 0.90 in Figure 8d. By performing FFT (fast Fourier transform) analysis on the obtained PMT (photomultiplier tube) time-series signal, the main oscillation frequency of heat release rate under different flame equivalence ratios was obtained. At the flame equivalence ratio of 0.45 and 0.60, the oscillation frequency of the CH* signal was 162 Hz and 161 Hz, respectively. In Figure 8a,b, the oscillation of flame heat release rate is all greater than 160 Hz. However, at the flame equivalence ratio of 0.75 and 0.90, the oscillation frequency of the CH* signal was 159 Hz and 156 Hz, respectively. In Figure 8c,d, the oscillation frequencies of the CH* signal were all greater than 160 Hz. At the same time, when the flame equivalence ratio is low, the main oscillation frequency of the CH* signal is more obvious, while when the equivalence ratio increases, the FFT results of the CH* signal show that the main frequency is no longer obvious, and the oscillation peak eventually disappears.
The reason for the oscillation frequency change can be attributed to the distribution of flame heat release rate in the chamber. As the flame equivalence ratio changes, the combustion air volume also changes, resulting in significant changes in the temperature and flow field distribution of the combustion chamber, ultimately causing fluctuations in the distribution of flame heat release rate. Due to the correlation between the flame oscillation frequency and the propagation timescale of the flame heat release rate, the oscillation frequency changes with the distribution of the flame heat release rate. As the air volume increases, the flame is in a lean premixed combustion mode, which is more likely to trigger combustion oscillations; thus, the CH* oscillation frequency is like the sound pressure in Figure 5. In Figure 5 and Figure 8, there is a significant modal transfer phenomenon in the sound pressure and flame heat release rate of combustion oscillation, and the oscillation amplitude and frequency are also significantly different. This is attributed to the different flame equivalence ratios and their varying trends in combustion. Therefore, when operating an ethanol atomization burner in practice, it is important to avoid the equivalence ratio region that can trigger severe nonlinear combustion oscillations. In fact, the actual combustion process also needs to consider variables such as high pressure and power [33], which will bring new disturbances to the oscillation of ethanol combustion. So, mastering the changes in oscillation frequency and amplitude also helps to apply control measures.
To deeply evaluate the impact of the equivalence ratio on the ethanol atomization–combustion dynamics, the CH* signal was collected and analyzed. In Figure 9, four flame equivalence ratios were selected, φ = 0.45 in Figure 9a, φ = 0.60 in Figure 9b, φ = 0.75 in Figure 9c, and φ = 0.90 in Figure 9d. This study directly used the voltage signal of PMT (photomultiplier tube) sensors to analyze the characteristics of CH* signal oscillation and captured a 0.05 s time series of voltage signals. Comparing the results in Figure 9a with Figure 9d, the oscillation amplitude does not undergo significant changes when the equivalence ratio varies. However, the oscillation frequency and pulsation period are different under the equivalence ratio of 0.45 and 0.90.
3.3. Dynamics of Flame Macrostructures
To elucidate the dynamic response characteristics of flame macrostructures under different equivalence ratios, this study synchronously collected transient images of flames under combustion oscillation conditions. Figure 10 shows the ethanol flame macrostructure as the flame equivalence ratios φ increase or decrease. In Figure 10, four flame equivalence ratios were selected, φ = 0.45, φ = 0.60, φ = 0.75, and φ = 0.90. Edge detection algorithms and spray angle measurement methods are used to obtain the spray angle and length of the ethanol flame [34]. In this study, the flame front length and frontal angle were adopted. As the flame equivalence ratio φ increased from 0.45 to 0.9, the flame front length gradually reduced. However, the spray angle of the flame front gradually increases. As the equivalence ratio φ decreased from 0.90 to 0.45, the flame front length slightly improved, and the spray angle of the flame front gradually decreased. It can also be seen that under oscillation conditions, the flame root appears bright white and the flame front appears yellow. Under low equivalence ratio conditions, the increase in air volume leads to the stretching of the ethanol flame. From Figure 10, it can also be seen that after the ethanol atomization flame leaves the atomization nozzle and is ignited, the flame root initially appears light blue, followed by bright white in the main combustion zone, and the flame front appears yellow. It can also be inferred that the length of the main combustion zone of the flame hardly changes with the equivalence ratio.
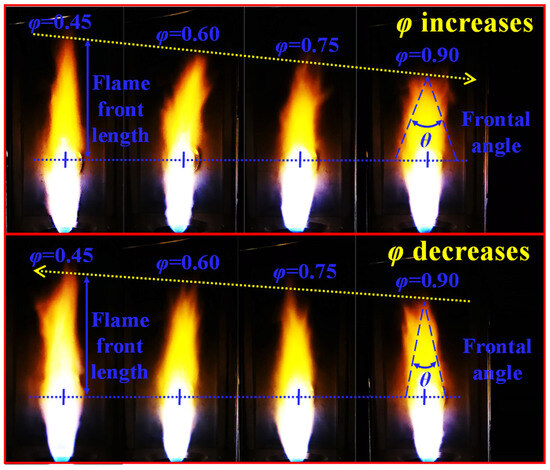
Figure 10.
Effects of different flame equivalence ratio φ variation trends on flame macrostructures. Four equivalence ratios were selected.
The detailed value of the front length and frontal angle for the ethanol flame is displayed in Figure 11a,b. As the equivalence ratio increased from 0.45 to 0.9, the flame front length decreased from 25 cm to 18 cm, and the flame frontal angle increased from 23 to 42 degrees. When the equivalence ratio decreased from 0.90 to 0.45, the flame front length increased from 19.2 cm to 24 cm, and the flame frontal angle decreased from 34.5 cm to 25 degrees. An interesting phenomenon can be seen in Figure 11; during the measurement process, the flame thermoacoustic oscillation signal is not always constant but evolves. This explains why when the equivalence ratio rises from 0.4 to 0.9 or drops from 0.9 to 0.4, the sound pressure amplitude, heat release rate, and flame morphology are not always consistent. The above phenomenon also corresponds to the flame oscillation signals that changed in Figure 5 and Figure 7, and these nonlinear findings also reflect the complex dynamic process of the ethanol atomization flame [35]. In fact, the length and angle of the atomized flame front not only affect the design of the actual combustor [36] but also affect the flame organization and flow field distribution. The length of the flame front is inversely proportional to the flame atomization angle, which also has reference significance for designing the ethanol atomization nozzles.
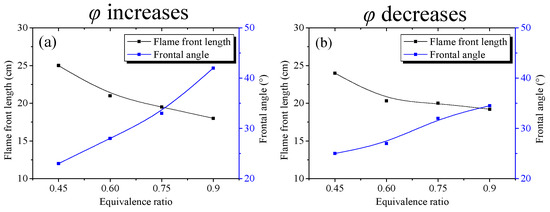
Figure 11.
Detailed value of the front length and frontal angles for the ethanol flame in this study. Four equivalence ratios were selected and compared. (a) The equivalence ratio increases. (b) The equivalence ratio decreases.
The flame front length and the atomized flame angle are crucial for the design of the combustion chamber. They not only affect the distribution of flow field, temperature field, etc., in the combustion chamber but also affect the concentration of pollutant emissions. Therefore, obtaining the shape and size of ethanol atomization flames under different flame equivalence ratio variation trends could help design atomization burners with high thermal efficiency, low emissions, and good fuel flexibility. To further investigate the cause of combustion oscillation in atomized ethanol flames, this study also measured the sound pressure pulsation inside the atomized air delivery pipeline plotted in Figure 12. As illustrated in Figure 12, four flame equivalence ratios were selected, φ = 0.45 in Figure 12a, φ = 0.60 in Figure 12b, φ = 0.75 in Figure 12c, and φ = 0.90 in Figure 12d. The time-series signal of the flame heat release rate in the combustion chamber and the sound pressure in the atomized air delivery pipeline were recorded simultaneously. The high-frequency data acquisition card collected a 0.1 s time-series voltage signal from PMT and the sound pressure transducer. Figure 12a–d shows that the CH*signal is basically in the normal sine waveform and pulsating like the signal in Figure 9. However, the sound pressure pulsation signal in the atomized air pipeline is not like that in the combustion chamber. The sound pressure fluctuation signal in the combustion chamber (P2) and the inlet section of the burner (P1) are approximately in the form of sine waves. However, the sound pressure pulsation signals in the atomized air pipeline (P3) exhibit a square waveform.
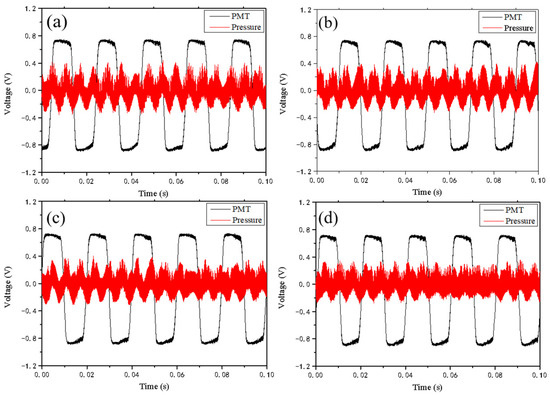
Figure 12.
Effects of different flame equivalence ratios on the time-series signal of sound pressure signal in the atomized air delivery pipeline. φ = 0.45 in (a), φ = 0.60 in (b), φ = 0.75 in (c), and φ = 0.90 in (d).
Figure 12 presented the effects of different flame equivalence ratios on the time-series signal and the sound pressure signal in the atomized air delivery pipeline and compared them with the flame heat release rate signal in the combustion chamber. It can be seen that the sound signal inside the air transmission pipeline does not significantly change with the change in equivalence ratio, while the amplitude and frequency of flame heat release rate fluctuation undergo appropriate evolution. This is because the sound waves inside the pipeline are completely different from those inside the combustion chamber. The sound waves inside the combustion chamber couple with the flame heat release rate to form thermoacoustic oscillations, while the sound waves inside the pipeline may be fluid vibrations caused by airflow.
This periodic pulsation phenomenon in the atomized air pipeline can cause regular periodic disturbances to the ethanol atomization process, further affecting the fragmentation of droplets, the formation of liquid filaments, and the liquid films. Similarly, it will also affect the mixing process of air and ethanol and ultimately affect the amplitude and phase difference of combustion instability. At the same time, it can also be seen from Figure 12 that the amplitude and frequency of the flame heat release rate were influenced by the equivalence ratio, while the amplitude and frequency of the sound pressure in the atomized air pipeline remain almost unchanged. This indicates that the sound wave pulsation in the atomized air pipeline is not coupled with the heat release rate but belongs to an independent chamber resonance [37,38]. This cavity resonance effect will ultimately transmit and affect the atomization flame chemical reaction process. The pulsating sound waves inside the atomized air pipeline first affect the fragmentation process of ethanol droplets, leading to periodic pulsations in the mixing process between droplets and air. The preheating, ignition, and propagation processes of atomized flames will be altered.
It is worth mentioning that the frequency of sound pressure pulsation in the atomized air pipeline is lower than 60 Hz, which is far from the frequency of sound pressure pulsation in the combustion chamber or inlet section (160 Hz). Therefore, it is unlikely that the sound wave in the atomized air pipeline is the sound wave entering the atomized air pipeline in the opposite direction through the small hole (0.5 mm) of the atomizing nozzle, and it is highly likely to be the periodic surge caused by the air compressor.
4. Conclusions
The dynamic response properties of the ethanol atomization flame under different equivalence ratio settings bring significant challenges to the design and practical operation of ethanol burners. To illustrate the response characteristics of the atomized ethanol flame, in this study, the influence of contrary equivalence ratio variation trends on combustion oscillation was experimentally and theoretically investigated. The nonlinear effects of the flame equivalence ratio were investigated by comparing their influences on the sound pressure amplitude, the flame heat release rate, and the flame shape.
Research results indicated that the changing trend and set value of the flame equivalence ratio affect the intensity of ethanol atomization–combustion oscillation. At the same time, there is an extreme point that will cause the most severe combustion oscillation. The flame equivalence ratio is either too high or too low, and it is not near this extreme point. Before developing a new ethanol burner by mastering the dynamic characteristics of ethanol atomization flame pulsation and identifying the value of flame equivalence ratio where the maximum combustion oscillation occurs, it is possible to effectively prevent the excitation of thermoacoustic oscillation. Research results also indicated that the oscillation traits fluctuated with practical burner settings, especially the length and angle of the ethanol flame front. This is because these two parameters are both related to the intensity of combustion oscillations, which can provide a theoretical basis for the design of compact combustion chambers.
Author Contributions
Conceptualization, C.T. and R.S.; methodology, Y.W.; software, Y.G.; validation, Y.G. and L.M.; formal analysis, L.M. and L.J.; investigation, C.T. and R.S.; resources, S.L. and L.C.; data curation, S.L. and Y.W.; writing—original draft preparation, C.T., R.S., Y.W., Y.G. and L.M.; writing—review and editing, C.T., L.J., S.L. and L.C. All authors have read and agreed to the published version of the manuscript.
Funding
This research was funded by the Natural Science Foundation of Jiangsu Province (No. BK20230699), China Postdoctoral Science Foundation (No. 2023M731492), Scientific Research Start-up Foundation funding of High-level Introduction Talents of Nanjing Institute of Technology (No. YKJ202107), Natural Science Research Project in Colleges and Universities in Jiangsu Province of China (No. 23KJB470010), and Jiangsu Province Engineering Research Center of IntelliSense Technology and System (No. ITS202402).
Institutional Review Board Statement
Not applicable.
Informed Consent Statement
Not applicable.
Data Availability Statement
Data are contained within the article.
Conflicts of Interest
Although the authors work with a company, this article have no conflict of interest with the company.
References
- Andrés, Z.M.; Lauermann, C.H.; Hayashi, T.C.; Mariños, D.J.; Costa, R.B.; Coronado, C.J.; Roberts, J.J.; Carvalho, J.A. Ethanol as a renewable biofuel: Combustion characteristics and application in engines. Energy 2022, 257, 124688. [Google Scholar]
- Chen, N.G.; Gan, Y.H.; Luo, Y.L.; Jiang, Z.W. A review on the technology development and fundamental research of electrospray combustion of liquid fuel at small-scale. Fuel Process. Technol. 2022, 234, 107342. [Google Scholar] [CrossRef]
- Fang, H.; Wei, D.L.; Hu, L.B.; Zhou, H. Combustion instability and emission characteristics of spray flame under flue gas jet. Fuel 2024, 358, 130281. [Google Scholar] [CrossRef]
- Liu, Z.H.; Wei, D.L.; Ji, M.T.; Fang, H.; Zhou, H. Combustion instability of ethanol and n-heptane fuels under different combustor geometries. J. Energy Inst. 2022, 102, 206–215. [Google Scholar] [CrossRef]
- Poinsot, T. Prediction and control of combustion instabilities in real engines. Proc. Combust. Inst. 2017, 36, 1–28. [Google Scholar] [CrossRef]
- Zhou, H.; Liu, Z.H.; Tao, C.F.; Zhou, M.X. Passive suppression of self-excited combustion instabilities in liquid spray flame using micro-perforated plate. J. Eng. Gas Turbines Power 2020, 142, 111013. [Google Scholar] [CrossRef]
- Liu, Z.H.; Zhou, H.; Wei, D.L.; Hao, F. Experimental research on using CO2-Ar microjets to control liquid fuel combustion instability and pollutant emission. J. Energy Inst. 2021, 98, 346–353. [Google Scholar] [CrossRef]
- Zhou, H.; Liu, Z.H.; Tao, C.F.; Zhou, M.X. Mitigating self-excited thermoacoustic oscillations in a liquid fuel combustor using dual perforated plates. J. Acoust. Soc. Am. 2020, 148, 1756–1766. [Google Scholar] [CrossRef]
- Liu, Z.H.; Zhou, H.; Fang, H.; Tao, C.F. Suppression of combustion instabilities of swirled non-premixed liquid-fuel flame with CO2-O2 jet in cross-flow. J. Energy Inst. 2021, 95, 69–76. [Google Scholar] [CrossRef]
- Kheirkhah, S.; Cirtwill, J.D.; Saini, P.; Venkatesan, K.; Steinberg, A.M. Dynamics and mechanisms of pressure, heat release rate, and fuel spray coupling during intermittent thermoacoustic oscillations in a model aeronautical combustor at elevated pressure. Combust. Flame 2017, 185, 319–334. [Google Scholar] [CrossRef]
- Liang, X.; Yang, L.; Wang, G.; Li, J. Hopf Bifurcation Analysis of the Combustion Instability in a Liquid Rocket Engine. Aerospace 2022, 9, 593. [Google Scholar] [CrossRef]
- Son, M.; Börner, M.; Armbruster, W.; Hardi, J.S. Orifice Flow Dynamics in a Rocket Injector as an Excitation Source of Injector-Driven Combustion Instabilities. Aerospace 2023, 10, 452. [Google Scholar] [CrossRef]
- Bao, J.; Ji, C.; Pan, D.; Zong, C.; Zhang, Z.; Zhu, T. Investigation of Harmonic Response in Non-Premixed Swirling Combustion to Low-Frequency Acoustic Excitations. Aerospace 2023, 10, 812. [Google Scholar] [CrossRef]
- Jeong, S.M.; Han, H.S.; Sung, B.K.; Kim, W.; Choi, J.Y. Reactive Flow Dynamics of Low-Frequency Instability in a Scramjet Combustor. Aerospace 2023, 10, 932. [Google Scholar] [CrossRef]
- Tian, X.M.; Yang, J.B.; Gong, Y.; Guo, Q.H.; Ding, L.; Yu, G.S. Study on structure oscillation characteristics in impinging zone of multiple diesel jet flames based on Dynamic Mode Decomposition. Chem. Eng. Sci. 2023, 282, 119287. [Google Scholar] [CrossRef]
- Rao, Z.M.; Li, R.C.; Zhang, B.; Wang, B.; Zhao, D.; Akhtar, M.S. Experimental investigations of equivalence ratio effect on nonlinear dynamics features in premixed swirlstabilized combustor. Aero Sci. Technol. 2021, 112, 106601. [Google Scholar] [CrossRef]
- Yi, T.X.; Santavicca, D.A. Combustion instability and flame structure of turbulent swirl-stabilized liquid-fueled combustion. J. Propul. Power 2012, 28, 1000–1014. [Google Scholar] [CrossRef]
- Semlitsch, B.; Orchini, A.; Dowling, A.P.; Juniper, M.P. G-equation modelling of thermoacoustic oscillations of partially premixed flames. Int. J. Spray Combust. 2017, 9, 260–276. [Google Scholar] [CrossRef]
- Prieur, K.; Durox, D.; Schuller, T.; Candel, S. A hysteresis phenomenon leading to spinning or standing azimuthal instabilities in an annular combustor. Combust. Flame 2017, 175, 283–291. [Google Scholar] [CrossRef]
- Lee, J.G.; Kim, K.; Santavicca, D.A. Measurement of equivalence ratio fluctuation and its effect on heat release during unstable combustion. Proc. Combust. Inst. 2000, 28, 415–421. [Google Scholar] [CrossRef]
- Sun, Y.Z.; Rao, M.Z.; Zhao, D.; Wang, B.; Sun, D.K.; Sun, X.F. Characterizing nonlinear dynamic features of self-sustained thermoacoustic oscillations in a premixed swirling combustor. Appl. Energy 2020, 264, 114698. [Google Scholar] [CrossRef]
- Zhang, X.T.; Geng, C.; Ming, Z.Y.; Liu, H.F.; Cui, Y.Q.; Jin, C.; Liu, L. Optical characterization of ethanol spray flame on a constant volume combustion chamber. Fuel Process. Technol. 2023, 250, 107928. [Google Scholar] [CrossRef]
- Ruan, C.; Chen, F.E.; Yu, T.; Cai, W.W.; Mao, Y.B.; Qian, Y.; Li, X.L.; Lu, X.C. Experimental study on combustion stability characteristics in liquid-fueled gas turbine model combustor: Fuel sensitivities and flame/flow dynamics. Fuel 2020, 265, 116973. [Google Scholar] [CrossRef]
- Soundararajan, P.R.; Durox, D.; Renaud, A.; Candel, S. Impact of spray dynamics on combustion instabilities investigated by changing the atomizer recess in a swirl combustor. Combust. Flame 2023, 252, 112757. [Google Scholar] [CrossRef]
- Pillai, A.L.; Nagao, J.; Awane, R.; Kurose, R. Influences of liquid fuel atomization and flow rate fluctuations on spray combustion instabilities in a backward-facing step combustor. Combust. Flame 2020, 220, 337–356. [Google Scholar] [CrossRef]
- Ahn, B.; Lee, J.; Jung, S.; Kim, K.T. Low-frequency combustion instabilities of an airblast swirl injector in a liquid-fuel combustor. Combust. Flame. 2018, 196, 424–438. [Google Scholar] [CrossRef]
- Liu, Y.Z.; Liu, P.J.; Wang, Z.P.; Ao, W.; Xu, G.Y.; Guan, Y. Numerical investigation of combustion instability in a liquid rocket engine: Interaction effect between hydrodynamics and acoustic mode. Aerosp. Sci. Technol. 2023, 143, 108711. [Google Scholar] [CrossRef]
- Wang, X.Y.; Han, M.; Han, X.; Zhang, C.; Sung, C.J. Flame structures and thermoacoustic instabilities of centrally-staged swirl flames operating in different partially-premixed modes. Energy 2021, 236, 121512. [Google Scholar] [CrossRef]
- Wang, X.Y.; Han, X.; Sung, C.J. Transitions of thermoacoustic modes and flame dynamics in a centrally-staged swirl combustor. Energy 2023, 263, 125813. [Google Scholar] [CrossRef]
- Xue, S.J.; Hong, L.; Liu, H.J.; Chen, H.Y. Flame stabilization of liquid oxygen/kerosene bi-swirl injector at elevated pressure. Combust. Flame 2022, 244, 112215. [Google Scholar] [CrossRef]
- Ren, Y.J.; Guo, K.K.; Feng, S.J.; Tong, Y.H.; Lin, W.; Nie, W.S. Experimental and numerical investigation of transverse combustion instability in a rectangle multi-injector rocket combustor. Acta Astronaut. 2023, 213, 215–230. [Google Scholar] [CrossRef]
- Tao, C.; Zhang, C.; Xue, X.; Fan, X.Z.; Gao, J.T.; Feng, X.X.; Gao, X.Z. Flame dynamics and combustion instability induced by flow-flame interactions in a centrally-staged combustor. Aerosp. Sci. Technol. 2023, 142, 108635. [Google Scholar] [CrossRef]
- Hidegh, G.T.; Pizág, B.; Urbin, Á.; Rácz, E.; Józsa, V. Flame emission spectroscopy analysis of distributed liquid fuel combustion. Fuel 2023, 353, 129193. [Google Scholar] [CrossRef]
- Jia, B.Q.; Fu, Q.F.; Xu, X.L.; Yang, J.; Zhang, D.W.; Wang, T.H.; Wang, Q. Spray characteristics of Al-nanoparticle-containing nanofluid fuel in a self-excited oscillation injector. Fuel 2021, 290, 120057. [Google Scholar] [CrossRef]
- Chong, C.T.; Hochgreb, S. Spray flame structure of rapeseed biodiesel and Jet-A1 fuel. Fuel 2014, 115, 551–558. [Google Scholar] [CrossRef]
- Kumar, M.; Karmakar, S.; Nimesh, V. Statistical investigation of combustion and emission characteristics of biofuels according to their physical properties: A way to explore suitable alternative fuels. Fuel 2024, 358, 130242. [Google Scholar] [CrossRef]
- Chen, Z.X.; Swaminathan, N. Influence of fuel plenum on thermoacoustic oscillations inside a swirl combustor. Fuel 2020, 275, 117868. [Google Scholar] [CrossRef]
- Liu, Y.; Rao, D.W.; Wang, E.Q.; Ma, H.G.; Zheng, W.L.; Zeng, W. An experimental study on the instability of RP-3 aviation kerosene/air premixed flame. Fuel 2023, 332, 126038. [Google Scholar] [CrossRef]
Disclaimer/Publisher’s Note: The statements, opinions and data contained in all publications are solely those of the individual author(s) and contributor(s) and not of MDPI and/or the editor(s). MDPI and/or the editor(s) disclaim responsibility for any injury to people or property resulting from any ideas, methods, instructions or products referred to in the content. |
© 2024 by the authors. Licensee MDPI, Basel, Switzerland. This article is an open access article distributed under the terms and conditions of the Creative Commons Attribution (CC BY) license (https://creativecommons.org/licenses/by/4.0/).