1. Introduction
With the rapid development of air transport liberalization, the full-service carrier industry plays an increasingly significant role in facilitating international trade affairs. To adjust the business model and improve competitiveness in the global aviation market, the investigation of air transport network structures is one prominent factor in carrier operation and management that fits sustainable scopes in the future transportation system [
1,
2]. For full-service carriers, exploring the network structure is conducive to understanding the air transportation system at the network layer [
3]. Performing research on the changes in network structure topological metrics of full-service carriers with long-term empirical data is critical to providing theoretical support when drafting network strategic plans, as well as optimizing carriers’ network structures to increase profits potentially [
4].
An air transport network is a complex system in which the relationships between airports and routes are intricate, changeable, and perplexing, and it demands a specialized network analysis method to research [
5]. With unique features of implication regularities in network structures with ambiguous network boundaries benefited from graph theory and sociology, social network analysis (SNA) is widely used in assessing network relationships and evolution with scenarios like sociology, anthropology, business, and management disciplines [
6,
7].
In SNA, relations among units are represented with edges and networks composed of nodes, also named as actors [
8]. SNA network structures can be categorized into three types in accordance with network topology forms, and these are ego-networks, partial networks, and whole networks [
9]. In air transport networks, the ego-network type is typically applied, with specific components consisting of airports, adjacent airports, and routes between airports and adjacent airports. Researching the ego-network and the whole network is instrumental in exploring air transport network structures from the micro and macro perspectives. SNA can efficiently process network data with large-scale and complex connectivity relationships and identify critical nodes in the network. Hence, this paper utilizes social network analysis (SNA) to analyze the networks of large-scale airlines and understand the role and importance of each airport in the different airline networks.
With the purposes of investigating full-service carrier industry development for enhancing sustainability in terms of network structural evolution, this paper analyzes air transport networks over the global top 10 full-service carriers, and uses the static metrics from local to path-based and dynamic metrics to explore the overall network evolution trend, critical airport competitiveness, robustness, and similarity for full-service carriers over the years 2011–2019 and the similarity metric using ACF from 2007 to 2022 to explore network similarities.
The remainder of the paper is organized as follows.
Section 2 reviews the most relevant papers considering air transport network structures. The construction of air transport networks, and a series of metrics of the SNA method and similarity metric using ACF are proposed in
Section 3.
Section 4 analyzes the structure and evolution characteristics of full-service carriers. Finally, the results are concluded in
Section 5.
2. Literature Review
With the continuous popularization of complex network theory and graph theory, the research on air transport network structures has attracted much attention. Guimera et al. [
10] first explored the worldwide air transport network structure through complex network theory and found that the network exhibits scale-free and small-world properties. Since then, numerous scholars have researched the topological structure of the air transport network for a certain region or carrier. Guida and Maria [
11] investigated the structure and topological characteristics of the air transport network in Italia. Grubesic et al. [
12] studied the global air transport network between 4650 airports in 2006 through graph theory. Wang et al. [
13] analyzed the structure and node centrality of China’s air transport network. Min and Taeyeo [
14] researched the characteristics of an air transport network composed of three alliance carriers through the SNA method. Kim and Yoon [
15] explored three kinds of air route segment network structures in Northeast Asia: unweighted, distance-weighted, and demand-weighted. Bombelli et al. [
16] investigated the topological structure of the worldwide cargo air transport network using complex network theory. However, those above studies analyzed the network topological characteristics for only a short time, and therefore cannot reflect the long-term evolvement trend of network structures.
To investigate the air transport network structural evolution for long-term analysis, spatial structure organizations and formulations have been widely investigated. For instance, Burghouwt et al. [
17] studied the spatial structure evolution of European air transport networks from 1990 to 1999. Papatheodorou and Arvanitis [
18] investigated the air transport network topological characteristics in Greece during the years 1978–2006. Jimenez et al. [
19] analyzed the air transport network structure in Portugal over the period 2001–2010. Jiang et al. [
20] researched the evolution of Spring Airlines’ domestic air transport network from 2005 to 2013 using mathematical statistics and social network analysis. Dai et al. [
21] explored the topology evolution of the Southeast Asian air transport network over the period 1979–2012. Chung et al. [
22] studied the structural characteristics of the Asian international air transport network in 2014 and 2018 using the weighted network method. However, those above works only consider the structure towards a single network within a limited range of region, and therefore cannot compare the characteristics among multiple same-type air transport networks.
To obtain the similarities and differences between the same-type network structure characteristics, many scholars have concentrated on comparing air transport networks among differing carriers, airports, or regions. Han et al. [
4] compared the air transport networks of four carriers: Austrian Airlines, British Airways, France Netherlands Airline, and Lufthansa. Reynolds [
23] studied the structure characteristics of North American and European carrier air transport networks. Nedvědová [
24] researched the differences between the major airport networks in 19 countries in Central and Eastern Europe. Wandelt and Sun [
25] investigated the evolution of domestic air transport networks in seven countries in Europe. Suau-Sanchez et al. [
26] explored the differences between the London Heathrow airport network and South East airport networks in 2013. Wu et al. [
27] compared the network community structure of American Airlines and Southwest Airlines using an improved Clauset–Newman–Moore (CNM) algorithm. Morlotti and Redondi [
28] analyzed the air transport networks of four major cargo carriers in Europe: DHL, FedEx, UPS, and TNT. However, those above works rarely involve the comparison of full-service carrier air transport networks from the perspectives of network evolution.
Table 1 summarizes the literature in terms of network type, network weight, and topological metrics. Most studies concentrated on regional networks such as a certain country or continent, whilst the research on carrier networks lacked investigation. In addition, most studies focused on unweighted air transport network structures, whereas actual networks are weighted because different numbers of flights in airports and routes represent different network structures. Moreover, most studies applied static metrics in network evolution analysis, whilst only a few studies combined static metrics and dynamic metrics such as robustness in the research.
Considering the shortcomings above, the contributions of this paper are highlighted as follows. (1) This paper explores full-service carriers’ air transport networks, which facilitates providing reference for the optimizing and planning of full-service carriers’ network structures. (2) This paper explores the weighted air transport networks with weighted metrics such as weighted triangle betweenness centrality, weighted closeness centrality, and weighted eigenvector centrality. (3) This paper uses the static metrics from local to path-based combined with dynamic robustness analysis through the cascading failure model to extract structure characteristics, combining the static metrics and dynamic metrics at the same time. (4) This paper researches the development trend of closed, structural symmetry and two-way transitivity of airline network structures using a new topological metric-directed triad. (5) This paper studies the competitive power of airports in carrier competition from the perspective of redundancy and constraint of the airports’ ego-networks through the structural hole for the first time.
3. Network Modeling and Performance Evaluation Methodology
Regarding the airport as a node, the route as a directed edge, and the number of flights of the route as the edge weight, the weighted directed air transport network
is constructed, where
represents the set of nodes,
represents the set of edges,
represents the edge from node
to node
, and
represents the number of nodes. The element
in adjacency matrix
of the network is as follows:
where
represents the edge weight from node
to node
, and
represents the number of flights from node
to node
. In air transport networks, using the number of flights can effectively reflect actual passenger traffic among airports beyond simple connections rather than using 0 or 1.
SNA is a network analysis method that can be used for evaluating the interactive relationships and patterns among different airports in air transport networks through a series of metrics [
29]. To explore the network structure comprehensively, the metrics of SNA used in this paper include 2 types: static metrics and dynamic metrics. Static metrics include directed triad, structural hole, and centrality metrics, which are from local to path-based and profitable for static structure analysis from micro to macro. Dynamic metrics include robustness and similarity, which are conducive to exploring the dynamic characteristics of the network.
3.1. Directed Triad
To explore the overall network structure from a micro perspective, this paper introduces the directed triad, which is a local metric considering the relationship of 3 nodes. It was proposed by Wasserman and Faust [
30], and contains 16 kinds of triangular structures composed of 3 nodes and the directed connections between nodes. The directed triad embeds the multi relationship between “node-self”, “adjacent nodes”, and “other nodes” into the social network, which reflects the tightness, symmetry, and transitivity of the network [
31].
The structure and classification of 16 directed triads are shown in
Figure 1 and
Table 2. In directed networks, on the basis of the number of connections, triads can be divided into 4 categories: independent triad, connected-pair triad, structural hole triad, and tight triad [
32]. For each category, the triads can be further subdivided in terms of the direction of connections.
In air transport networks, the connection relationship between airports and the development trend of air transport networks can be evaluated by exploring distinct types of directed triads [
25]. The independent triad cannot provide the function of transporting passengers. The connected-pair triad can only distribute the passenger flow between two airports and cannot transfer the passengers. The structural hole triad can distribute and transfer the passengers. In the tight triad, every two airports are connected by airlines, which is conducive to the directness, transfer and stopover of flights.
3.2. Structural Hole
As the directed triad considers any three nodes in the network, and ignores the relationship between the node and its adjacent nodes, it is only applicable to the overall network analysis. Therefore, this paper introduces the structural hole, which is a local metric considering adjacent nodes and can be applied to node analysis. The structural hole was first proposed by Burt [
33] as a common algorithm for measuring the competitive advantage of nodes, and it is widely applied in numerous studies, including knowledge, geography, cooperation, and so on [
34,
35,
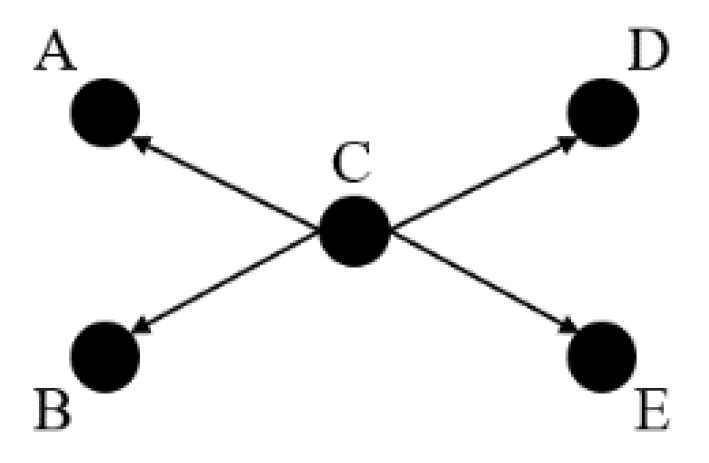
36]. In the network composed of 5 nodes in
Figure 2, nodes A and B can contact nodes D and E only by passing through node C, indicating that the connections between node C and other nodes belong to non-redundant connections; therefore, the network constitutes a structural hole. Node C with the most favorable position in the structural hole is called “middle-man” [
37]. In air transport networks, the airport that occupies the position of “middle-man” in the structural hole plays a significant transfer role as a hub airport [
38].
The metrics of a structural hole include effective size and constraint [
33]. The node’s effective size refers to the remaining size of the node’s degree minus the redundancy, which represents the number of non-redundant connections of the node [
39]. The node’s redundancy is numerically equal to the average degree of the node’s ego-network. For node
, the formula of effective size is:
where
represents the degree of node
, which is equal to the edge number of node
,
represents the number of adjacent nodes of node
, and
represents the
j-th adjacent node
’s degree in node
’s ego-network.
For an airport, numerous redundant connections may put the airport at a disadvantageous position in terms of airport competition.
The constraint of a node refers to the extent to which the node is limited by the adjacent nodes, indicating the ability of the node to control the structural hole in the ego-network [
40]. For node
, the formula of constraint is:
where
represents the number of the common adjacent nodes of node
and node
, and
represents the degree of node
which is the q-th common adjacent node of node
and node
.
In air transport networks, the airport with low constrain holds a higher status in the structural hole and has more superiority in terms of airport competition.
3.3. Centrality Metrics
As the above 2 are local metrics, the network structure cannot be explored from an overall perspective. In fact, some local nodes showing less significance may play an immense role in the overall network. Therefore, this paper introduces path-based metrics—centrality metrics, which are conducive to the analysis of nodes from an overall perspective. Three kinds of centrality metrics are introduced in this section: weighted triangle betweenness centrality, weighted closeness centrality, and weighted eigenvector centrality. The usual centrality metrics show drawbacks of neglecting the strength of connections between nodes, and the assessment results of node importance may be inaccurate. Hereby, this paper adopts weighted centrality metrics to improve the accuracy of the node importance assessment results, which can better reflect the structural characteristics of the weighted air transport network.
3.3.1. Weighted Triangle Betweenness Centrality
Lee [
41] first proposed the weighted triangle betweenness centrality,
in 2013, which is applied to evaluate the ability of a node as a mediator in the weighted network by computing the number of times the node plays the intermediary role between other nodes. For node
,
is expressed as:
In air transport networks, the airport with high weighted triangle betweenness centrality plays a central and transfer role and is highly likely to become hub airport that has a high level of passenger connections and transfers [
22,
23].
3.3.2. Weighted Closeness Centrality
Weighted closeness centrality,
was first proposed by Freeman [
42], and considers the reciprocal of the sum of weighted shortest path length between the node and other nodes [
7]. The difference between edge and path is that the former is used to describe the connection of 2 directly connected nodes, while the latter is composed of several edges and can be used for the connection of 2 nodes not directly connected.
For 2 nodes,
and
, assuming that there are m paths from node
to node
, and
represents the nodes in the p-th path, then the weighted path length,
is:
Using
to represent the set of the weighted path length of all paths from node
to node
, the weighted closeness centrality,
can be expressed as [
42]:
where
represents the weighted shortest path length from node
to node
, which is equal to the minimum value of all the weighted path lengths.
For an airport,
reflects the closeness between the airport and other airports, and, the larger the
, the more convenient it is to reach other airports [
13].
3.3.3. Weighted Eigenvector Centrality
Bonacich [
43] first proposed the weighted eigenvector centrality,
in 1972, and the basic idea is that a node connected to the node with high connectivity should be more central than that connected to the node with low connectivity, which fully captures the number and importance of adjacent nodes. The formula of
is:
where
represents the i-th eigenvalue of adjacency matrix
, and
represents the corresponding eigenvector of
. In the air transport network,
reveals the importance of airports from the perspective of the number of flights and the adjacent airports’ connectivity.
3.4. Robustness Metric
To judge the resilience of air transport networks against an attack environment, this paper applied robustness metrics for analyzing the characteristics of the network structure of different full-service carriers under random attack and deliberate attack.
The cascading failure model considers the dynamic robustness of a series of adjacent nodes failures caused by the failure of a node in the network, which is more scientific and comprehensive [
44]. Therefore, the cascading failure model is used in this paper for robustness analysis, and it is mainly composed of four parts: initial load and capacity, node state identification, load distribution model, and cascading failure metric [
44].
For each node in the cascading failure model, this paper uses the airport flight volume as the initial load and the nonlinear function of the initial load as the capacity. The formula for initial load and capacity is:
where
represents the initial load of node
.
If the load of a node exceeds its capacity, the node will transition into a failure state. At time
, the formula of state identification for node
is:
where
represents the load of node
at time
,
represents the capacity of node
, and
represents the nonlinear parameters.
In the load distribution model, if node
is in a failure state at time
, the load of node
is allocated to all the adjacent nodes of node
in a certain proportion, and the load allocation formula is:
where
represents the load allocated by the j-th adjacent node of node
at time
.
The cascading failure metric used in the model in this paper is network efficiency. For node
, the formula of network efficiency,
is:
In the air transport network, the higher the network efficiency is, the stronger is the robustness of the network.
3.5. Similarity Metric
To measure the similarity between air transport networks over time, we utilize an autocorrelation function (ACF) for a given carrier from [
45]:
where
is the time lag and
is the normalized network distance between two snapshot networks. The normalized network distance between two snapshot networks,
and
is:
where
and
are the numbers of edges in
and
respectively, and
is the number of edges that
and
have in common. Network distance
ranges between 0 and 1, measuring the similarity between two networks. The distance matrix for a carrier is a
×
symmetric matrix of which the
th entry is given by
, where
is the network at year
and
is the number of years observed. If
is small, where
, it indicates that the network at year
approximately recurs to that at year
.
We identify states of the temporal air transport networks for each carrier based on its distance matrix. Consider a sequence of
static networks. To assign a state to each snapshot network, we apply a hierarchical clustering algorithm to the
×
distance matrix. Hierarchical clustering divides the yearly networks into
discrete states, where the number of states,
, ranges between 1 and
. We adopt the value of
(
) that maximizes the Dunn’s index,
, defined by [
46]:
The numerator on the right-hand side of Equation (17) represents the smallest distance between two states among all the pairs of states. The denominator represents the largest diameter of the state among all the states.
3.6. K-Shell Decomposition
K-shell decomposition refers to calculating the k-shell value of each node according to certain rules, then dividing the types of nodes into core layer nodes, bridge layer nodes, and peripheral layer nodes according to different k-shell values of each node [
47]. K-shell decomposition is computationally efficient for analyzing large-scale networks. The networks of the airlines analyzed in this paper are large-scale networks, so this paper uses K-shell decomposition for airport classifications to select critical airports for network centrality analysis in
Section 4.4.
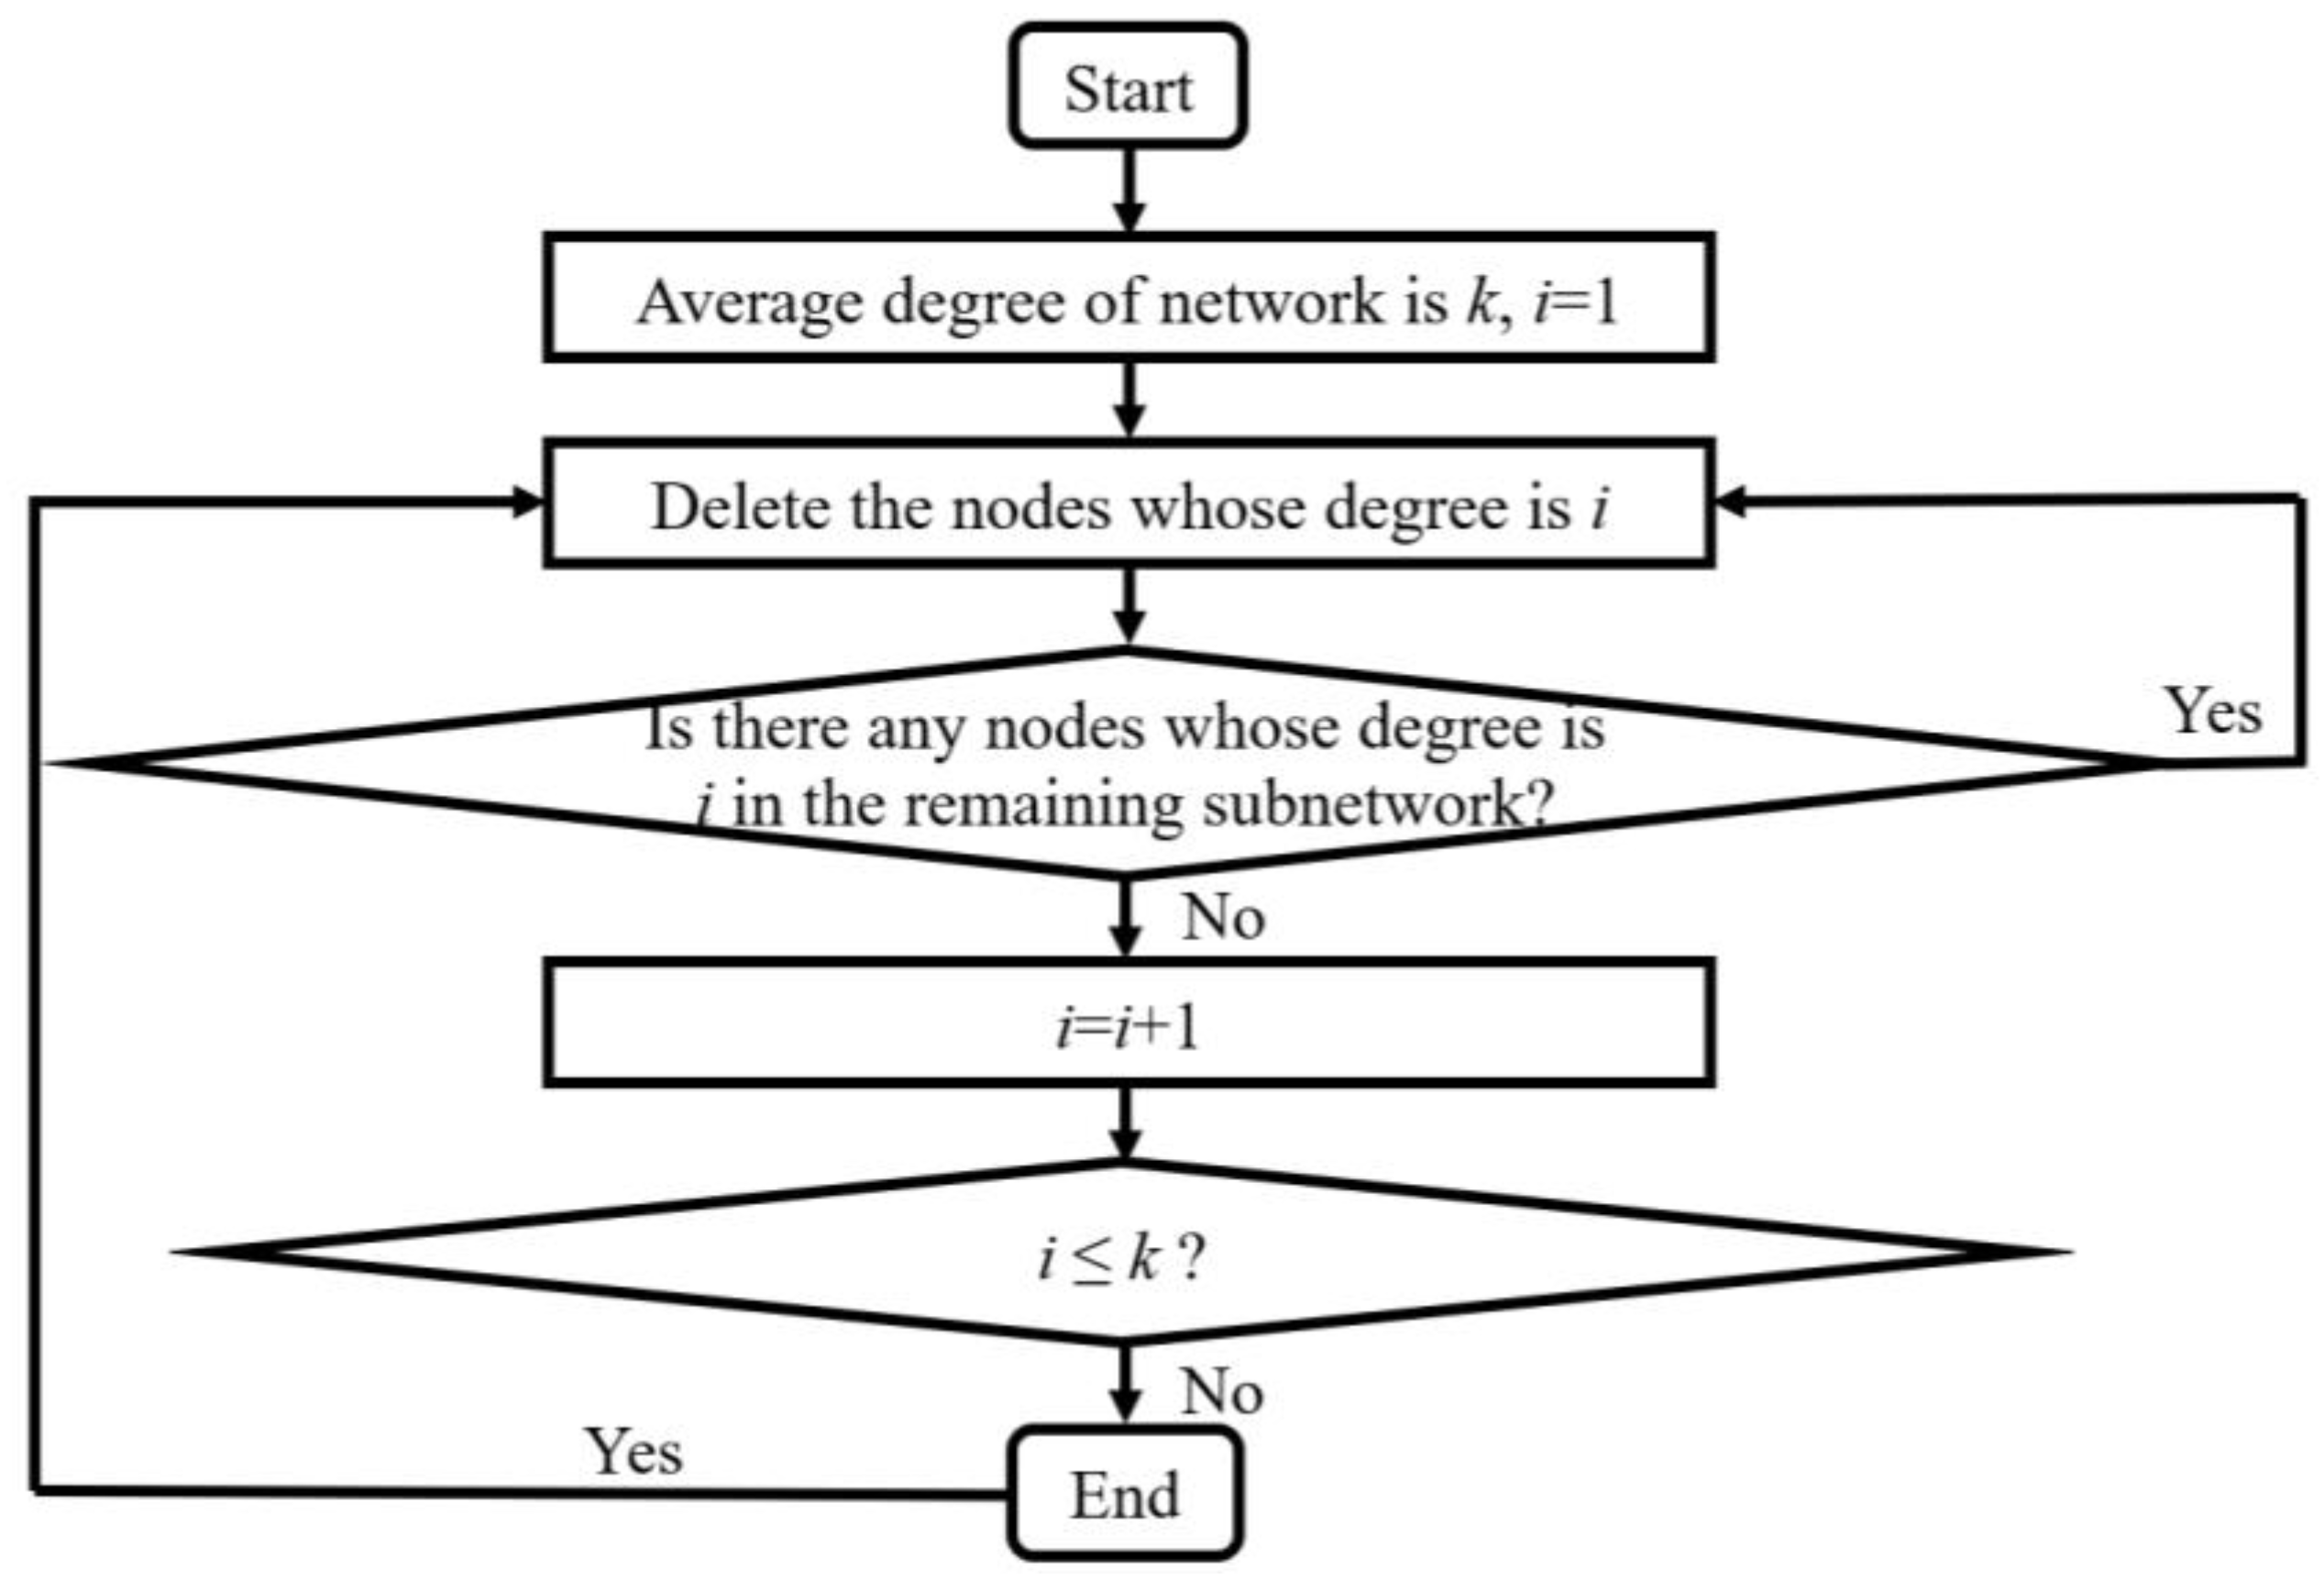
The basic steps of K-shell decomposition are shown in
Figure 3. The basic idea is to find the largest subnetwork in which the degree of each node is k. The nodes included in the k-th layer are those whose degree is k and deleted from the initial network and each subnetwork [
47].
Through K-shell decomposition in air transport networks, important critical airports and low connectivity airports can be divided. In k-th layer, the degree for each airport is at least k, and the value k is assigned to the layer as the k-shell value. The layer with the maximum k-shell value is called the core layer, the layer with the minimum k-shell value is called the peripheral layer, and the other layers are called bridge layers. The airports in the core layer are recognized as critical airports, and are used for network centrality analysis in
Section 4.4.
4. Network Analysis with Long-Term Empirical Data
This section analyzes the evolution of 10 full-service carriers’ network structures from the perspective of static and dynamic characteristics. In terms of static characteristics, the network scale is analyzed first, and then the metrics from local to path-based containing the directional triad, structural hole, and centrality metrics are analyzed, which facilitates researching the evolution of networks systematically. In terms of dynamic characteristics, the robustness and similarity are analyzed.
The data used in this paper including continents, names, and codes of 10 full-service carriers are shown in
Table 3. The flight information including departure airport code, arrival airport code, number of stops, flight frequency, and year from 2007 to 2022 is collected from the Official Airline Guide (OAG). This paper uses all the airports and routes for each full-service carrier in the analysis. The detailed discussion of the OAG data structure can be referred to in the OAG [
48].
4.1. Network Scalability Analysis
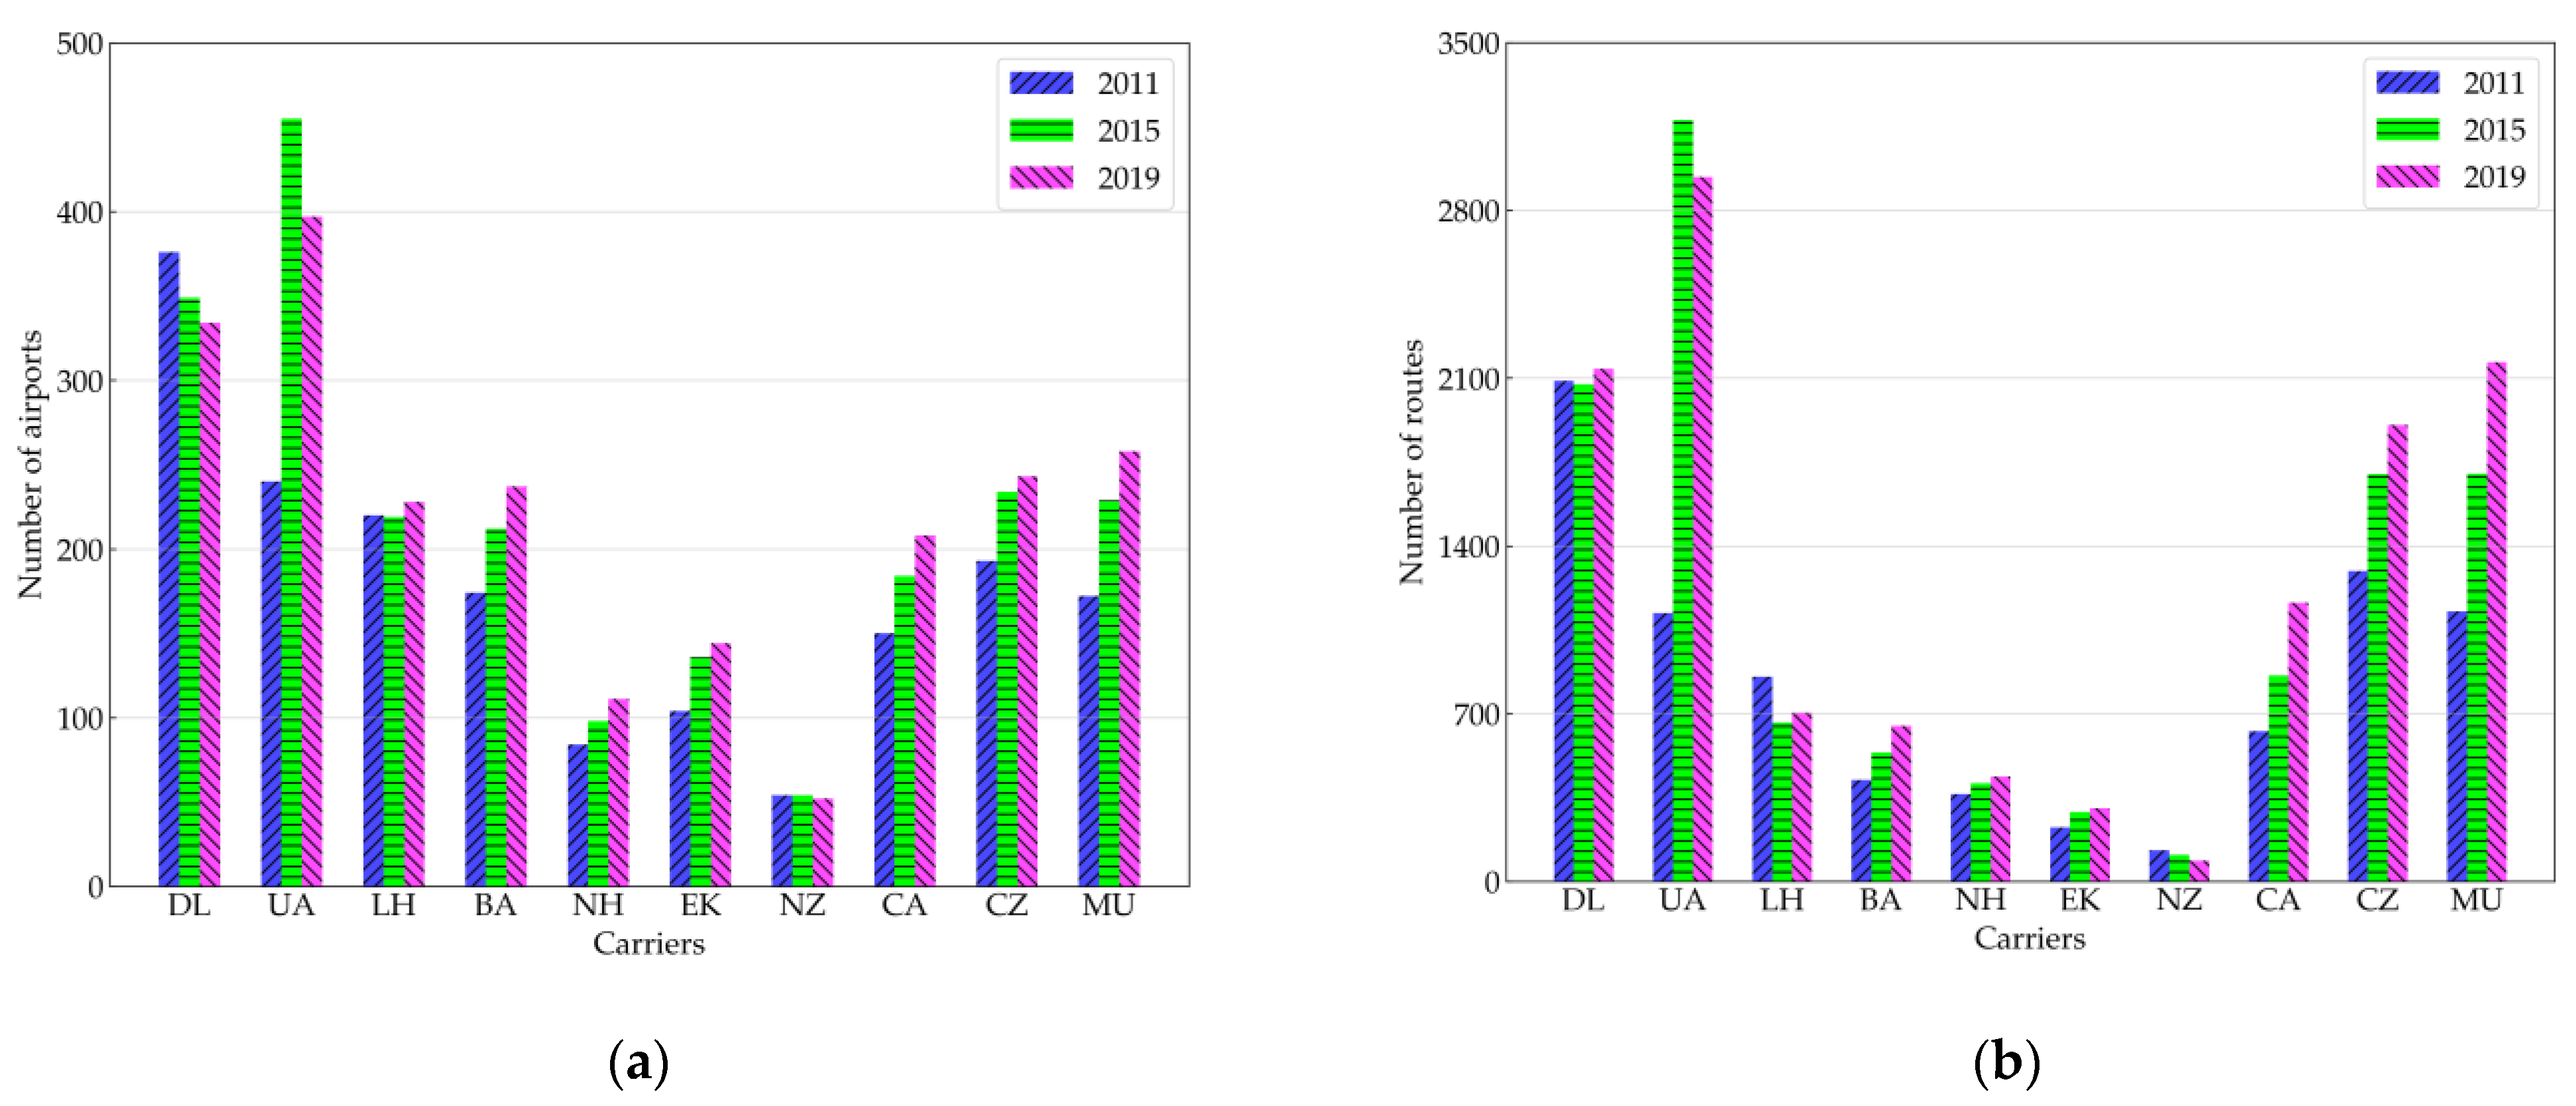
To investigate the evolution of the scale of air transport networks from the macro level, statistics are used to analyze the evolution of the number of airports and routes in each airline’s network, which lays the foundation for analyzing the evolution of air transport network structures. The number of airports and routes from 2011 to 2019 among 10 full-service carriers is depicted in
Figure 4. Among 10 full-service carriers, due to the disparity in geographical territorial areas, the network scales of Delta Air Lines and United Airlines are the largest, while those of All Nippon Airways and Air New Zealand are the smallest. Over the 9 years, the number of airports and routes of Delta Air Lines showed a stable increment trend, while those of Lufthansa and Air New Zealand gradually decreased. The network scale of other carriers expanded, among which the growth speed in United Airlines was the fastest during 2011~2015, and yet the speed during 2015~2019 slowed down, and other carriers had relatively stable growth over the period 2011~2019. The evolution indicates that the networks of mega-scale carriers gradually tend to mature, and thus the growth speed becomes slower and remains stable, while small-scale and medium-scale carriers consistently expand their networks at a stable speed, except for several shrunk carriers.
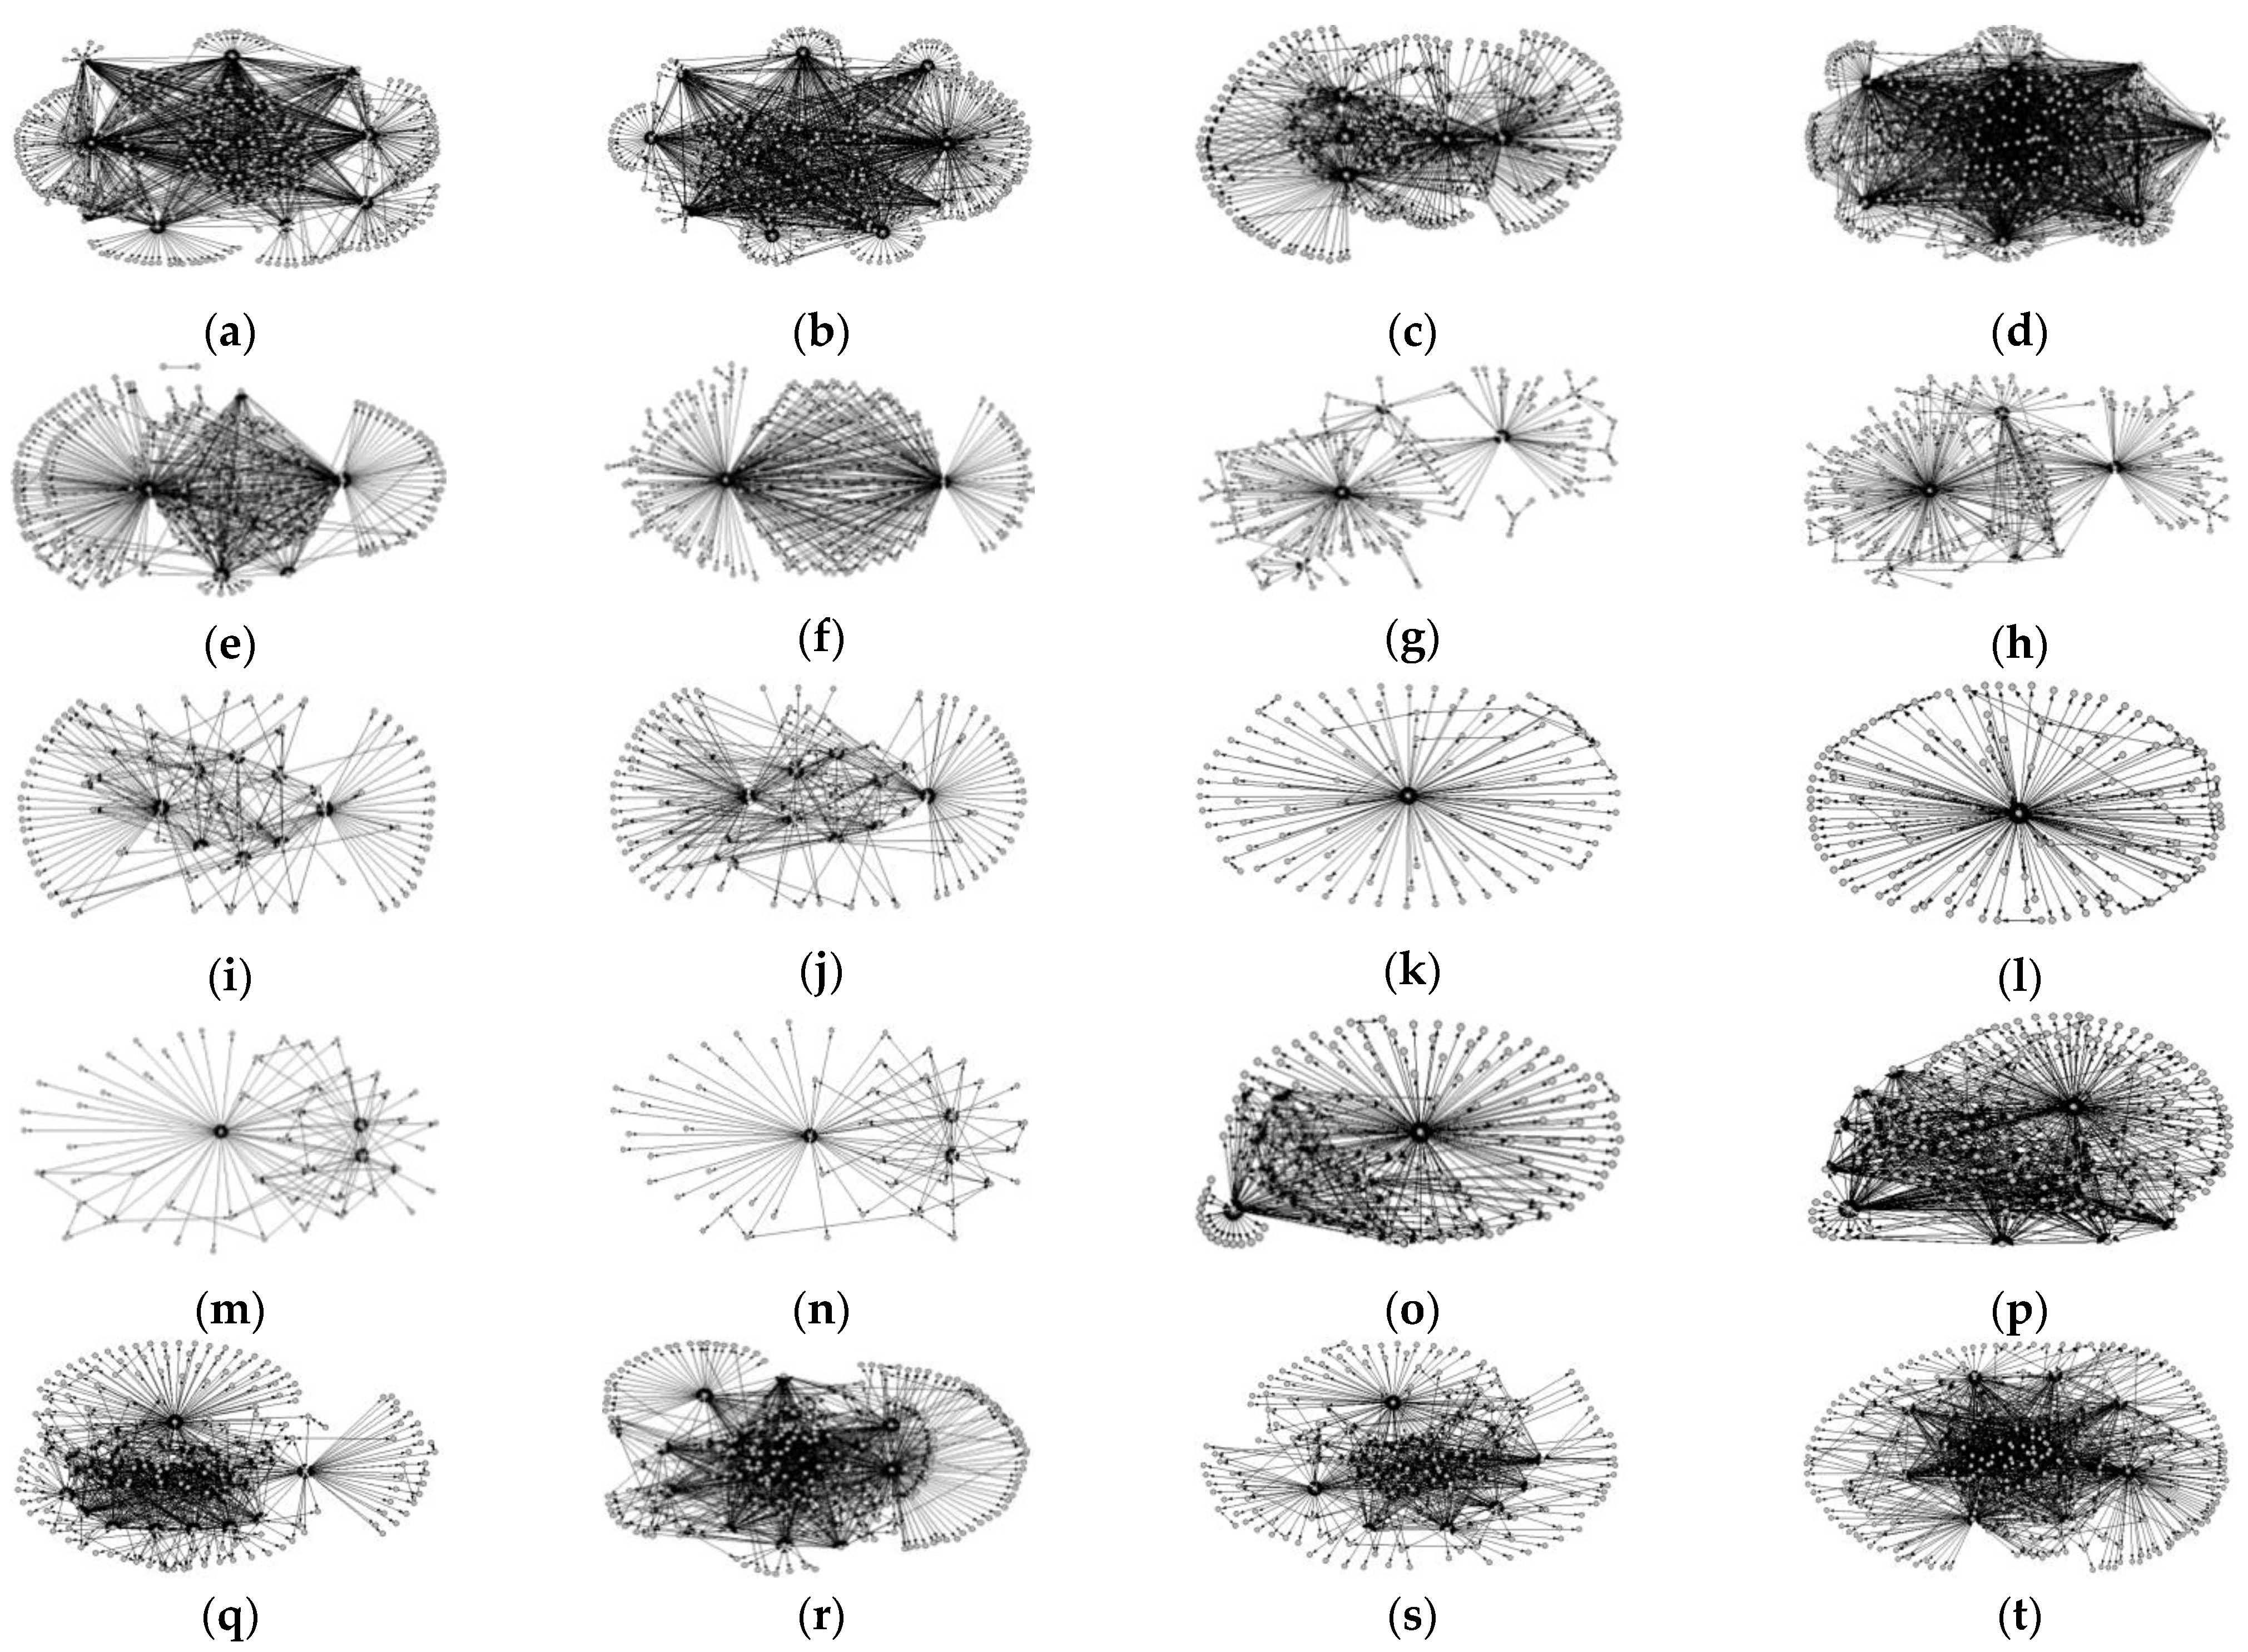
For intuitive observation of network structures, the structure diagrams of 10 full-service carriers in 2011 and 2019 are drawn by network drawing software “PAJEK 5.16”, as shown in
Figure 5. In the structure diagrams, the nodes represent airports, and the connections represent the routes between airports. It can be seen that the air transport networks of Delta Air Lines and United Airlines are hub-and-spoke structures with multiple hubs, whose hub airports are evenly distributed in the whole network. These carriers focus on vigorously developing international routes through international hub airports. The networks of full-service carriers in Europe, Asia, and Oceania are usually hub-and-spoke structures with a single hub or twin hubs. These carriers usually select one or two airports as hub airports in the networks, and the networks are sparsely structured. The conclusion of network structure types among carriers is similar to Reynolds [
23], where the basic geographical characteristics of North American and European air transport networks were further analyzed.
From 2011 to 2019, the hub-and-spoke network with multiple hubs for Delta Air Lines became more compact, whilst the network scale and the number of hub airports remained relatively stable. United Airlines has evolved more significantly than others during the past 9 years in terms of improvement in the network scale and the number of hub airports, as well as a denser network structure. The network scale of British Airways, All Nippon Airways, Emirates, and China’s three full-service carriers has also improved noticeably, along with more complex hub-and-spoke structure formations. However, as a large carrier in Europe, Lufthansa has gradually concentrated its flights on two airports, i.e., Frankfurt and Munich, in recent years, leading to a hub-and-spoke network structure change from multiple hubs into a twin hubs type. The network scale of Air New Zealand has gradually reduced in the past 9 years, and the hub-and-spoke structure has become looser than in previous years.
4.2. Network Development Trend Analysis
The above analysis explores the overall network structure from a macro perspective, which ignores the microcosmic angle. Therefore, this section uses the local metric-directed triad to analyze the overall air transport networks from the microstructure point of view.
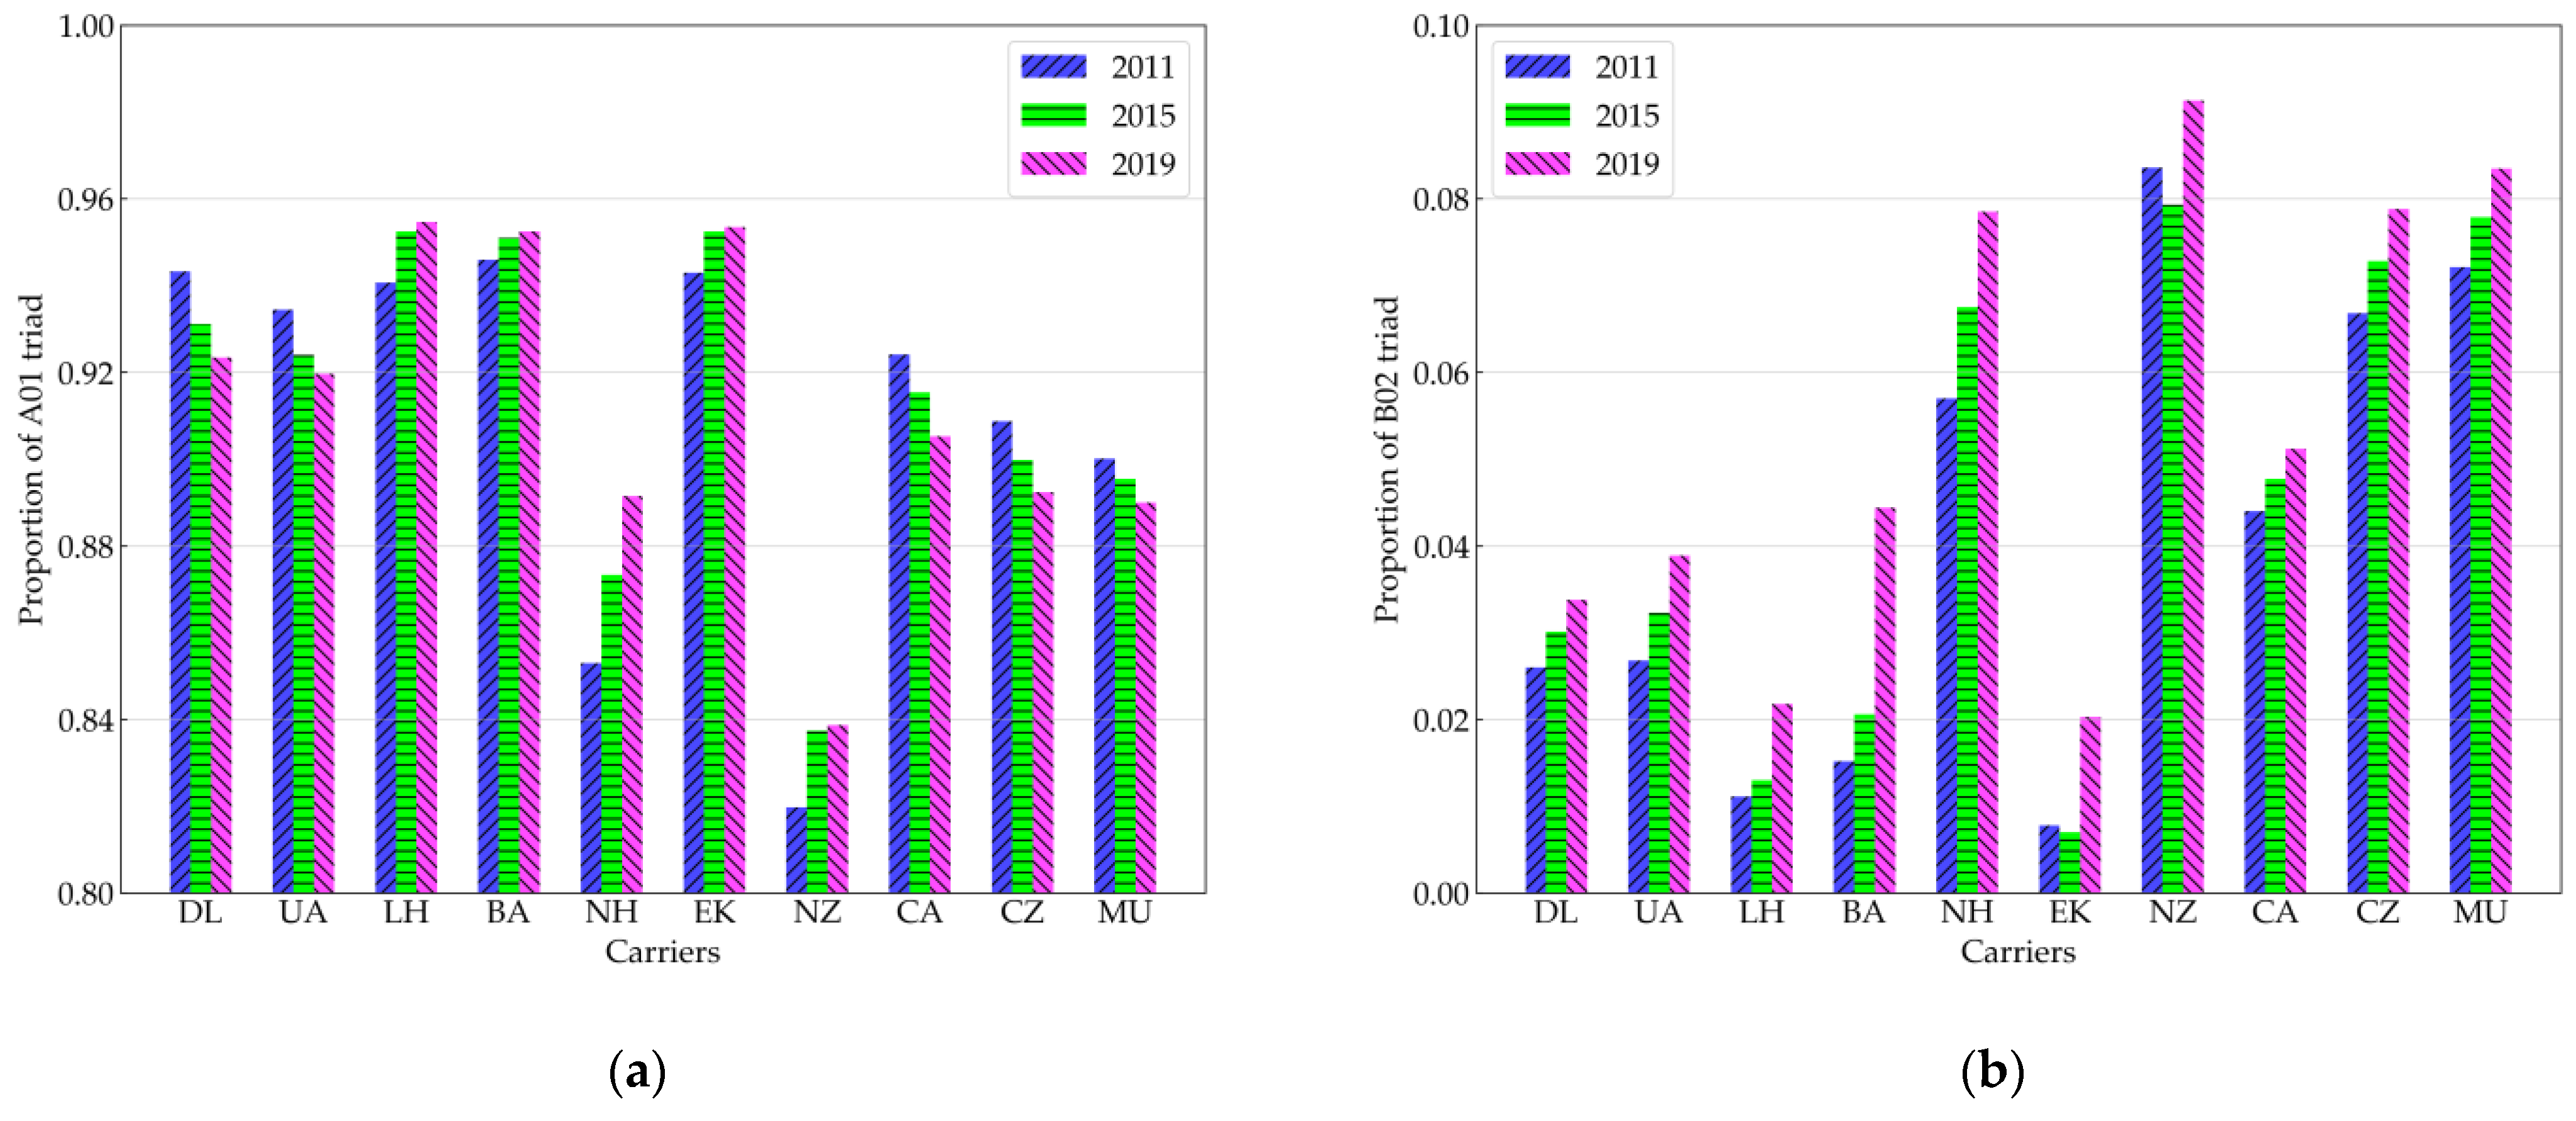
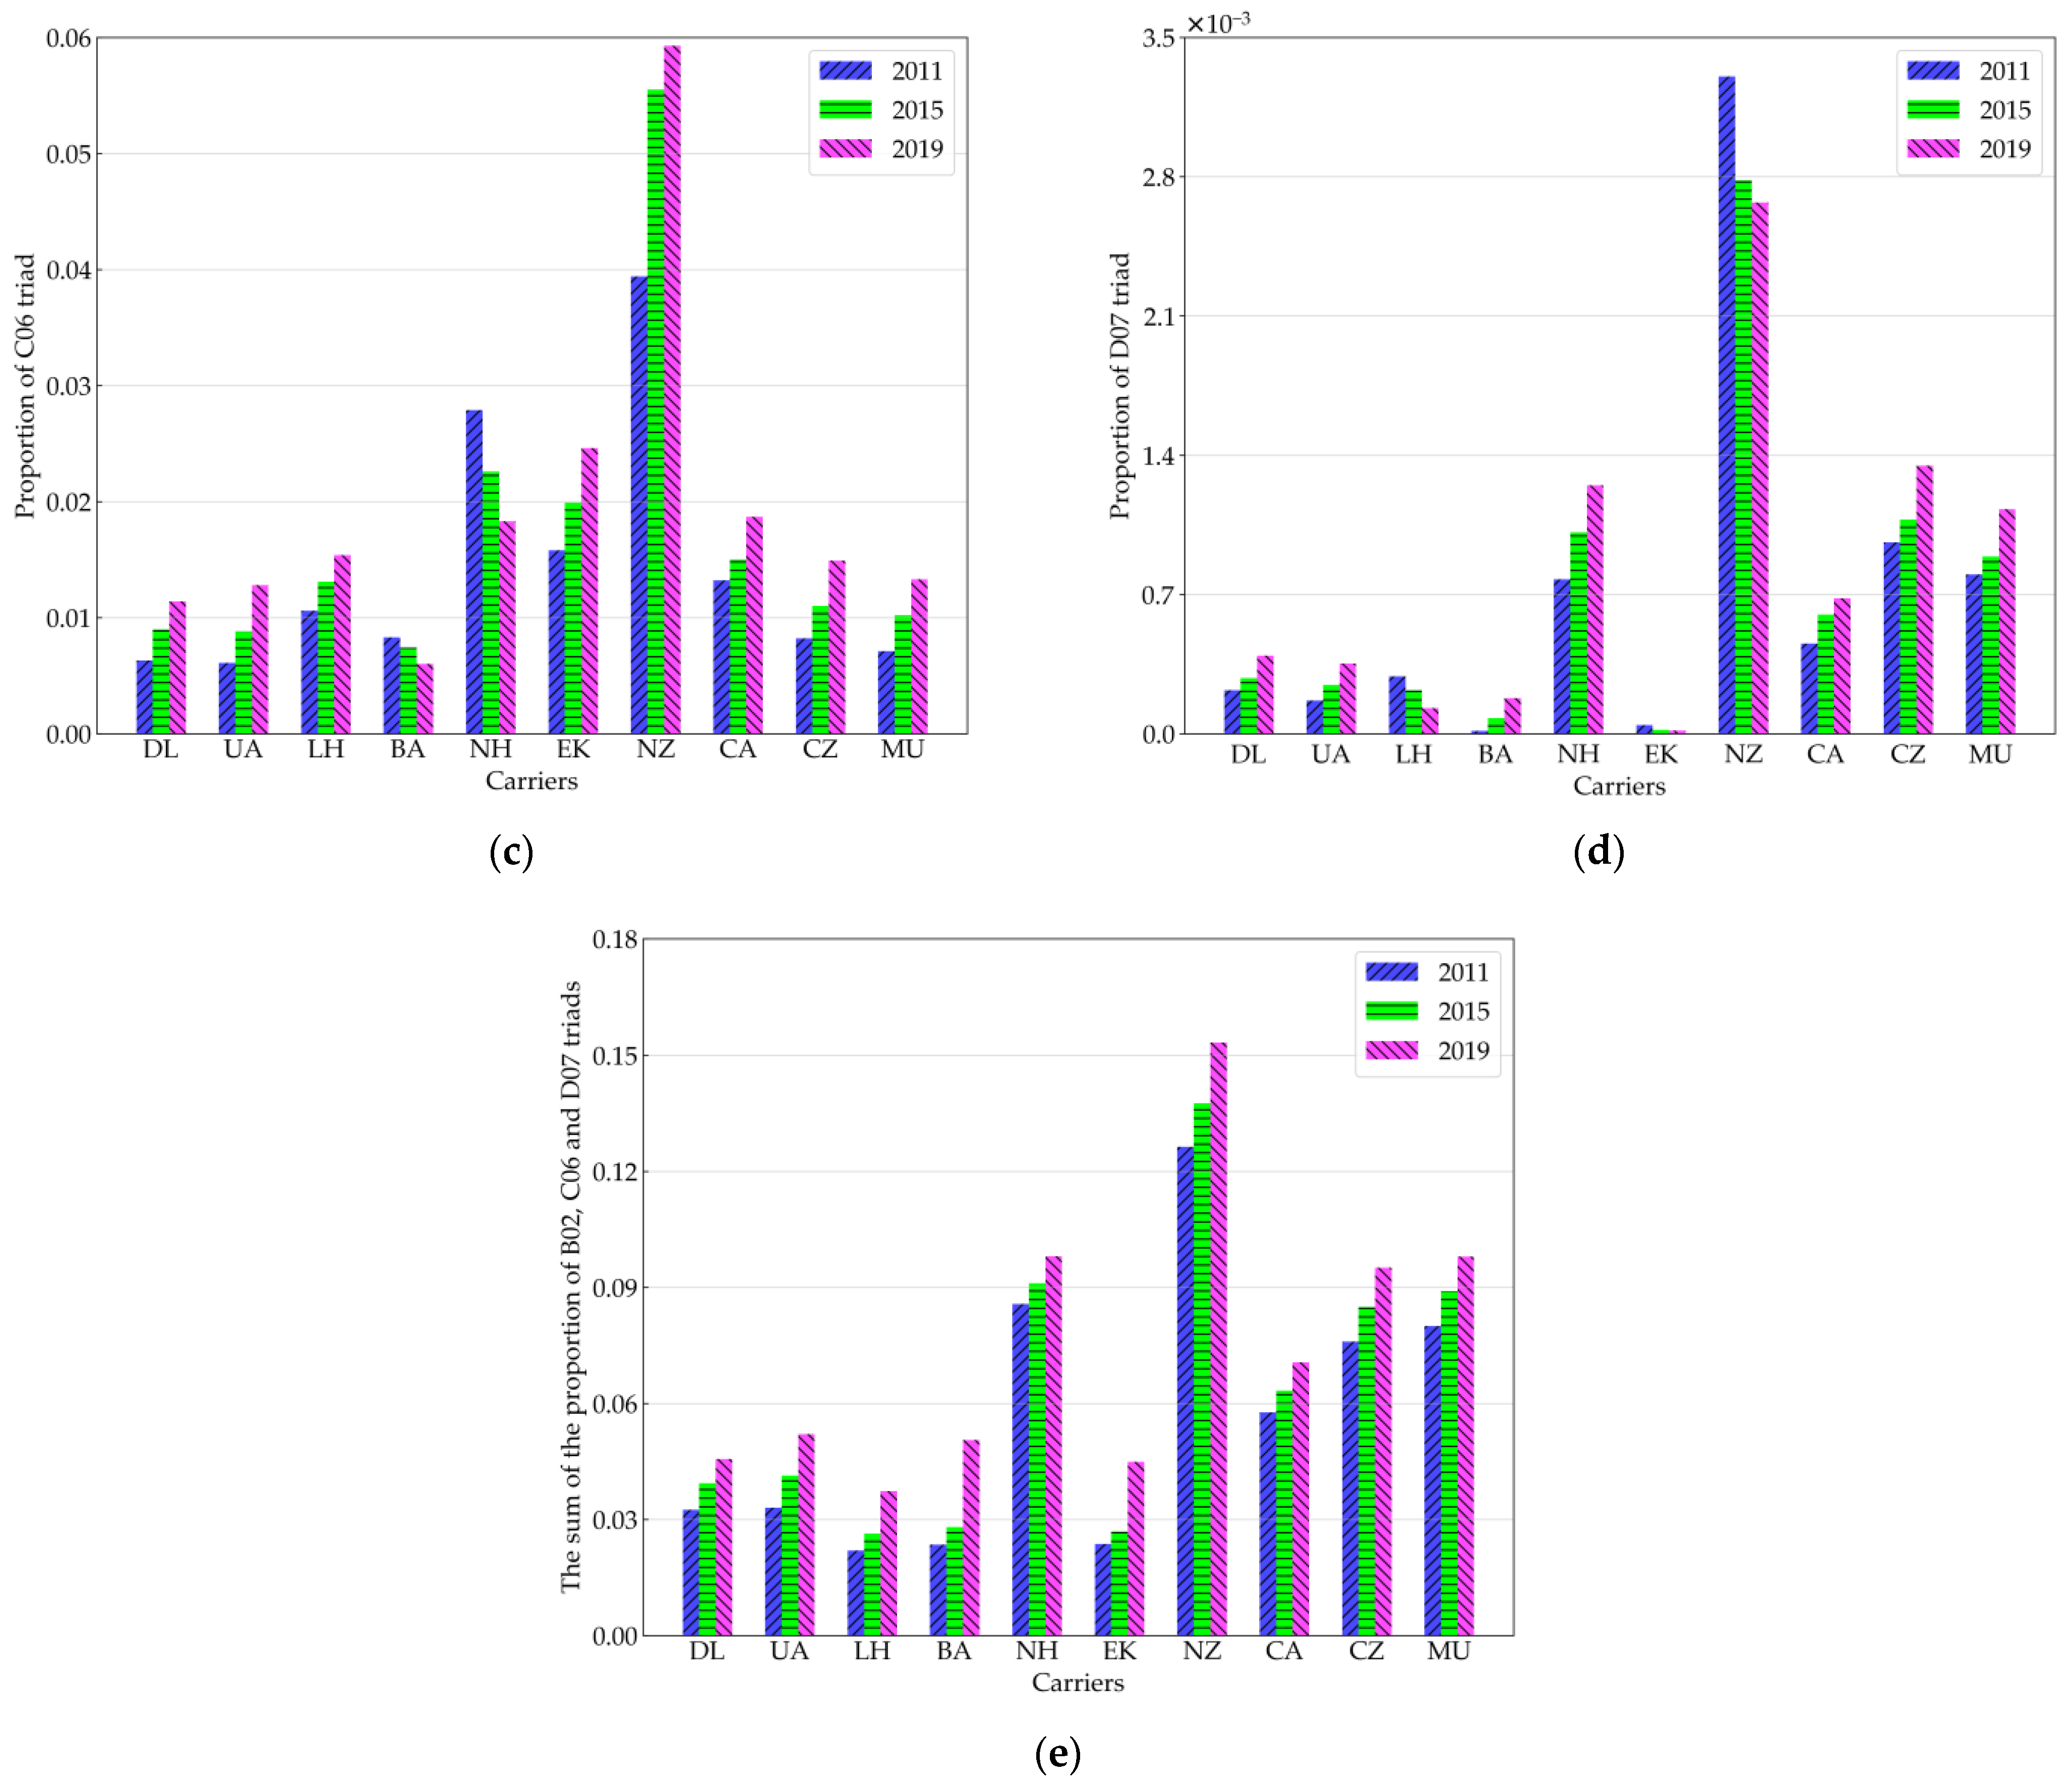
Among 16 kinds of directed triads, carrier networks contain, as the majority, four kinds of triads: A01, B02, C06, and D07. The proportion of the main four directed triads of each carrier’s network is shown in
Figure 6. The proportion of the other 12 triads are not shown because they are too small. The accumulative proportion of these dominant four triads is more than 96%, indicating that the structure of the air transport network is mostly bidirectional and symmetrical. Among the four triads, the proportion of the A01 triad is dominant, reaching more than 80%, which reveals that, for any full-service carrier, the air transport network is very sparse.
For All Nippon Airways and Air New Zealand, the B02, C06, and D07 triads represent the highest proportion, indicating that these carriers show stronger connectivity and better network efficiency, resulting in being more conducive to address the transfer and stopover of flights as well as distributing passenger flows. Nevertheless, in mega-scale air transport networks such as Delta Air Lines and United Airlines, the B02, C06, and D07 triads account for a relatively low proportion, revealing that the network connectivity is less tight than that of All Nippon Airways and Air New Zealand.
From 2011 to 2019, the proportion of B02, C06, and D07 triads of Delta Air Lines, United Airlines, Air China, China Southern Airlines, and China Eastern Airlines increased gradually. The proportion of the B02 triad and the summarization of the proportions of B02, C06, and D07 triads over 10 full-service carriers have increased. The changing trends show that two-way connected-pair triads, structural hole triads, and tight triads in full-service carrier air transport networks account for an increased proportion. The air transport networks are evolving towards structural symmetry and two-way transitivity. Apart from Lufthansa, Emirates, and Air New Zealand, other carrier networks also have shown the closed development trend.
4.3. Airports’ Competitiveness Analysis
This section calculates the structural hole to measure airports’ competitiveness characteristic from the microscopic perspective, which considers the impact of the adjacent nodes’ impact. It was found by Goyal et al. [
38] that the “middle-man” of a structural hole is located on the shortest path among node pairs so as to reflect stronger betweenness centrality. Providing that the degree is also the key indicator representing the airport’s significance, this paper gives each airport a score based on the degree and the weighted triangle betweenness centrality, and the airports whose scores are significantly higher than others are selected as the typical “middle-man” airports in structural holes. The typical identified “middle-man” airports are shown in
Table 4.
From
Table 4, it is observed that Delta Air Lines and United Airlines have higher numbers of the typical “middle-man” airports; Lufthansa has two typical “middle-man” airports—FRA and MUC; while the numbers of typical “middle-man” airports of All Nippon Airways, Emirates, and Air New Zealand are the least. The typical “middle-man” airport numbers in the structure holes reflect positive relevance to the hub-and-spoke structure of full-service carriers’ networks.
Table 4 shows that the airport with the highest scores in each air transport network has the greatest competitive power in its own air transport network. To compare the maximum airport competitive power among different full-service carriers, the effective size and constraint of these airports are respectively calculated, shown in
Figure 7. The majority of carriers show an increment in terms of the effective size of the “middle-man” airports, which indicates an increasing tendency of network efficiency qualities through performing iterative optimizations over time. ATL airport of Delta Air Lines and ORD airport of United Airlines have the largest effective size values, reaching more than 200, whilst HND airport of All Nippon Airways and AKL airport of Air New Zealand have the smallest size numbers of less than 60. This finding reveals that in mega-scale hub-and-spoke networks with multiple hubs, the ego-network of the “middle-man” airports in the structural holes present the least redundancy, and thereby show the strongest control ability in their ego-networks and process advantages in airport competition. However, the small-scale or medium-scale hub-and-spoke networks with a single hub or twin hubs contain higher redundancies in the structural holes to enhance robustness.
From 2011 to 2019, the constraint of “middle-man” airports in the structural holes presents a decreasing trend for most carriers, contributing to stronger benefits in competing with other carriers. FRA of Lufthansa contains the highest constraint level, whist LHR of British Airways and DXB of Emirates show the lowest values. It is concluded that those airports with high constraint are more balanced in terms of network structure between hub airports, whilst the airports with a single hub-and-spoke structure or with unbalanced degrees between hub airports show lower constraint values.
4.4. Network Centrality Analysis
This section applies a static characteristic method, i.e., path-based metrics of centrality metrics, to measure particular airports in the air transport networks on global performance so as to reveal and identify the importance of critical airports.
This paper uses k-shell decomposition for airport classifications, which is based on dividing the network into several layers. The identified critical airports in the core layer along with their centrality values are shown in
Appendix A. The top three critical airports identified in the core layer and their centrality values are listed in
Table 5. There are four acronyms in
Table 5, where AC represents airport code, WTBC represents weighted triangle betweenness centrality, WCC represents weighted closeness centrality, and WEC represents weighted eigenvector centrality.
From
Table 5, it is observed that the weighted triangle betweenness centralities of FRA, LHR, DXB, AKL, and PEK have the highest values, indicating that the transfer ability and connectivity between those airports are stronger than others. ATL, FRA, MUC, DXB, AKL, and PEK have the highest weighted closeness centralities, revealing that the total airport transfer times to other airports are the least. The airports of FRA, MUC, LHR, HND, DXB, AKL, and PEK have the highest weighted eigenvector centralities, showing that those airports have higher number of adjacent airports, with better centralities and connectivity capability. Compared with mega-scale hub-and-spoke networks with multiple hubs, the airports with higher centralities tend to appear in small-scale or medium-scale hub-and-spoke networks with a single hub or twin hubs.
From 2011 to 2019, the centralities of most critical airports of Delta Air Lines, United Airlines, Air China, China Southern Airlines, and China Eastern Airlines present a decreasing tendency. The centralities of the most critical airports like Lufthansa, British Airways, All Nippon Airways, Emirates, and Air New Zealand have increased over the past years. The above observations indicate that the traditional critical airports with large-scale and medium-scale full-service carriers are gradually being replaced by new critical airports with small-scale full-service carriers.
4.5. Network Robustness Analysis
This section aims to measure network robustness to explore the network resilience capability under random attacks and deliberate attacks. The cascading failure model under random attacks and deliberate attacks is applied to 10 full-service carriers’ air transport networks over the period between 2011 and 2019. By repeating consecutive random attacks and deliberate attacks 20 times, the network efficiency is calculated, as shown in
Table 6.
By injecting random attacks into the cascading failure model, it is found that the latest network structure in year 2019 has a higher resilience capability than the structure in 2011 in terms of network efficiency. United Airlines shows the most significant improvement in terms of network resilience across the years between 2011 and 2019. Specifically, the network efficiency of United Airlines under random attacks and deliberate attacks in year 2019 is 1.65 times and 1.99 times higher than in 2011. The robustness of the full-service carriers’ air transport networks for other full-service carriers also reveals enhancement over recent years.
By injecting distinguished attack modes, the network efficiency under the random attack mode is higher than that under deliberate attack. The variation in United Airline is highest, whose network efficiency in 2011 and 2019 under random attack is 37.85 times and 29.24 times higher than that under deliberate attack, respectively, which demonstrates that the network cascade failure speed under random attack is slower, and therefore the network is more robust.
The preliminary finding of network robustness analysis is that United Airlines presents the highest network efficiency among the 10 full-service carriers, and thereby it requires the highest attack numbers for achieving a failure. The higher efficiency also represents a slower speed of cascading failure in the network, and thus United Airline presents a smaller cascading failure and the strongest robustness of the cascading. The network efficiencies of China Eastern Airlines, China Southern Airlines, and All Nippon Airways have smaller values than that of United Airlines, but still show strong robustness. Lufthansa, British Airways, Air New Zealand, and Emirates have the lowest network efficiencies, which reveal the worst network robustness.
4.6. Network Similarity Analysis
This section evaluates the network similarities in the temporal domain among the global top 10 full-service carriers’ air transport networks from 2007 to 2022. The ACF calculation is applied to measure the similarity between individual carrier’s discrete states. To identify the states of the air transport networks for each carrier, this paper runs a hierarchical clustering method on its distance matrix, and the number of states is determined by Dunn’s index in
Section 3.5. The snapshot networks in the same cluster are regarded as a state, which means that networks with high similarity belong to the same state. Note that a lower ACF suggests a larger temporal variability of time series.
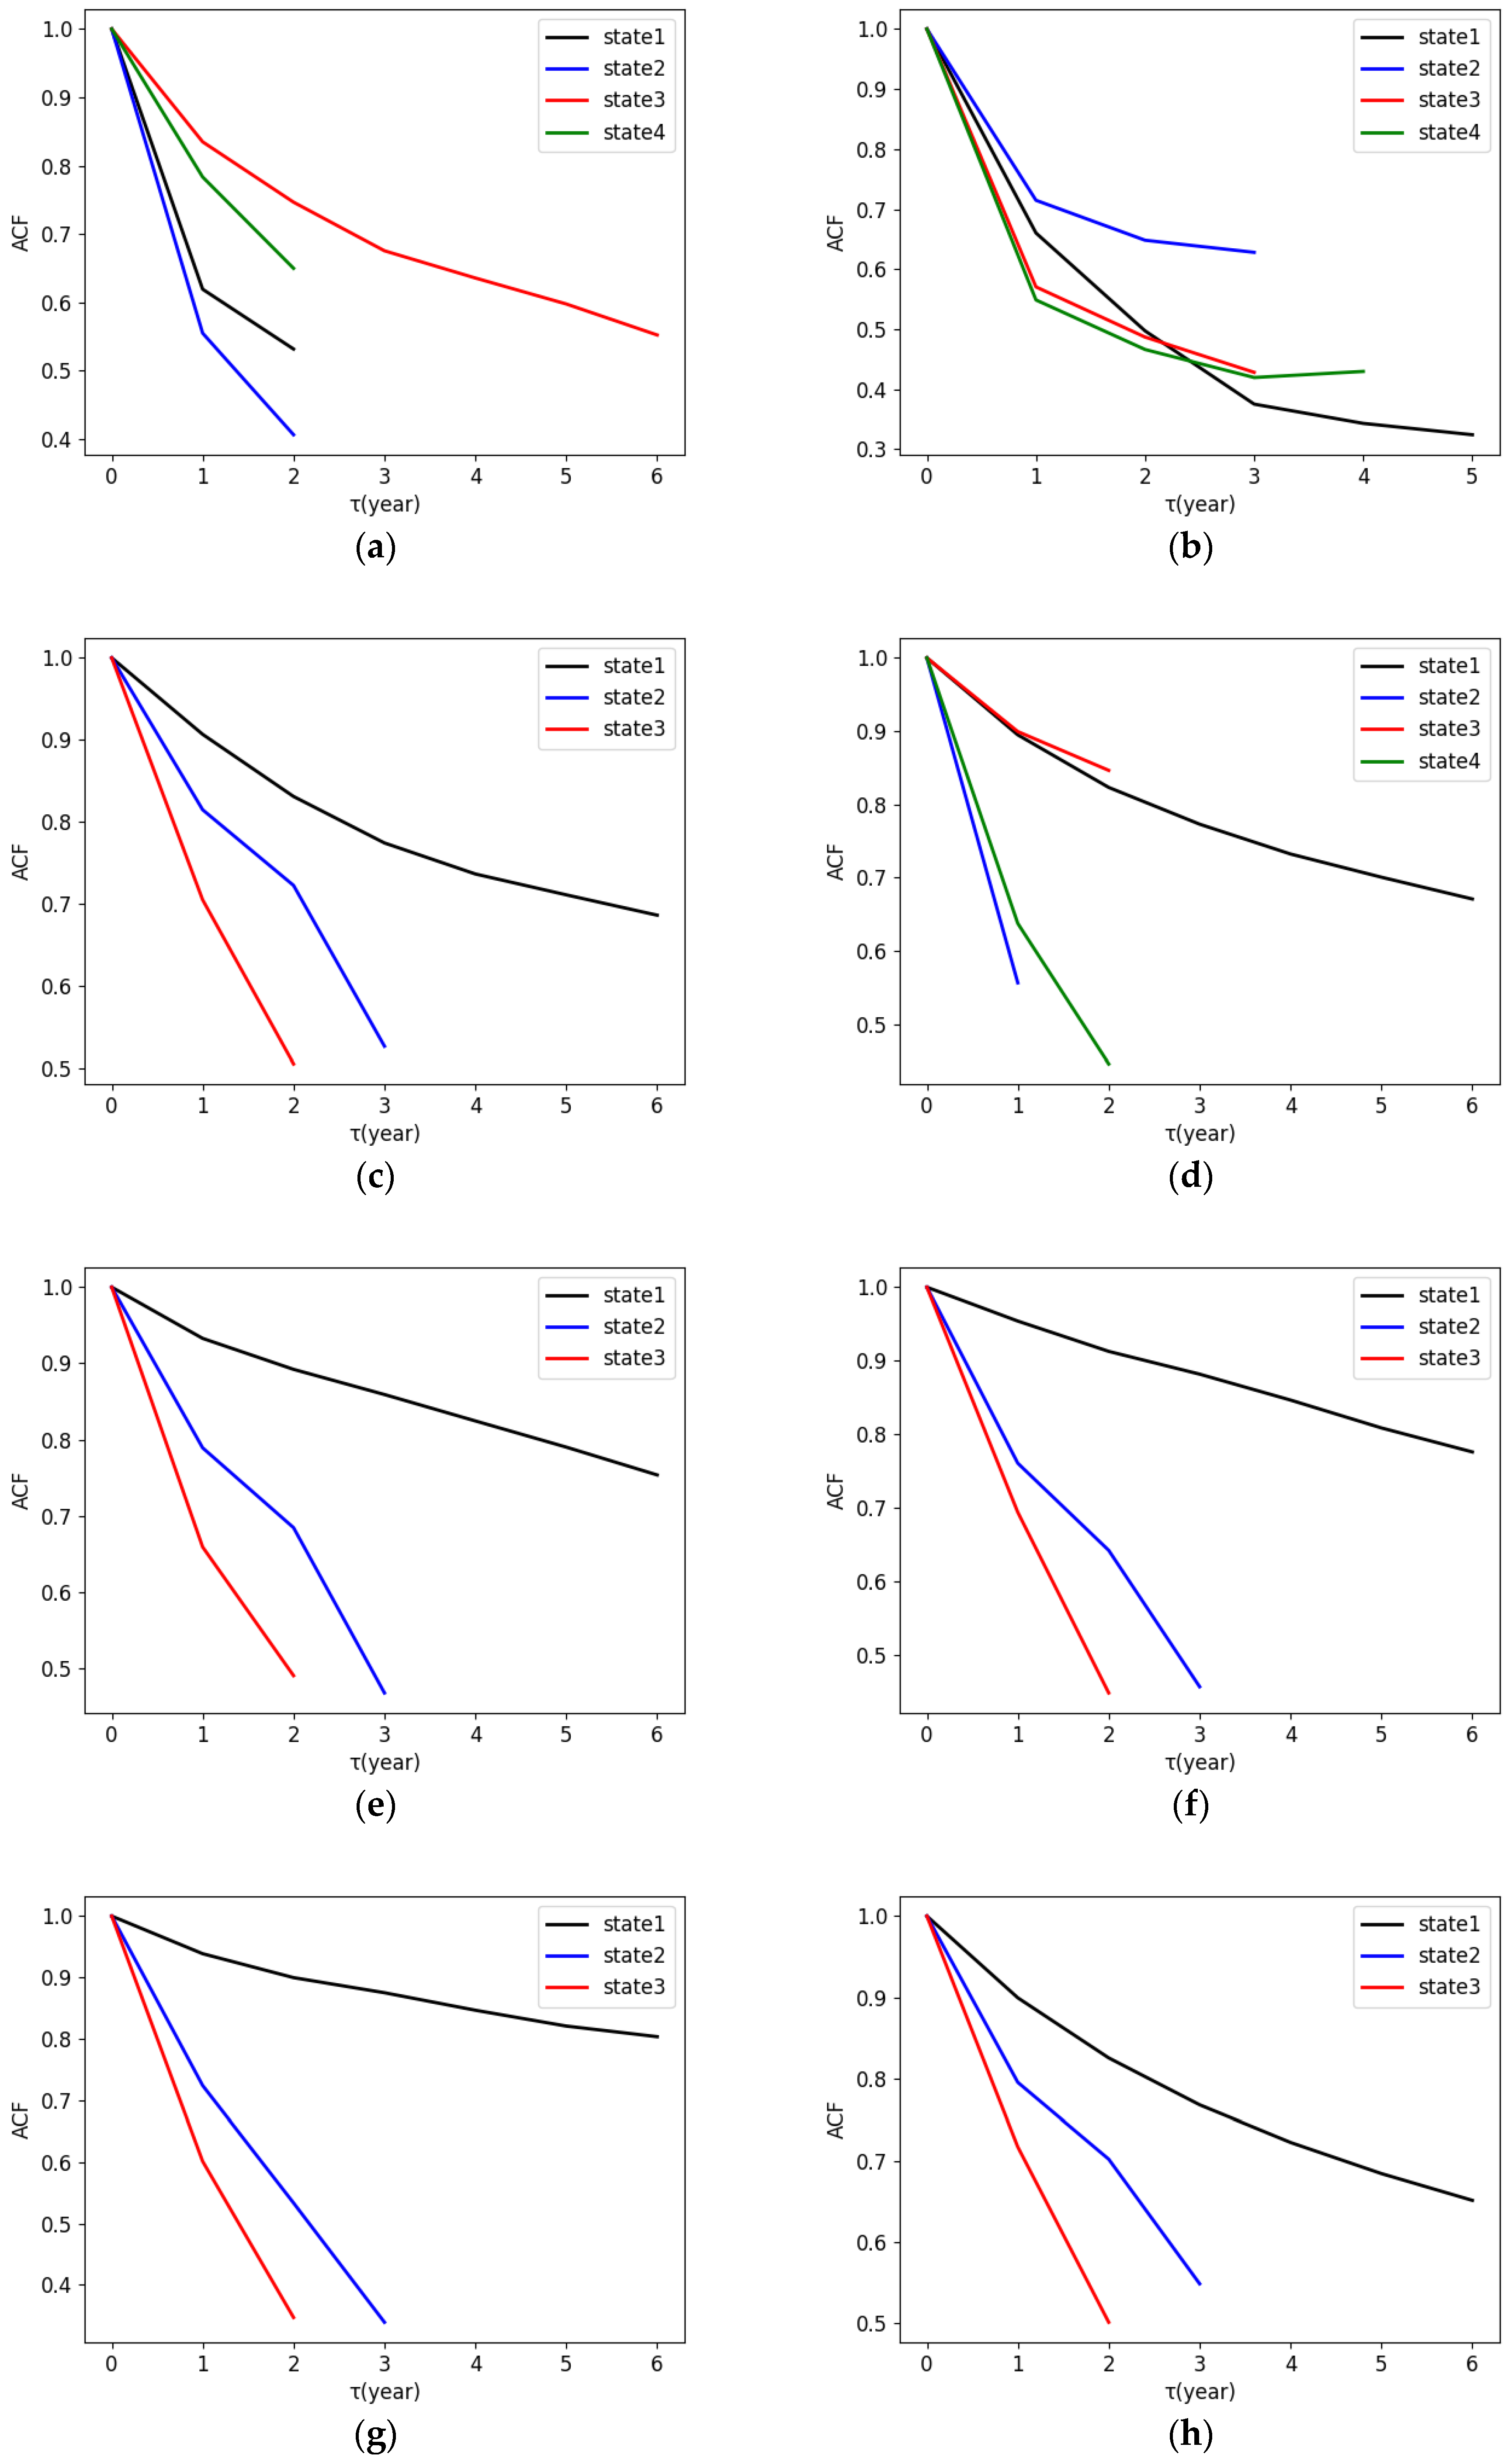
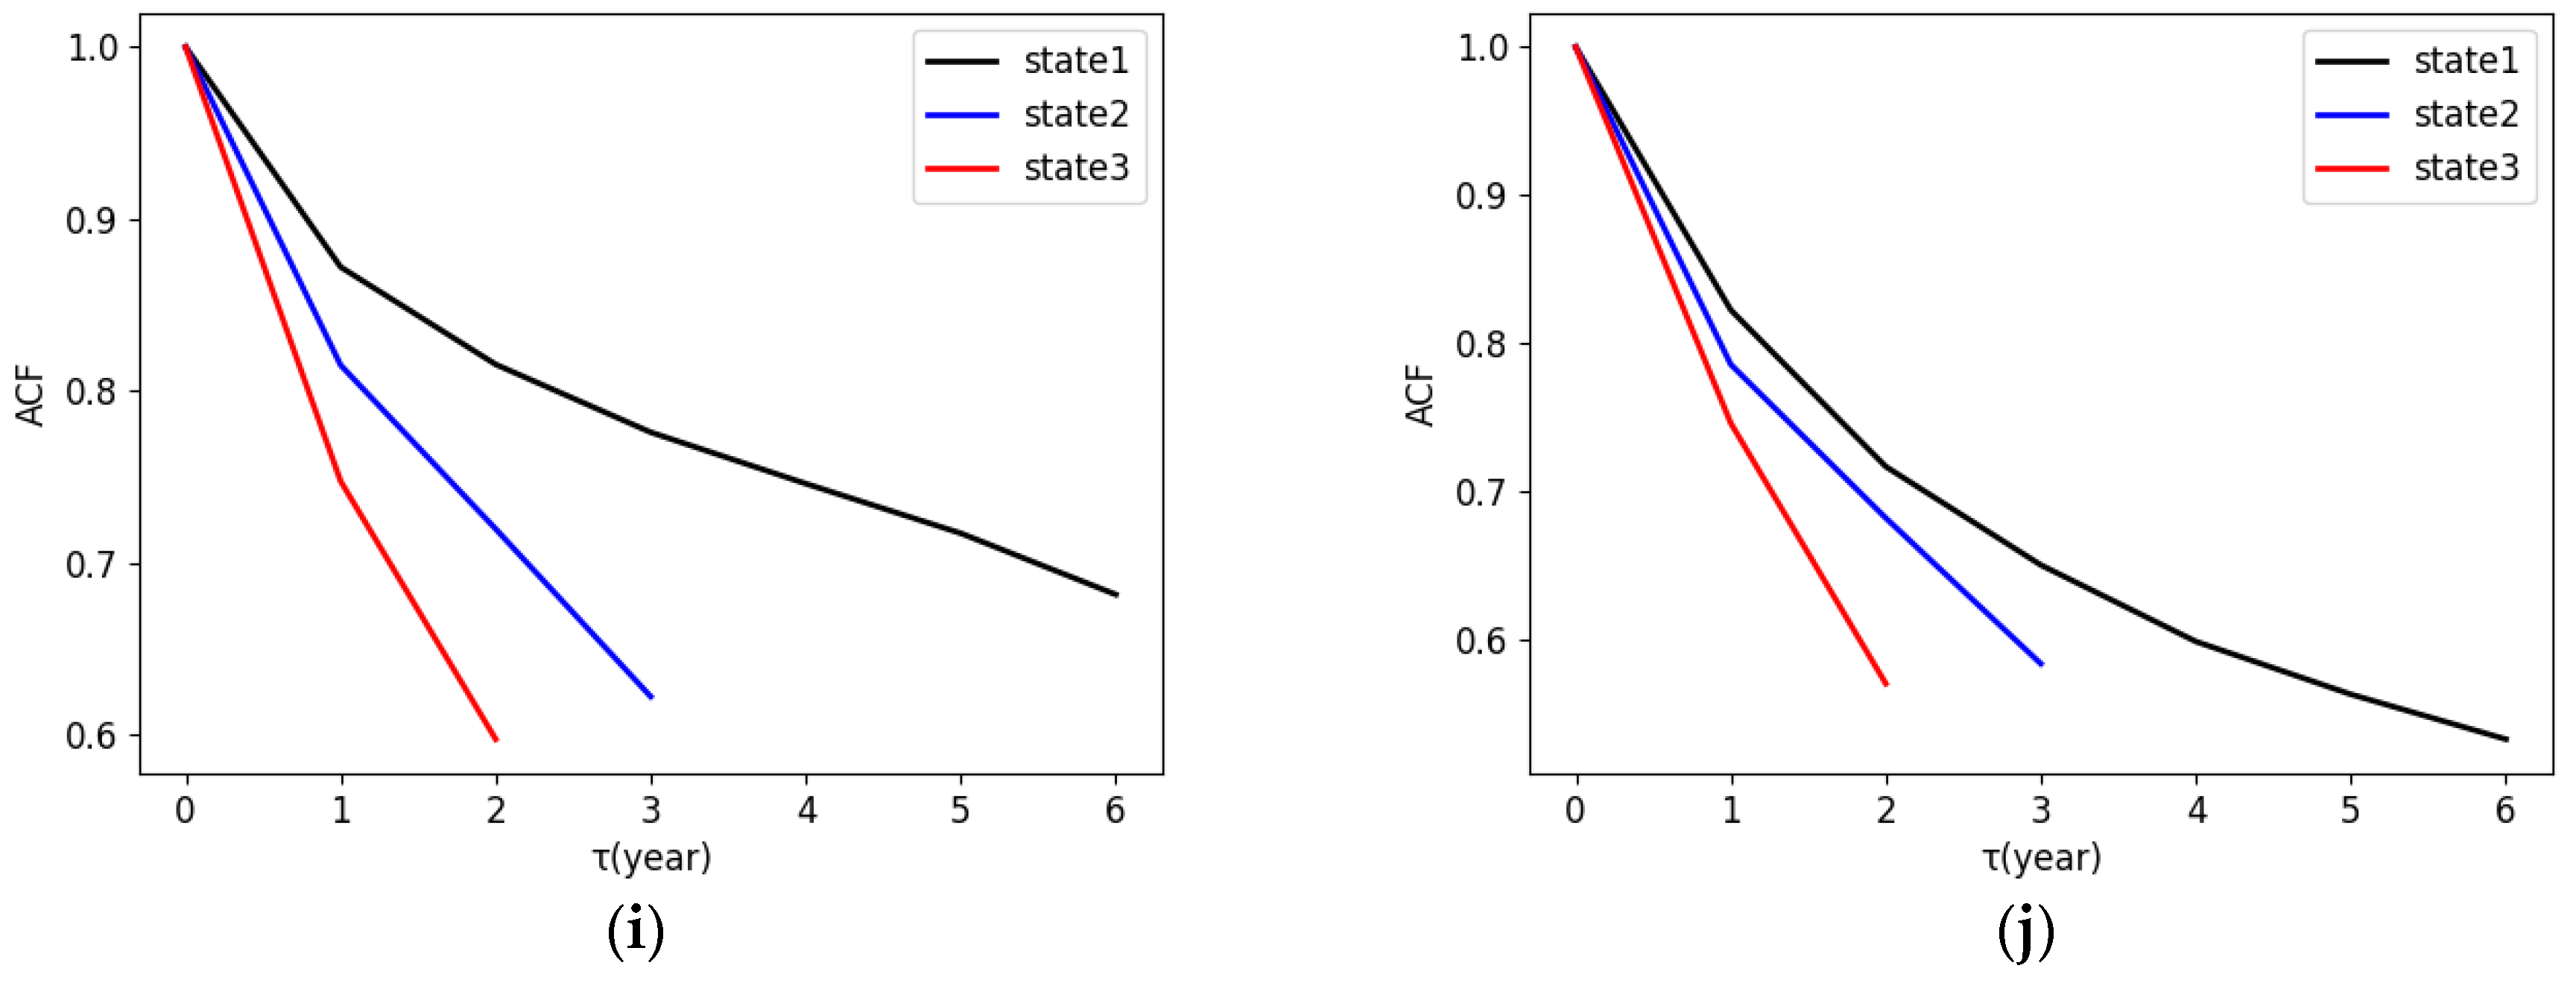
The ACFs for each state and each carrier are displayed in
Figure 8, where
is the time lag in years of each state. For the airlines of Lufthansa, All Nippon Airways, Emirates, Air New Zealand, Air China, China Southern Airlines, and China Eastern Airlines, state 1 shows the largest ACF values, followed by state 2, and then by state 3 across the whole lag range (
Figure 8c,e–j). The larger ACF value indicates a smaller temporal variability, and thereby the carriers over 2007 to 2017 for state 1 have less temporal variability than state 3 ranging from 2020 to 2022. The increment of the temporal variability in state 3 is likely induced by the COVID-19 pandemic side effects to the network.
It worth noting that Delta Air Lines and Northwest Airlines were merged together in 2008 to establish the world’s largest airline at the time, and hence the temporal variability represented by state 2 is higher than other states with the smallest ACF values, see
Figure 8a.
When analyzing the ACF figures in
Figure 8b for United Airlines, the ACF result tends to be smaller at later times, at least up to
years of the lag (
Figure 8b), which indicates a growing temporal variability, and the growth is probably further accelerated by the COVID-19 pandemic. It is also observed that the ACF of state 4 shows a slight increment when
which is approximately equivalent to the duration from 2021 to 2022. Such an increment means a temporal decrement in variability from 2021 to 2022, which could be because the United States lifted the international travel ban in November 2021 and further canceled the requirement for a negative nucleic acid certificate before departure in June 2022, resulting in the continued recovery of international travelers.
When analyzing the ACF figures in
Figure 8d for British Airways, the ACF of state 2 shows the smallest values, followed by state 4 over all the lag values. This demonstrates that the temporal variabilities of state 2 and state 4 are larger, and roughly span from 2017 to 2018 and 2020 to 2022. The higher variability from 2017 to 2018 could be because of the announcement of the signing of a joint venture agreement with Qatar Airways in 2016, providing a higher number of destination options and expanding market shares between the two airlines. Similarly, the higher variability from 2020 to 2022 could result from COVID-19 pandemic effects.
5. Conclusions
To investigate the long-term network structure evolution of full-service carriers for providing sustainable strategies, with the utilization of SNA and ACF, this paper applied static metrics from local to path-based (directed triad, structural hole, weighted triangle betweenness centrality, weighted closeness centrality, and weighted eigenvector centrality) to explore the overall network evolution trend and critical airports’ competitiveness, and used dynamic metrics to analyze the air transport networks’ robustness and similarity of the global top 10 full-service carriers over the period 2011–2019 or 2007–2022.
Some conclusions are highlighted as follows:
- (1)
The mega-scale hub-and-spoke structure with multiple hubs mostly appears in North American full-service carriers’ air transport networks, whose hub airports and routes are evenly distributed. The “middle-man” airports in structural holes have the largest effective size, meaning the strongest ability to control their ego-networks and the greatest competitive power in carrier competition.
- (2)
The small-scale or medium-scale hub-and-spoke structures with a single hub or twin hubs mostly appear in European, Asian, and Oceanian full-service carriers’ air transport networks, whose routes are concentrated on one or two hub airports. The critical airports in networks have higher weighted triangle betweenness centrality, weighted closeness centrality, and weighted eigenvector centrality. Yet, the effective size of the “middle-man” airports in structural holes is usually small, indicating less superiority in carrier competition.
- (3)
Among the 10 full-service carriers, the scale of Delta Air Lines’ air transport network is relatively stable, while Lufthansa’s and Air New Zealand’s networks are gradually shrinking, and the scale of the others are expanding. All full-service carriers’ air transport networks are developing toward the trend of structural symmetry and two-way transitivity. Except for Lufthansa, Emirates, and Air New Zealand, other carriers’ networks also have the closed development trend.
- (4)
From 2011 to 2019, the robustness of the 10 full-service carriers’ air transport networks enhanced, and the networks are more robust under random attack than deliberate attack. Among the 10 full-service carriers, United Airlines has the strongest robustness, while Lufthansa, British Airways, Air New Zealand, and Emirates have the worst robustness.
- (5)
The COVID-19 pandemic caused greater variability in the networks for Lufthansa, All Nippon Airways, Emirates, Air New Zealand, Air China, China Southern Airlines, and China Eastern Airlines. The merger of Delta Air Lines and Northwest Airlines in 2008 caused the larger temporal variability from 2009 to 2011 for Delta Air Lines. The signing of a joint venture agreement with Qatar Airways in 2016 caused the larger temporal variability from 2017 to 2018 for British Airways.
With the above findings, it is believed that the network structure of full-service carriers will be more closely connected, more symmetrical, more destruction-resistant, and have a great advantage in the air transport market.
For future studies, external factors affecting network evolution such as the economy, policy, and air traffic rights could be taken into consideration during the exploration of topological structural characteristics of air transport networks for further optimization of full-service carriers’ network structures.

