Article

Modeling and Performance Analysis of Variable Cycle Engine with Ceramic Matrix Composite Turbine Blades

1
School of Power and Energy, Northwestern Polytechnical University, Xi’an 710129, China
2
Sichuan Gas Turbine Establishment, Chengdu 610500, China
3
Collaborative Innovation Center for Advanced Aero-Engine, Beijing 100191, China
*
Author to whom correspondence should be addressed.
Aerospace 2024, 11(11), 886; https://doi.org/10.3390/aerospace11110886
Submission received: 6 September 2024 / Revised: 11 October 2024 / Accepted: 20 October 2024 / Published: 28 October 2024
(This article belongs to the Section Aeronautics)

Abstract

:
To meet the requirements of future aircraft for power systems, the turbine inlet temperatures of aero engines are gradually increasing. Ceramic matrix composite (CMC), with its higher thermal limit, has become the preferred material for the turbine blades of variable cycle engines (VCEs). However, the impact of CMC turbine blades on the performance of a VCE is still unknown. In this research project, the comprehensive cooling-efficiency characteristics of CMC are determined through a fluid–solid coupling calculation; a cooling calculation model for turbine blades is established, and cooling airflow solution and control technology (CSCT) for an air system is developed. Additionally, a VCE simulation model is established to analyze the influence of CMC turbine blades on the cooling airflow of the air system and the overall performance of the engine. The results show that, for the design condition, the CMC turbine blade can reduce the cooling airflow of the air system by approximately 10%, and the net thrust is increased by 6.07–7.98%. For the off-design conditions, with the CSCT, the specific fuel consumption can be reduced by 3.06–5.73% while ensuring that the engine net thrust remains unchanged. A comprehensive analysis of the performance for both the design point and off-design points indicates that the use of CMC for high-pressure turbine (HPT) guide vanes and rotor blades yields significant performance benefits, while the performance improvement from the use of CMC for low-pressure turbine (LPT) rotor blades is minimal.

1. Introduction

A variable cycle engine (VCE) meets the performance requirements of the power system for complex flight missions through the flexible adjustment of the bypass ratio using variable geometry components, which makes a VCE one of the ideal forms of propulsion for future aircraft [1,2,3,4]. The extensive adjustment of the thermodynamic cycle parameters enables a VCE to evolve toward higher specific thrust and lower fuel consumption. The continuous improvement of the specific thrust requires the engine to have a higher turbine inlet temperature. From a developmental perspective, the future turbine inlet temperatures are approaching 2400 K [5,6,7,8]. Traditional superalloy materials can no longer ensure the continuous and stable operation of hot section components such as turbine blades under high-temperature conditions. Ceramic matrix composite (CMC), with its higher thermal limit and lower density, has become a strategic thermal structural material for the next generation of aero engines [9].
In recent years, researchers have explored the feasibility of CMC as a material for turbine blades in terms of material strength, erosion resistance, cooling efficiency, and installation performance. Shi et al. [10] completed a conceptual design scheme for a low-pressure turbine (LPT) rotor blade with the strength constraints of CMC materials, and the simulation analysis indicated that CMC could be applied to the LPT of a turbofan engine. Okita et al. [11] conducted erosion tests on SiC-SiC CMC turbine guide vanes with environmental barrier coatings (EBCs). Their research revealed the erosion resistance capabilities of the CMC + EBC material combination. Tu [12] conducted comprehensive cooling-efficiency experiments on turbine blades made of typical CMC materials, analyzed the distribution characteristics of the cooling efficiency for these blades, and studied the thermal conduction mechanisms of CMCs. Sun et al. [13] proposed a turbine guide vane configuration with CMC armor embedded on the leading edge surface of the metal airfoil, which could reduce the mass flow rate of cooling air by 58% and increase the cooling efficiency of the blade substrate in the leading edge area from 0.50 to 0.85. Boyle [14] and Langenbrunner [15] conducted studies on the aerodynamic performance of CMC turbine blades and the tip/shroud rub event of CMC turbine blades, validating the feasibility of CMC as a turbine blade from the perspective of the installation performance.
Based on the above references, it is evident that current research on CMC turbine blades is primarily focused on the demonstration of feasibility and component-level studies. Comparatively, research on the performance simulation of an entire engine using CMC turbine blades is relatively scarce. Boyle et al. [16,17] calculated the changes in the cooling airflow rate of a high-pressure turbine (HPT) after the implementation of CMC and qualitatively analyzed the impact of these changes on the efficiency of the HPT and the overall performance of the engine. However, they did not construct a rigorous mathematical model for thermodynamic cycle analysis. Zheng et al. [18] established a thermodynamic cycle analysis model for the multi-design points of a turboprop engine and analyzed the enhancement in the overall performance produced by CMC for advanced civil turboprop engines. Yao et al. [19] established computational models for characteristic components such as heat exchangers and turbine blades and developed an iterative calculation model for the design point of a variable cycle turbofan (VCTF) engine. They calculated and analyzed the impact of the cooling airflow from the CMC turbine blades on the performance at the design point. For a VCE that needs to balance thrust and fuel consumption performance, the adoption of CMC turbine blades has become a mainstream trend. Therefore, it is necessary to conduct simulation studies on the overall performance of a VCE with CMC turbine blades.
A VCE has a large range of bypass ratios, and there is a significant difference in the turbine inlet temperature at different bypass ratios. Currently, the turbine inlet temperature in the design state of a VCE can reach above 2200 K, while for the double bypass mode during low-speed cruising, the turbine inlet temperature is less than 1200 K [20,21]. To ensure that turbine blades can operate stably and safely across the entire flight envelope, the cooling airflow from the air system that meets the temperature requirements of the turbine blades at the design condition (maximum state) is generally adopted as the cooling scheme for the engine. However, the turbine inlet temperature of the VCE can vary by more than 1000 K in different states. If the cooling scheme designed for the design point is applied across the entire flight envelope, the excessive cooling airflow in the double bypass mode can lead to excessive performance losses. Therefore, it is necessary to establish a model for calculating the cooling airflow of the air system at off-design points. This model should control the cooling airflow of the air system to be as small as possible while still meeting the temperature limit requirements of the turbine blades under different flight conditions, with the goal of reducing performance losses in off-design states.
In summary, in this research project, CMC is used as the material for turbine blades, the comprehensive cooling-efficiency characteristics are obtained through a fluid–solid coupling calculation, a simulation model for turbine-blade cooling is established, cooling airflow solution and control technology (CSCT) for an air system is developed, and the overall performance calculation program for the VCE is improved. Based on this, in this research project, the impact of CMC turbine blades on the cooling airflow of the air system and the overall performance of VCEs are analyzed, and the performance benefits produced by different CMC turbine blades are calculated.

2. Simulation Model and Modeling Methods

Figure 1 illustrates the structure and the section numbers for each component of the double bypass VCE used in this research project, where R-VABI is the abbreviation of rear variable area bypass injector. Unlike a conventional mixed-flow turbofan engine, the core-driven fan stage (CDFS) and the high-pressure compressor (HPC) of the VCE are both powered by the HPT. When the mode selector valve (MSV) is open, a portion of the airflow from the fan enters the CDFS, while the remainder flows into the outer bypass, at which point the fan bypass airflow mixes with the CDFS bypass airflow under the regulation of the forward variable area bypass injector (F-VABI). In this case, the VCE works in double bypass mode. When the MSV is closed, all the airflow from the fan flows into the CDFS. In this case, the airflow of the fan outer bypass is zero and the VCE works in single bypass mode.
Based on the in-house aero-engine performance simulation program HiMach [19,22], a double bypass VCE simulation model is established, as shown in Figure 2. The accuracy and stability of the aero-engine performance simulation program used in this research project have been verified in references [19,20] and references [22,23,24,25,26]. In Figure 2, the lines of different color represent the cooling air from the air system used for turbine-blade cooling, and the values indicate the relative cooling airflow. Table 1 shows the design point parameters of the VCE studied in this research project. The design point is taken as the sea-level standard condition, and the VCE works in the double bypass mode.

2.1. CMC Turbine-Blade Cooling Calculation Model

2.1.1. Turbine-Blade Cooling-Efficiency Calculation Model

The primary objective of the turbine-blade cooling calculations is to determine the minimum flow of cooling air required to meet the turbine blade’s thermal limits. The cooling methods for turbine blades typically include internal convective cooling and external film cooling. The key to turbine-blade cooling calculations is the assessment of the turbine blade’s temperature, and the calculation methods mainly include the semi-empirical method [27] and the analytical method [28]. In the early stages, the semi-empirical method is mainly used for calculating the temperature of turbine blades with convection cooling. As the cooling requirements for the turbine blades increase, the application of film cooling and thermal barrier coatings is promoted. Young et al. [29] incorporated the effects of film cooling and thermal barrier coatings, introducing performance parameters such as the comprehensive cooling efficiency ε 0 , internal cooling efficiency ε int , and film cooling efficiency ε film . This method does not require inputs such as heat transfer coefficients and blade structural parameters. Comprehensive cooling efficiency is defined as follows:
ε 0 ( x ) = T t , g T bld T t , g T t , c , in ,
where T t , g denotes the gas temperature, T bld denotes the turbine blade temperature, and T t , c , in denotes the temperature of the cooling air at the inlet of the cooling channel inside the turbine blade.
To obtain the turbine blade temperature, it is necessary to acquire its comprehensive cooling-efficiency characteristics. A turbine blade wall can generally be simplified to a one-dimensional flat plate [8]. Therefore, in this research project, a flat-plate model is established to replace the turbine-blade model. The 2D woven flat structure established in this research project is shown in Figure 3, where the yarn is an anisotropic material with a thermal conductivity of 13 W/(m×K) along the direction of yarn extension and a radial thermal conductivity of 6 W/(m×K). The matrix is an isotropic material with a thermal conductivity of 6 W/(m×K). The superalloy material flat plate uses the same dimensions and hole structure as a CMC flat plate with a thermal conductivity of 20 W/(m×K). In this research project we conducted a fluid–solid coupling calculation for two types of material plates based on the CMC flat-plate model described in reference [30], and obtained the characteristics of comprehensive cooling efficiency, as shown in Figure 4 and Figure 5. Niu et al. [31] carried out a fluid–solid coupling calculation and experimental studies on 2D CMC flat plates. A comparison of the simulation data with the experimental data revealed that the comprehensive cooling-efficiency distribution pattern calculated using the SST turbulence model agreed well with the results obtained from experiments. Therefore, the SST turbulence model was used in the fluid–solid coupling calculation. In these calculations, the mass flow ratio (MFR) is the ratio of the cooling air mass flow to the gas mass flow, and the temperature ratio (TR) is the ratio of the gas temperature to the cooling air temperature. The abscissa X/D of the comprehensive cooling-efficiency characteristics in Figure 4 and Figure 5 is a dimensionless distance, representing the relative distance of the flat-plate flow direction to the first row of holes.

2.1.2. Gas Temperature Correction

In the calculation of the engine performance, the burner outlet total temperature refers to the average temperature at the exit cross-section of the burner. Due to the effects of the structure of the burner, the temperature of the burner outlet section is inevitably non-uniform. Figure 6 illustrates a schematic of the total temperature distribution of the gas at the main burner outlet. To solve for the minimum cooling airflow required to meet the thermal limit requirement of the turbine blades, it is essential to consider the impact of the non-uniformity in the gas temperature distribution. Therefore, a burner pattern factor K MB is introduced to correct the gas temperature, and it is defined as follows [29]:
K MB = T t , g , max T t , g , rel T t , 4 T t , 3 ,
where T t , g , max denotes the maximum total temperature of the gas, T t , 4 denotes the total temperature at the burner outlet, T t , 3 denotes the total temperature at the burner inlet, and T t , g , rel denotes the relative total temperature of the gas. For the turbine guide vanes, T t , g , rel = T t , g , while for the turbine rotor, T t , g , rel can be determined as follows:
T t , g , rel = 0.92 1 n ¯ 100 + 1 T t , g ,
where n ¯ denotes the relative physical speed of the turbine. In this research project, the K MB for the HPT guide vane is set to 0.4. The K MB for the HPT rotor, LPT guide vane, and LPT rotor are subsequently halved in sequence [29].
After considering the correction for gas temperature, T t , g in Equation (1) can be replaced with T t , g , max .

2.1.3. Turbine Efficiency Correction

The cooling of the turbine blades results in a reduction in turbine efficiency, so it is necessary to apply corrections to the turbine’s isentropic efficiency. Gauntner [33] provided efficiency correction factors for various turbine-blade cooling methods. For turbine blades employing both convective cooling and film cooling, the efficiency correction factors are presented in Table 2.
In Table 2, the loss coefficient in the stage efficiency denotes the loss in the stage efficiency of the turbine when the flow of cooling air is equal to the flow of gas. The efficiency losses for the turbine guide vanes η st , loss and the rotor η rt , loss are, respectively, calculated as follows:
η st , loss = f st W c , st W g , st η T ,
η rt , loss = f rt W c , rt W g , rt η T ,
where W c , st and W c , rt denote the cooling flow rates for the turbine guide vanes and the rotor, respectively. Similarly, W g , st and W g , rt denote the gas flow rates passing through the turbine guide vanes and the rotor, respectively. η T denotes the uncorrected isentropic efficiency of the turbine. The corrected isentropic efficiency of the turbine η T is calculated as follows:
η T = η T η st , loss η rt , loss ,

2.2. Air System Cooling Airflow Solution and Control Technology

2.2.1. Air System Cooling Airflow Solution and Control Technology at Design Point

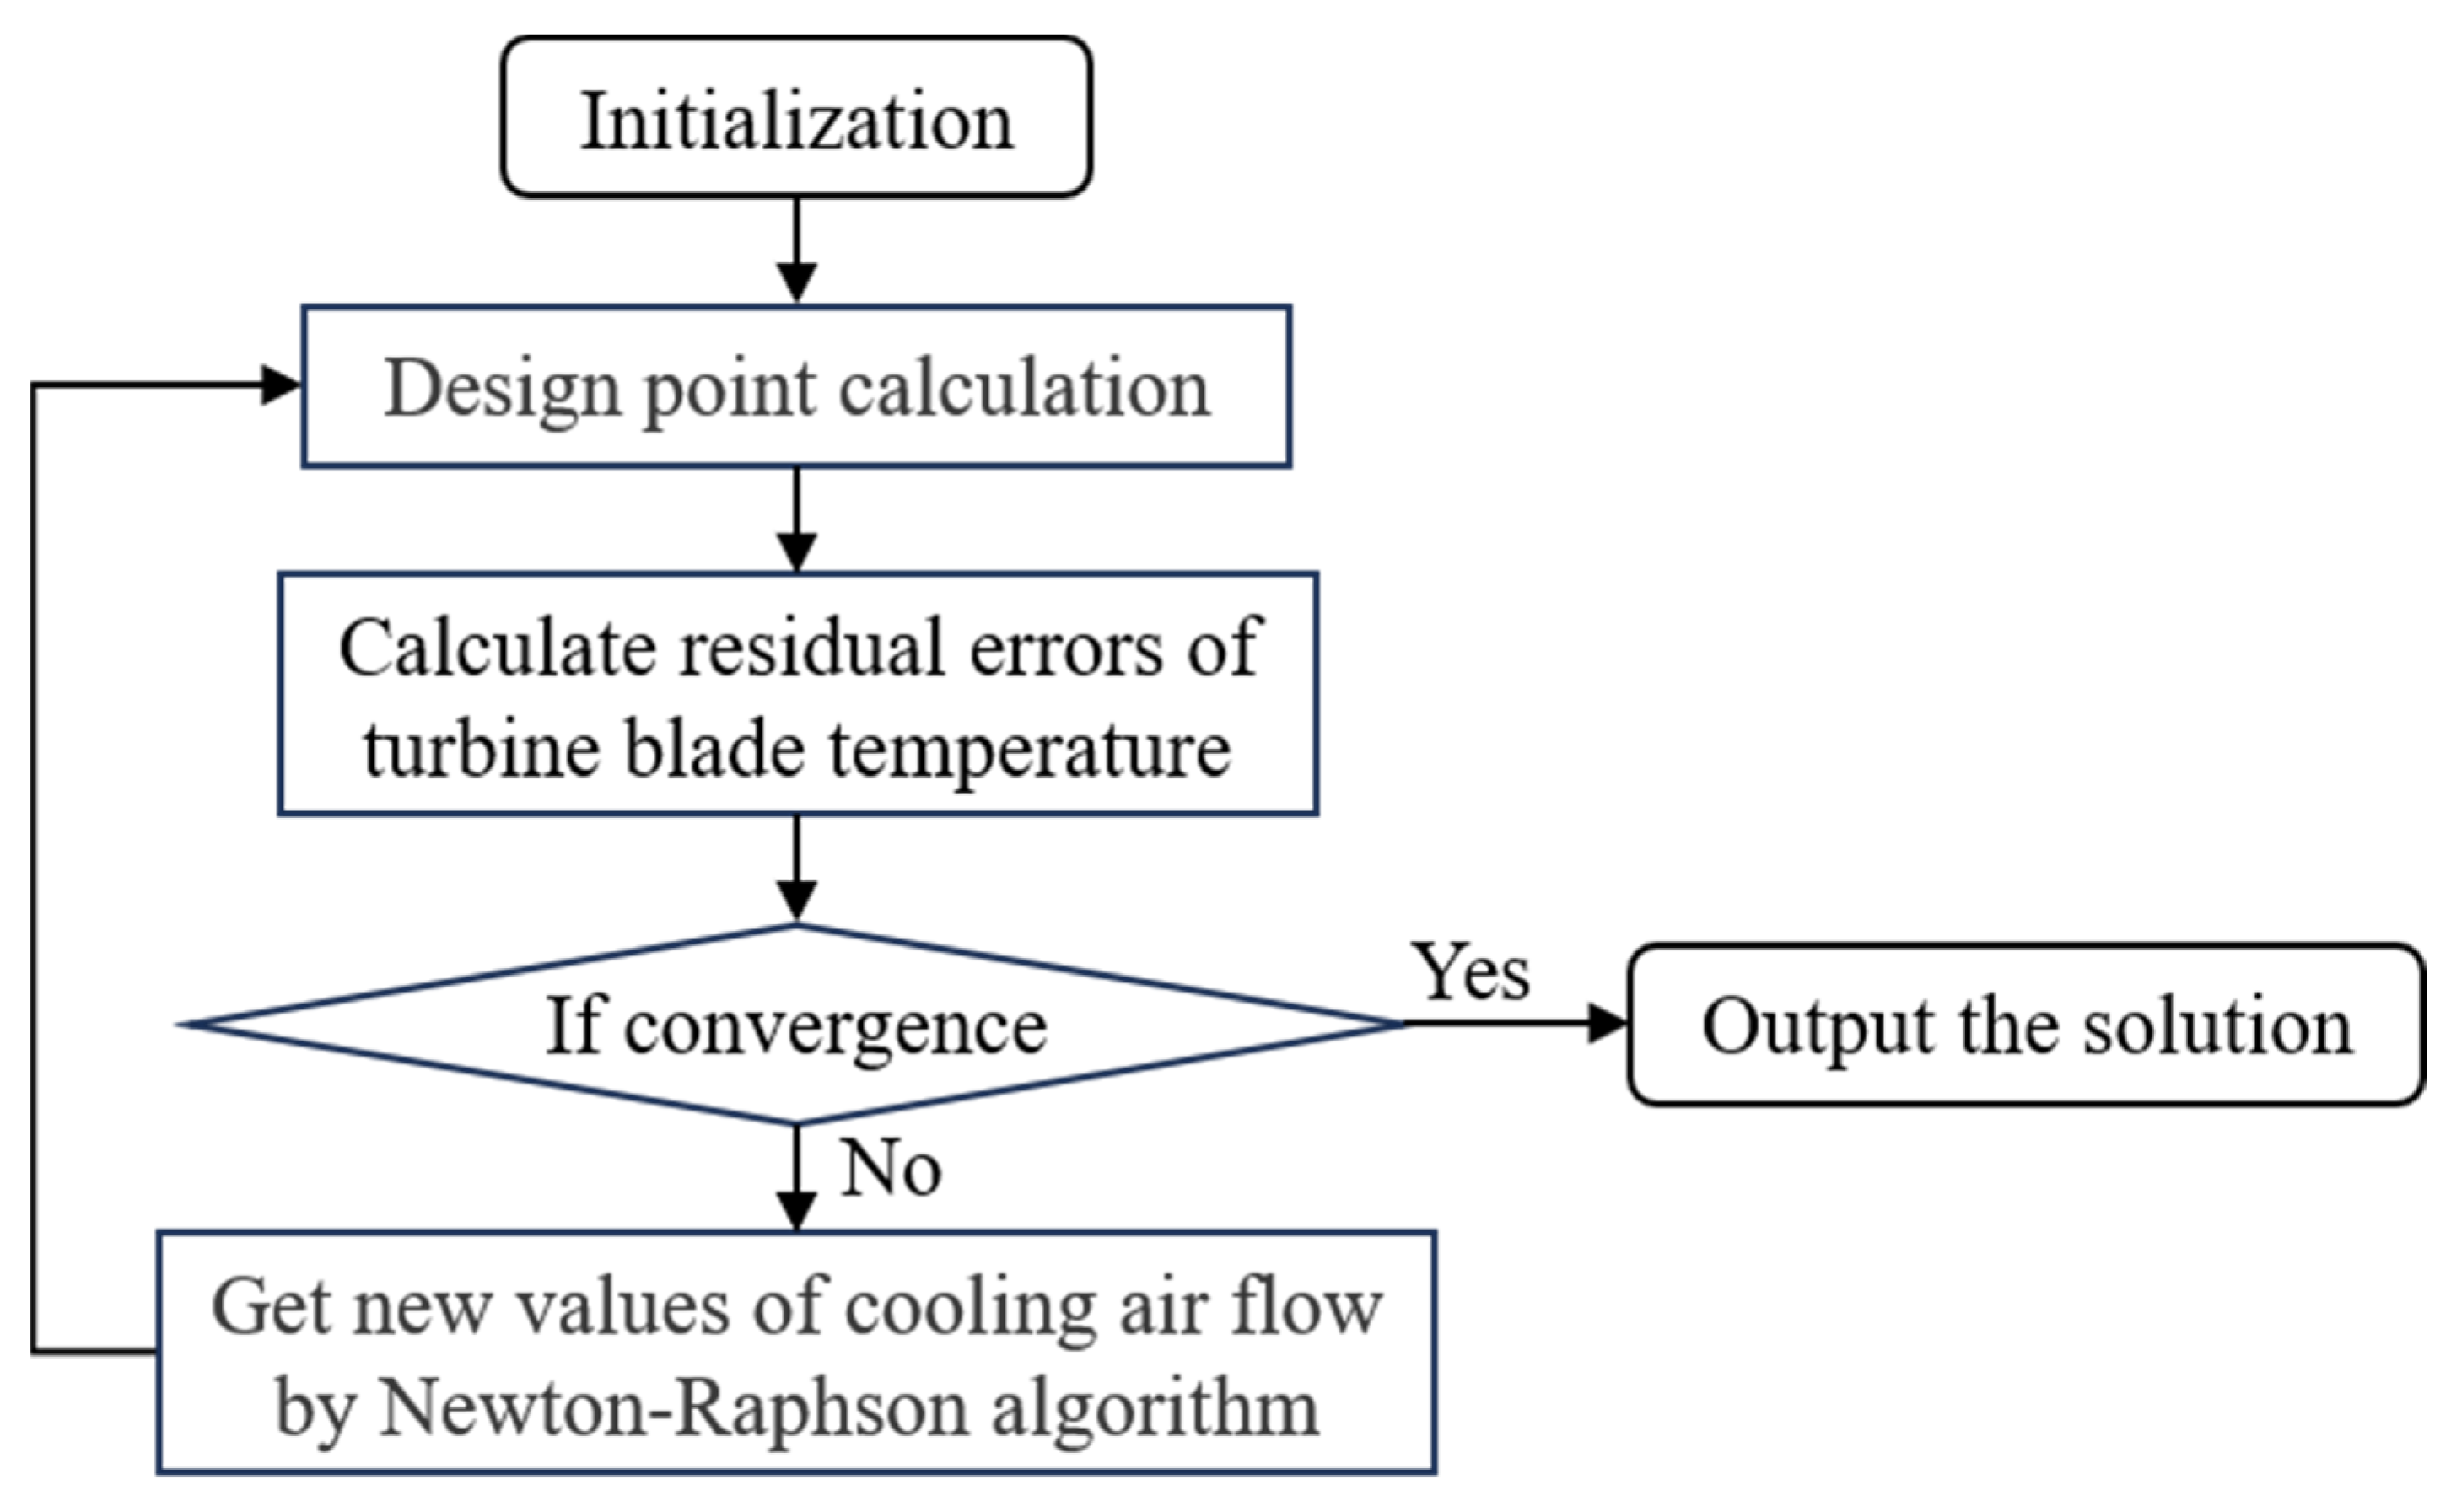
For conventional aero engines, it is sufficient to sequentially compute the aerodynamic and thermodynamic models of each component to obtain the performance parameters during design point calculation. This research project investigates a double bypass VCE, which employs CSCT to determine the minimum required cooling airflow by controlling the turbine blade temperature. Therefore, it is necessary to iterate the cooling airflow for the turbine blades during design point calculation until their temperatures meet the requirements. The design point iterative calculation process of the VCE with CSCT is shown in Figure 7. In this research, the Newton–Raphson iterative algorithm is used to solve the equilibrium equations. When each temperature error is less than 10−4, the iterative process is considered to be convergent.
To ensure that the iteration obtains reasonable cooling airflow values, the iteration range for the cooling airflow needs to be constrained, as shown in Table 3.
For the double bypass VCE studied in this research project, the following four equilibrium conditions need to be met when calculating the performance at the design point:
  • Iterative HPT guide vane cooling flow W c , HPT , st to meet the guide vane temperature error E T , HPT , st ;
  • Iterative HPT rotor blade cooling flow W c , HPT , rt to meet the rotor blade temperature error E T , HPT , rt ;
  • Iterative LPT guide vane cooling flow W c , LPT , st to meet the guide vane temperature error E T , LPT , st ;
  • Iterative LPT rotor blade cooling flow W c , LPT , rt to meet the rotor blade temperature error E T , LPT , rt .
The purpose of the above temperature error is to ensure that the blade temperature T bld calculated using the turbine-blade cooling model described in Section 2.1 meets the requirements of the blade temperature control value T bld , lmt . However, if T bld , lmt is large, T bld still cannot reach T bld , lmt even with the cooling flow at zero. To solve this problem, considering the leakage of cooling airflow, in this research project, the cooling airflow is limited to be greater than 1%, and this is combined with the cooling airflow to construct the combined temperature error. Taking the HPT guide vane temperature as an example, the combined temperature error is calculated as follows:
E T , HPT , st = T bld T bld , lmt T bld , lmt 2 × W c , HPT , st 1 2 ,
It can be seen from Equation (7) that the equation can be made into E T , HPT , st = 0 when T bld = T bld , lmt or W c , HPT , st = 1 . When the Newton–Raphson iteration algorithm is used to solve the multi-solution problem, a larger value needs to be selected as the initial value of W c , HPT , st . With this value in place, the Newton–Raphson algorithm will give priority to finding the global optimal solution corresponding to T bld = T bld , lmt in the iterative solution.

2.2.2. Air System Cooling Airflow Solution and Control Technology at Off-Design Point

For the performance simulation of the off-design point, it is necessary to solve the iteration variables of each component to satisfy the flow continuity, static pressure balance, and power balance among the components. Table 4 shows the iteration variables and error variables of the VCE in double and single bypass modes using the CSCT. In the table, the β value of the fan, compressor, and turbine is an auxiliary interpolation variable that is used to determine the position of the working point on the constant rpm line of the characteristic maps, which ranges from zero to one. The error variable in Table 4 denotes the relative error of the same physical quantity calculated using the two methods. The calculation formula for the turbine blade temperature error is the same as that at the design point.
In the double bypass mode, both the fan and CDFS belong to the fan component type, so the number of fan components is two. In the single bypass mode, the fan BPR is zero, and the fan is equivalent to a low-pressure compressor (LPC). At this time, only the CDFS belongs to the fan component type, so the number of fan components is one and the number of compressor components is two. In addition, in the single bypass mode, F-VABI does not require airflow mixing, which is equivalent to their being a duct, so the number of VABI components is one.
It can be seen from Table 4 that the number of iteration variables is one higher than the number of error variables in any working mode. An additional iteration variable is used as a control variable, and its value is known when performing the off-design point performance calculation. The total number of remaining iteration variables is equal to the total number of error variables, and the closed nonlinear equations are formed. The Newton–Raphson algorithm is used for the iterative solution. When the sum of squares of all error variables is less than 10−8, the non-design point calculation is considered to be convergent.

3. Results and Discussion

3.1. Design Point Cycle Performance Analysis

This paper discusses the analysis of the impact of CMC turbine blades on the design point cycle performance of the VCE when adopting different turbine inlet temperatures. According to references [8] and [18], in this research project, the thermal limit for superalloy turbine blades is set at 1350 K, that for CMC turbine guide vanes is set at 1530 K, and that for rotor blades is set at 1550 K. Table 5 presents five turbine blade schemes using different materials, with the blade structures being identical across the schemes and only the blade thermal limits and comprehensive cooling efficiencies differing. The comprehensive cooling efficiency for the superalloy is calculated using the characteristics from Figure 5, while that for the CMC is calculated using the characteristics from Figure 4. The calculated changes in the air system cooling airflow, turbine performance parameters, and overall performance parameters of the VCE with the alteration of the turbine inlet temperature and the thermal limits of the turbine blades are illustrated in Figure 8, Figure 9 and Figure 10.
As can be seen from Figure 8e, as the thermal limit of the turbine blades increases, the relative cooling airflow used for the turbine blades is significantly reduced. Scheme P5, which fully utilizes CMC turbine blades, reduces the relative cooling airflow by approximately 10% compared to Scheme P1, which fully utilizes superalloy turbine blades. Before the turbine inlet temperature reaches 2100 K, the cooling airflow of Scheme P5 and that of Scheme P4 are almost equal. This is because, at this turbine inlet temperature, the temperature of the LPT rotor blades has not yet reached the 1350 K limit of Scheme P4, so the LPT rotor cooling air can be set to the minimum value (as can be seen in Figure 8d). From Figure 8a, it can be observed that at high turbine inlet temperatures, the change in the cooling airflow for Scheme P1 is relatively small. This is because the comprehensive cooling efficiency of the turbine blades is simultaneously affected by the TR and the MFR. Hence, when the gas temperature changes linearly, the cooling airflow is not linearly variable. Furthermore, as shown in Figure 8a–d, the increase in the thermal limit of the front turbine blades raises the gas temperature at the outlet of this component, which, in turn, leads to an increase in the cooling airflow for the turbine blades located downstream of this component.
Figure 9 illustrates the variation patterns of turbine performance parameters for different turbine inlet temperatures and turbine blade schemes. As the thermal limit of the turbine blades increases, the cooling airflow to the turbine guide vanes decreases. This reduces the negative impact of the cooling airflow on the turbine’s isentropic efficiency, as shown in Figure 9a,b. As shown in Figure 9a, since the HPT cooling airflows of Scheme P4 and Scheme P5 are similar to that of Scheme P3, the efficiency variation curves of the three schemes almost overlap. Furthermore, the increase in the thermal limit of the turbine guide vanes allows for an increase in the turbine rotor inlet gas temperature, which, in turn, leads to a reduction in the turbine pressure ratio, as shown in Figure 9c,d.
As can be seen from Figure 10, the net thrust of the VCE increases with the improvement of the turbine blades thermal limit. This is due to the reduction in the cooling airflow of the air system, which leads to an increase in the airflow rate participating in combustion. Compared to Scheme P1, Scheme P5 can increase the net thrust by 6.07–7.98%. Table 6 shows the increase in the net thrust of the VCE compared to the previous scheme as the thermal limit of the turbine blades is improved. Combining Figure 10 with Table 6, it is evident that Schemes P2 and P3, which use CMC for the HPT guide vane and rotor blade, result in a larger increase in the net thrust, with average increases of 2.22% and 2.38%, respectively. In contrast, the average net thrust increase in Scheme P5 compared to that of Scheme P4 is only 0.5%. At low turbine inlet temperatures, since the cooling airflow of Scheme P5 is similar to that of Scheme P4, the net thrusts are also almost identical. Due to the relatively lower gas temperature at the inlet of the LPT rotor, superalloy turbine blades can withstand. Thus, the performance benefit gained by adopting CMC rotor blades at the design point is small.

3.2. Off-Design Point Performance Analysis

In this research project, the design point turbine inlet temperature of 2400 K is taken as an example to conduct a VCE off-design performance analysis using CSCT. With the exception of the turbine inlet temperature, all other design parameters are selected according to Table 1. In this research project, the cooling airflow scheme obtained as described in Section 3.1 is used as the fixed cooling air scheme for the VCE, and the performance benefits introduced by the CSCT for typical working points are compared. The typical working points include two conditions: subsonic cruise (H = 11,000 m, Ma = 0.9) and supersonic cruise (H = 15,000 m, Ma = 2). Table 7 shows the impact of using the CSCT on the net thrust of the VCE for the condition of ensuring constant fuel flow at the off-design points for the five turbine blade schemes discussed in Section 3.1.
As can be seen from Table 7, after adopting the off-design point CSCT, all five turbine blade schemes can produce an increase in the net thrust. In the subsonic cruise condition, the net thrust increases by 2.50–4.23%, and in the supersonic cruise condition, the net thrust increases by 3.75–5.43%. Scheme P2 yields the largest increase in net thrust, with the net thrust increased by 4.23% in the subsonic cruise condition and by 5.43% in the supersonic cruise condition. This is because the range of cooling airflow variation decreases as the thermal limit of the turbine blades is sequentially increased, and the resulting increase in net thrust is smaller. In addition, the larger the cooling airflow is, the smaller its contribution to the improvement of the cooling efficiency is. The cooling airflow of Scheme P1 is large, and the change in cooling airflow caused by the change in gas temperature is less than that of Scheme P2. Therefore, overall, Scheme P2 yields the greatest performance benefits by adopting the off-design point CSCT.
For off-design conditions, it is generally required that the specific fuel consumption (SFC) should be as low as possible, while the thrust only needs to meet the demand. Therefore, in this research project, the impact of using the CSCT on the SFC of the VCE with the five turbine blade schemes is studied for the condition of ensuring constant thrust at the off-design points, as shown in Table 8. It can be seen from the table that the adoption of the off-design point CSCT can reduce the SFC by 3.06–5.20% in the subsonic cruise condition and by 4.01–5.73% in the supersonic cruise condition. Similarly, Scheme P2 yields the greatest benefit in terms of the SFC.
The integration of the analysis of the design and off-design point performance shows that for a VCE with high turbine inlet temperatures, it is preferable to use CMC for the HPT guide vanes, HPT rotor blades, and LPT guide vanes. For the LPT rotor blades, which are subjected to relatively lower gas temperatures, either CMC or single-crystal superalloys can be selected.

4. Conclusions

In this research project, the comprehensive cooling-efficiency characteristics of CMC turbine blades are determined through a fluid–solid coupling calculation, a computational model for turbine-blade cooling is established, and CSCT for an air system is developed. The performance advantages of a VCE with CMC turbine blades are analyzed. A VCE that fully adopts CMC turbine blades can reduce the design point air system cooling airflow by approximately 10% and increase the net thrust by 6.07–7.98%. The use of CMC for HPT guide vanes and rotor blades significantly enhances the design point net thrust, with average increases of 2.22% and 2.38%, respectively. The inlet gas temperature of the LPT rotor blades is relatively low, and CMC is not the only option available. By employing the CSCT, the SFC can be reduced by 3.06–5.20% in the subsonic cruise condition and by 4.01–5.73% in the supersonic cruise condition. A comprehensive analysis indicates that the scheme using CMC for HPT guide vanes, rotor blades, and LPT guide vanes yields noticeable performance improvements.
In subsequent research, a CMC turbine-blade cooling experiment will be carried out to further verify the effectiveness of the turbine-blade cooling-efficiency calculation model established in this research project. Then, considering the structure of turbine blades, a more refined study will be conducted on the impact of different CMC turbine blades on performance. Finally, for the entire flight envelope, the performance benefits produced by CSCT will be analyzed.

Author Contributions

Conceptualization, B.L., S.H., X.Z. and Z.W.; methodology, B.L., H.Y. and K.D.; software, B.L. and H.Y.; validation, B.L., S.H. and K.D.; formal analysis, B.L. and X.Z.; investigation, B.L. and S.H.; resources, B.L., S.H., X.Z. and Z.W.; data curation, B.L. and H.Y.; writing—original draft preparation, B.L.; writing—review and editing, S.H., H.Y., X.Z., K.D. and Z.W.; visualization, B.L. and S.H.; supervision, S.H., X.Z. and K.D.; project administration, S.H. and X.Z.; funding acquisition, S.H. and X.Z. All authors have read and agreed to the published version of the manuscript.

Funding

This research project was funded by the Science Center for Gas Turbine Project (grant number P2022-DC-I-002-001), the Open Topic Project (No. CEPE2020011) and the National Science and Technology Major Project of China (No. J2019-I-0021-0020).

Data Availability Statement

The data that support the findings of this study are available from the corresponding author upon reasonable request.

Conflicts of Interest

Author Sheng Huang was employed by the company Sichuan Gas Turbine Establishment. The remaining authors declare that the research was conducted in the absence of any commercial or financial relationships that could be construed as a potential conflict of interest.

References

  1. Murthy, S.N.; Curran, E.T. Variable cycle engine developments at general electric 1955–1995. In Developments in High-Speed Vehicle Propulsion Systems (Progress in Astronautics and Aeronautics); AIAA: Reston, VA, USA, 1996; Volume 165, pp. 105–158. [Google Scholar]
  2. Sanghi, V. Impact of a Variable Cycle Engine on Conceptual Aircraft Sizing. Int. J. Turbo Jet Eng. 2003, 20, 83–94. [Google Scholar] [CrossRef]
  3. Aygun, H.; Turan, O. Exergetic sustainability off-design analysis of variable-cycle aeroengine in various bypass modes. Energy 2020, 195, 1–17. [Google Scholar] [CrossRef]
  4. Zhang, J.; Tang, H.; Chen, M. Robust design of an adaptive cycle engine performance under component performance uncertainty. Aerosp. Sci. Technol. 2021, 113, 1–21. [Google Scholar] [CrossRef]
  5. Xu, L.; Sun, Z.; Ruan, Q.; Xi, L.; Gao, J.; Li, Y. Development Trend of Cooling Technology for Turbine Blades at Super-High Temperature of above 2000 K. Energies 2023, 16, 668. [Google Scholar] [CrossRef]
  6. Su, L. Precooling Turbine Cooling Air for Aviation Engines. Master’s Thesis, Shenyang Aerospace University, Shenyang, China, 2018. [Google Scholar]
  7. Mulla, J.; Satpathy, R.K.; Kaka, F. Conjugate Heat Transfer Approach to Gas Turbine Engine Modeling. In Proceedings of the ASME 2023 Gas Turbine India Conference, Bangalore, India, 7–8 December 2023. [Google Scholar]
  8. Du, K.; Chen, Q.; Meng, X.; Wang, L.; Pei, X.; Jiao, Y.; Li, H.; Liu, C. Advancement in Application and Thermal Analysis of Ceramic Matrix Composites in Aeroengine Hot Components. J. Propuls. Technol. 2022, 43, 210380. [Google Scholar]
  9. Karadimas, G.; Salonitis, K. Ceramic Matrix Composites for Aero Engine Applications—A Review. Appl. Sci. 2023, 13, 3017. [Google Scholar] [CrossRef]
  10. Shi, D.; Wang, Z.; Liu, C.; Zhang, W.; Chen, M.; Yang, X. Conceptual design of ceramic matrix composites turbine blade for typical turbofan engine. J. Aerosp. Power 2023, 38, 431–444. [Google Scholar]
  11. Okita, Y.; Mizokami, Y.; Hasegawa, J. Erosion Testing of Environmental Barrier-Coated Ceramic Matrix Composite and Its Behavior on an Aero-Engine Turbine Vane Under Particle-Laden Hot Gas Stream. J. Turbomach. 2020, 142, 061001. [Google Scholar] [CrossRef]
  12. Tu, Z. Investigation of CMC’s Thermal Conduction Mechanism and Its Application in Thermal Analysis for Turbine Vane. Ph.D. Dissertation, Nanjing University of Aeronautics and Astronautics, Nanjing, China, 2018. [Google Scholar]
  13. Sun, Z.; Lyu, D.; Zhu, K.; Liu, Y.; Kong, X. Thermal protection of turbine guide vane with ceramic matrix composite armor. J. Propuls. Technol. 2024, 45, 2208020. [Google Scholar]
  14. Boyle, R.J.; Gnanaselvam, P.; Parikh, A.H.; Ameri, A.A.; Bons, J.P.; Nagpal, V.K. Design of Stress Constrained SiC/SiC Ceramic Matrix Composite Turbine Blades. J. Eng. Gas Turbines Power 2021, 143, 051013. [Google Scholar] [CrossRef]
  15. Langenbrunner, N.B.; Weaver, M.; Dunn, M.G.; Padova, C.; Barton, J. Dynamic Response of a Metal and a CMC Turbine Blade During a Controlled Rub Event Using a Segmented Shroud. J. Eng. Gas Turbines Power. 2015, 137, 062504. [Google Scholar] [CrossRef]
  16. Boyle, R.J.; Parikh, A.H.; Halbig, M.C.; Nagpal, V.K. Design Considerations for Ceramic Matrix Composite Vanes for High Pressure Turbine Applications. In Proceedings of the ASME Turbo Expo 2013: Turbine Technical Conference and Exposition, San Antonio, TX, USA, 3–7 June 2013. [Google Scholar]
  17. Boyle, R.J.; Parikh, A.H. Design Concepts for Cooled Ceramic Composite Turbine Vane; NASA/CR-2015-218390; NASA: Washington, DC, USA, 2015. [Google Scholar]
  18. Zheng, H.; Su, Z.; Huang, X.; Li, Y. Thermal Cycle Analysis of Turboprop with Ceramic Matrix Composite Based on Multiple Design Points Approach. J. Propuls. Technol. 2021, 42, 1–9. [Google Scholar]
  19. Yao, Y.; Wang, Z.; Zhang, X.; Gui, F. Modeling Method and Cycle Analysis of High-Speed Gas Turbine Engine with CCA Technology. J. Aerosp. Power 2023, 38, 1378–1390. [Google Scholar]
  20. Hao, W.; Wang, Z.; Zhang, X. Mode Transition Modeling and Control Law Design Method of Variable Cycle Engine. J. Propuls. Technol. 2022, 43, 210058. [Google Scholar]
  21. Jiang, Y.; Xu, Y.; Zhang, J.; Dong, X.; Zheng, J.; Chen, M. Preliminary Performance Research of Rapid Thrust Change Transient Process on an Adaptive Cycle Engine. J. Propuls. Technol. 2024, 45, 2307012. [Google Scholar]
  22. Zhang, M.; Wang, Z.; Liu, Z.; Zhang, X. Analysis of Mode Transition Performance for a Tandem TBCC Engine. In Proceedings of the 52nd AIAA/SAE/ASEE Joint Propulsion Conference, Salt Lake City, UT, USA, 25–27 July 2016. [Google Scholar]
  23. Zhou, H. Investigation on the Variable Cycle Engine Characteristics and Integration Design with Aircraft. Ph.D. Dissertation, Northwestern Polytechnical University, Xi’an, China, 2016. [Google Scholar]
  24. Hao, W.; Wang, Z.; Zhang, X.; Zhou, L. Acceleration Technique for Global Optimization of a Variable Cycle Engine. Aerosp. Sci. Technol. 2022, 129, 107792. [Google Scholar] [CrossRef]
  25. Ye, Y.; Wang, Z.; Zhang, X. Sequential Ensemble Optimization Based on General Surrogate Model Prediction Variance and Its Application on Engine Acceleration Schedule Design. Chin. J. Aeronaut. 2021, 34, 16–33. [Google Scholar] [CrossRef]
  26. Ye, Y.; Wang, Z.; Zhang, X. Cascade Ensemble-RBF-Based Optimization Algorithm for Aero-Engine Transient Control Schedule Design Optimization. Aerosp. Sci. Technol. 2021, 115, 106779. [Google Scholar] [CrossRef]
  27. Torbidoni, L.; Massardo, A.F. Analytical Blade Row Cooling Model for Innovative Gas Turbine Cycle Evaluations Supported by Semi-Empirical Air-Cooled Blade. J. Eng. Gas Turbines Power 2004, 126, 109–120. [Google Scholar] [CrossRef]
  28. Consonni, S. Performance Prediction of Gas/Steam Cycles for Power Generation. Ph.D. Dissertation, Princeton University, Princeton, NJ, USA, 1992. [Google Scholar]
  29. Young, J.B.; Wilcock, R.C. Modeling the Air-Cooled Gas Turbine Part 2 Coolant Flows and Losses. J. Turbomach. 2002, 124, 214–221. [Google Scholar] [CrossRef]
  30. Du, K.; Yan, H.; Chen, L.; Li, P.; Liu, C.; Sunden, B. Conjugate heat transfer performance of a ceramic matrix composite plate considering the influences of the mesoscopic properties of yarns. Int. Commun. Heat Mass. 2024, 159, 108121. [Google Scholar] [CrossRef]
  31. Niu, J.; Liu, C.; Liu, H.; Xiao, X.; Lin, J. Theoretical and Experimental Analysis of Overall Cooling Effectiveness for Afterburner Double-Wall Heat Shield. Int. J. Heat Mass Transf. 2021, 176, 121360. [Google Scholar] [CrossRef]
  32. Lefebvre, H.; Ballal, D.R. Gas Turbine Combustion: Alternative Fuels and Emissions, 3rd ed.; CRC Press: Boca Raton, FL, USA, 2010. [Google Scholar]
  33. Gauntner, J.W. Algorithm for Calculating Turbine Cooling Glow and the Resulting Decrease in Turbine Efficiency; NASA/TM-1980-81453; NASA: Washington, DC, USA, 1980. [Google Scholar]
Figure 1. Schematic diagram of VCE structure.
Aerospace 11 00886 g001
Figure 2. Schematic diagram of the simulation model of the VCE.
Aerospace 11 00886 g002
Figure 3. CMC 2D woven plate structure diagram.
Aerospace 11 00886 g003
Figure 4. Comprehensive cooling-efficiency characteristics of CMC turbine blade. (a) TR is 2.5. (b) TR is 3.5.
Aerospace 11 00886 g004
Figure 5. Comprehensive cooling-efficiency characteristics of the superalloy turbine blade. (a) TR is 2.5. (b) TR is 3.5.
Aerospace 11 00886 g005
Figure 6. Schematic diagram of the total gas temperature distribution at the main burner outlet [32].
Aerospace 11 00886 g006
Figure 7. Iterative calculation process of VCE design point.
Aerospace 11 00886 g007
Figure 8. Relative cooling airflow for different turbine inlet temperatures and turbine blade schemes. (a) HPT guide vane. (b) HPT rotor blade. (c) LPT guide vane. (d) LPT rotor blade. (e) Total relative cooling airflow of turbine.
Aerospace 11 00886 g008aAerospace 11 00886 g008b
Figure 9. Turbine performance parameters for different turbine inlet temperatures and turbine blade schemes. (a) HPT efficiency. (b) LPT efficiency. (c) HPT pressure ratio. (d) LPT pressure ratio.
Aerospace 11 00886 g009aAerospace 11 00886 g009b
Figure 10. Net thrust of the VCE for different turbine inlet temperatures and turbine blade schemes.
Aerospace 11 00886 g010
Table 1. Design parameters of double bypass VCE.
Design ParameterValue
Fan inlet conversion flow (kg/s)130
Altitude (km)0
Inflow Mach number0
Fan pressure ratio3.3
Fan bypass ratio0.5
CDFS pressure ratio1.18
CDFS bypass ratio0.6
HPC pressure ratio5
Burner outlet total temperature (K)1900
Table 2. Turbine stator and rotor stage efficiency loss factors [32].
Cooling ConfigurationConvection Cooling Ratio α Loss in Stage Efficiency
Stator   f st Rotor   f rt
Advanced conv1.00.10.2
Film with conv 10.750.120.24
Film with conv 20.50.150.3
Film with conv 30.250.180.36
Full cover film00.350.8
Note: The conv is the abbreviation for convection, α is the proportion of cooling air involved in internal convection heat transfer, and f st and f rt are the efficiency loss coefficients of turbine guide vanes and rotors, respectively.
Table 3. Upper and lower limits of iteration variable of the design point performance simulation model.
Iteration VariableLower LimitUpper Limit
HPT   guide   vane   cooling   flow   W c , HPT , st 120
HPT   rotor   blade   cooling   flow   W c , HPT , rt 115
LPT   guide   vane   cooling   flow   W c , LPT , st 115
LPT   rotor   blade   cooling   flow   W c , LPT , rt 110
Note: W c , HPT , st , W c , HPT , rt , W c , LPT , st , and W c , LPT , rt represent the percentages of the cooling airflow at the respective extraction positions, with the units given in percentages.
Table 4. Iteration variables and error variables of the VCE model.
Component TypeIteration VariableError VariableThe Number of Components
Double Bypass ModeSingle Bypass Mode
Inlet β value-11
Fan β value, BPRMass flow21
Compressor β valueMass flow12
BurnerOutlet temperature-11
Turbine β valueMass flow22
VABI-Static pressure21
Nozzle-Mass flow11
ShaftPhysical speedPower22
Air systemCooling flowTurbine blade temperature44
Total number of iteration variables1514
Total number of error variables1413
Total number of control parameters11
Note: BPR is the abbreviation of the bypass ratio, and the β value of the inlet is equal to the ratio of the corrected mass flow to the corrected mass flow at the design point.
Table 5. Turbine blade thermal limit for different schemes.
ParameterScheme Number
P1P2P3P4P5
T HPT , st 13501530153015301530
T HPT , rt 13501350155015501550
T LPT , st 13501350135015301530
T LPT , rt 13501350135013501550
Table 6. Relative increase in the net thrust for different schemes.
SchemeNet Thrust Increase Percentage (%)
RangeAverage
P21.10–3.312.22
P32.15–2.672.38
P41.40–1.971.69
P50–1.400.50
Table 7. Net thrust benefit introduced by the CSCT.
SchemeNet Thrust Increase Percentage (%)
Subsonic CruiseSupersonic Cruise
P14.063.75
P24.235.43
P33.404.80
P43.244.94
P52.504.11
Table 8. SFC benefit produced by the CSCT.
SchemeNet Thrust Increase Percentage (%)
Subsonic CruiseSupersonic Cruise
P14.944.01
P25.205.73
P34.154.72
P43.944.78
P53.064.04
Disclaimer/Publisher’s Note: The statements, opinions and data contained in all publications are solely those of the individual author(s) and contributor(s) and not of MDPI and/or the editor(s). MDPI and/or the editor(s) disclaim responsibility for any injury to people or property resulting from any ideas, methods, instructions or products referred to in the content.

