Abstract
In this paper, the flow characteristics of a continuous-type liquid–liquid pintle injector are described, focusing on the differential impact of a non-uniform center-flow distribution on single- and bi-injection methodologies as well as the cavitation effect on the spray angle. Using cold-flow experiments, jet-type flows of the center propellant caused by a non-uniform flow distribution were observed during a single injection. This resulted in an augmented pressure drop, as opposed to the flow characteristics of uniform single-film injection. By contrast, bi-injection modalities exhibited a substantial reduction in the pressure drop of the center propellant, underscoring a more equitable flow distribution. Moreover, the occurrence of cavitation in the center propellant was found to markedly affect the spray angle. By considering the injection exit area reduction caused by cavitation, the spray-angle prediction accuracy increased. The findings of this study are expected to reveal the interplay between flow distribution and pressure drop as well as that between cavitation and the spray angle in pintle injectors. Through this understanding, this study provides crucial considerations for the development of more efficient propulsion systems.
1. Introduction
Pintle injectors feature a radially injected center propellant and an axially injected outer propellant impinging upon each other, leading to atomization. The injection velocity can be increased by adjusting the propellant exit area to achieve effective atomization even at low thrust levels, which is advantageous for deep throttling [1]. This was demonstrated by the lunar lander of the APOLLO program, SpaceX’s Falcon 9 rocket, and the Chang’e 3 lunar lander of the China National Space Administration [2,3,4]. More recently, the Korea Aerospace Research Institute investigated a variable-area pintle injector engine as the first-stage engine for its next-generation launch vehicle [5,6], and Galactic Energy in China has been developing a gas-generator cycle engine with a variable-area pintle injector [7].
Pintle injectors are typically categorized into slot-type and continuous-type designs. Slot-type pintle injectors, featuring one or two rows of slots as the exit orifice for the center propellant, are more commonly used than continuous-type injectors, which utilize a single continuous slit. Nevertheless, continuous-type variable-area pintle injectors have found applications such as in the MIRA 150A engine developed for the vernier engine of the Surveyor spacecraft [8,9]. Pintle injectors have also been adopted in fixed-thrust engines. The TR201 engine, a low-cost fixed-thrust variant of the Lunar Module Descent Engine (LMDE), was used to power the second stage of the Delta rocket series [10]. Furthermore, the TR308 (AC-LAE) engine, which propels the Chandra X-ray Observatory, features a fixed-area pintle injector that combines both continuous- and slot-type pintle tips [11].
Despite the wide range of pintle injector applications, only a few reports exist on liquid–liquid pintle injector design; this gap has prompted studies on the spray characteristics of liquid–liquid pintle injectors. Cheng et al. [12] derived a predictive expression for the spray angle based on the total momentum ratio (TMR) of two propellants through the analytical analysis of a continuous-type pintle injector; this was validated via experiments and numerical analyses. Furthermore, they revealed that the collision of the two propellants resulted in the formation of a local high-pressure region near the exit of the center propellant. In addition, Cheng et al. [13] extended the predictive expression for the spray angle to slot-type pintle injectors using the local momentum ratio (LMR), which considers only the interaction between the center propellant injected from individual slots and the outer propellant colliding with it. Chen et al. [14] also investigated the spray pattern, spray angle, droplet velocity, and size distribution based on the LMR. Blakely et al. [15] compared spray-angle variations with respect to the geometry and number of slots in the pintle tip; however, they observed no significant differences. Zhao et al. [16] derived an LMR-based spray-angle predictive expression that considered the effect of drag by the axial flow as the radial jet was injected from the slot and, through experiments, confirmed its high accuracy compared with that yielded by another expression that only considered the LMR. Ninish et al. [17] confirmed that high TMR values in a continuous-type pintle injector resulted in a better atomization performance owing to the decreased liquid film thickness and wavelength. They also found that the liquid film thickness and Weber number significantly affected the generation of instability waves and droplet size distribution.
Zhou et al. [18] classified the spray patterns of a slot-type pintle injector into three categories and analyzed the dynamic characteristics and velocity distribution for each pattern. Lee et al. [19] categorized the liquid film breakup patterns of a continuous-type pintle injector into three modes and examined the effects of radial and axial flows on the spray characteristics. He et al. [20] conducted a numerical analysis of the jet film collision of a slot-type pintle injector to determine the distribution of the Sauter mean diameter and Voronoi volume. Their results indicated that utilizing a jet film injection at high thrust levels and a jet–jet injection at low thrust levels enabled the maintenance of consistent spray angles and droplet distributions across all thrust levels. Teuffel et al. [21] compared the spray angle and droplet size for water–water and mixture–water injections and found that the simulant viscosity had a significant effect on droplet size, while its effect on the spray angle was small.
Although liquid–liquid pintle injectors have been extensively studied, the diverse configurations of pintle injectors used in these studies resulted in a relatively low spray-angle prediction accuracy compared with other injector types such as impinging and swirl injectors. Therefore, further research is needed to enhance our understanding of the flow and spray characteristics of propellants in pintle injectors.
In this study, a liquid–liquid fixed-area pintle injector with interchangeable pintle tips was designed. Cold-flow experiments were conducted using a continuous-type pintle tip, and the results indicated that the center propellant was non-uniformly injected during a single injection. Non-uniform propellant injection can become a significant issue during the testing and evaluation of injectors and must be avoided. To address this, a deeper understanding of non-uniform flow behavior in pintle injectors is essential. However, studies on this topic are scarce. To evaluate the impact of single-injection non-uniformity on flow characteristics during bi-injection, the flow characteristics of single and bi-injections were compared using high-speed close-up imaging, a technique applied for the first time in the study of pintle injector flow phenomenology.
2. Materials and Methods
2.1. Pintle Injector Design
The geometric parameters of the pintle injector used in this study are shown in Figure 1. The pintle injector was designed for a 500 N-class monomethylhydrazine/dinitrogen tetroxide bi-propellant thruster, with the fuel selected as the center propellant for film cooling based on a previous study of a TR308 engine [11]. As shown in Figure 2, this injector was designed with the capability to adjust the skip length (Ls) and pintle tip type through part replacements. The pintle tip used in this study was manufactured using the selective laser melting method. To meet the design specifications, additional machining processes were applied to adjust the continuous slit height (H) and remove burrs from the edges. The H value of the pintle tip was determined based on the TMR defined in Equation (1). The TMR significantly impacts the performance of a pintle injector, and liquid–liquid pintle injectors are known to achieve optimal performance when the TMR value approaches unity [22].
where is the mass flow rate, V is the velocity, and the subscripts i and o denote the inner and outer propellants, respectively.
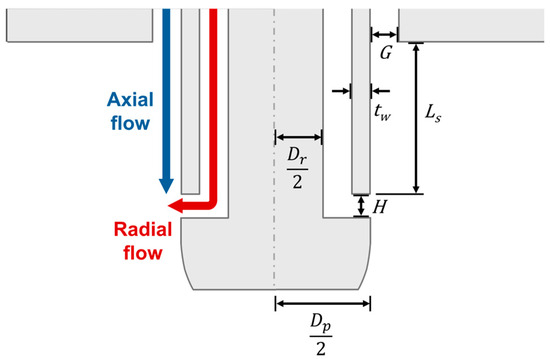
Figure 1.
Schematic of a pintle injector depicting its geometric parameters.
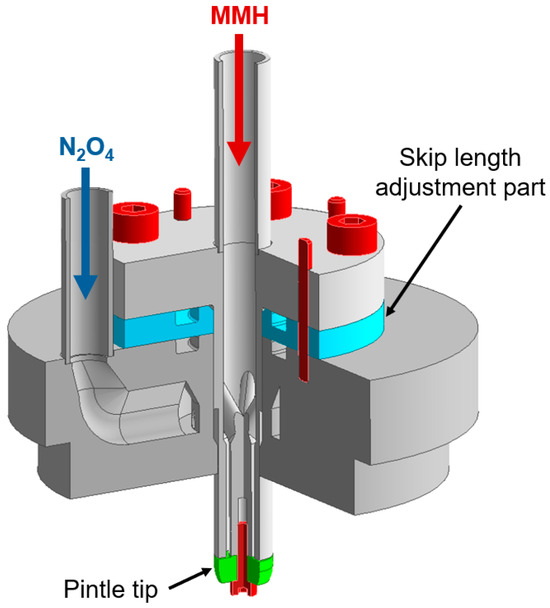
Figure 2.
Schematic of the sectional view of the pintle injector.
Although the H value that satisfies the TMR value of unity is approximately 0.12 mm, it was expected that manufacturing slot-type pintle tips with the same exit area as that of a continuous-type tip for future comparisons would be challenging. Therefore, the H value was set to 0.20 mm, resulting in a TMR of 0.618. The spray angle (2θ) at nominal flow rates was calculated to be 104° using Equation (2), following Cheng et al. [12]. Table 1 presents the geometric parameter values for the injector.

Table 1.
Geometric parameters of the pintle injector.
2.2. Experimental Setup
The experimental setup for capturing backlit spray images of the pintle injector is shown in Figure 3. A xenon lamp (PS-PH50D, Polarion, Alameda, CA, USA) was used as the light source, while a high-speed camera (Fastcam Mini UX100, Photron, Tokyo, Japan) with a lens (AF Micro Nikkor 105 mm f/2.8D, Nikon, Tokyo, Japan) was used to capture the spray images at a rate of 8000 fps, with an exposure time of 5 μs. Additionally, a camcorder (FDR-AX700, Sony, Tokyo, Japan) was employed to capture the overall spray pattern. Water was chosen as the simulant for both the center and outer propellants, supplied to the experimental stand from a water tank pressurized to a constant pressure. The water flow rate corresponding with each propellant was individually regulated using needle valves and measured using a mass flow meter (KMS-2000, Kometer, Incheon, Republic of Korea; uncertainty: ±0.1%). The water temperature and pressure were measured using a K-type thermocouple (Sentech, Bucheon, Gyeonggi, Republic of Korea; uncertainty: ±1.5 K) and pressure transducers (PSH-5B, Sensys, Ansan, Gyeonggi, Republic of Korea; uncertainty: ±0.15%), respectively.
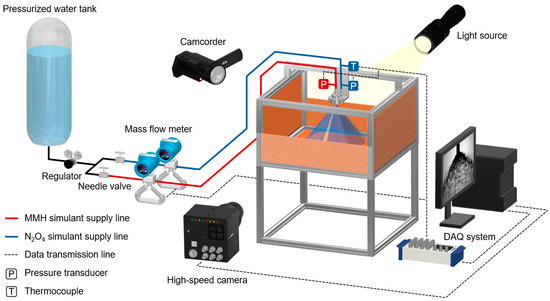
Figure 3.
Experimental setup for high-speed backlit image acquisition and camcorder videography.
The experimental setup for capturing high-speed close-up images of the center propellant as it was injected from the slit exit is shown in Figure 4. A diode-pumped solid-state laser module (532 nm; RGBLase) with an optical lens in front was used to irradiate the sheet laser at the center-propellant exit of the pintle injector. A high-speed camera equipped with a long-distance microscope (K2 DistaMax, Infinity) featuring a close-focus lens attachment (CF-1 Objective, Infinity) was used to capture high-speed close-up images at a frame rate of 8000 fps, with an exposure time of 123.74 μs.
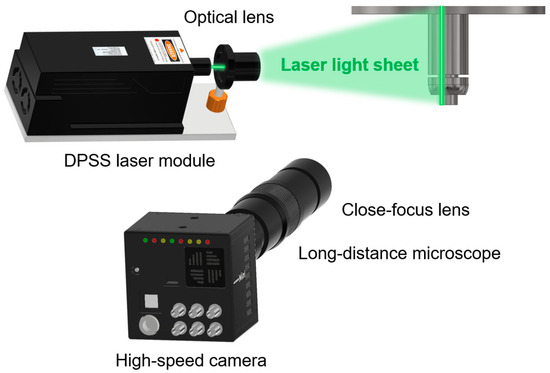
Figure 4.
Experimental setup for high-speed close-up image acquisition.
The image processing used to derive the spray angle from the captured backlit spray images is shown in Figure 5. Initially, 500 instantaneous grayscale images (Figure 5a) were averaged, and the brightness was normalized (Figure 5b). Subsequently, utilizing Otsu’s method [23], two thresholds were determined from the normalized image, dividing the image into three brightness regions (Figure 5c). A black color denoted the primary spray region, a gray color represented partial background areas and some droplets formed by instabilities in the liquid film, and a white color indicated the remaining background area. Finally, the image was binarized again (Figure 5d) to retain only the primary spray region, which was necessary to measure the spray angle. The spray angle was defined as the angle between the center axis and a straight line connecting each point in the spray region at distances 1.5 and 2 times the pintle post diameter (Dp) from the center axis, as shown in Figure 6.
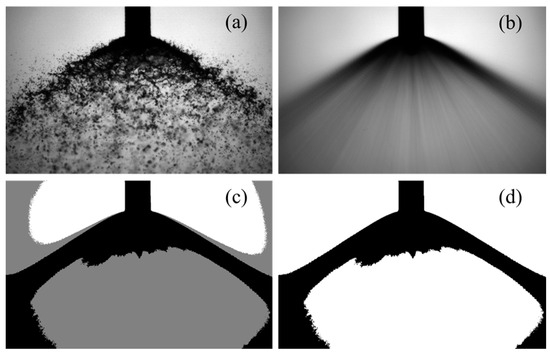
Figure 5.
Image processing steps for the spray -angle calculations.
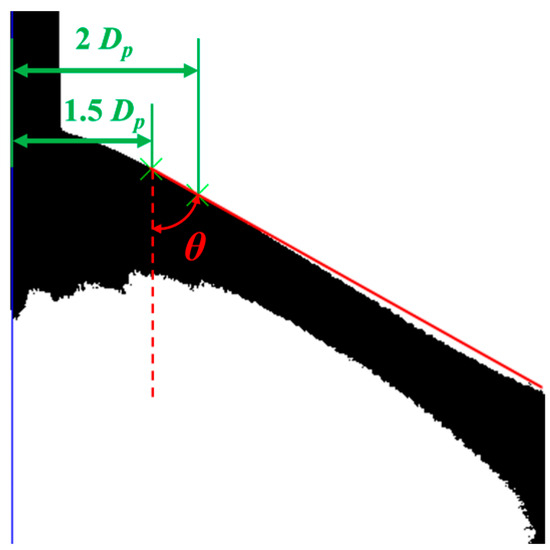
Figure 6.
Criteria for the spray-angle calculations.
2.3. Experimental Conditions
Cold-flow experiments were conducted under room temperature and atmospheric pressure conditions. The water flow rate at a 100% thrust level was set to match the actual propellant momentum ratio under nominal conditions. This flow rate was then divided into 10% intervals from 10% to 100% thrust levels, as detailed in Table 2. The center-propellant single- and bi-injection experiments were performed under both “upward” and “downward” flow conditions, with flow rates increasing by 10% from 10% to 100% and subsequently decreasing from 100% to 10%. For the outer propellant, which is rarely affected by bi-injection, only a single-injection experiment was conducted under the upward condition. The data obtained at the 10% thrust level were excluded from the analysis to eliminate any measurement error. Additionally, the cold-flow tests were repeated three times, with the same trend observed in each instance.

Table 2.
Experimental conditions for the cold-flow tests.
3. Results and Discussion
3.1. Single-Injection Experiment
The measured injection pressure drop (Δp) relative to the atmospheric pressure and the calculated discharge coefficient (Cd) using Equation (3) for a single injection are shown in Figure 7.
where A is the propellant exit area and ρ is the density. Under the downward-flow condition from the 100% to 40% thrust levels of the center propellant, the flow patterns were the same as those of the upward-flow condition. However, at the 30% thrust level, Δp was higher; therefore, Cd was lower than that observed under the upward-flow condition. The camcorder video images in Figure 8 show that the flow pattern transitioned from a liquid film to jets as the thrust level increased from 30% to 40% under the upward-flow condition. Conversely, under the downward-flow condition, a hysteresis condition was observed where the existing jets were maintained when the thrust level decreased from 40% to 30%.
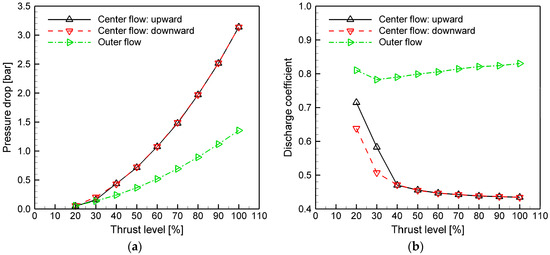
Figure 7.
Single-injection results for (a) Δp and (b) Cd.
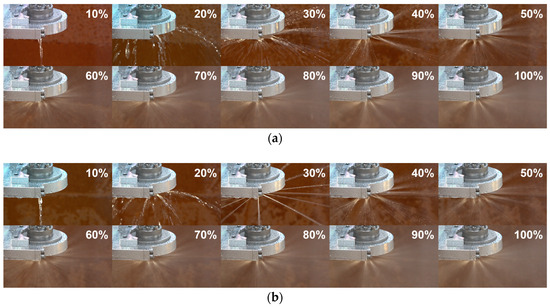
Figure 8.
Camcorder video images of the flow pattern according to thrust level (indicated as % in the images) during center-propellant single injection under (a) upward- and (b) downward-flow conditions.
To directly observe the flow pattern as the center propellant was injected from the exit, a high-speed imaging technique using a long-distance microscope and a laser sheet was adopted, as shown in Figure 4. Using this technique, high-speed close-up images of center-propellant injection under upward single-injection conditions could be captured, which are presented in Figure 9. As shown in these images, the center propellant was injected as a film until the thrust level reached 30%. Above the 30% thrust level, the flow pattern transitioned from a film to jets. However, for the center propellant to be injected as jets rather than a film is considered abnormal in a continuous-type pintle injector. This implied that non-uniformity occurred in the process where the center propellant was injected through an exit with a very thin height of 0.2 mm.
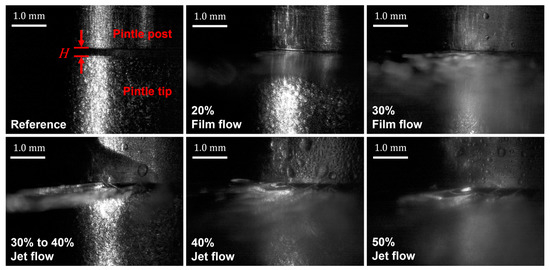
Figure 9.
High-speed close-up images of the flow pattern according to thrust level (indicated as %) during upward center-propellant single injection.
3.2. Bi-Injection Experiment
The Δp and Cd of each propellant for bi-injection are shown in Figure 10. During bi-injection, the collision of two propellants leads to the formation of a local high-pressure zone near the orifice exit of the center propellant [12]. Therefore, it was expected that the Δp values of the center and outer propellants during bi-injection would be, respectively, higher than and the same as those in a single injection because the annular orifice exit of the outer propellant was farther from the collision zone. As anticipated, the results showed that the Δp and Cd of the outer propellant were almost identical to those during a single injection. However, the center propellant showed a lower Δp and higher Cd compared with a single injection. Furthermore, unlike the single injection, no differences in Δp and Cd were observed between the upward- and downward-flow conditions.
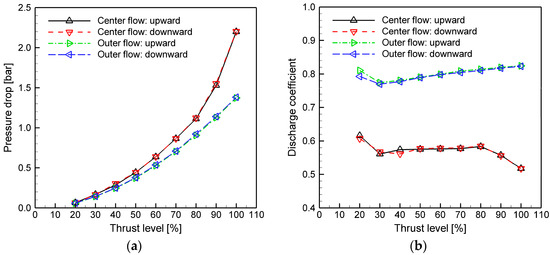
Figure 10.
Bi-injection results for (a) Δp and (b) Cd.
The backlit spray images captured during bi-injection are shown in Figure 11. Table 3 lists the TMR values derived experimentally, along with the spray angles calculated using Equation (2) and acquired from the captured spray images. At the 20% thrust level, the theoretical spray angle () exceeded the experimental value () due to the dominant influence of surface tension, as shown in Figure 11. The curved shape of the rear part of the spray at the 30% thrust level indicated that surface tension still played a significant role, while at the 40% thrust level, the spray image showed that the influence of surface tension became negligible. This implied that the hysteresis observed near the 30% threshold during the single injection, where the influence of surface tension became distinct, occurred due to the tendency of surface tension to maintain the existing flow pattern. From the 30% to 90% thrust levels, the theoretical values exhibited good agreement with the experimental values. However, starting from the 80% thrust level, a rapid decrease in Cd was observed. Additionally, at the 100% thrust level, the experimental spray angle significantly increased, exhibiting a deviation of 15° from the theoretical value. As this deviation could be attributed to cavitation, the cavitation number ( was calculated, as in Equation (4). The average value of the calculated for each thrust level is listed in Table 4.
where , , and are the upstream, downstream, and saturation pressures, respectively.
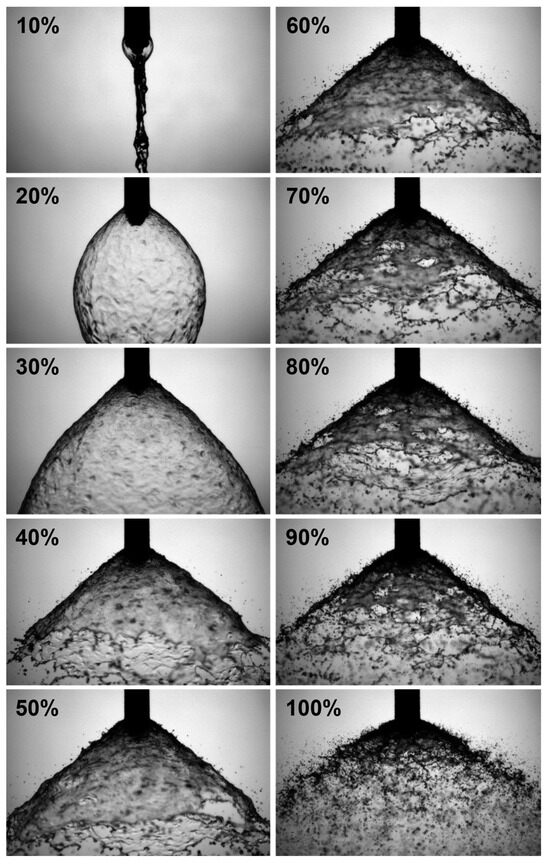
Figure 11.
Backlit spray images according to thrust level (indicated as %) during bi-injection.

Table 3.
Calculated spray angles based on the TMR and measured spray angles.

Table 4.
Cavitation number for the center propellant during bi-injection.
The center propellant underwent a 90° turn within the inner flow path just before entering the slit. This flow behavior resembled that presented in the experiment with a 90° sharp-edge orifice conducted by Nurick et al. [24], where cavitation inception occurred at a of approximately 1.8. When using a of 1.8 as a potential threshold for cavitation inception, it appeared that Cd started to decrease with the onset of cavitation as the thrust level increased from 80% to 90%. In this range, the dissolved gas released from water and vapor likely reduced the effective flow area within the slit, which affected the pressure drop. However, the spray angle remained constant at these thrust levels despite the occurrence of cavitation, indicating that the exit flow area for the center propellant was consistent with that at the lower thrust levels. This consistency was attributed to the reattachment of the liquid film within the slit, as shown in Figure 12a. As a result, the TMR remained unchanged. However, the rapid change in the spray angle at the 100% thrust level indicated that the cavitation intensity became stronger as decreased [25]. This eventually led to the hydraulic flip condition depicted in Figure 12b, altering the flow velocity at the outlet. Assuming that the flow area at the slit exit was equal to the effective flow area when the hydraulic flip occurred, and all of the measured Δp values were converted into a velocity head within the effective flow area, the exit velocity reflecting the reduced flow area at the slit exit using Cd was calculated based on Equation (5). The exit velocity was calculated to be 21.0 m/s at the 100% thrust level instead of 10.9 m/s. Subsequently, the actual TMR was recalculated to be 1.196 instead of the previous 0.619, resulting in a spray angle of 126°; thus, this computation exhibited higher accuracy compared with the previously discussed calculation. However, as this was based on the Cd value obtained from the experiment, further research on the relationship between the cavitation number and Cd in 90°-turn orifices with various length/diameter ratios is necessary to develop a more practical and widely applicable spray-angle prediction model.
where A is the propellant exit area and CdA is the exit flow area during the occurrence of hydraulic flip.
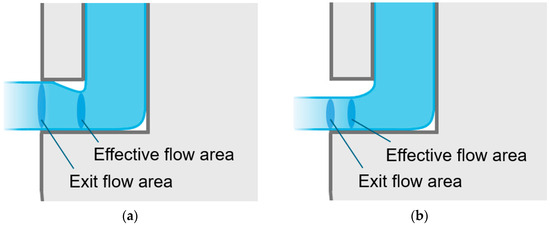
Figure 12.
Flow inside the center-propellant slit (a) before and (b) after hydraulic flip occurrence.
Additionally, was evaluated for the previous center-propellant single-injection results and the results are presented in Table 5. Despite Cd gradually decreasing as the thrust level increased and being lower overall than that for bi-injection, no significant change in Cd due to cavitation was observed.

Table 5.
Cavitation number for the center propellant during single injection.
To investigate the causes of the differences between the single and bi-injections—namely, (i) the lower Δp of the center propellant in bi-injection, (ii) the absence of a difference in the center-propellant Δp between the upward- and downward-flow conditions in bi-injection, and (iii) the absence of a rapid decrease in Cd due to cavitation in the single injection of the center propellant—high-speed close-up images of the center-propellant exit were captured. The flow rate of the center propellant was fixed at 25 g/s where the jets were formed during the single injection, while the flow rate of the outer propellant gradually increased from 0 to 6 g/s. Some representative images are shown in Figure 13.
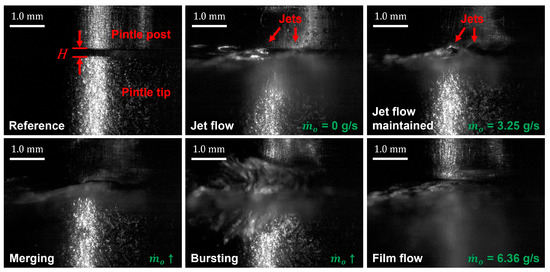
Figure 13.
Selected high-speed close-up images of the flow pattern of the center propellant in response to the outer propellant flow rate.
When only the center propellant was injected, jets were formed and remained during bi-injection until the flow rate of the outer propellant reached approximately 3 g/s. However, as the flow rate of the outer propellant gradually increased, the jets merged. When the flow rate of the outer propellant reached approximately 6 g/s, the merged jets and the surrounding air cavity ruptured, forming a single liquid film and resulting in an increased Cd. The TMR value at this moment was approximately 29, which was significantly higher than the experimental value (0.618). This indicated that the center propellant was injected as a single film at all thrust levels during bi-injection under the actual experimental conditions where the influence of the outer propellant was more pronounced. According to the results for the single-injection condition, the center propellant injected as jet flows resulted in a higher Δp than as a single-film flow. Therefore, as the center propellant was injected as a single film at all thrust levels during bi-injection, bi-injection resulted in lower Δp and higher Cd values for the center propellant compared with the single injection. Additionally, this film injection eliminated the hysteresis observed in the single injection. Finally, during the single injection, the center propellant was injected as localized jet flows, leaving empty spaces around the jets. Therefore, even though cavitation occurred at the 80%–100% thrust levels, the released dissolved gas and vapor exited into these spaces. As a result, the effective flow area was not affected, and Cd was not significantly impacted.
In high-pressure combustion-chamber environments, cavitation is unlikely to occur during propellant injection. Therefore, the sharp increases in the pressure drop and spray angle observed due to cavitation and hydraulic flips during bi-injection would not be present. However, the first test typically conducted during injector development is an atmospheric cold-flow test using water as a simulant propellant, through which the spray angle and droplet distribution are evaluated [26]. Thus, when evaluating injector designs using atmospheric water flow tests, it is important to consider the effects of cavitation and hydraulic flip. Additionally, considering that pintle injectors are generally designed with a TMR value of unity, it is noteworthy that non-uniformity was suppressed even with a TMR value of 29. This indicates that even in other pintle injectors with varying levels of non-uniformity during a single injection, non-uniformity would be considerably suppressed during bi-injection.
4. Conclusions
In this study, a liquid–liquid pintle injector with interchangeable pintle tips was designed, and cold-flow experiments using a continuous-type pintle tip were conducted to compare the flow characteristics of single and bi-injections. During the center-propellant single-injection experiment, the propellant was initially injected as a film up to the 30% thrust level under upward-flow conditions; however, due to a non-uniform flow distribution, it transitioned to jet flows at thrust levels above 30%. Conversely, under downward-flow conditions, hysteresis occurred at the 30% thrust level and jet flows were observed. These jets led to a higher pressure drop and lower discharge coefficient compared with a single-film injection.
During the bi-injection experiment, the pressure drop of the center propellant was lower than that observed during the single-injection experiment, and no hysteresis was observed. An evaluation of the cavitation number confirmed that cavitation led to a rapid decrease in the center-propellant discharge coefficient from the 80% thrust level as well as a rapid increase in the spray angle at the 100% thrust level. It was also confirmed that the spray angle could be predicted with greater accuracy by incorporating the reduction in the exit flow area due to hydraulic flip into the spray-angle prediction model. Additionally, the cavitation number of the center propellant was compared between the single- and bi-injection experiments. Although the discharge coefficient remained relatively consistent during the single injection, the cavitation number exhibited lower values. To investigate the cause of these differences in the center-propellant behavior between single and bi-injections, high-speed close-up images of the center-propellant exit were obtained using a long-distance microscope and a laser sheet. These images confirmed that the differences could be attributed to the suppression of jets caused by the non-uniform flow distribution, resulting in merging and injections in the form of a single liquid film. Evidently, the non-uniform flow distribution was partially suppressed during bi-injection using the pintle injector. This indicated that potential adjustments need to be made to the criteria used to evaluate spray uniformity during a single injection. The high-speed close-up imaging technique used in this study could significantly aid in understanding the collision and atomization mechanisms of pintle injectors. In future work, cold-flow experiments will be conducted using slot-type pintle tips to compare the spray characteristics with those of continuous-type pintle tips.
Author Contributions
D.C.: conceptualization, methodology, investigation, experiments, writing—original draft, and visualization. S.L.: experiments and visualization. K.A.: validation, supervision, visualization, writing—review and editing, project administration, resources, and funding acquisition. All authors have read and agreed to the published version of the manuscript.
Funding
This work was supported by a Korea Research Institute for defense Technology planning and advancement (KRIT) grant funded by the Korean government (DAPA (Defense Acquisition Program Administration)) (No. KRIT-CT-22-030, Reusable Unmanned Space Vehicle Research Center, 2024). This work was also supported by funding from the academic research program of Chungbuk National University in 2024.
Data Availability Statement
The original contributions presented in the study are included in the article, further inquiries can be directed to the corresponding author.
Conflicts of Interest
The authors declare no conflicts of interest.
References
- Casiano, M.J.; Hulka, J.R.; Yang, V. Liquid-propellant rocket engine throttling: A comprehensive review. J. Propul. Power 2010, 26, 897–923. [Google Scholar] [CrossRef]
- Gilroy, R.; Sackheim, R. The lunar module descent engine–A historical summary. In Proceedings of the 25th AIAA/ASME/SAE/ASEE Joint Propulsion Conference and Exhibit, Monterey, CA, USA, 12–16 July 1989; Available online: https://arc.aiaa.org/doi/10.2514/6.1989-2385 (accessed on 13 October 2024).
- SpaceX USA. Falcon User’s Guide (September 2021). 2024. Available online: https://www.spacex.com/vehicles/falcon-9/ (accessed on 11 March 2024).
- Lei, J.P.; Lan, X.H.; Zhang, R.J.; Chen, W. The development of 7500 N variable thrust engine for Chang’E-3. Sci. Sin. Technol. 2014, 44, 569–575. [Google Scholar] [CrossRef]
- KISTEP Korea. 2022 Preliminary Feasibility Study Report–Next Generation Launch Vehicle Development Project (2023). 2024. (In Korean). Available online: https://www.kistep.re.kr/reportDetail.es?mid=a10305070000&rpt_tp=831-003&rpt_no=RES0220230013 (accessed on 11 March 2024).
- Joo, S.; Hwang, D.; Kang, D.; Heo, S.; Han, S.; Lee, B.; Je, W.; Kim, J. Cold flow test of pintle injector for variable thrust combustion chamber with servo-valve method. In Proceedings of the 10th EUCASS—9th CEAS Aerospace Europe Conference, Lausanne, Switzerland, 9–13 July 2023. [Google Scholar] [CrossRef]
- Galactic Energy China. WELKIN Reusable LOX/Kerosene Engine. 2024. Available online: https://www.galactic-energy.cn/index.php/En/List/cid/18 (accessed on 11 March 2024).
- Boyd, B.R.; Johnson, R.J.; Smith, T.H. Application of the MIRA 150A variable-thrust engine to manned lunar flying systems. J. Spacecr. Rocket. 1968, 5, 849–851. Available online: https://arc.aiaa.org/doi/10.2514/3.29369 (accessed on 13 October 2024). [CrossRef]
- Grant, A.F.; Rupert, R.C.; Shieber, H. Final Report Surveyor Vernier Thrust Chamber Assembly Development—Phase III (1965). 1965. Available online: https://ntrs.nasa.gov/citations/19650014299 (accessed on 11 March 2024).
- Dressler, G.A.; Bauer, J.M. TRW pintle engine heritage and performance characteristics. In Proceedings of the 36th AIAA/ASME/SAE/ASEE Joint Propulsion Conference and Exhibit, Las Vegas, NV, USA, 24–28 July 2000. [Google Scholar] [CrossRef]
- Ono, D.K.; Dressler, G.A.; Kruse, W.D.; Solbes, A. The design, development, and qualification of an advanced columbium liquid apogee engine (AC-LAE). In Proceedings of the 34th AIAA/ASME/SAE/ASEE Joint Propulsion Conference and Exhibit, Cleveland, OH, USA, 13–15 July 1998. [Google Scholar] [CrossRef]
- Cheng, P.; Li, Q.; Xu, S.; Kang, Z. On the prediction of spray angle of liquid-liquid pintle injectors. Acta Astronaut. 2017, 138, 145–151. [Google Scholar] [CrossRef]
- Cheng, P.; Li, Q.; Chen, H. Flow characteristics of a pintle injector element. Acta Astronaut. 2019, 154, 61–66. [Google Scholar] [CrossRef]
- Chen, H.; Li, Q.; Cheng, P. Experimental research on the spray characteristics of pintle injector. Acta Astronaut. 2019, 162, 424–435. [Google Scholar] [CrossRef]
- Blakely, J.; Freeberg, J.; Hogge, J. Spray cone formation from pintle-type injector systems in liquid rocket engines. In Proceedings of the AIAA SciTech 2019 Forum, San Diego, CA, USA, 7–11 January 2019. [Google Scholar] [CrossRef]
- Zhao, F.; Zhang, H.; Zhao, L.; Bai, B.F. A new modeling method for spray angle prediction of liquid-liquid pintle injector. AIAA J. 2023, 61, 4960–4975. [Google Scholar] [CrossRef]
- Ninish, S.; Vaidyanathan, A.; Nandakumar, K. Spray characteristics of liquid-liquid pintle injector. Exp. Therm. Fluid Sci. 2018, 97, 324–340. [Google Scholar] [CrossRef]
- Zhou, R.; Shen, C. Experimental study on the spray characteristics of a pintle injector element. Acta Astronaut. 2022, 194, 255–262. [Google Scholar] [CrossRef]
- Lee, I.; Jeong, G.; Yoon, Y. Breakup mode of continuous-type liquid-liquid pintle injector. Exp. Therm. Fluid Sci. 2023, 149, 111013. [Google Scholar] [CrossRef]
- He, C.; Zhang, P.; He, Z.; Yue, L. Analysis of spray characteristics of a jet-film injection element based on Voronoi tessellation. Acta Astronaut. 2023, 206, 100–113. [Google Scholar] [CrossRef]
- Teuffel, P.; Werling, L.; Lauck, F.; Kirchberger, C. Cold flow analysis of spray angle and droplet size distribution of a pintle injector for green hypergolic propellants. In Proceedings of the 10th EUCAS—9th CEAS Aerospace Europe Conference, Lausanne, Switzerland, 9–13 July 2023. [Google Scholar] [CrossRef]
- Escher, D.W. Design and Preliminary Hot Fire and Cold Flow Testing of Pintle Injectors. Master’s Thesis, Mechanical Engineering Department, Pennsylvania State University, University Park, PA, USA, 1996. [Google Scholar]
- Otsu, N. A threshold selection method from gray-level histograms. IEEE Trans. Syst. Man. Cybern. 1979, 9, 62–66. [Google Scholar] [CrossRef]
- Nurick, W.H.; Ohanian, T.; Talley, D.G.; Strakey, P.A. Impact of L/D on 90 Degree Sharp-Edge Orifice Flow with Manifold Passage Cross Flow (2007). 2024. Available online: https://apps.dtic.mil/sti/citations/ADA474490 (accessed on 11 March 2024).
- Armbruster, W.; Hardi, J.S.; Suslov, D.; Oschwald, M. Injector-driven flame dynamics in a high-pressure multi-element oxygen-hydrogen rocket thrust chamber. J. Propul. Power. 2019, 35, 632–644. [Google Scholar] [CrossRef]
- Gotzig, U.; Dargies, E. Development Status of Astriums New 22N Bipropellant Thruster Family. In Proceedings of the 39th AIAA/ASME/SAE/ASEE Joint Propulsion Conference and Exhibit, Huntsville, AL, USA, 20–23 July 2003. [Google Scholar] [CrossRef]
Disclaimer/Publisher’s Note: The statements, opinions and data contained in all publications are solely those of the individual author(s) and contributor(s) and not of MDPI and/or the editor(s). MDPI and/or the editor(s) disclaim responsibility for any injury to people or property resulting from any ideas, methods, instructions or products referred to in the content. |
© 2024 by the authors. Licensee MDPI, Basel, Switzerland. This article is an open access article distributed under the terms and conditions of the Creative Commons Attribution (CC BY) license (https://creativecommons.org/licenses/by/4.0/).