Abstract
The rapid growth of the aviation industry highlights the need for strong safety management. Analyzing data on unsafe aviation events is crucial for preventing risks. This paper presents a new method that integrates the Transformer network model, clustering analysis, and feature network modeling to analyze Chinese text data on unsafe aviation events. Initially, the Transformer model is used to generate summaries of event texts, and the performance of three pre-trained Chinese models is evaluated and compared. Next, the Jieba tool is applied to segment both summarized and original texts to extract key features of unsafe events and prove the effectiveness of the pre-trained Transformer model in simplifying lengthy and redundant original texts. Then, cluster analysis based on text similarity categorizes the extracted features. By solving the correlation matrix of these features, this paper constructs a feature network for unsafe aviation events. The network’s global and individual metrics are calculated and then used to identify key feature nodes, which alert aviation professionals to focus more on the decision-making process for safety management. Based on the established network and these metrics, a data-driven hidden danger warning strategy is proposed and illustrated. Overall, the proposed method can effectively analyze Chinese texts of unsafe aviation events and provide a basis for improving aviation safety management.
1. Introduction
Aviation equipment is a fundamental element for the completion of flight missions, and ensuring flight safety has always been a matter of great concern. Aviation safety management is a crucial tool to achieve this goal. The International Civil Aviation Organization (ICAO) states in its ‘Safety Management Manual’ that accurate and timely reporting of information related to incidents or accidents is a fundamental activity of safety management [1]. Moreover, historical accident information and lessons learned from similar products can be used to identify all potential hazards throughout the aircraft’s lifecycle. The effective utilization of unsafe event records, such as faults, incidents, and accidents that occur during the service phase of aircraft, is crucial for discovering latent risk factors and patterns. It holds significant importance for improving the safety level of aviation flights, serving as an important data support for ensuring flight safety and identifying risk hazards.
Unsafe aviation event data are typically unstructured text data with inconsistent lengths among various event records. Common data sources include safety reports collected by the Aviation Safety Reporting System (ASRS) in the United States [2], monthly updates of civil aviation accident investigation reports from the National Transportation Safety Board (NTSB) [3], and the Aviation Safety Network (ASN) [4]. Currently, most research utilizes machine learning-based Natural Language Processing (NLP) methods to analyze and process aviation unsafe datasets. Rodrigo L. Rose and his team conducted Structural Topic Modeling (STM) analysis on standardized event narrative text sets collected from ASRS and unstructured accident and incident texts from NTSB, demonstrating the effectiveness of this approach and providing decision-makers with valuable reference information [5]. João S. D. Garcia and colleagues focused on runway excursion accidents commonly occurring in flight and analyzing and predicting the severity of runway excursions using a random forest model on ASRS safety disclaimer report texts. This method exhibited significantly higher prediction accuracy compared to Naive Bayes and Gradient Boosting methods [6]. Tomás Madeira and his team employed semi-supervised label propagation and supervised support vector machine methods to model ASN text data, demonstrating that their proposed approach can effectively predict safety accidents caused by human factors [7]. In general, as explainable algorithms, machine learning methods are effective in dealing with aviation data, but their complexity and dependency on data-structure wellness cannot be ignored.
Different from traditional machine learning methods, deep learning methods, specifically neural networks, as semi-explainable or non-explainable algorithms, are rapidly extending applications in the aviation field, such as weather forecasting [8], aviation travel question and answer systems [9], fretting fatigue predictions [10], etc. With the advantages of less data-structure dependency, better generalization performance, and standardized procedures, deep learning approaches have also been utilized in aviation safety report analysis. Xiaoge Zhang and his team combined Word Embedding with Long Short-term Memory (LSTM) neural networks to establish a classification model for NTSB data, predicting unsafe events such as accidents, aircraft damage, and casualties. This approach facilitates understanding of the relationships between different event sequences, unsafe events, accident probabilities, aircraft damage, or casualties [11]. Tianxi Dong et al. proposed models that can automate causal factor identification of ASRS incident reports based on deep recurrent neural networks, and results proved higher accuracy and adaptability than traditional machine learning methods [12] Monika, Verma, S. and Kumar, P. provided a comparative analysis of time-series-based machine learning and deep learning methods to predict aviation accidents based on ASRS database, and results showed that bidirectional LSTM was superior among several time-series models [13]. Sequoia R. Andrade and Hannah S. Walsh developed a safety-informed aerospace-specific language model by pre-training a transformer network model using datasets from ASRS and NTSB, which can be leveraged in NLP tasks of named-entity recognition, relation detection, information retrieval, etc., related to the aviation filed [14]. To summarize, deep learning networks are becoming increasingly popular in aviation data processing. The up-to-date transformer-based networks, first proposed by Ashish Vaswani [15], are prevailing in NLP tasks, showing great potential in aviation safe reports analysis.
In this paper, considering the inconsistent recording lengths and prominent unstructured characteristics of Chinese aviation unsafe event texts, we proposed the integration of the Transformer model, clustering analysis, and feature network modeling to mine these text data.
Firstly, we adopted and pre-trained three Transformer network models to generate semi-structured texts of long Chinese texts of unsafe aviation events. This initial step was crucial as it allowed us to condense the verbose and complex original texts into more manageable summaries while retaining the essence, which is vital for the subsequent analytical processes. The performance of the three models was evaluated using universal metrics, identifying the GLM model as the most effective in summary generation due to its superior ability to capture the key information within the Chinese language context.
Taking these semi-structured and refined event texts as input, we carried out text feature cluster analysis based on Jieba word segmentation and text similarity calculation to determine and categorize unsafe event features. By comparing the accuracy of word segmentation of original and generated summarized event texts, the effectiveness of the pre-trained Transformer model was proven, demonstrating its capability to simplify and enhance the original texts for feature extraction.
After obtaining these features, we used the Pointwise Mutual Information (PMI) method to calculate the feature correlation matrix, and then a feature network was constructed. This network modeling is a novel approach that provides a visual and analytical representation of the relationships between different features, aiding in the identification of key areas of focus for safety management. Then, both individual and global network metrics were defined and calculated, providing a quantified identification of key feature nodes in the network.
Following this, we put forward a data-driven risk early warning strategy for aviation maintenance activities. This strategy was designed to provide early warning clues for risk investigation and control, thereby enhancing proactive safety measures. The results showed that the proposed method can effectively deal with Chinese unsafe aviation event data and can assist aviation managerial personnel with discovering key safety risks to improve decision-making and safety management.
The technical route of this paper is illustrated in Figure 1.
Figure 1.
Technical route of this paper.
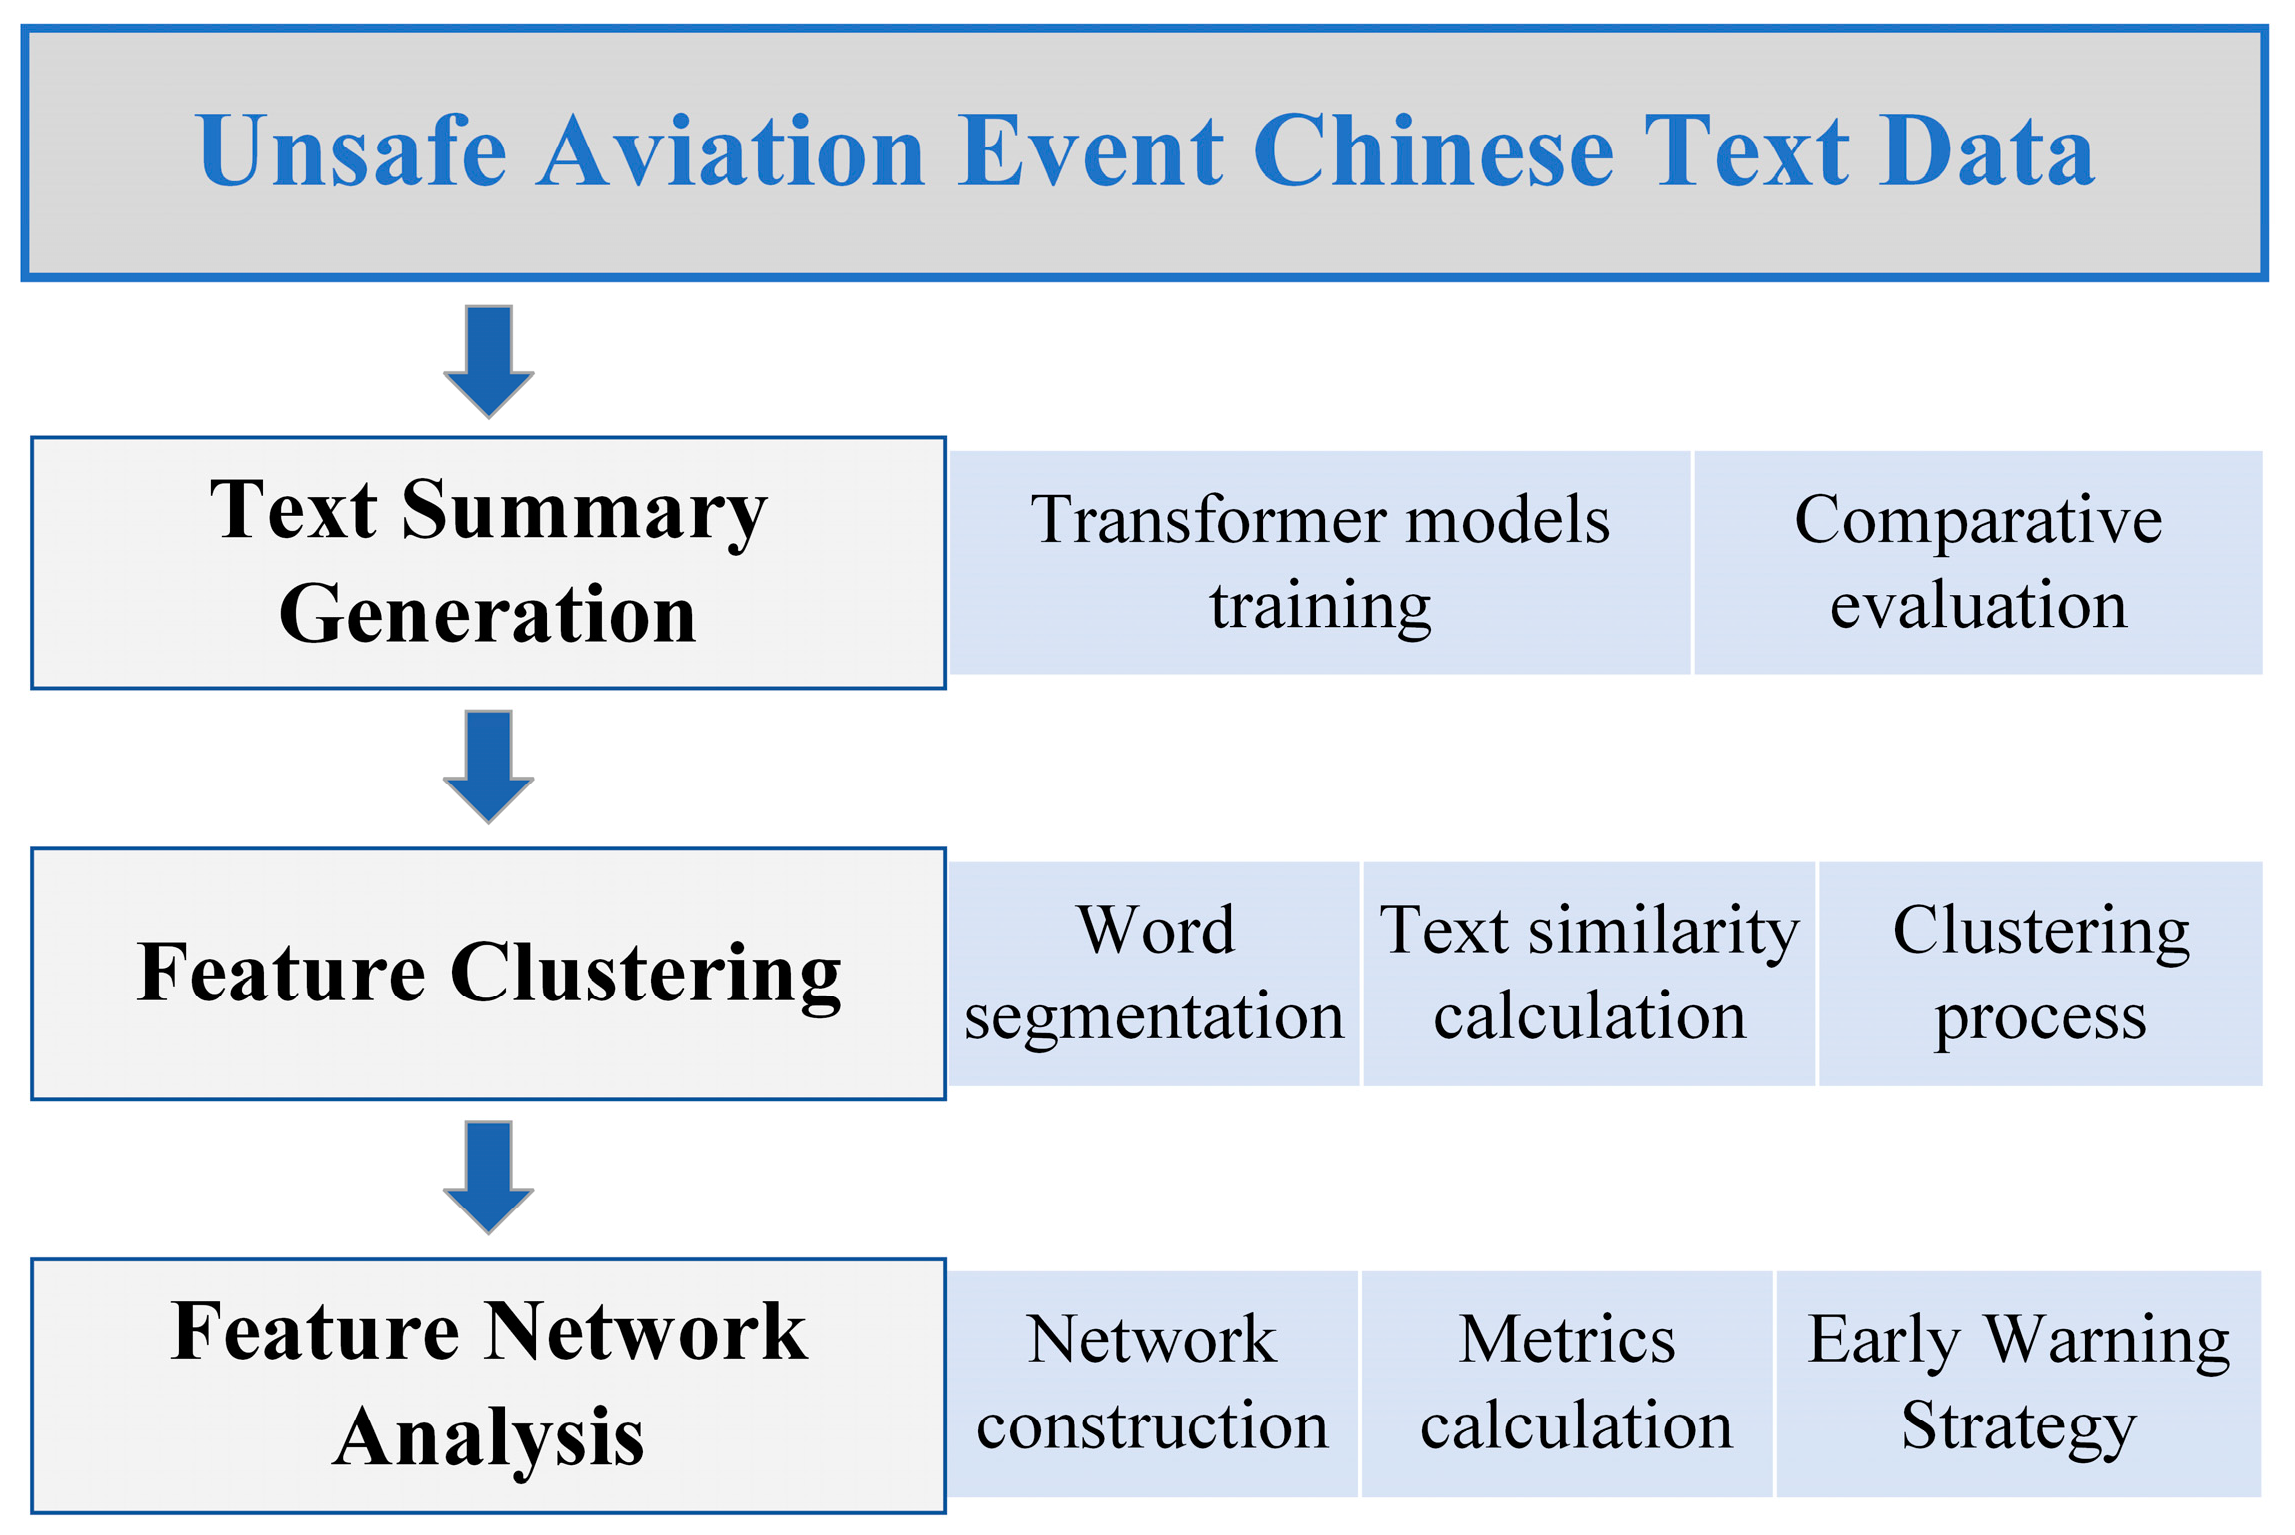
2. Summary Generation by Neural Network Model
2.1. Dataset Creation
This study has compiled a comprehensive dataset of Chinese text data pertaining to aviation safety incidents sourced from a diverse array of platforms. These include online searches, the authoritative Aviation Safety Information System maintained by the Civil Aviation Administration of China (CAAC) [16], the confidential Sino Confidential Aviation Safety Reporting System (SCASS) [17], and additional pertinent regulatory bodies. We collected a total of 3684 distinct records of unsafe events. The dataset creation process was guided by two pivotal considerations. One was the partial uniformity of textual structure and strong objectivity of word expression in these events, resulting from the documentation work carried out by official authorities, which is different from aviation safety narratives in [5]. The other was the robust small-sample learning proficiency of the Transformer-based neural network models, which were planned for use in our forthcoming model training phase. We numbered all the 3684 records from 1 to 3684 and used a random tool in Python to generate 550 integers between 1 and 3684, and according to these numbers, we selected 550 records. Then, we renumbered these 550 records from 1 to 550, performed the same operation to obtain 50 random integers, and took them as the test subset. The rest of the 500 records made up the training subset. Each record in the dataset has been manually annotated with the desired summary text. A representative example of this annotation is delineated in Table 1.
Table 1.
One record of an unsafe aviation event in a Chinese text dataset.
Here, we would like to explain why only 500 records and 50 records were used as training subsets and test subsets, respectively. In fact, we initially planned to label 1000 records as the training set and 100 as the test set. However, due to the time and labor intensity of manual labeling, we proceeded with training and testing after labeling only 550 records. We found that the model’s training performance met our expectations, especially the GLM model. This also, to some extent, demonstrated the excellent small-sample learning ability of the transformer models. Meanwhile, 50 test data entries were sufficient for calculating the ROUGE metrics (which will be discussed in Section 2.3.2) to make a comparison among the three models.
2.2. Model Deployment
2.2.1. Model Introduction
The Transformer model, introduced by Vaswani et al. in 2017 [15], is distinguished by its self-attention mechanism, which enables the model to capture dependencies between any two positions in a sequence, regardless of the distance between them. This effectively addresses the vanishing or exploding gradient issues encountered by traditional Recurrent Neural Networks (RNNs) when processing long sequences. The structure of a typical Transformer model is shown in Figure 2.
Figure 2.
The structure of a typical Transformer model.
The prominent advantage of the Transformer network lies in its self-attention mechanism, which allows the model to compute attention weights at each position, focusing on other words in the input sequence to capture contextual information. Multi-head self-attention enables the model to perform multiple attention operations in parallel, capturing different aspects or features of the sequence from various perspectives or representational subspaces. For instance, one head might focus on syntactic information, while another concentrates on semantic details.
To date, the Transformer architecture has solidified its position as the prominent framework across a spectrum of NLP applications. Recognizing that the linguistic tapestry of diverse nations is fundamentally an amalgamation of characters, Transformer models pre-trained on distinct linguistic corpora are adept at addressing plenty of NLP challenges that are idiomatic to those languages, such as those encountered in Spanish [18], Korean [19], Japanese [20], etc.
Given the current abundance of open-source Transformer-based network models, each tailored for various text processing scenarios, our study on the task of unsafe events text summarization has identified the Sequence-to-Sequence (Seq2Seq) paradigm as fundamental. This paradigm involves the generation of a short text sequence from a longer one. Consequently, to compare the model performance, we selected three open-source Transformer models renowned for their outstanding performance in Seq2Seq tasks:
- T5 Model (Text-to-Text Transfer Transformer): This model employs a unified text-to-text framework capable of handling a variety of Seq2Seq tasks by unifying multiple NLP tasks into a text-to-text format;
- GLM Model (General Language Model): This model integrates auto-encoding and auto-regressive pre-training methods, enabling it to construct output text progressively, which aids in generating coherent and fluent text;
- BART Model (Bidirectional and Auto-Regressive Transformers): Leveraging the strengths of both BERT and GPT, this model introduces random perturbations to the input text data, allowing it to better learn the semantic and structural information of the text.
2.2.2. Local Model Deployment
Due to the nature of this task being a text summarization within a Chinese context, it is necessary to deploy network models that have been pre-trained on Chinese corpora. The three Transformer models utilized in this study are all derived from open-source code and are as follows: the “mengzi-t5-base” model proposed by the Chinese company Langboat Technology, with a parameter scale of 220 million [21]; the “glm-large-chinese” model proposed by the Data Mining Laboratory of Tsinghua University, with a parameter scale of 335 million [22]; and the “bart-base-chinese” model proposed by the Natural Language Processing Laboratory of Fudan University, with a parameter scale of 110 million [23]. Hereafter, the three models will be referred to as T5, GLM, and BART, respectively.
The aforementioned open-source network model codes were downloaded from the Hugging Face website and deployed on a local computer. The hardware specifications of the computer and the parameters of the deep learning platform are detailed in Table 2.
Table 2.
Hardware and software specifications.
2.3. Model Training and Evaluation
2.3.1. Training Parameters Setting
In the training phase for the three models, identical parameter settings were applied, focusing on the batch size, the number of training epochs, and the learning rate. Given the limited memory capacity of the local GPU and to avoid memory insufficiency that could lead to training failure due to an overly large batch size, which corresponds to a large volume of input data at each step, we determined through experimentation that a batch size of 4 was optimal. Regarding the number of training epochs, which indicates how many times the training set is iterated, our experiments revealed that setting it to 4 met the performance requirements for the task effectively while preventing overfitting. In comparison to traditional network models, the Transformer models deployed in this study were considerably larger in scale, necessitating a lower learning rate (0.0001) to ensure adequate model training.
2.3.2. Evaluation Method
The assessment of models for the text summarization task was primarily conducted through two avenues. On the one hand, it involved a quantitative evaluation by calculating the ROUGE scores from the outcomes on the test dataset. On the other hand, it included the generation of summaries for original texts that were not part of the training or testing datasets using the trained network. These summaries were then qualitatively evaluated by human judges, who assessed the fluency of the text, grammatical structure, and clarity of semantics. The following section will concentrate on the computation of ROUGE scores.
The ROUGE (Recall-Oriented Understudy for Gisting Evaluation) metric system is a prevalent tool for assessing the efficacy of automatic text summarization. Initially introduced by Lin in 2003 [24], ROUGE employs a length-normalized co-occurrence statistical approach to measure the alignment between an automatically generated summary and its reference counterpart. Within the ROUGE family of metrics, ROUGE-1 (unigram), ROUGE-2 (bigram), and ROUGE-L (longest common subsequence) have gathered significant attention for their utility.
where 1 − gram and 2 − gram refer to unigram and bigram tokenization, respectively. Ref stands for the reference summary. The function Countmatch(1 − gram) and Countmatch(2 − gram) represent the number of common occurrences of 1 − gram and 2 − gram in both the generated summary and the reference summary. On the other hand, Count(1 − gram) and Count(2 − gram) represent the total number of occurrences of 1 − gram and 2 − gram in the reference summary. RLCS represents recall, PLCS represents precision, LCS(r, s) is the length of the longest common subsequence between the generated summary and the reference summary, and β is a parameter that balances recall and precision, often set to a large value.
2.3.3. Experiment Results
Following the parameter settings, we initially trained the three network models using the training dataset, documenting the training duration for each model. Concurrently, we calculated the ROUGE scores for the three network models post-training using the test set, with the results presented in Table 3. Upon completion of the training phase, we utilized 3 raw records of unsafe aviation events that were not included in the dataset to generate summaries with the aforementioned trained networks, and the outcomes are displayed in Table 4.
Table 3.
Model training duration and ROUGE scores.
Table 4.
Text summary generation results of three unsafe events.
The training outcomes presented in Table 3 indicate that under identical training parameter configurations, the GLM model, with the largest parameter scale, exhibited a longer training duration but achieved a higher ROUGE score. This suggests that the GLM model’s text summarization performance is superior, with a greater match between the generated summaries and the ideal summaries. In contrast, the BART model, despite having the smallest parameter scale, did not have the shortest training time, and its ROUGE score was lower than that of the GLM model but slightly higher than that of the T5 model. The T5 model, with a moderate parameter scale, had the shortest training time but the lowest ROUGE score, indicating that while its training speed is commendable, the training outcome is the poorest.
As demonstrated in Table 4, which compares the summarization results of the three models, the GLM model’s summarization quality significantly outperformed the other two in terms of linguistic fluency, grammatical structure, semantic completeness, and accuracy. The summaries generated by the other two models were marred by grammatical errors and semantic confusion, rendering them nearly unusable. Moreover, the GLM model adeptly encapsulated the specific causes of issues present in the original text, underscoring its high applicability and utility.
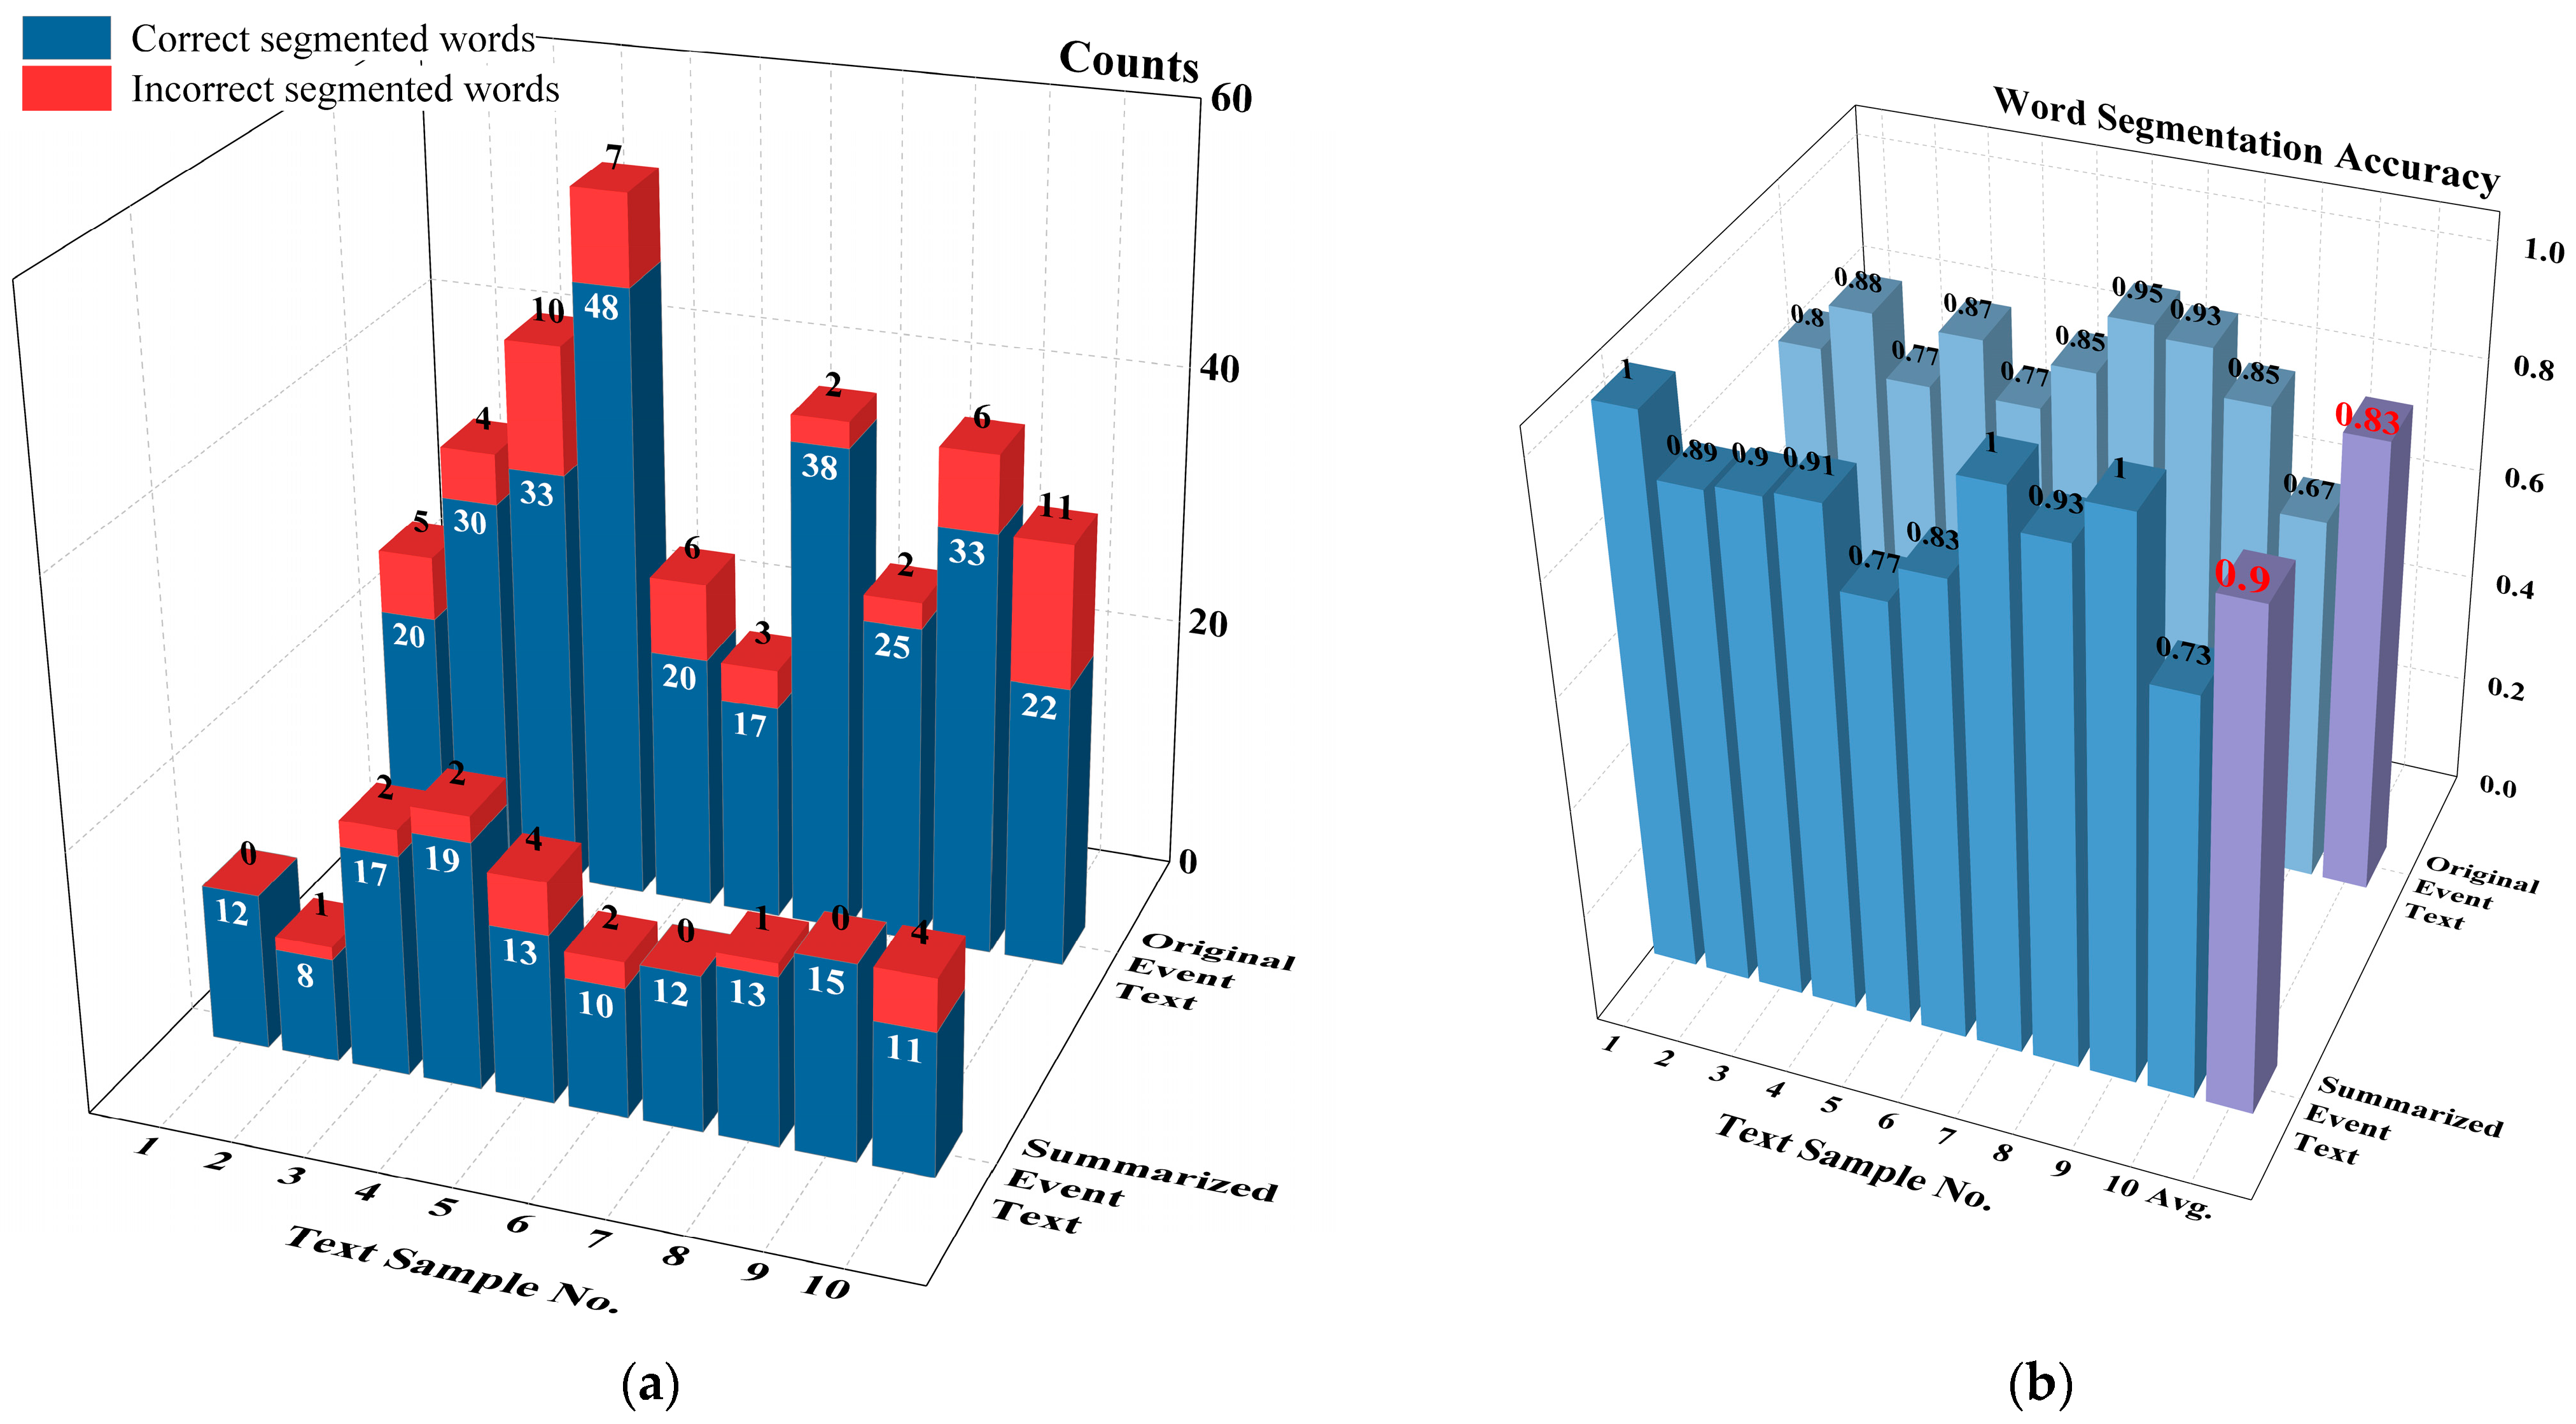
2.4. Impact Assessment of Summarization on Text Segmentation
Given the unpredictability of how machine learning algorithms divide Chinese words, the outcomes can often stray from the true meanings of the words. The concept of creating condensed versions of event texts is to strip away unnecessary details and keep only the essential information, which in turn lowers the chance of errors in later word divisions. To illustrate the necessity of text summarization on word segmentation, which is the first step of text mining, we set up a comparison test. We picked 10 random samples of unsafe event texts. Both the original texts and their GLM-generating summaries were segmented into words using the Jieba tool. Table 4 presents the detailed word segmentation results of the first sample, while Figure 3 presents the overall statistics for all the samples.
Figure 3.
Word segmentation results of original and summarized event texts: (a) Word segmentation counts; (b) Word segmentation accuracy. The highlighted numbers in red are the average accuracy.
As shown in Table 5, the event summary focuses on the key details of the event and leaves out parts of the original text that do not have much to do with what caused the event. If a word at the beginning of a sentence is wrongly segmented, it can set off a chain where the next few words are also wrongly segmented. This example suggests that a summary can prevent possible mistakes in how words are divided and make the important information clearer.
Table 5.
Word segmentation results of event example text and its summary.
In Figure 3a, after the word segmentation, the summaries have fewer correct and incorrect words compared to the original texts, and there are fewer words overall. At first, you might think that having fewer correct and incorrect words would not affect how accurate the division is, but Figure 3b shows that the accuracy of dividing words in the summaries is just as good as in the original texts. We think this is because the pre-trained network which helps make the summaries breaks down the text in a way that matches real words, which means the summaries are more likely to be made up of words that make sense.
In general, the results from the comparison show that dividing the summaries leads to fewer unwanted words, fewer mistakes, better accuracy, and better efficiency. This shows that using a pre-trained network for processing aviation text data is a good idea and works well.
3. Cluster Analysis of Summarized Text
To study the interesting topic of unsafe aviation events, we carried out a cluster analysis of GLM-generating summaries. Cluster analysis includes the following courses: text feature extraction, similarity calculation, and clustering process.
3.1. Text Feature Extraction
Text feature extraction segments the text into words and selects interesting ones as text features; the Jieba method was utilized to segment GLM-generating texts. This process yields segmented words across various grammatical categories, such as nouns, prepositions, adverbs, verbs, adjectives, and so on. In the context of unsafe aviation events, we concentrated on the development of the events. Therefore, the features we focused on were nouns and verbs. We tallied the features of nouns and verbs that appeared more than 30 times, which resulted in 132 features. Since some words may be classified differently based on context (for example, ‘工作’ (work) can be both a noun and a verb), we reviewed and refined these 132 features, eliminating 6 features with overlapping grammatical roles. This left us with 126 distinct unsafe event features.
Considering factors such as the preferences of recorders and word variations, which can influence the phrasing of incident reports, the same event might be documented with different combinations of features (for example, ‘超’ (exceed), ‘超过’ (surpass), and ‘超出’ (go beyond) all suggest going beyond a limit). In text mining, these are treated as synonyms. To ensure the accuracy of the text mining outcomes, it is essential to merge these synonyms. Here, we used the Hash mapping technique (further details to follow) to combine synonyms, ending up with 121 features. These features form a standard library for subsequent analysis. Some of these safety incident features of high occurrence frequency are displayed in Table 6.
Table 6.
Unsafe event features of high occurrence frequency.
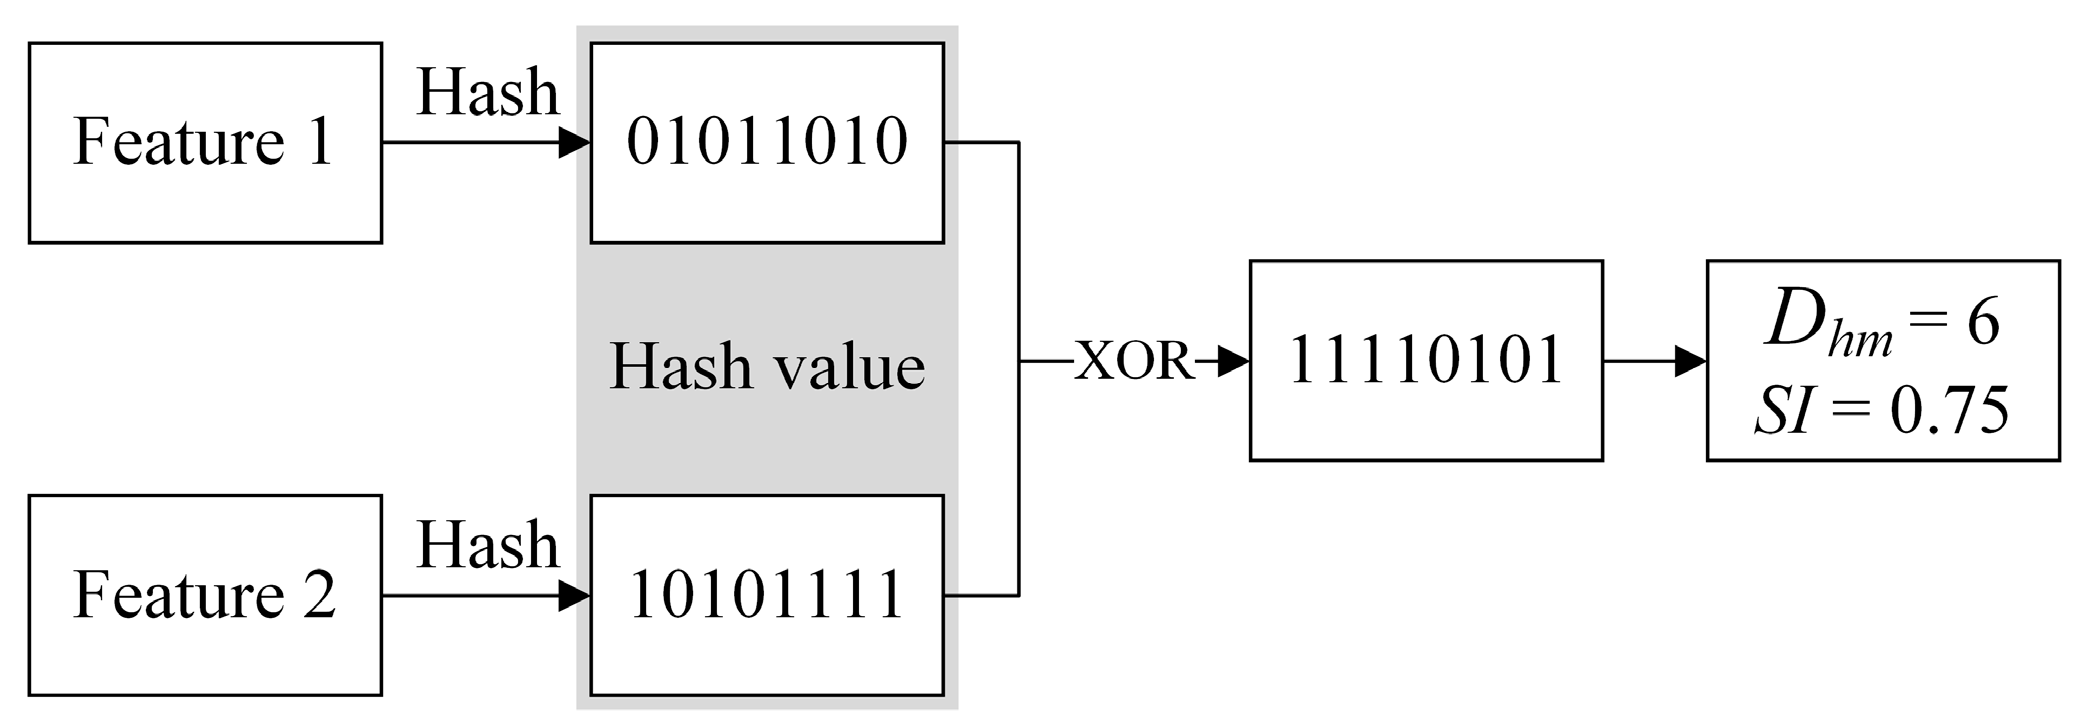
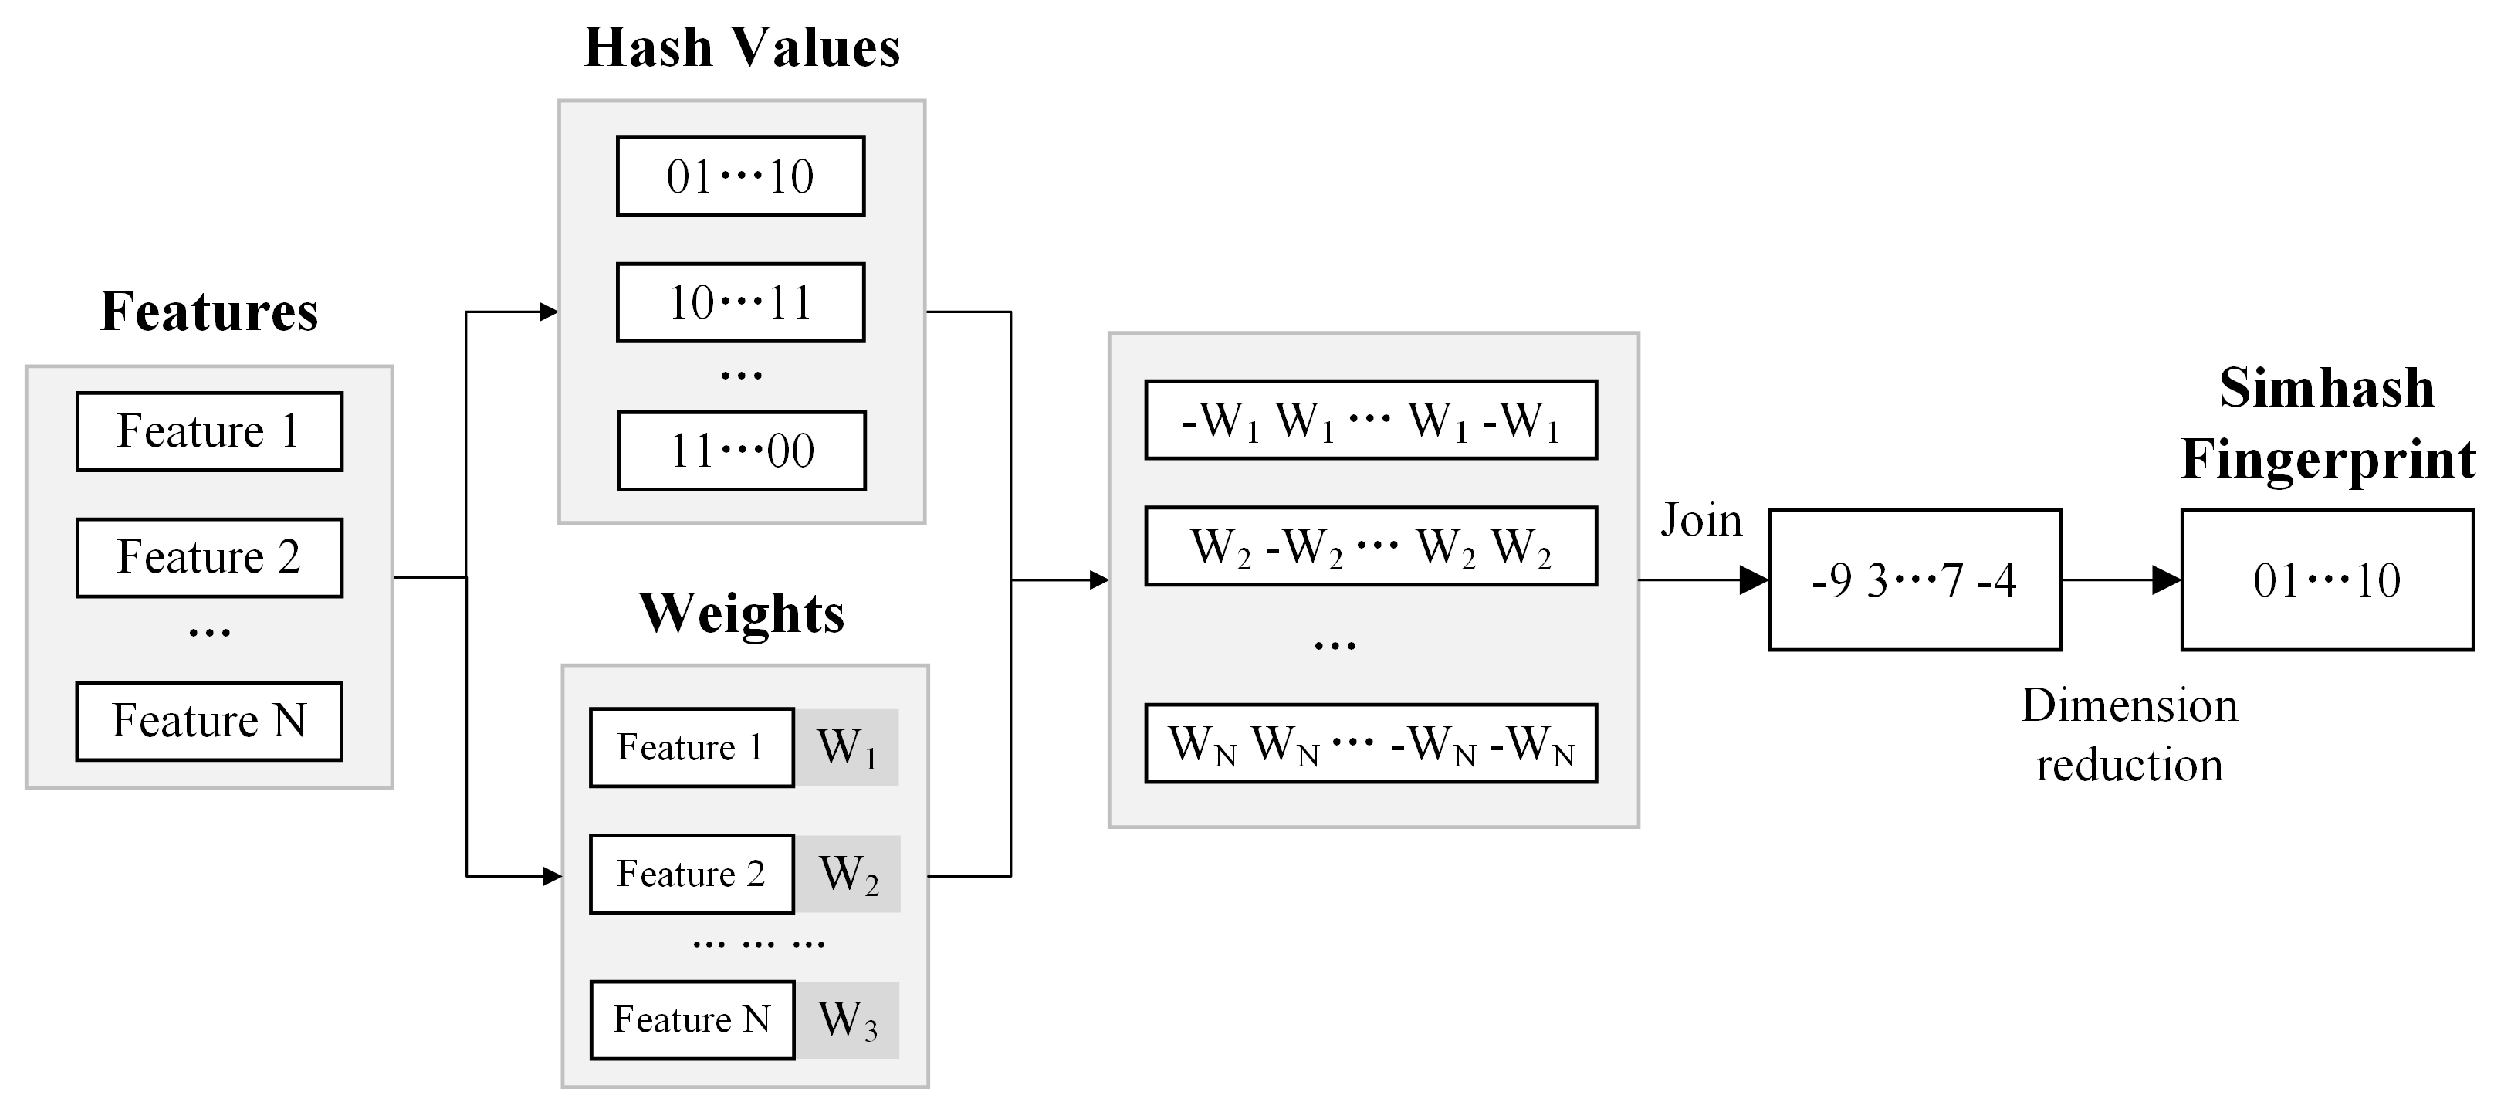
3.2. Hash-Mapping Text Similarity Calculation
The calculation of similarity between texts has a significant impact on clustering effectiveness. As unstructured data, the text features of unsafe events cannot be directly used for similarity calculations. A common practice is to process them into structured data before analysis. Hash mapping can convert unstructured data, such as texts, into a series of binary values, which has several advantages. First, it is sensitive to input values, and the probability of the same Hash value for different original data is very small. Second, Hash mapping is highly efficient and can handle large sample datasets efficiently. Therefore, it is widely used for processing unstructured data.
The basic idea of Hash mapping calculating similarity is as follows: First, a hash function is used to map the features of unsafe events into b bit binary hash values, where the length can be adjusted according to needs. Then, the Hamming distance Dhm between the Simhash fingerprint values of two unsafe event features is calculated, and the similarity (SI) between the two features is computed using the following equation:
From Equation (5), it can be inferred that the larger the Hamming distance Dhm between the features, the lower their similarity (SI) will be. Figure 4 shows an example of calculating the similarity of two features using Hash mapping.
Figure 4.
Calculating the similarity of two features using Hash mapping.
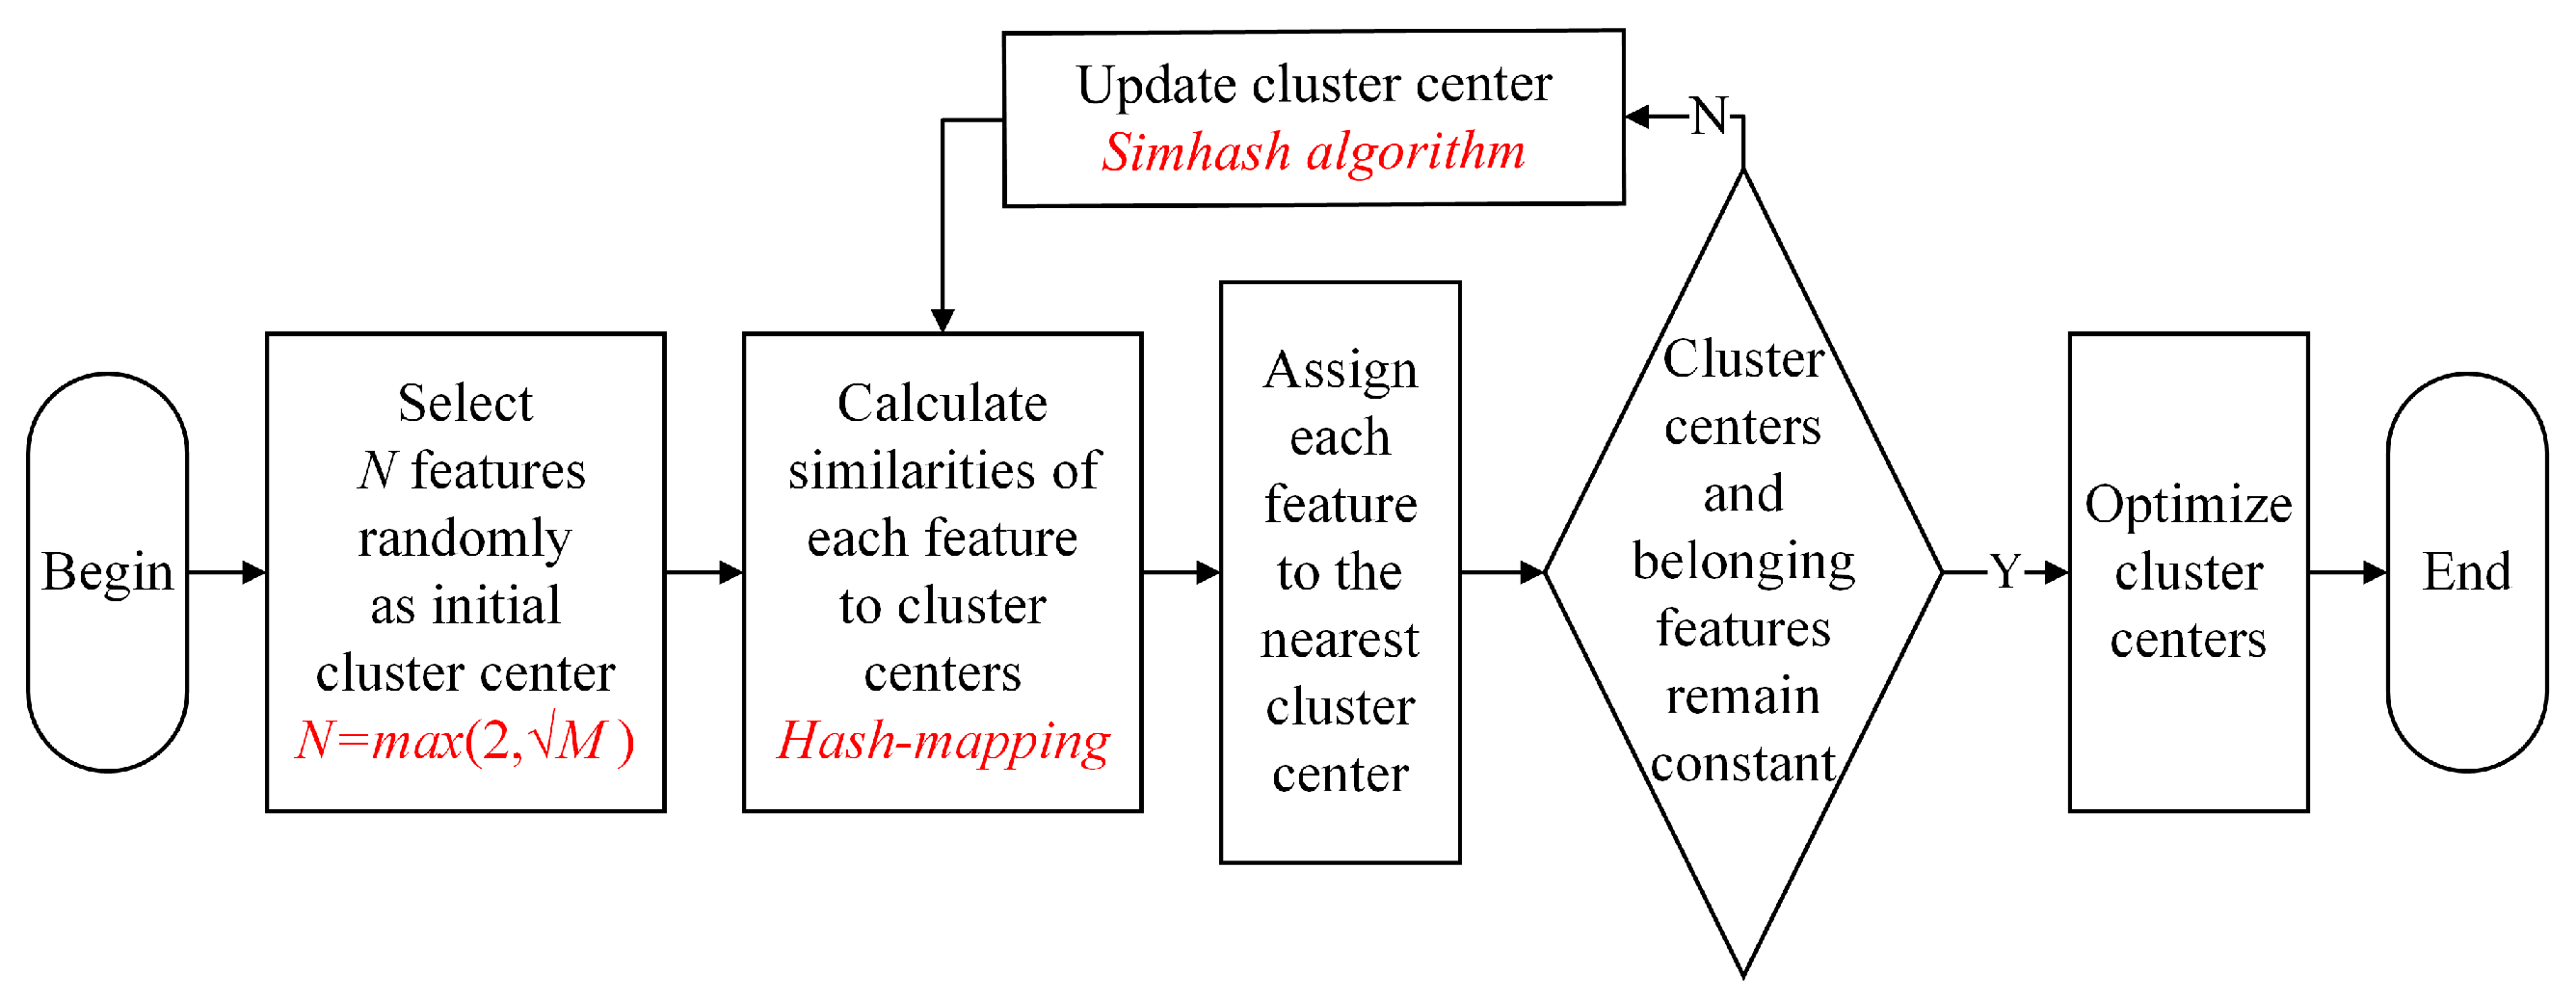
3.3. Clustering Process Based on Simhash Algorithm
This work used text similarity as the clustering method for grouping unstructured data and designed a feature consistency index to evaluate the clustering performance. The main idea is as follows:
First, the number of clusters N is determined by the total amount M of text features:
Second, N cluster centers are randomly selected from the input text features.
After that, the similarities between the rest of the text features are calculated, and each feature is assigned to a cluster with the highest similarity.
Then, the cluster centers are recalculated, and the previous step is repeated until the categories of text features no longer change.
The specific process is illustrated in Figure 5.
Figure 5.
Workflow of the clustering process.
The Simhash algorithm is a widely used technique for simplifying text data by reducing its complexity [25,26,27]. It works as a type of hashing method that is sensitive to the content’s locality. The process starts with basic text preparation, like breaking down the text into words, to get the main parts of the text and how important each part is. The importance is measured by a common method called Term Frequency-Inverse Document Frequency (TF-IDF) [5].
After that, a hash function helps to find a unique number, or a ‘hash value’, for each part of the text. These values are combined, and a short string of bits, known as a Simhash fingerprint, is created. This fingerprint is made using simple rules, like setting a bit to ‘1’ if the combined value for that bit is more than zero and ‘0’ if it is not. The length of the fingerprint can be changed to fit different needs.
When the center of a group of texts is updated, the step of breaking down the text into words is not needed. Figure 6 shows a diagram of how the centers of text groups are updated using the Simhash algorithm.
Figure 6.
Diagram of updating cluster centers using the Simhash algorithm.
3.4. Clustering Results
Following the application of a text similarity-based clustering method to 121 unsafe event feature texts, we identified 11 distinct clusters. The clusters varied considerably in size, with the largest containing 26 features and the smallest only 5. Subsequently, a detailed manual review was undertaken to evaluate the clustering outcomes.
Upon review, certain misclassified unsafe event features were identified and reassigned to more suitable groups. For instance, the feature ‘commander’, initially categorized with the seventh cluster dominated by aircraft component-related features such as frames, covers, and rivets, was relocated to the first cluster, which pertains to human-related aspects.
Furthermore, clusters with closely related unsafe event feature meanings were examined for potential consolidation. These refinements led to the merging of the original 11 clusters into a more streamlined set of 9 clusters. The revised clustering results are detailed in Table 7.
Table 7.
Clustering results of unsafe event features.
As can be seen from Table 7, the meanings represented by the features within the same category were generally similar, while those between different categories differed significantly. If an accident that belongs to a certain unsafe event feature group occurs, it indicates that other unsafe event features within that category may also occur and require close attention. Additionally, if an unsafe event occurs that belongs to multiple feature groups, it is necessary to consider the relationships and interactions between these groups. This approach allows for a more comprehensive understanding of the potential hazards associated with unsafe event features and can aid in the identification of areas of concern for safety improvement.
4. Unsafe Feature Network Analysis
In this section, the obtained unsafe event features were used to construct a feature network, and the relevant metrics were calculated. Firstly, the correlation between features was quantified using the normalized Pointwise Mutual Information (PMI) method [27,28]. PMI is an efficient and intuitive measure for assessing the co-occurrence of words, offering a straightforward way to capture lexical associations without the need for complex modeling or extensive computational resources. Secondly, the Gephi software was utilized to construct the unsafe event feature network. Both global and individual network structure metrics were calculated to identify key unsafe event features.
4.1. Feature Correlation Matrix
Pointwise Mutual Information (PMI) can quantify the correlation between two events or entities [27,28]. It can take positive, negative, or zero values. To assess the correlation among various unsafe event features, calculating their PMI values is a useful approach. The equation for PMI is as follows:
Specifically, P(w1,w2) represents the probability of both unsafe event features w1 and w2 occurring together in the same accident. On the other hand, P(w1) and P(w2) refer to the probabilities of unsafe event features w1 and w2 occurring alone, respectively, without considering the presence of the other feature.
PMI between any two unsafe event features is calculated based on Equation (6). A positive value of PMI indicates an existing correlation between the two unsafe event features, and the stronger the correlation, the higher the value. When a PMI is close to zero, the correlation is weak. Therefore, a threshold for unsafe event feature correlation, ε1 = 0.5, is set. If ε1 ≥ 0.5, it is considered that the correlation between the unsafe event features w1 and w2 is strong. The element Aij in the feature correlation matrix A is set to 1. Otherwise, Aij is set to 0. Based on this, a feature correlation matrix A is obtained.
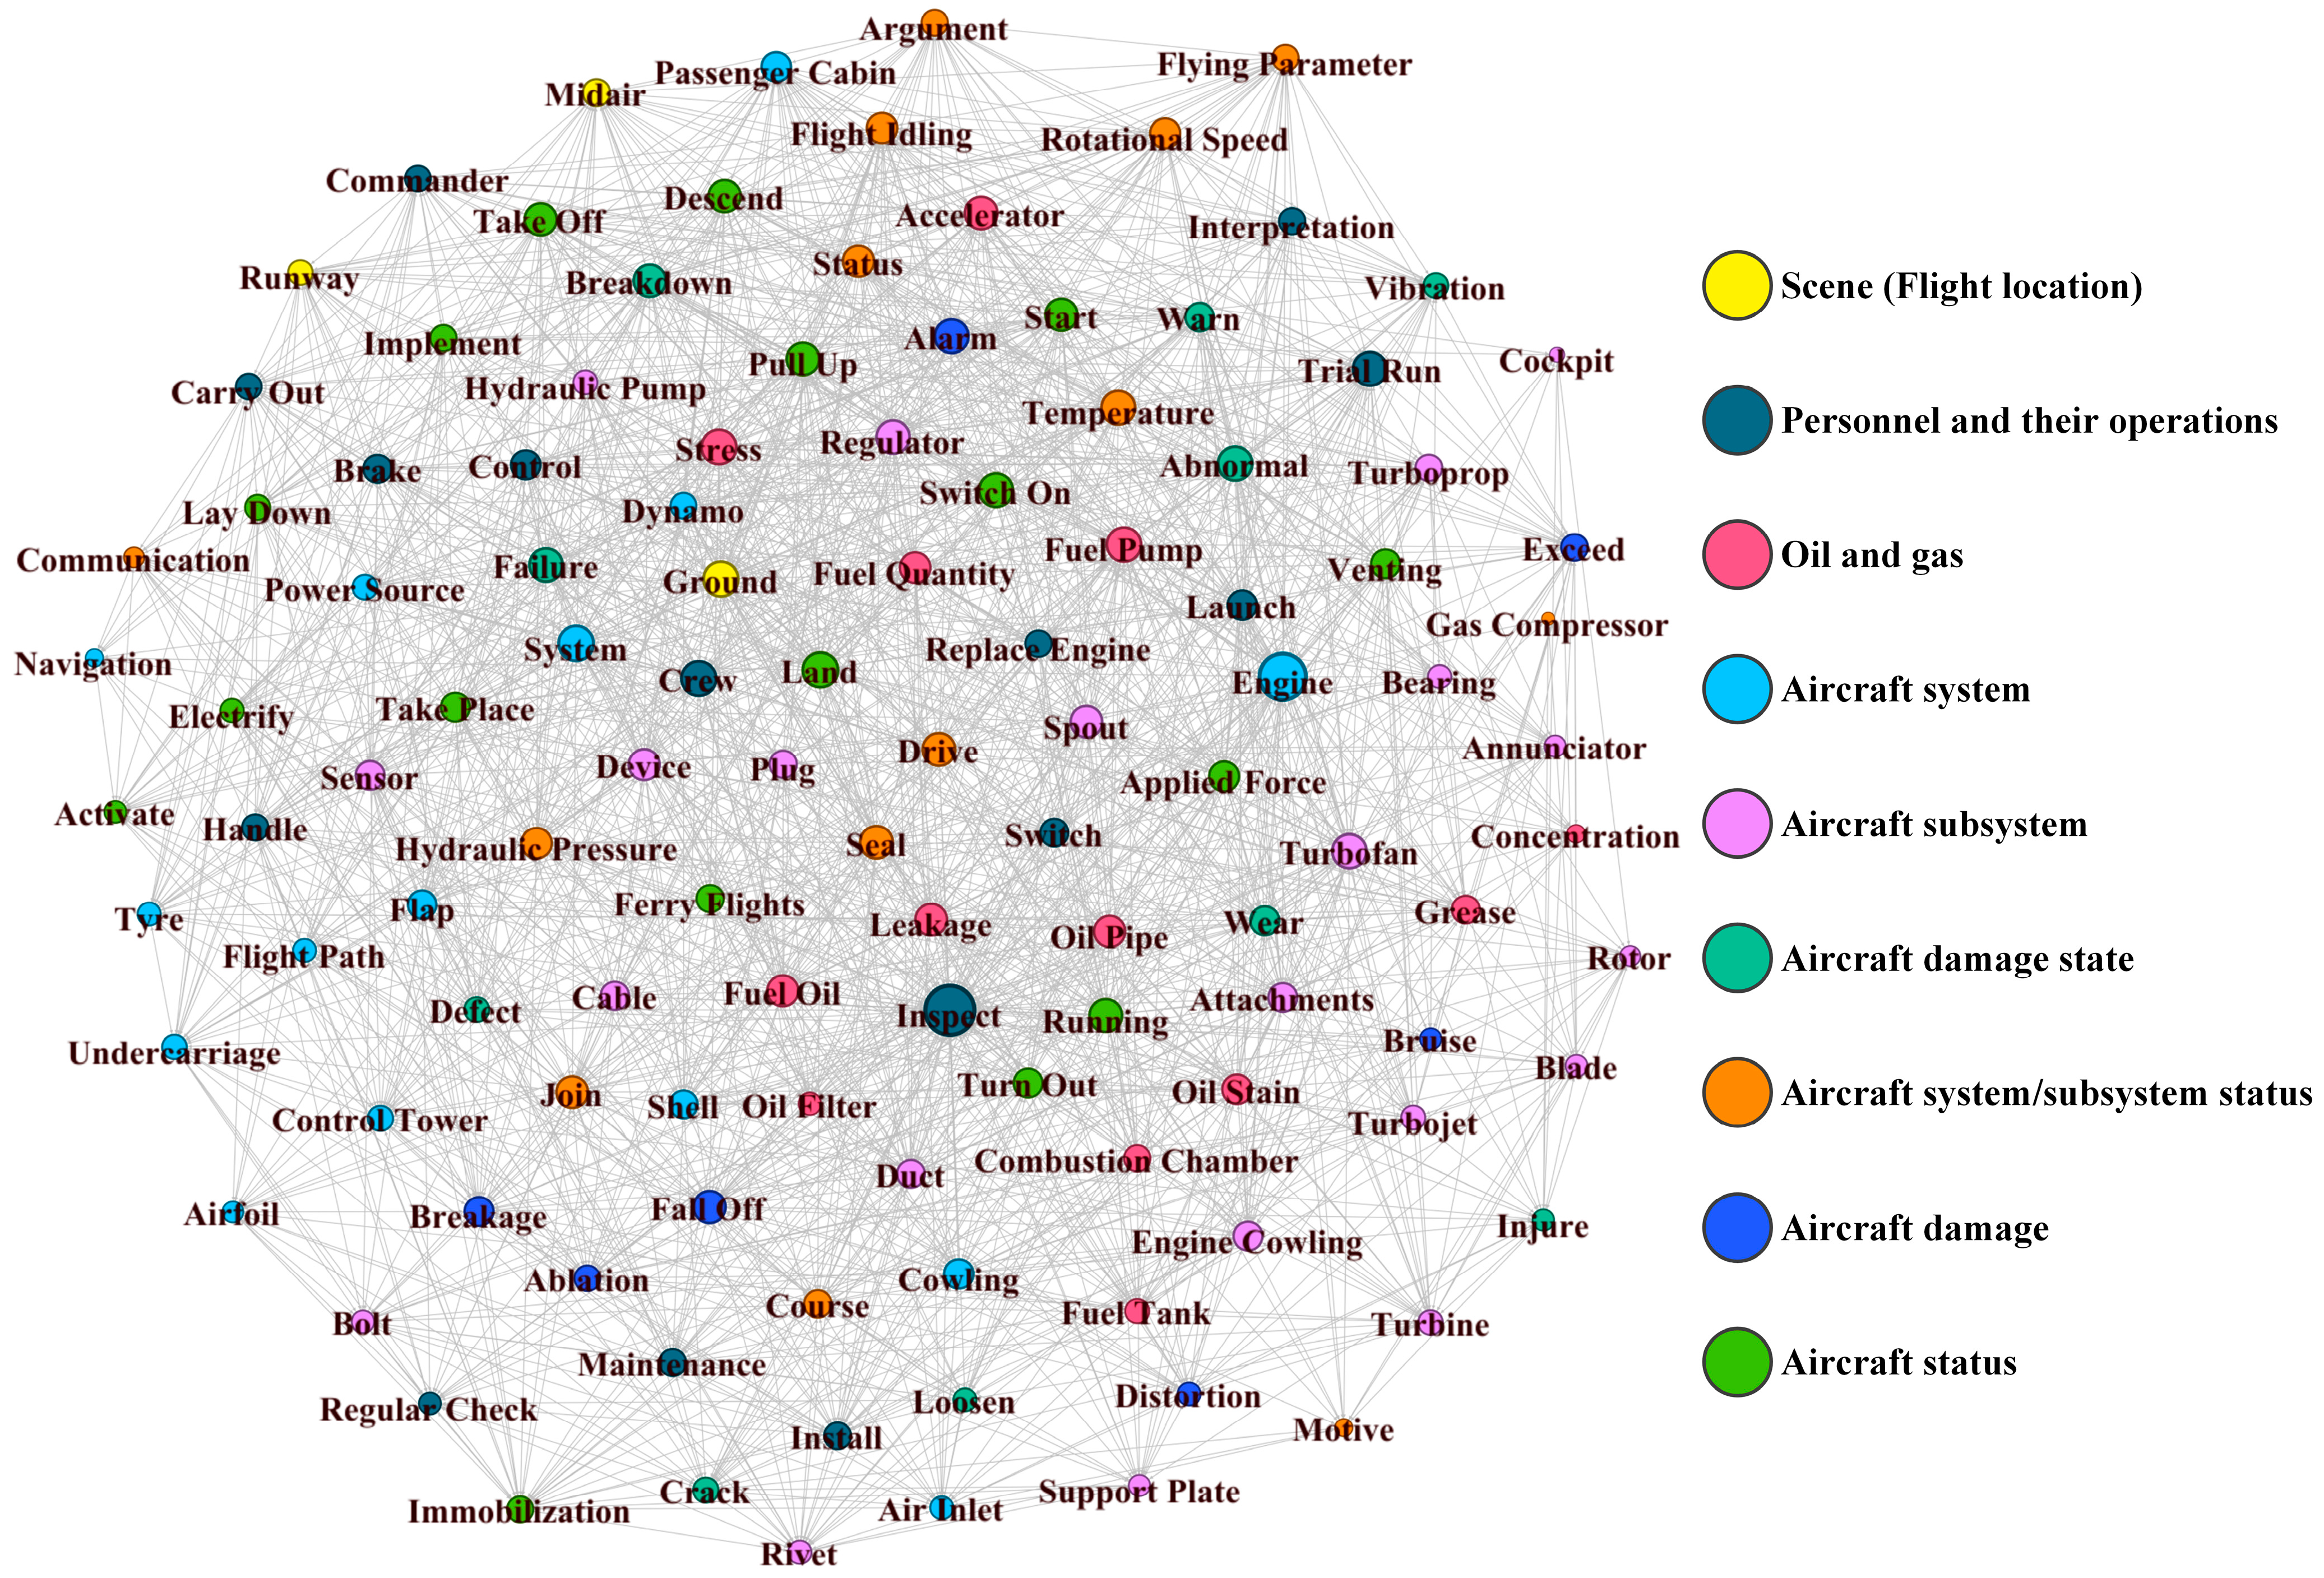
4.2. Feature Network Construction
Based on the feature correlation matrix T, Gephi 0.10.1 software is used to generate a network graph of unsafe event features, as shown in Figure 7. Different colors in the network of unsafe event features indicate that they belong to different groups of unsafe event features. Direct connections between nodes indicate the existence of a relationship between two unsafe event features. To further explain the relationships between individual unsafe event features and the network itself, relevant metrics were calculated. These metrics provide a quantitative analysis of the network from both global and individual perspectives.
Figure 7.
Feature network of unsafe aviation events.
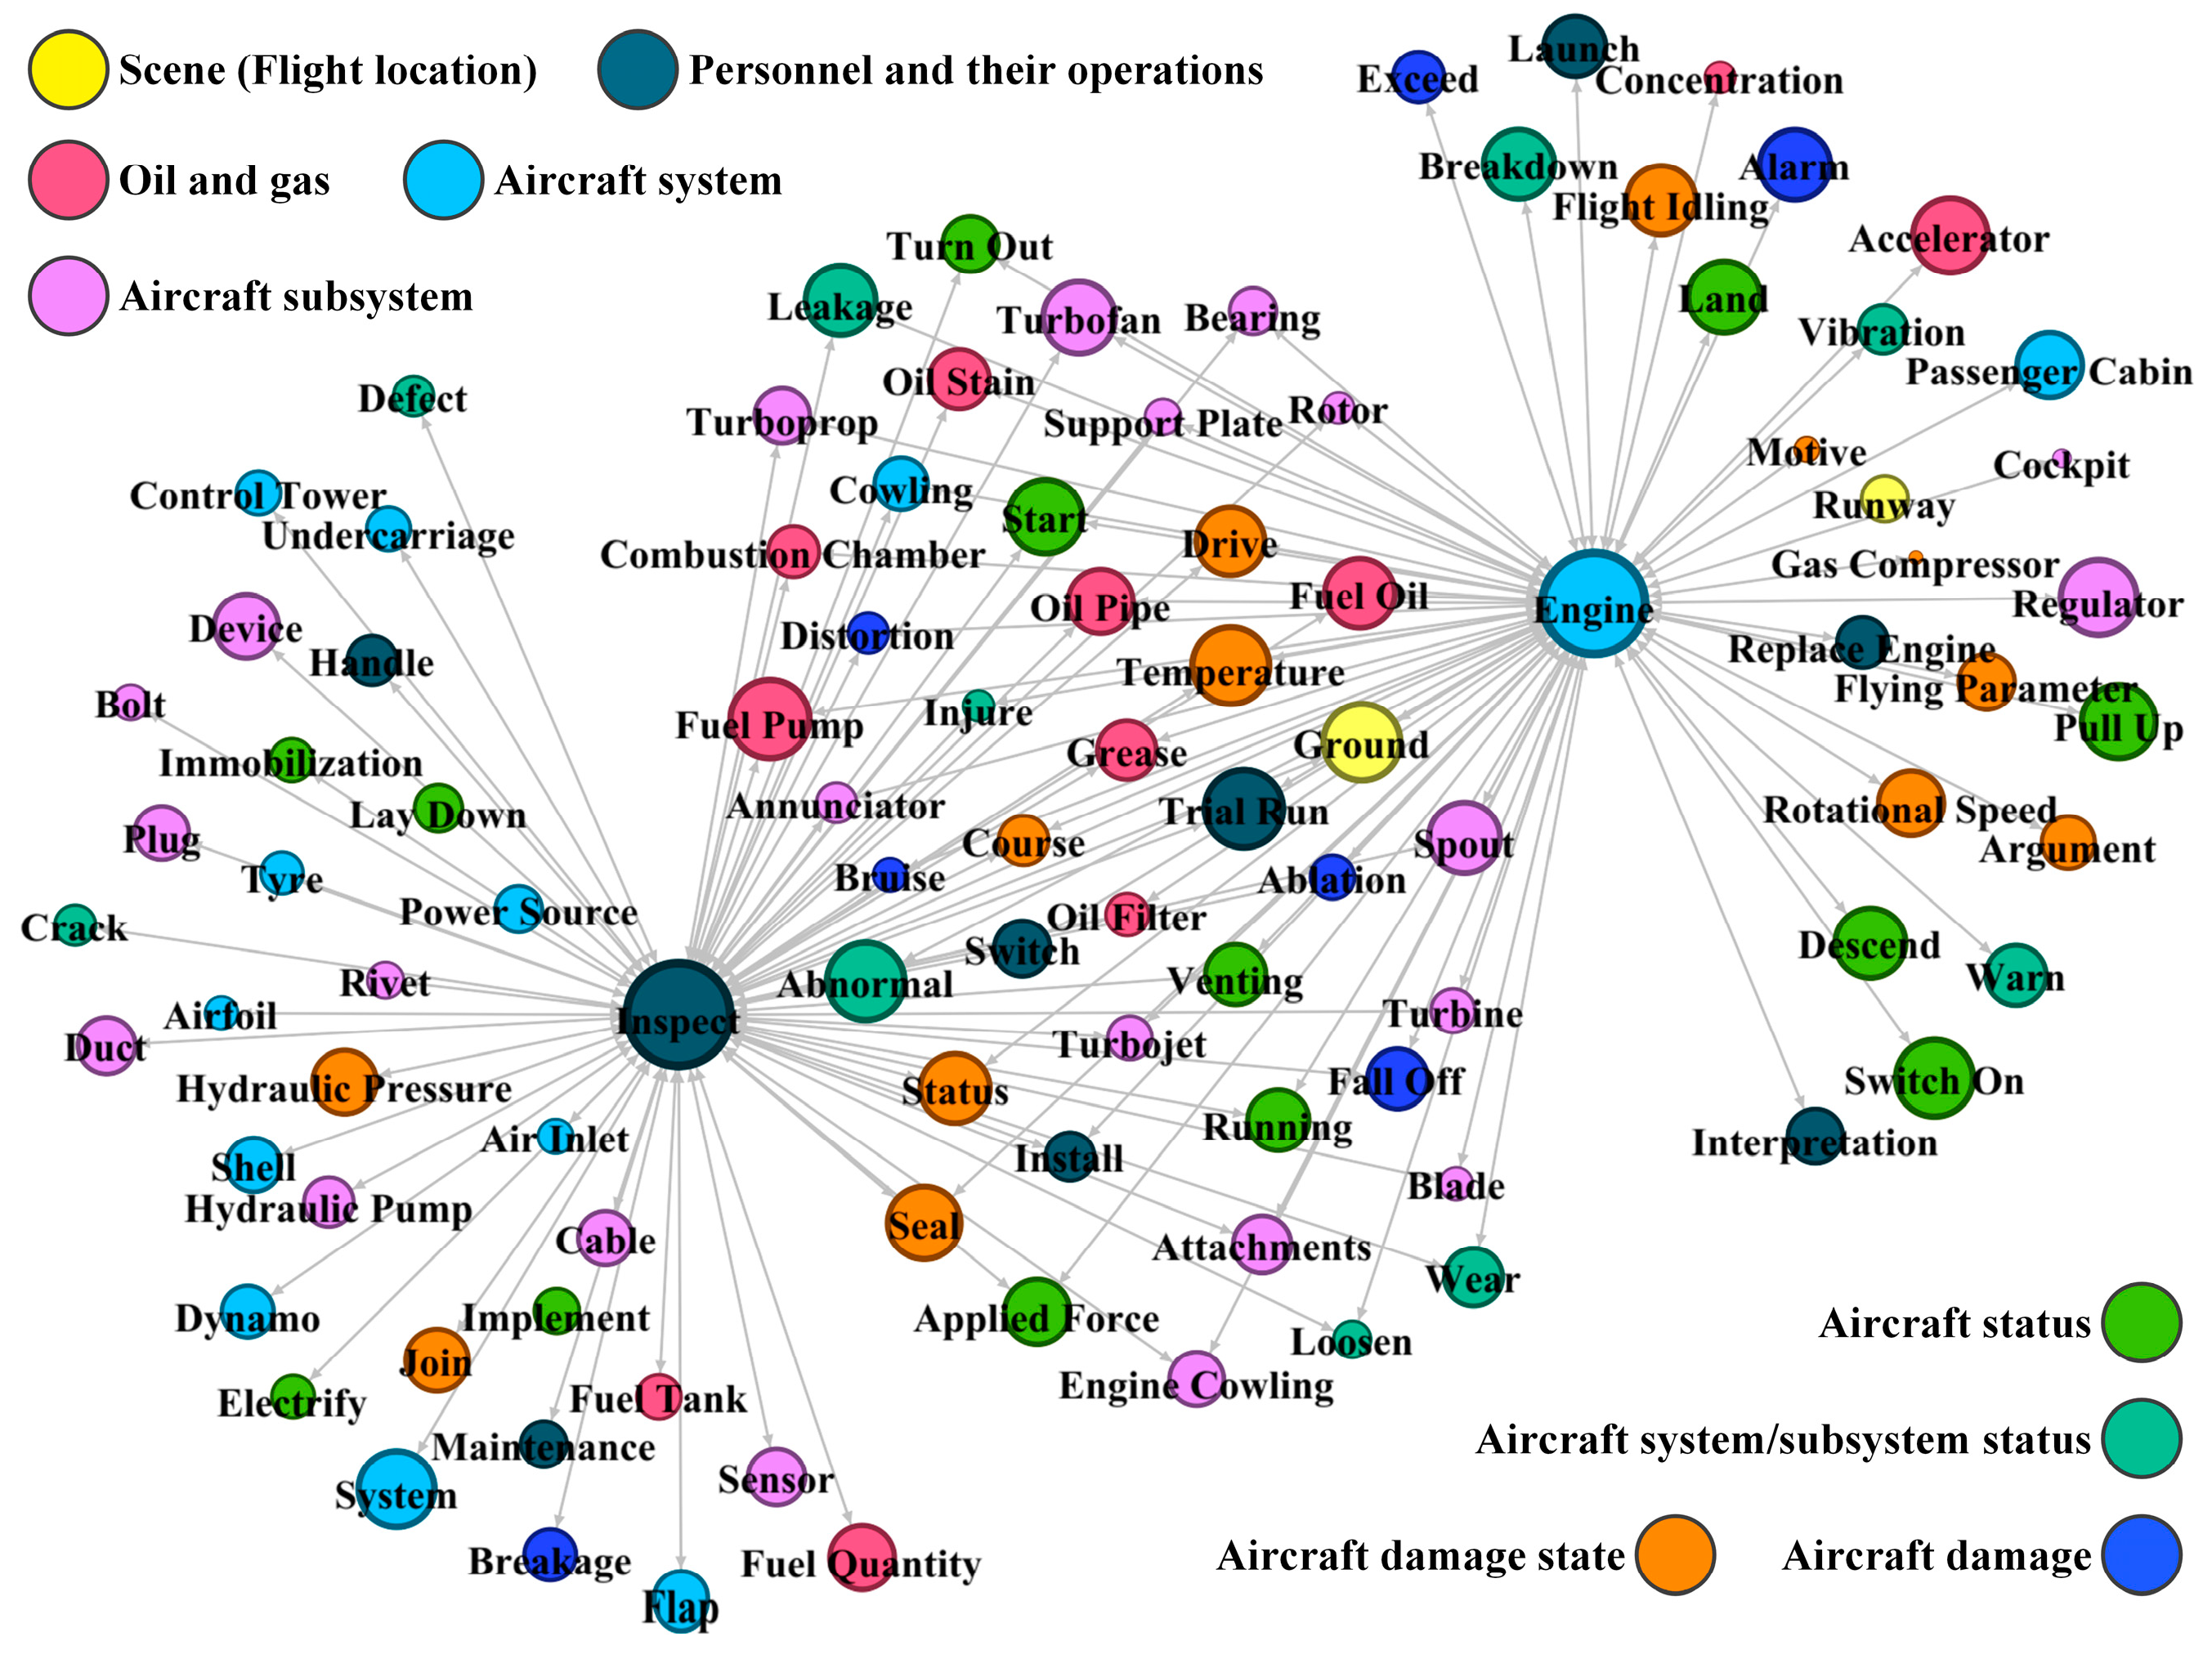
4.3. Network Metrics Calculation
To assess the unsafe event feature network, both global and individual metrics were calculated. Table 8 lists the detailed metrics calculated.
Table 8.
Calculated metrics.
Based on Table 8, all the mentioned metrics were calculated.
In terms of the global metrics, De = 0.255 indicates that the nodes in the network play a significant role as bridges between unsafe event features. Additionally, Tr = 0.411 suggests that the average level of closeness between unsafe event features and their neighboring features in the network is relatively high. Both metrics indicate that, overall, there is good connectivity among the unsafe event features in the network.
As for the individual metrics, due to the large number of unsafe event features, partial calculation results are presented in Table 9.
Table 9.
Calculation results of individual metrics of 14 features.
Refining the analysis from Table 9, we observed that “inspect” achieved the highest Closeness Centrality score of 0.638. This suggests that “inspect” is notably interconnected with other network features, facilitating efficient information dissemination. The “Engine” and “Landing” also exhibited significant CC values, 0.622 and 0.561, respectively, which positioned them as central elements within the network.
Shifting focus to Degree Centrality, “Inspect” claimed the top spot with a 0.6 value, denoting its numerous direct associations with other features. The “Engine”, with a DC of 0.558, was a close second, underscoring its extensive connectivity. Eigenvector Centrality likewise highlighted “Inspect”, with the maximum score of 21.624. This not only signified numerous connections but also the significance of those connected features, thereby amplifying “Inspect’s” overall impact.
In summary, “Inspect” and “Engine” stood out across all metrics, affirming their status as pivotal event features in the network. This insight indicates that inspections are instrumental in identifying a majority of risks associated with aircraft. The frequency of engine-related unsafe events underscores the engine’s role as a crucial component, where any malfunction could pose substantial safety risks.
The elevated status of “Inspect” and “Engine” in the network analysis emphasizes the importance of rigorous inspection protocols and frequent maintenance for aircraft engines. It also suggests the need for robust monitoring systems to swiftly identify and rectify any issues detected during inspections. These insights are invaluable for crafting a strategic aviation safety management plan, where timely issue detection can prevent the progression to grave incidents.
4.4. Data-Driven Risk Early Warning Strategy
To conduct more efficient safety hazard investigations, this paper proposes a feature data-driven aviation safety risk early warning strategy. Based on the textual records of each safety hazard investigation, the strategy achieves the identification and warning of potential safety hazards through standardization of safety hazard data, extraction of safety hazard features, deduction of associated safety hazard features, and ranking of key safety hazard features.
As illustrated in Figure 8, when implementing regular maintenance inspection on airplane engines, the standardized description is “Regular inspection on airplane engines”, then the features extracted of this operation are “Inspect” and “Engine”. Through the feature network, those features that both connected with “Inspect” and “Engine” were determined, as shown in Figure 9. Considering the individual metrics of these features, the ranking of them can be realized. According to the ranking of these unsafe features and their classifications, potential risk information can be specified. In this example of Figure 8, when implementing regular inspection on airplane engines, the following potential risks should be paid more attention to: oil leakage of the fuel pump, grease abnormality, wearing spouts and attachments, abnormal venting temperature, and so on.
Figure 8.
An example of a risk early warning strategy.
Figure 9.
Unsafe features connected with “Inspect” and “Engine”.
The aforementioned risk warning strategy based on the analysis of hidden unsafe feature network can achieve timeliness improvements in two aspects: First, in the warning process, by associating the unsafe features found during the inspection and providing related potential hidden risk information and importance ranking, it provides a direction and clues for safety management personnel with limited energy, thereby avoiding the inefficiency caused by the unplanned search method of the original risk investigation. Second, in the warning tools, a further programmable information system can be formed. Safety management personnel can input the unsafe information found during the hidden risk investigation process; the system background will quickly process the standardization and other links and feedback on the related hidden risks and sorting situation, ensuring the timeliness of the feedback of hidden risk investigation clues.
In practical application, the frequency of network model updates can also be determined according to the management needs and the computing power of computer hardware and software. We suggest that an on-condition update of the newly recorded event data follow and track the changing unsafe features. The update timing highly depends on the new-coming event number over a period. When the number of new events reaches a threshold, the proposed network model should be updated. If the threshold is set too high, it may lead to a delay in grasping unsafe features, thus missing the best opportunity for hazard investigation and control; meanwhile, a too-low threshold can easily lead to high consumption of computational resources and insignificant changes in unsafe features which cannot provide clear guidance for hazard investigation and control. Therefore, optimizing the threshold setting needs further exploration.
5. Conclusions
In order to harness the Chinese unsafe aviation event dataset more efficiently to mine useful information, this paper proposes a standardization and feature processing method for aviation unsafe data that combines transformer neural networks, cluster analysis, and feature network analysis. Initially, the transformer Chinese pre-trained models are utilized to streamline the original event text while retaining key information. A dataset for the event text summary generation task is constructed, and the selected T5, GLM, and BART models are trained and evaluated. Among them, the GLM model demonstrates the best performance in summary generation. Furthermore, by analyzing the impact of summary generation on word segmentation, the advantages of summary generation are elucidated. Based on the aviation unsafe event summary text generated by GLM, the Jieba tool is employed to extract unsafe features, which are then subjected to cluster analysis using the Simhash algorithm, resulting in a total of 9 categories and 121 features. Based on these features, a correlation matrix is solved using the PMI method, and a feature network model is established. The global and individual indicators of the network are calculated, and a data-driven hidden danger warning strategy is proposed based on this network and calculated metrics, providing early warning clues for risk investigation and control in aviation maintenance activities. This paper presents a new method for processing Chinese text data of unsafe aviation events, offering a fresh perspective for further promoting the level of aviation safety management.
6. Discussion
The evolution of aviation report texts from unstructured to semi-structured or well-structured formats is a significant development aimed at enhancing the efficiency and accuracy of data processing. However, unstructured text reports retain their value, particularly in providing detailed narratives and rich contextual information that aid in a comprehensive understanding of complex events. This study addresses the challenge of mining information from such unstructured and verbose Chinese aviation unsafe event reports, leveraging the capabilities of transformer network models to generate concise summaries that retain key information.
This study does not make a direct comparison with specific existing methods because the primary issue addressed by the method proposed is how to mine information from unstructured and verbose Chinese aviation unsafe event reports. The use of transformer network models enabled the generation of concise summaries, ensuring the cleanliness of the subsequent input data, which is a capability that traditional methods do not possess. Additionally, Section 2.4 also analyzed how the summary generation text can improve the efficiency and accuracy of Chinese text word segmentation. Considering that most datasets used in existing research are English aviation safety information texts, and there is a significant difference in language structure between Chinese and English texts, which leads to a considerable difference in word segmentation operations, we considered that from the perspective of initial data input, the method proposed in this paper is not comparable with other studies.
Although the method is innovative and effective in processing unstructured text data of Chinese unsafe aviation events, it also has some limitations:
- Generalizability of the Model: Although the Transformer models used in this study have performed well on specific datasets, their generalizability to other languages or domains may decline. This means that the model may require retraining and adjustment for new datasets to maintain its effectiveness;
- Consumption of Computational Resources: Transformer models with rather large-scale parameters typically require substantial computational resources for training and inference. This may limit their application in environments with limited resources, especially in scenarios that require real-time or near-real-time analysis;
- Limitations of Cluster Analysis: Although cluster analysis is used in this study for feature categorization, the method may be influenced by initial conditions and algorithm choices, leading to different clustering results. And that is why clustering results need manual adjustments;
- Inherent Limitations of Data-Driven Approaches: The method proposed in this study relies on historical data to predict and identify potential risk patterns. However, this approach may not fully capture emerging risk factors or those events that do not occur frequently but have significant impacts.
Despite the limitations, there are several areas where future research can build upon the existing framework. Here are potential directions for future research:
- Cross-Linguistic Application: To extend the methodology to other languages requires the adaptation of language-specific pre-trained transformer models and word segmentation tools. This expansion will enable the application of the method to a broader range of aviation reports, enhancing its global relevance;
- Model Updating Strategy Optimization: As aviation activities continue to evolve, the associated data and risk patterns will also change. Therefore, how to optimize the information update strategy according to the new-coming unsafe events, and the goal is to manage to achieve the timeliness of information updates under limited computational resources;
- Temporal Analysis of Unsafe Features: Analyzing the evolution and distribution patterns of unsafe features over time is another area for future exploration. This temporal analysis will provide insights into the dynamics of aviation safety, potentially revealing trends and patterns that can inform proactive safety measures.
Author Contributions
Conceptualization, Q.W. and R.X.; methodology, R.X. and J.Y.; software, R.X. and J.Y.; validation, Q.L. and S.T.; formal analysis, R.X.; investigation, R.X.; resources, Q.W.; data curation, Q.W.; writing—original draft preparation, R.X. and J.Y; writing—review and editing, S.T. and Z.X.; visualization, Z.X.; supervision, Q.W; project administration, Q.W. All authors have read and agreed to the published version of the manuscript.
Funding
This research received no external funding.
Data Availability Statement
The data are not publicly available due to privacy. However, some data can be accessed on the Chinese websites https://safety.caac.gov.cn/index/initpage.act (accessed on 2 February 2024) and http://scass.huahangxinyan.com/pcToReportQuery.do (accessed on 2 February 2024).
Conflicts of Interest
The authors declare no conflicts of interest.
References
- International Civil Aviation Organization. Doc9859 Safety Management Manual, 4th ed.; 999 Robert-Bourassa Boulevard: Montréal, QC, Canada, 2018. [Google Scholar]
- Aviation Safety Reporting System Database. Available online: https://asrs.arc.nasa.gov/search/dbol.html (accessed on 2 February 2024).
- National Transportation Safety Board Aviation Database. Available online: https://www.ntsb.gov/Pages/AviationQueryV2.aspx (accessed on 2 February 2024).
- Aviation Safety Network. Available online: https://aviation-safety.net/database/databases.php (accessed on 2 February 2024).
- Rose, R.L.; Puranik, T.G.; Mavris, D.N. Natural Language Processing Based Method for Clustering and Analysis of Aviation Safety Narratives. Aerospace 2020, 7, 143. [Google Scholar] [CrossRef]
- Garcia, J.S.D.; Jaedicke, C.; Lim, G.L.; Truong, D. Predicting the Severity of Runway Excursions from Aviation Safety Reports. J. Aerosp. Inf. Syst. 2023, 20, 555–564. [Google Scholar] [CrossRef]
- Madeira, T.; Melício, R.; Valério, D.; Santos, L. Machine Learning and Natural Language Processing for Prediction of Human Factors in Aviation Incident Reports. Aerospace 2021, 8, 47. [Google Scholar] [CrossRef]
- Chen, C.J.; Huang, C.N.; Yang, S.M. Application of Deep Learning to Multivariate Aviation Weather Forecasting by Long Short-term Memory. J. Intell. Fuzzy Syst. 2023, 44, 4987–4997. [Google Scholar] [CrossRef]
- Gong, W.; Guan, Z.; Sun, Y.; Zhu, Z.; Ye, S.; Zhang, S.; Yu, P.; Zhao, H. Civil Aviation Travel Question and Answer Method Using Knowledge Graphs and Deep Learning. Electronics 2023, 12, 2913. [Google Scholar] [CrossRef]
- Han, S.; Khatir, S.; Wahab, M.A. A deep learning approach to predict fretting fatigue crack initiation location. Tribol. Int. 2023, 185, 108528. [Google Scholar] [CrossRef]
- Zhang, X.; Srinivasan, P.; Mahadevan, S. Sequential deep learning from NTSB reports for aviation safety prognosis. Saf. Sci. 2021, 142, 105390. [Google Scholar] [CrossRef]
- Dong, T.; Yang, Q.; Ebadi, N.; Luo, X.R.; Rad, P. Identifying Incident Causal Factors to Improve Aviation Transportation Safety: Proposing a Deep Learning Approach. J. Adv. Transport. 2021, 2021, 5540046. [Google Scholar] [CrossRef]
- Monika; Verma, S.; Kumar, P. Generic Deep-Learning-Based Time Series Models for Aviation Accident Analysis and Forecasting. SN Comput. Sci. 2024, 5, 32. [Google Scholar] [CrossRef]
- Andrade, S.R.; Walsh, H.S. SafeAeroBERT: Towards a Safety-Informed Aerospace-Specific Language Model. AIAA Aviation Forum. 2023, 2023–3437. [Google Scholar] [CrossRef]
- Vaswani, A.; Shazeer, N.; Parmar, N.; Uszkoreit, J.; Jones, L.; Gomez, A.N.; Kaiser, L.; Polosukhin, I. Attention is all you need. arxiv 2017, arXiv:1706.03762. [Google Scholar] [CrossRef]
- Aviation Safety Information System of Civil Aviation Administration of China. Available online: https://safety.caac.gov.cn/index/initpage.act (accessed on 2 February 2024).
- Sino Confidential Aviation Safety Reporting System. Available online: http://scass.huahangxinyan.com/pcToReportQuery.do (accessed on 2 February 2024).
- González, J.; Hurtado, L.-F.; Pla, F. TWilBert: Pre-trained deep bidirectional transformers for Spanish Twitter. Neurocomputing 2021, 426, 58–69. [Google Scholar] [CrossRef]
- Choi, Y.-S.; Park, Y.-H.; Lee, K.J. Building a Korean morphological analyzer using two Korean BERT models. PeerJ Comput. Sci. 2022, 8, e968. [Google Scholar] [CrossRef] [PubMed]
- Kawara, Y.; Chu, C.; Arase, Y. Preordering Encoding on Transformer for Translation. IEEE/ACM Trans. Audio Speech Lang. Process. 2021, 29, 644–655. [Google Scholar] [CrossRef]
- Zhang, Z.; Zhang, H.; Chen, K.; Guo, Y.; Hua, J.; Wang, Y.; Zhou, M. Mengzi: Towards Lightweight yet Ingenious Pre-trained Models for Chinese. arXiv 2021, arXiv:2110.06696. [Google Scholar] [CrossRef]
- Du, Z.; Qian, Y.; Liu, X.; Ding, M.; Qiu, J.; Yang, Z.; Tang, J. GLM: General Language Model Pretraining with Autoregressive Blank Infilling. arXiv 2021, arXiv:2103.10360. [Google Scholar] [CrossRef]
- Shao, Y.; Geng, Z.; Liu, Y.; Dai, J.; Yan, H.; Yang, F.; Qiu, X. CPT: A Pre-Trained Unbalanced Transformer for Both Chinese Language Understanding and Generation. Sci. China Inf. Sci. [CrossRef]
- Lin, C.-Y.; Hovy, E.H. Automatic evaluation of summaries using N-gram co-occurrence statistics. In Proceedings of the The 2003 Human Language Technology Conference of the North American Chapter of the Association for Computational Linguistics, Edmonton, AB, Canada, 27 May–1 June 2003. [Google Scholar] [CrossRef]
- Qin, J.; Cao, Y.; Xiang, X.; Tan, Y.; Xiang, L.; Zhang, J. An encrypted image retrieval method based on simhash in cloud computing. CMC-Comput. Mater. Con. 2020, 63, 389–399. [Google Scholar] [CrossRef]
- Kwon, Y.-M.; An, J.-J.; Lim, M.-J.; Cho, S.; Gal, W.-M. Malware Classification Using Simhash Encoding and PCA (MCSP). Symmetry 2020, 12, 830. [Google Scholar] [CrossRef]
- Deng, T.; Huang, Y.; Yang, G.; Wang, C. Pointwise mutual information sparsely embedded feature selection. Int. J. Approx. Reason. 2022, 151, 251–270. [Google Scholar] [CrossRef]
- Kucuk, S.; Yukse, S.E. Pointwise Mutual Information-Based Graph Laplacian Regularized Sparse Unmixing. IEEE Geosci. Remote Sens. Lett. 2022, 19, 1–5. [Google Scholar] [CrossRef]
Disclaimer/Publisher’s Note: The statements, opinions and data contained in all publications are solely those of the individual author(s) and contributor(s) and not of MDPI and/or the editor(s). MDPI and/or the editor(s) disclaim responsibility for any injury to people or property resulting from any ideas, methods, instructions or products referred to in the content. |
© 2024 by the authors. Licensee MDPI, Basel, Switzerland. This article is an open access article distributed under the terms and conditions of the Creative Commons Attribution (CC BY) license (https://creativecommons.org/licenses/by/4.0/).