Abstract
A special feature of airbreathing hypersonic aircraft is the complex coupling between aerodynamic and propulsive performances. This study presents a rapid analysis methodology for the integration of these two critical aspects in the conceptual design of airbreathing hypersonic aircraft. Parametric modeling is used to generate a three-dimensional geometric model of an aircraft. The integrated aerodynamic and propulsive analysis is performed using a loosely coupled method. The aerodynamic analysis uses Euler equations to solve the inviscid aerodynamic forces, while the viscous forces are estimated using semi-empirical engineering methods. The propulsion system is modeled using hybrid one- and three-dimensional approaches. The inlet aerodynamic performance is simulated using three-dimensional simulation based on the Euler equations. The ramjet performance is estimated using a quasi-one-dimensional mathematical model. Nozzle simulation is performed using a one-dimensional plume method. The entire computational process is integrated and can be run automatically. The usefulness of the method is demonstrated through aerodynamic and propulsive performance evaluations in the conceptual design of a notional airbreathing hypersonic aircraft.
1. Introduction
Airbreathing hypersonic technology is a critical frontier in the strategic development path for both military and civil aircraft and is recognized as a technological revolution in the history of aviation, following propeller and jet propulsion [1,2]. Specifically, horizontal take-off and landing airbreathing hypersonic aircraft can use conventional runways, similar to conventional aircraft operations. This kind of aircraft is characterized by the ability to fly over a wide range of speeds, from subsonic to hypersonic, and to traverse vast airspaces from the sea level to near space [3]. Furthermore, airbreathing hypersonic technology plays an important role in reusable space transport systems [4,5,6,7].
Traditional engines have difficulties meeting the demanding flight requirements of wider speed ranges and airspaces, which has prompted research into alternative propulsions. Among these alternatives, combined-cycle engines, such as Turbine-Based Combined Cycle (TBCC), have emerged as viable options for airbreathing hypersonic aircraft [8]. For such an aircraft, the front body of the aircraft usually acts as a pre-compression component of the engine, effectively pressurizing and decelerating the incoming flow while also generating some of the lift. The rear body of the aircraft is intentionally designed as an expansion nozzle, extending the internal nozzle of the engine and using high-pressure gas to generate partial lift and pitching moment. Changes in the flight conditions lead to changes in the engine inlet parameters, which subsequently affect the engine operating conditions. This, in turn, causes changes in the flow within the nozzle, resulting in a corresponding change in the pressure distribution along the aft body of the aircraft. These complex relationships mean that there exists significant coupling between the airframe and the engine. In the conceptual design of such aircraft, it is essential to consider this coupling and to conduct integrated aeropropulsive analysis rapidly.
An integrated analysis of aerodynamic and propulsive performance with a consideration of the coupling between the airframe and the engine presents a formidable challenge. Some researchers have conducted extensive high-fidelity, multidimensional analyses and tests on this challenge [9,10,11]. However, such high-fidelity simulations and tests require considerable resources. During the conceptual design phase, frequent adjustments to aircraft configuration require rapid analysis of aerodynamic and propulsive performance. Therefore, the use of engineering methods, semi-empirical formulae and low-dimensional analytical models is common in the conceptual design phase. Chavez and Schmidt [12] developed an analytical aeropropulsive model of a two-dimensional hypersonic aircraft using Newtonian theory for rapid aerodynamic analysis and a one-dimensional aero/thermo model for simulation of the propulsive performance of a scramjet. Bolender and Doman [13] further refined these methods with the use of the oblique shock theory and Prandtl–Meyer theory for rapid aerodynamic analysis of the airframe and inlet. However, these methods are primarily suited to simple two-dimensional shapes and have a limited ability to adapt to complex three-dimensional geometries. Charles et al. [14] investigated an integrated computational fluid dynamics (CFD) tool for studying the aerodynamics and propulsion of a Hyper-X vehicle. In their study, the Euler equations were used to solve the aerodynamic performance of the airframe, the inlet, and the nozzle, and the boundary-layer theory was used to simulate viscous effects. A one-dimensional chemical equilibrium cycle analysis code was used to approximate the flow field of the combustor. Bowcutt et al. [15] presented a comprehensive multidisciplinary optimization tool for hypersonic vehicles. In their study, the aerodynamic analysis used various engineering methods, including the slender-body theory and vortex lattice techniques for subsonic and supersonic speeds, while the surface element method was used for hypersonic speeds. In terms of the engine model, the inlet was treated using the 3D Reynolds-Averaged Navier–Stokes (RANS) equations. The subsonic ram modes of the combustor were represented as a 0D model, and the supersonic ram modes were modeled as a 1D model. The nozzle was characterized using a quasi-3D CFD approach. Their method provides a comprehensive approach for rapid aerodynamic analysis over the full speed range. However, it uses several different analytical methods for different speeds, requiring the creation of different analytical models. In addition, the continuity of computational results over the entire speed range remains a factor that has yet to be definitively established. Piscitelli et al. [16] developed a tool for rapid analysis of the aerodynamic and propulsive integration of three-dimensional airbreathing hypersonic vehicles. This tool used the modified Newtonian theory and the Prandtl–Meyer formula for rapid analysis of aerodynamic performance. The oblique shock theory was used to analyze the engine inlet performance, while the quasi-one-dimensional approach was used for the isolator–combustor and the isentropic expansion assumption was used to simulate the nozzle. The inlet flow field became complicated at the off-design points, making the calculation of the combustor inlet conditions more challenging, particularly with respect to the oblique shock theory.
The objective of this study is to develop a rapid integrated method for predicting the aerodynamic and propulsive performances in the conceptual design of an airbreathing hypersonic aircraft. The rapid integrated analysis of aerodynamics and propulsion is achieved by coupling 3D Euler equations with a quasi-one-dimensional model specific to dual-mode ramjets. The Euler equations are capable of solving aerodynamic performance over a wide range of speeds from subsonic to hypersonic. A new feature in this study is that the parametric modeling of aircraft geometry is integrated with aerodynamic and propulsive analyses, which streamlines the design process and enables efficient exploration of design alternatives in the conceptual design.
The subsequent sections of this paper are structured as follows. In Section 2, a force accounting system governing the aerodynamics and propulsion of airbreathing hypersonic aircraft is introduced. In Section 3, the integrated method is explained in detail, including the parametric modeling of the aircraft geometry, rapid inviscid aerodynamic analysis with viscous correction, and propulsive modeling. In Section 4, the usefulness of the method is illustrated through the aerodynamic and propulsive performance evaluations in the conceptual design of a notional airbreathing hypersonic aircraft.
2. Force Accounting System
For airbreathing hypersonic aircraft, the airframe shape before the engine has a great influence on the engine inlet flow. And the inlet and nozzle of the engine are usually designed with a large planar area, which improves the compression efficiency of the engine inlet and the expansion efficiency of the flow, and is critical to the engine thrust. At the same time, these components have a significant influence on both lift and pitching moment, so they are both propulsive components and aerodynamic components. This leads to the existence of different methods that divide the propulsive components and the aerodynamic components, which makes it impossible to directly compare the propulsive and aerodynamic performances (thrust, specific impulse, lift coefficient, etc.) of different programs, and makes the evaluation of different programs difficult [17].
In this paper, the whole aircraft is divided into propulsive components and aerodynamic components, as shown in Figure 1, in which the red profile is the propulsive interface and the rest of the profile is the aerodynamic interface. The components in the propulsive analysis include the inlet, the isolator, the combustor, and the nozzle. The aerodynamic components are the airframe components aside from the propulsive components.
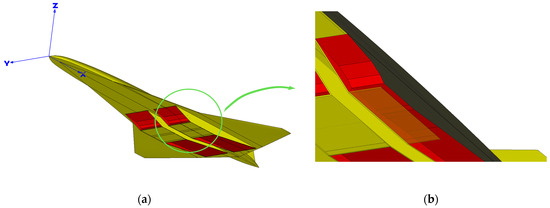
Figure 1.
Diagram of the force accounting system: (a) diagram of the entire aircraft, and (b) details of the propulsive profile (the red profile is the propulsive interface and the rest is the aerodynamic interface).
The propulsive performance (net thrust coefficient and specific impulse) is predicted based on the forces acting on the propulsive components. The net thrust coefficient of the engine is defined as follows:
where Finlet,x is the axial force acting on the inlet; Fiso-comb is the isolator–combustor thrust; Fnozzle,x is the axial force acting on the nozzle; q is the dynamic pressure; and S is the reference area.
The normal-force coefficient of the engine is defined as follows:
where Finlet,z is the normal force on the inlet, and Fnozzle,z is the normal force on the nozzle.
The specific impulse of the engine is defined as follows:
where f is the mass flow of fuel; g0 is the acceleration due to gravity at the sea level; Φ is the fuel equivalence ratio; fst is the stoichiometric fuel/air ratio; and air is the mass flow of captured air.
The aerodynamic performance (lift, drag, and moment) of the aircraft is computed based on the forces acting on the aerodynamic components.
In the following sections, we use the force accounting system defined in this section to compute the aerodynamic performance and propulsive performance.
3. Integrated Aeropropulsive Analysis Method
In this section, the procedure of the integrated aerodynamic and propulsive analysis is described briefly, followed by a detailed description of the main elements of the process, including the geometric parametric modeling method, the aerodynamic analysis method, and the propulsive analysis method.
3.1. Procedure of the Integrated Aeroproplusive Analysis
The aerodynamic and propulsive performances of the aircraft are simulated using a loosely coupled method that combines the 3D CFD method with quasi-one-dimensional models to solve the internal and external flows of the aircraft. As shown in Figure 2, a simulation model is used for the performance analysis of each component of the aircraft. The pressure distributions of the aerodynamic components and the inlet are solved using 3D Euler equations. Viscous corrections are added. The flow field in the isolator and combustor is simulated using a quasi-one-dimensional model. The pressure distribution at the nozzle surface is estimated using a one-dimensional plume method.
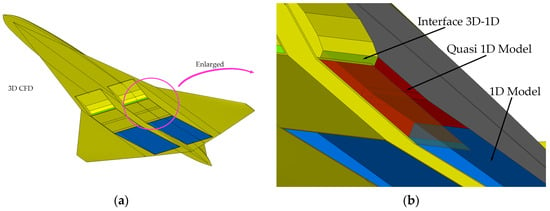
Figure 2.
Illustration of integrated aeropropulsive multi-dimensional models: (a) simulation model of the aerodynamic components, and (b) details of the propulsion simulation models.
The integrated analysis process for the aerodynamic and propulsive performances consists of parametric modeling, aerodynamic analysis, and propulsive analysis. Its flowchart is depicted in Figure 3.

Figure 3.
Procedure of the integrated aeropropulsive analysis method.
- (1)
- The geometry module is used to generate a 3D geometric model of the aircraft using the parametric modeling method.
- (2)
- The aerodynamic module is used to compute the internal and external inviscid flow fields of the aircraft with the condition of no combustion. The aerodynamic force is corrected with viscous forces.
- (3)
- The area-weighted average is used to normalize the three-dimensional flow parameters at the inlet of the isolator (the outlet of the inlet) to one-dimensional parameters. These one-dimensional parameters are calculated from the multi-dimensional flow parameters using the area-weighted average method: , where is the averaged flow parameters, φ is the flow parameters (such as pressure and velocity), and A is the area of the inlet of the isolator. The averaging process could lead to inaccuracy. But for a rapid estimation of the propulsive performance, this inaccuracy could be acceptable in the conceptual design stage.
- (4)
- The propulsion module is used to simulate the flow field of the isolator and combustor using a quasi-one-dimensional model, and to estimate the pressure distribution on the surface of the nozzle using the one-dimensional plume method.
- (5)
- The inviscid CFD results of the isolator, combustor, and nozzle from Step 2 are replaced with the results from Step 4 (using the quasi-one-dimensional model). After that, the pressure distribution of the entire aircraft with the engine operating is obtained.
- (6)
- According to the force accounting system defined in this paper, the aerodynamic performance and propulsive performance of the aircraft are computed using the pressure distribution from Step 5.
The above process can be conducted automatically through an integration of the parametric modeling and aerodynamic and propulsive analysis methods.
3.2. Parametric Modeling Method of Geometry
Parametric modeling of geometry is used to generate a 3D geometric model of the conceptual design. Through the use of the parametric modeling method, a 3D geometric model of the aircraft can be rapidly generated by defining a set of geometric parameters.
The parametric modeling of the aircraft includes the following aspects: (1) define the geometric parameters of the conceptual design; (2) generate a 3D geometric model; (3) extract the geometric feature information; and (4) automatically generate the surface mesh.
- (1)
- Definition of geometric parameters
According to the characteristics of the aircraft in this study, the aircraft components are divided into three categories: fuselage, wing, and propulsion.
To describe the fuselage shape, several axial sections and guidelines are used to define the fuselage components, as shown in Figure 4a. The parameterized definition of each section is shown in Figure 4b. Given the coordinates of the control points of the upper and lower sections, the section shape can be defined using a B-spline curve.

Figure 4.
Definition of the parameters of the fuselage: (a) definition of the fuselage length and the control section station (A, B, C are the three sections of the fuselage), and (b) definition of the control points of the section.
The wing category includes the wing and empennage components. The main parameters of the wing configuration are shown in Figure 5. The geometric model of the airfoil is represented by the Class Function/Shape Function Transformation (CST) method [18].
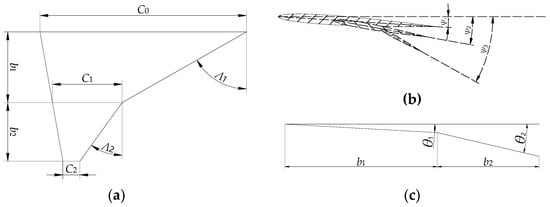
Figure 5.
Definition of wing parameters: (a) wing planform; (b) angle of twist; and (c) angle of dihedral.
The definition of the propulsion geometry is shown in Figure 6, which includes the shapes of the inlet, the internal flow path, and the width and shell thickness of the nacelle.

Figure 6.
Definition of propulsion geometry: (a) inlet and internal flow path, and (b) width and shell thickness of nacelle.
- (2)
- Generation of 3D geometric models
After defining the parameters of the aircraft configuration and the propulsion geometry, CAD software (such as CATIA V5R21) can be used to generate a 3D geometric model. The API interface of CATIA is used to implement the automation from parameter definitions to 3D geometric model generation. That is, the automation of parametric modeling is achieved by using the VBA language to record CATIA scripts as macro commands in EXCEL. In this way, a 3D geometric model of the aircraft can be generated by simply entering the geometric parameters of the aircraft in EXCEL. See Section 4 for an example of a 3D geometric model generated in this way.
- (3)
- Extraction of geometric feature parameters
The aircraft geometric feature parameters, such as the reference area, reference length, and wetted area, are calculated based on the 3D geometric model generated. These feature parameters are used in the aerodynamic and propulsive performance analysis.
- (4)
- Generation of surface mesh
The 3D geometric model is used for aerodynamic and propulsive analysis. To provide a suitable surface mesh for the aerodynamic and propulsive analysis, the API interface of Pointwise is used to convert the full 3D geometric model into a mesh model in the STL format. In addition, the mesh of each component (fuselage, wing, inlet, isolator, combustor, nozzle, etc.) is marked so that the forces acting on these components can be identified.
3.3. Aerodynamic Analysis Method
The conceptual design of an aircraft is an iterative process that requires the aerodynamic analysis method used to have the following features:
- (1)
- It should have the ability to generate computational grids for different aircraft configurations automatically.
- (2)
- The flow field solution should be fast and have good accuracy.
- (3)
- It can be used within a wide flight speed range from subsonic to hypersonic speeds.
In this paper, the inviscid aerodynamic performance of the aircraft is computed using Cart3D (an inviscid CFD package), and viscous force is estimated using a semi-empirical technique. This approach can satisfy the need for rapid iteration in the conceptual design. Cart3D is a finite volume method based on the Euler equations that is suitable for the flow field analysis of an aircraft with a wide speed range from subsonic to hypersonic speeds [19]. It is capable of automatic Cartesian mesh generation and requires less computational time. Cart3D has shown good agreement with experimental data and high-fidelity CFD solutions in several studies [20,21,22,23].
Because Cart3D is an inviscid solver, the aerodynamic forces calculated by Cart3D lack viscous forces. A correction for viscous forces on the aircraft is required. When the flight speed is less than Ma 5, the viscous drag coefficient is calculated by using the semi-empirical engineering estimation method [24], which is based on the boundary-layer theory and the correction of the component shape factor. When the flight speed is larger than Ma 5, the reference temperature method is often used to estimate the viscous drag. In this paper, Eckert’s modified reference enthalpy method is used to calculate the frictional drag at hypersonic speeds when the Mach number is greater than 5 [25].
3.4. Propulsive Analysis Method
The propulsion system in this study adopts a combined-cycle engine (i.e., TBCC) with both turbojet and ramjet modes of operation. This paper focuses on the integrated analysis of aerodynamics and propulsion in the case of the ramjet mode of operation (Ma > 3). The ramjet of the airbreathing hypersonic aircraft is a dual-mode engine with subsonic and supersonic modes, consisting of four parts: an inlet, an isolator, a combustor, and a nozzle, as shown in Figure 7. A combination of one-dimensional and three-dimensional methods is used to analyze the performance of the ramjet in order to improve the computational efficiency while ensuring a satisfied accuracy. Among them, the inlet aerodynamic performance is simulated by using Cart3D, while the performance of the isolator, combustor, and nozzle are analyzed using a one-dimensional model. The parameters of the entrance of the isolator (i.e., the exit of the inlet) are three-dimensional, and they are one-dimensionalized using the area averaging method. Then, these one-dimensionalized parameters are transferred to the mathematical model of the isolator and combustor.

Figure 7.
Diagram of the propulsion components.
3.4.1. Analysis Method for Isolator and Combustor
The quasi-one-dimensional mathematical model of the isolator and combustor of the ramjet is described by the one-dimensional gas dynamics equations [26], which is based on the following assumptions: (1) the gas is a calorically perfect gas and satisfies the ideal gas equation of state; (2) the flow is constant; (3) the flow is quasi-one-dimensional, i.e., it is assumed that the flow parameters and the engine geometric profiles are both functions of the engine axial position, x; and (4) there is no heat exchange in the flow path within the external field, i.e., heat radiation and heat conduction are neglected.
The governing equations for the one-dimensional flow equations are as follows [26]:
where Ma is the Mach number; P is pressure; T is temperature; ρ is density; V is velocity; A is the area of the cross section determined by the geometric profile of the isolator and combustor; Tt is the total temperature; ; Cf is the wall friction coefficient, which is about 0.003~0.005, and is selected to be 0.003 here; and D is the hydraulic diameter, with , where C is the cross-sectional perimeter.
In this paper, the polynomial equation in reference [26] is used to simulate the combustion process:
where Tt3 is the total temperature at the entrance of the combustor; the heating ratio , where Hf is the lower heating value of fuel, ηc is the combustor efficiency factor, and Cp is the specific heat of fuel; θ is an empirical constant that depends on the mode of fuel injection and fuel–air mixing, and its value is about 5~10, which is selected to be 10 here; and the dimensionless axial position , where xi is the location of the fuel injector, and x5 is the position of the exit of the combustor.
Under different flight conditions and different mass flow of fuel, the operating mode of the ramjet will be different. For a given mass flow of fuel, as the flight conditions change, the operating mode changes from an unseparated supersonic mode to a subsonic mode. The operating mode can be defined as follows [26]:
- (1)
- Unseparated supersonic mode
When the mass flow of fuel is low, the pressure in the combustor is low, the flow is not separated, and the isolator does not play a matching role at this time.
- (2)
- Separated supersonic mode
As the mass flow of fuel gradually increases, the combustor pressure gradually increases. The flow separates when the maximum combustor pressure reaches the value calculated based on Equation (10). The flow separates through the boundary layer to the combustor entrance, causing flow separation in the isolator. In addition, the isolator adapts the length of the shock train so that the output of the isolator matches the input of the combustor.
- (3)
- Transonic mode
As the mass flow of fuel continues to increase, there is a region in the combustor where the Mach number is less than 1. At this point, the flow in the isolator–combustor decreases from supersonic to subsonic, and then increases from subsonic to supersonic. It means that there are two points in the isolator–combustor where the Mach number is 1. The positions of these two points can be estimated via the combination of flow separation (dA/A) and fuel combustion (dTt/Tt). The isolator continues to adjust the shock train length to match the combustor parameters.
- (4)
- Subsonic mode
As the mass flow of fuel continues to increase, the thermal throat in the upstream separated flow region of the combustor gradually moves to both ends until the Mach number at the combustor inlet is less than 1. The isolator continues to adjust the length of the shock train to match the combustor parameters.
If the length of the shock train is greater than the length of the isolator, the shock train in the isolator is detached from the isolator entrance, resulting in the engine being inoperative.
It is important to note that the cause-and-effect relationship in the combustion system is as follows: (1) the pressure rises as a result of heat addition, and (2) if the pressure rise exceeds some threshold value, the boundary layer separates so that (3) the oncoming supersonic flow is turned into itself by the effective area in the separated flow region, and is compressed into a confined core flow through an oblique shock train until the confined core flow pressure matches the pressure in the flow separation region in the combustor [26].
The fourth-order Runge–Kutta method is used to solve the flow in the isolator and combustor under the given inlet conditions of the isolator. In the separated flow region of the isolator and combustor, the rule of changing the cross-sectional area is no longer the geometric profile. Thus, the one-dimensional flow control equations miss a constraint. Therefore, an additional constraint needs to be introduced.
The static pressure in the separated flow region of the combustor is usually assumed to follow an isostatic pressure distribution [26] or an exponential distribution [27]. Generally, it is difficult to estimate the coefficients of an exponential distribution without experimental results. For simplification, the assumption of isostatic pressure distribution is adopted in this study so that the system of equations can be closed.
The criterion for deciding whether flow separation has occurred in the combustor is assumed to be the same as the one in the inlet [28]:
where Pmax is the maximum static pressure in the combustor; Pin is the static pressure in the combustor entrance; and Main is the Mach number in the combustor entrance.
The region of the shock train in the isolator is the separated flow region. The length of the shock train in the isolator is obtained using Billig’s empirical formula [29]:
where L is the length of the shock train; D is the hydraulic diameter of the isolator; is the momentum thickness of the boundary layer; is the Reynolds number of the thickness of the local boundary layer; Pe is the static pressure at the exit of the isolator, Pi is the static pressure at the starting position of the shock train; and Mai is the Mach number at the starting position of the shock train.
The static pressure distribution of the shock train uses the cubic polynomial empirical formula [26]:
where the dimensionless axial position ; xi is the starting position of the shock train; and x3 is the exit of the isolator.
In summary, the flowchart of the isolator and combustor simulation is depicted in Figure 8.
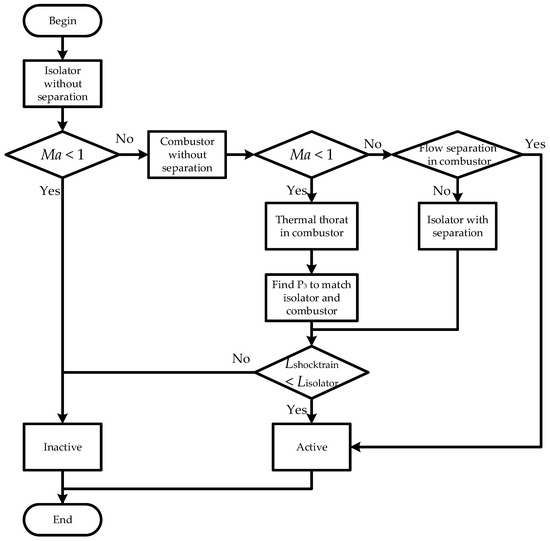
Figure 8.
Flowchart of the isolator and combustor simulation.
- (1)
- For the given input flow conditions of the isolator, simulate the entire isolator with the assumption that there is no flow separation.
- (2)
- If the Mach number at any point in the isolator is less than 1, the engine is inactive.
- (3)
- If the Mach number at any point in the isolator is greater than 1, simulate the entire combustor with the assumption that there is no flow separation.
- (4)
- If the Mach number at any point in the combustor is greater than 1, go to Step 8.
- (5)
- If the Mach number at any point in the combustor is greater than 1, check the maximum pressure Pmax in the combustor to see if it meets the criterion of Equation (10). If it meets the criterion, the engine operates in the unseparated supersonic mode.
- (6)
- If it does not meet the criterion, flow separation occurs in the combustor and the pressure in the separated region from the entrance of the combustor to the position of Pmax is constant. Then, . This means that the flow separation occurs first in the isolator.
- (7)
- Simulate the isolator with the assumption that flow separation has occurred and the pressure at the exit of the isolator is Pmax. Assume the length of the shock train and the flow condition at the beginning of the shock train can be obtained in Step 1. Then, with the use of Equations (11) and (12), another value of the pressure at the exit in the isolator, P3′, is estimated. Change the assumed length of the shock train until . If the length of the shock train is less than the length of the isolator, the engine operates in the separated supersonic mode. If the length of the shock train is more than the length of the isolator, the engine is inactive.
- (8)
- Assume P3 and simulate the isolator with flow separation using the method mentioned in Step 7. Then, assume the pressure in the entire combustor is constant, and another area distribution of the combustor A′(x) is estimated. Then, B(x) = A(x) − A′(x). If any point of B(x) is less than 0, the engine is inactive. Change P3 until there is a point x0, where . The flow in the combustor separates from the entrance to the point x0. Then, estimate the combustor with flow separation. The engine operates in the transonic mode and subsonic mode.
A MATLAB code was developed based on the above method for the isolator and combustor simulation. The code was validated using the experimental results obtained from the University of Virginia [30]. This test engine consists of an arc heater, a Laval nozzle, and a combustor, as shown in Figure 9a. The incoming flow conditions in the isolator are as follows: total pressure is 331 kPa, total temperature is 1010 K, and the Mach number is 2.03. Hydrogen was injected into the combustor from a ramp injector at a Mach number of 1.7. The fuel equivalence ratio Φ varied from 0 to 0.34 in the experiment.
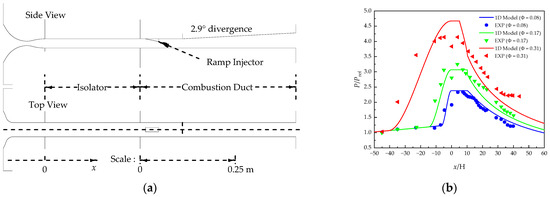
Figure 9.
Validation of the isolator–combustor model. (a) Schematic of the DMSJ combustor with the isolator. (b) Comparison of the experimental results and quasi-one-dimensional model results. Pref = 40 kPa.
The comparison between the experimental data and the results predicted by the code is shown in Figure 9b. When the fuel equivalence ratio is 0.08, the engine is in the supersonic mode; when the fuel equivalence ratio is 0.17, the engine is in the transonic mode; and when the fuel equivalence ratio is 0.31, the ram engine is in the subsonic mode. With an increase in the fuel equivalence ratio, the back pressure of the combustor increases, the combustor gradually transitions from the supersonic mode to the transonic and subsonic modes, the length of the shock train in the isolator increases, and the intensity of the shock wave gradually increases. From the pressure distribution of the isolator–combustor in Figure 9b, it can be seen that the predicted results of the quasi-one-dimensional model of the ramjet are in good agreement with the experimental data, which can qualitatively reflect the matching relationship between the isolator and the combustor, and quantitatively present a satisfied accuracy.
3.4.2. Analysis Method for Nozzle
The one-dimensional plume method was used to solve the nozzle performance in this study. In a unilaterally expanding nozzle, the determination of the lower plume (i.e., the free boundary) is crucial. After determining the shape of the free boundary, the unilaterally expanding nozzle can be considered to be a closed nozzle consisting of a solid nozzle profile and a virtual free boundary, as shown in Figure 10. The one-dimensional flow control equations introduced in the previous section (Equations (4)–(8)) can be used to solve the flow parameters.
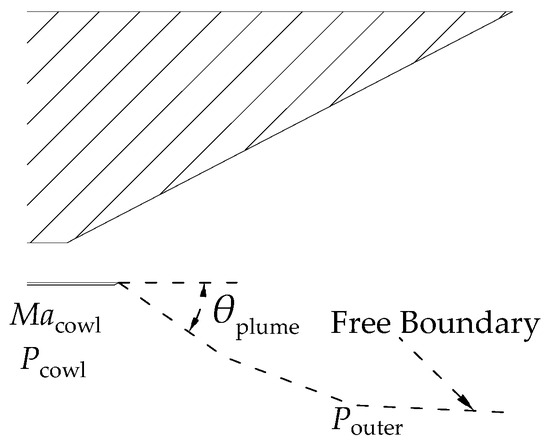
Figure 10.
Diagram of nozzle model.
The shape of the free boundary is determined according to the modified Newtonian theory. The pressure on the free boundary is as follows [25]:
where the subscript cowl refers to the freestream conditions under the cowl and outside the plume.
In the nozzle simulation, the nozzle is first divided into a number of segments, and then an integral form is used to solve for each segment. In the solution of each segment, under a given inlet condition, the outlet condition is only related to the geometric parameter (i.e., the deflection angle of the free boundary). The deflection angle of the free boundary (i.e., θplume) can be obtained by combining Equations (5), (13) and (14). If the combination of the equations provides no solution or the deflection angle is too large (more than 75°), it is assumed that the nozzle pressure cannot expand to the pressure outside the free boundary, and the deflection angle is fixed at a maximum value of 75°. After the shape of the free boundary is determined, the remaining flow parameters in the nozzle can be calculated using the one-dimensional flow equation.
The results from the one-dimensional model of the nozzle were compared with the 3D simulation results obtained from Fluent for verification. The geometric model of the nozzle is shown in Figure 11a. The flight conditions of the nozzle are set as follows: the Mach number is 4, the flight altitude is 20 km, the angle of attack is 0°, and the fuel equivalence ratio is 0. The flow conditions in Fluent are set accordingly. The pressure far-field conditions are set as follows: the static pressure is 5529 Pa, the static temperature is 217 K, and the Mach number is 4. The mass-flow inlet conditions are set as follows: the static pressure is 36,604 Pa, the total temperature is 911 K, and the mass flow is 24.6 kg/m2. The pressure distribution on the upper surface of the nozzle, which was computed by using the one-dimensional model of the nozzle and Fluent, are shown in Figure 11b. The pressure distribution on the upper surface of the nozzle obtained using the one-dimensional model and Fluent is similar. The forces acting on the upper surface of the nozzle obtained from Fluent and the one-dimensional model are 39.47 kN and 31.4 kN, respectively. The result of the one-dimensional model is smaller by 20% compared to that obtained from Fluent.
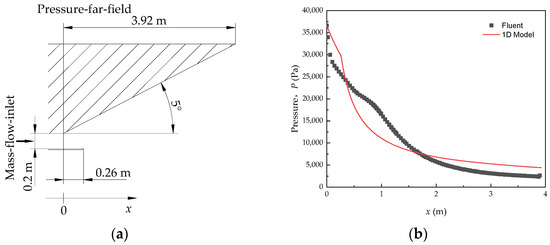
Figure 11.
Validation of the nozzle model. (a) Configuration of the nozzle. (b) Comparison of the results from Fluent simulation and those from the one-dimensional plume model.
4. Application Example
A computer code that integrates parametric modeling with aerodynamic and propulsive analyses was developed according to the method presented in Section 3. A notional airbreathing hypersonic aircraft was used to illustrate the usefulness of the code in the conceptual design of such an aircraft. The aircraft was designed to cruise at Mach 6 at 30 km.
The initial values of the main parameters of the aircraft geometry are listed in Table 1. By using the parametric modeling method, a 3D geometric model of the aircraft was generated, as shown in Figure 12.

Table 1.
The values of the main geometric parameters for the initial conceptual design.
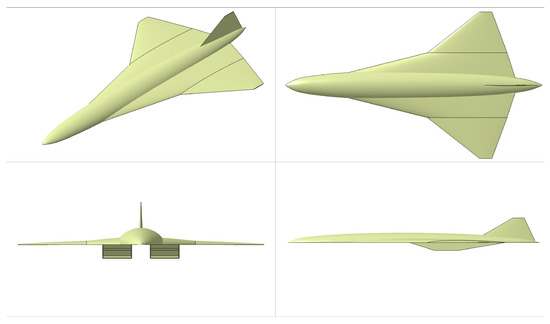
Figure 12.
Three-dimensional geometric model of the initial conceptual design.
The thrust-to-drag ratio is one of the major issues concerned in the conceptual design of such an airbreathing hypersonic aircraft. The aerodynamic drag and propulsive thrust of the initial design were evaluated by using the code, as shown in Figure 13. As can be seen in the figure, even if the fuel equivalence ratio Φ takes the maximum value of 0.7, the thrust is still unfortunately less than the drag. Therefore, the drag from the aerodynamic components should be reduced and the thrust should be increased.
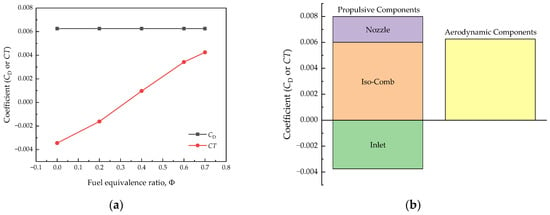
Figure 13.
Performance of aerodynamics and propulsion. (a) Comparison of drag and net thrust coefficient. (b) Drag distribution under the conditions of Ma = 6, H = 30 km, AOA = 0°, and Φ = 0.7.
Based on the above observations of Figure 13, the initial values of the geometric parameters of the aircraft were revised. The revised parameters are listed in Table 2. The geometric model of the revised design was regenerated by using the code, as shown in Figure 14. Figure 15 presents the aerodynamic drag and propulsive thrust of the revised design. To reduce the drag from the aerodynamic components, the height of the fuselage was reduced. The drag was reduced by 1.7% due to the reduction in the cross-sectional area of the fuselage. To increase the thrust, the deflection angle and the length of the inlet were redesigned, and the length of the nozzle was increased. The thrust of the isolator-combustor was increased by 41.3%. The thrust of the nozzle was increased by 2.8%. But the drag of the inlet was increased by 26.1%. The overall effect is that the thrust-to-drag ratio of the revised design is larger than one when Φ is larger than 0.7.

Table 2.
Geometric parameters of the revised design.
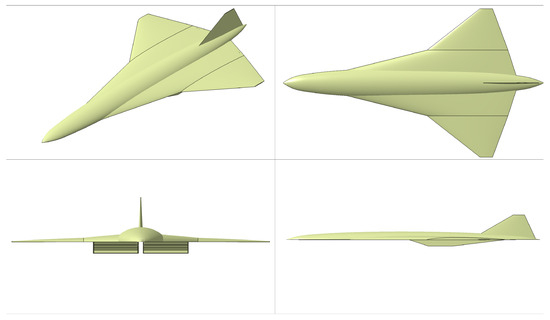
Figure 14.
Three-dimensional geometric model of the revised conceptual design.
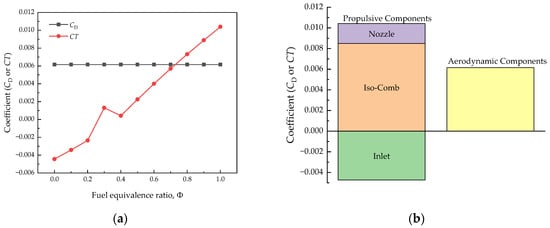
Figure 15.
Performance of aerodynamics and propulsion. (a) Comparison of drag and net thrust coefficient. (b) Drag and thrust distribution under the conditions of Ma = 6, H = 30 km, AOA = 0°, and Φ = 0.7.
The followings present the more comprehensive aerodynamic and propulsive performances of the revised design.
Figure 16 presents the aerodynamic performance of the revised design. As can be seen from the figure, the slope of the lift coefficient curve decreases with an increase in the Mach number. The zero-lift drag coefficient decreases with an increase in the Mach number.
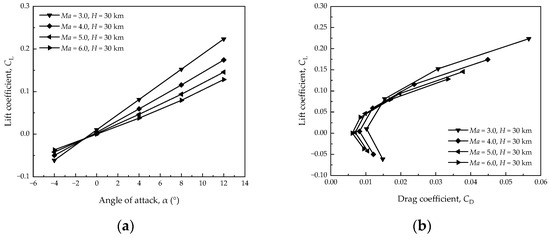
Figure 16.
Lift and drag coefficients for the illustrative aircraft: (a) lift coefficient curve, and (b) lift-to-drag polar.
The impacts of the flight condition (altitude, Mach number, and angle of attack) and the fuel equivalence ratio on the propulsive performance were also investigated, as shown in Figure 17. From Figure 17, it can be seen that the specific impulse and thrust coefficients show a general increasing trend with an increase in the fuel equivalence ratio. The reason is that an increase in the fuel equivalence ratio leads to increases in the total temperature and the energy of the flow in the combustor. As a consequence, the thrust of the engine increases. With an increase in the Mach number, the variable range of the fuel equivalence ratio expands. As can be seen from the isolator–combustor validation in Section 3.4.1, with an increase in the fuel equivalence ratio, the separated flow region of the combustor in the isolator gradually expands, and the length of the shock train in the isolator gradually increases. When the length of the shock train exceeds the length of the isolator, the engine will be inactive. For a given fuel equivalence ratio, as the Mach number increases, the thrust decreases. As the Mach number increases, the Mach number and pressure at the entrance in the isolator increase. The Mach number and pressure at the exit in the combustor increase as well, but not as much as those at the entrance of the combustor. Consequently, the thrust decreases. When the fuel equivalence ratio increases, the trend of decrease in the thrust becomes more apparent.
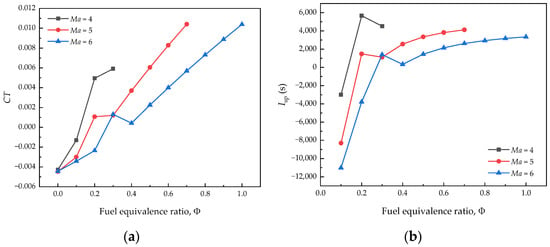
Figure 17.
Impacts of Mach number on propulsive performance at H = 30 km and AOA = 0°: (a) variation in thrust coefficients with the fuel equivalence ratio at different Mach numbers, and (b) variation in specific impulse with the fuel equivalence ratio at different Mach numbers.
Figure 18 presents the impacts of flight altitude on propulsive performance at Ma = 6 and AOA = 0°. From Figure 18, it can be seen that the specific impulse and thrust coefficient increase with an increase in the fuel equivalence ratio. As altitude decreases, the thrust coefficient increases slightly and the specific impulse decreases. For a given fuel equivalence ratio, the thrust coefficient decreases slightly with altitude. As altitude increases, density decreases and the mass flow decreases, which results in a decrease in the thrust.
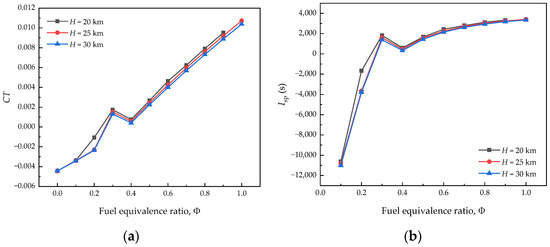
Figure 18.
Impacts of altitude on propulsive performance at Ma = 6 and AOA = 0°: (a) variation in thrust coefficients with the fuel equivalence ratio at different altitudes, and (b) variation in specific impulse with the fuel equivalence ratio at different altitudes.
Figure 19 presents the impacts of angle of attack on propulsion performance. It can be seen from Figure 19 that the specific impulse and thrust coefficient of the aircraft increase with an increase in the angle of attack at the same flight altitude and Mach number. Clearly, an increase in the angle of attack corresponds with an increase in the slope of the aircraft airframe as well as the inlet. Thus, the velocity at the entrance of the isolator decreases further, and the static pressure increases further. At the same fuel equivalence ratio, the static pressure and static temperature of the combustor increase, which results in a larger thrust produced by the combustor and nozzle. When the fuel equivalence ratio is small, the heat addition in the combustor is small and the increase in pressure there is small. As the angle of attack increases, the pressure and Mach number at the entrance in the isolator increase. Hence, the thrust decreases with the angle of attack. When the fuel equivalence ratio becomes larger, the increase in pressure in the combustor is significant. As the angle of attack increases, the pressure and Mach number at the entrance in the isolator increase, and the static pressure and static temperature in the combustor increase further. As a result, the thrust increases with the angle of attack.
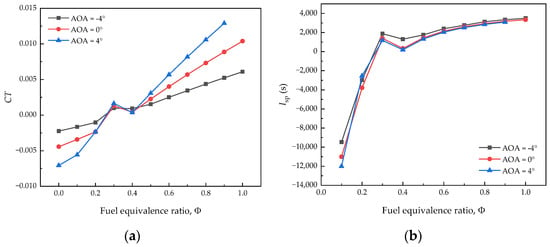
Figure 19.
Impacts of angle of attack on propulsive performance at Ma = 6 and H = 30 km: (a) variation in thrust coefficients with the fuel equivalence ratio at different angles of attack, and (b) variation in specific impulse with the fuel equivalence ratio at different angles of attack.
Figure 20 presents the impacts of the fuel equivalence ratio on the pitching moment under typical flight conditions. From Figure 20, the forces resulting from the aerodynamic components and nozzle provide the nose-down pitching moment, while the forces resulting from the inlet and isolator–combustor provide the nose-up pitching moment. As the fuel equivalence ratio increases, the thrusts of the isolator–combustor increase, resulting in the nose-up pitching moment. However, as the fuel equivalence ratio increases, the pressure on the nozzle increases, which leads to a larger nose-down pitching moment. As the fuel equivalence ratio increases, the pitch moments on the inlet and the aerodynamic components remain the same. The fuel equivalence ratio affects the flow in the isolator–combustor and nozzle, but the disturbance there does not affect the upstream supersonic flow. As a result, the forces acting on the inlet and aerodynamic components remain the same.
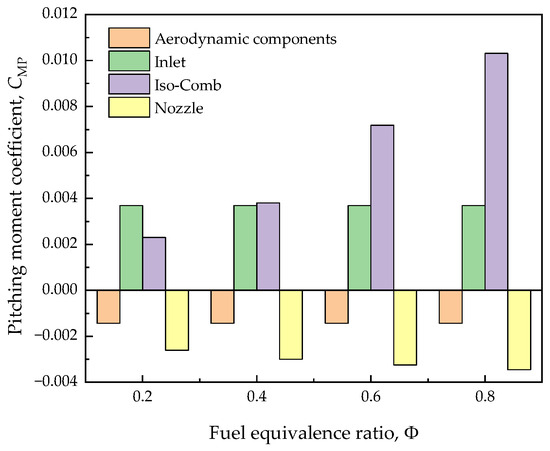
Figure 20.
Impacts of fuel equivalence ratio on pitching moment at Ma = 6, H = 30 km, and AOA = 4°. (The center of moment is set at 25% of the wing’s mean aerodynamic chord).
5. Summary
This study explores a rapid integrated analysis method of aerodynamics and propulsion for the conceptual design of airbreathing hypersonic aircraft. A parametric geometric modeling approach is used to generate a 3D geometric model of the aircraft. An integrated analysis of aerodynamics and propulsion is performed using a loosely coupled method. For the inviscid aerodynamic analysis, rapid aerodynamic analysis is performed on both the external flow field and the engine inlet using Cart3D. A semi-empirical engineering method is used to estimate the viscous effects. A quasi-one-dimensional model is used to simulate the ramjet performance, while a one-dimensional plume calculation method is used to compute the nozzle performance. The accuracy of both models is validated. By using the method presented in this paper, the aerodynamic and propulsive performance at various flight altitudes and Mach numbers can be rapidly estimated once the geometric parameters of the airframe and propulsion are obtained. Given a conceptual design and 100 conditions (angles of attack, Mach numbers, altitudes, and fuel equivalence ratios), the entire computational process can be automatically completed in less than 40 min in an ordinary workstation.
The usefulness of the method is demonstrated through the aerodynamic and propulsive performance evaluations of the conceptual design of a notional airbreathing hypersonic aircraft. For the initial design of the notional aircraft, it is found that the aircraft drag is larger than the propulsive thrust. Upon analyses of the drag elements and the thrust elements for the initial design, the geometric parameters of the aircraft configuration and propulsion are revised. It is shown that the aerodynamic and propulsive performances of the revised design are improved significantly. The thrust-to-drag ratio of the revised design is larger than one when the fuel equivalence ratio is greater than 0.7.
In future work, the integrated aero-propulsive analysis method presented in this study will be assimilated into a more comprehensive multidisciplinary analysis and optimization framework for the conceptual design of airbreathing hypersonic aircraft.
Author Contributions
Conceptualization, Y.D., Z.F. and X.Y.; methodology, Y.D.; software, Y.D. and J.X.; validation, Y.D. and Y.H.; formal analysis, Y.D.; investigation, Y.D. and X.Y.; resources, Y.D., Z.F. and X.Y.; data curation, Y.D.; writing—original draft preparation, Y.D.; writing—review and editing, Y.D. and X.Y.; visualization, Y.D.; supervision, X.Y.; project administration, X.Y. All authors have read and agreed to the published version of the manuscript.
Funding
This research is supported by the National Natural Science Foundation of China (No. 12032011).
Data Availability Statement
The data presented in this study are available from the corresponding author upon request.
Conflicts of Interest
Author Zhouwei Fan was employed by the company Commercial Aircraft Corporation of China, Ltd. The remaining authors declare that the research was conducted in the absence of any commercial or financial relationships that could be construed as a potential conflict of interest.
References
- Hunt, J.; Eiswirth, E. NASA’s Dual-Fuel Airbreathing Hypersonic Vehicle Study. In Proceedings of the Space Plane and Hypersonic Systems and Technology Conference, Norfolk, VA, USA, 18–22 November 1996. [Google Scholar]
- Alkaya, C.; Alex Sam, A.; Pesyridis, A. Conceptual Advanced Transport Aircraft Design Configuration for Sustained Hypersonic Flight. Aerospace 2018, 5, 91. [Google Scholar] [CrossRef]
- Dai, Y.; Wang, Y.; Xu, X.; Yu, X. An Improved Method for Initial Sizing of Airbreathing Hypersonic Aircraft. Aerospace 2023, 10, 199. [Google Scholar]
- Fuchs, R.; Chaput, A.J.; Frost, D.E.; McMahan, T.; Vesely, D.L.; Deptula, D.; Amon, D.; Bernard, A.; Billig, F.; Buchanan, L.; et al. Why and Whither Hypersonics Research in the US Air Force; United State Air Force Scientific Advisory Board: Washington, DC, USA, 2000. [Google Scholar]
- Liu, J.; Yuan, H.; Zhang, J.; Kuang, Z. A Multifidelity Simulation Method for Internal and External Flow of a Hypersonic Airbreathing Propulsion System. Aerospace 2022, 9, 685. [Google Scholar] [CrossRef]
- Fusaro, R.; Vercella, V.; Ferretto, D.; Viola, N.; Steelant, J. Economic and Environmental Sustainability of Liquid Hydrogen Fuel for Hypersonic Transportation Systems. CEAS Space J. 2020, 12, 441–462. [Google Scholar] [CrossRef]
- Viola, N.; Fusaro, R.; Saracoglu, B.; Schram, C.; Grewe, V.; Martinez, J.; Marini, M.; Hernandez, S.; Lammers, K.; Vincent, A.; et al. Main Challenges and Goals of the H2020 STRATOFLY Project. Aerotec. Missili Spaz. 2021, 100, 95–110. [Google Scholar] [CrossRef]
- Heiser, W.H. Single-Stage-to-Orbit versus Two-Stage-to-Orbit Airbreathing Systems. J. Spacecr. Rocket. 2010, 47, 222–224. [Google Scholar] [CrossRef]
- Fotia, M.L.; Driscoll, J.F. Isolator-Combustor Interactions in a Direct-Connect Ramjet-Scramjet Experiment. J. Propuls. Power 2012, 28, 83–95. [Google Scholar]
- Rodriguez, C.; White, J.; Riggins, D. Three-Dimensional Effects in Modeling of Dual-Mode Scramjets. In Proceedings of the 36th AIAA/ASME/SAE/ASEE Joint Propulsion Conference and Exhibit, Las Vegas, NV, USA, 24–28 July 2000. [Google Scholar]
- Jackson, D. CFD Analysis of a Generic Waverider. In Proceedings of the 25th AIAA Aerodynamic Measurement Technology and Ground Testing Conference, San Francisco, CA, USA, 5–8 June 2006. [Google Scholar]
- Chavez, F.R.; Schmidt, D.K. Analytical Aeropropulsive-Aeroelastic Hypersonic-Vehicle Model with Dynamic Analysis. J. Guid. Control Dyn. 1994, 17, 1308–1319. [Google Scholar] [CrossRef]
- Bolender, M.A.; Doman, D.B. Nonlinear Longitudinal Dynamical Model of an Air-Breathing Hypersonic Vehicle. J. Spacecr. Rocket. 2007, 44, 374–387. [Google Scholar] [CrossRef]
- Cockrell Jr, C.E.; Engelund, W.C.; Bittner, R.D.; Jentink, T.N.; Dilley, A.D.; Frendi, A. Integrated Aeropropulsive Computational Fluid Dynamics Methodology for the Hyper-X Flight Experiment. J. Spacecr. Rocket. 2001, 38, 836–843. [Google Scholar]
- Bowcutt, K.; Kuruvila, G.; Grandine, T.; Cramer, E. Advancements in Multidisciplinary Design Optimization Applied to Hypersonic Vehicles to Achieve Performance Closure. In Proceedings of the 15th AIAA International Space Planes and Hypersonic Systems and Technologies Conference, Dayton, OH, USA, 28 April–1 May 2008. [Google Scholar]
- Piscitelli, F.; Cutrone, L.; Pezzella, G.; Roncioni, P.; Marini, M. Nose-to-Tail Analysis of an Airbreathing Hypersonic Vehicle Using an in-House Simplified Tool. Acta Astronaut. 2017, 136, 148–158. [Google Scholar] [CrossRef]
- Numbers, K. Hypersonic Propulsion System Force Accounting. In Proceedings of the 29th Aerospace Sciences Meeting, Reno, NV, USA, 7–10 January 1991. [Google Scholar]
- Kulfan, B.M. Universal Parametric Geometry Representation Method. J. Aircr. 2008, 45, 142–158. [Google Scholar] [CrossRef]
- Forbes-Spyratos, S.O.; Smart, M.K.; Kearney, M.P.; Ward, A.D.; Jahn, I.H. Trajectory Optimization of a Partially Reusable Rocket–Scramjet–Rocket Launch System Including Fly-Back. J. Spacecr. Rocket. 2023, 60, 779–796. [Google Scholar]
- Abeynayake, D.; Agon, A. Comparison of Computational and Semi-Empirical Aerodynamics Tools for Making Fit-for-Purpose Modelling Decisions. In Proceedings of the 20th International Congress on Modelling and Simulation, Adelaide, Australia, 1–6 December 2013. [Google Scholar]
- Ward, A.D.; Smart, M.K.; Gollan, R.J. Development of a Rapid Inviscid/Boundary-Layer Aerodynamics Tool. In Proceedings of the 22nd AIAA International Space Planes and Hypersonics Systems and Technologies Conference, Orlando, FL, USA, 17–19 September 2018. [Google Scholar]
- Kiris, C.; Housman, J.; Gusman, M.; Schauerhamer, D.; Deere, K.; Elmiligui, A.; Abdol-Hamid, K.; Parlette, E.; Andrews, M.; Blevins, J. Best Practices for Aero-Database CFD Simulations of Ares V Ascent. In Proceedings of the 49th AIAA Aerospace Sciences Meeting Including the New Horizons Forum and Aerospace Exposition, Orlando, FL, USA, 4–7 January 2011. [Google Scholar]
- Chan, D.T.; Dalle, D.J.; Rogers, S.E.; Pinier, J.T.; Wilcox, F.J.; Gomez, R.J. Space Launch System Booster Separation Aerodynamic Database Development and Uncertainty Quantification. In Proceedings of the 54th AIAA Aerospace Sciences Meeting, San Diego, CA, USA, 4–8 January 2016. [Google Scholar]
- Cummings, R.M.; Mason, W.H.; Morton, S.A.; McDaniel, D.R. Applied Computational Aerodynamics: A Modern Engineering Approach; Cambridge University Press: Cambridge, UK, 2015. [Google Scholar]
- Anderson, J.D. Hypersonic and High Temperature Gas Dynamics; American Institute of Aeronautics and Astronautics: Reston, VA, USA, 2000. [Google Scholar]
- Van Wie, D.M.; D’Alessio, S.M.; White, M.E. Hypersonic Airbreathing Propulsion. Johns Hopkins APL Tech. Dig. 2005, 26, 430–437. [Google Scholar]
- Zhang, P.; Yu, G. The Study of One-Dimensional Flow Analysis Model of the Combustor in Supersonic Combustion Experiments. Exp. Meas. Fluid Mech. 2003, 17, 88–92. [Google Scholar]
- Nestler, D.; Daywitt, J. Boundary Layer Separation Correlations for Hypersonic Inlet Analyses; GE Report AMJ-86-01; General Electric: Boston, MA, USA, November 1986. [Google Scholar]
- Billig, F.S. Supersonic Combustion Ramjet Missile. J. Propuls. Power 1995, 11, 1139–1146. [Google Scholar] [CrossRef]
- Le, D.B.; Goyne, C.P.; Krauss, R.H.; McDaniel, J.C. Experimental Study of a Dual-Mode Scramjet Isolator. J. Propuls. Power 2008, 24, 1050–1057. [Google Scholar]
Disclaimer/Publisher’s Note: The statements, opinions and data contained in all publications are solely those of the individual author(s) and contributor(s) and not of MDPI and/or the editor(s). MDPI and/or the editor(s) disclaim responsibility for any injury to people or property resulting from any ideas, methods, instructions or products referred to in the content. |
© 2024 by the authors. Licensee MDPI, Basel, Switzerland. This article is an open access article distributed under the terms and conditions of the Creative Commons Attribution (CC BY) license (https://creativecommons.org/licenses/by/4.0/).