Abstract
In the aviation industry, a large number of processes are not digitalised. Simultaneously, many special processes are used in production, such as incremental bending. In order to model and efficiently design multi-stage processes with methods such as FEM, automation and linking of the individual simulations are necessary. This paper therefore presents a method for automatically simulating and evaluating a complete incremental bending process with 24 strokes in LS-Dyna using a Python framework with cfiles. The final validation of the force–displacement relationships and inner radii of the generated scaled fuselage shell show high prediction accuracies of about 90%. Thus, the presented methodology enables a FEM-based process design of incremental bending in the aviation industry.
1. Introduction
Since 16% of airlines’ operating costs are due to fuel consumption and there is a positive correlation between fuel flow and mass, lightweight design is still a key factor for the enhancement of airplanes [1,2]. In 2022, the A320 and A321 were Airbus’ best-selling aircrafts [3]. On the A320, for example, fuselage shell accounts for up to 6% of the manufacture’s empty weight (MEW) [4,5]. Hence, innovative forming processes for lightweight fuselage shells are of interest to manufacturers and researchers due to the significant proportion of fuselage weight in the overall weight.
Roll forming is a widely applied process for forming cylindrical fuselage shells [6]. Hereby, the final geometry is achieved by translatory alignment of the tools followed by a continuous rotation [7]. The induced stress is thus a superposition of longitudinal stretching, longitudinal and transverse bending and significant shear [8]. By extending conventional roll forming with a gripper system, as shown by Yoon et al. [9], spherical components can also be formed economically in small quantities. Otherwise, stretch forming is the preferred method for forming fuselage shells with radii in the longitudinal and transverse directions, which are further referred to as spherical fuselage shells. [10]. According to Lange [11], the process can be carried out as tangential stretch forming in three steps to achieve a homogenous stress distribution. First, the clamped material is uniformly pre-stretched to the onset of yielding, then the workpiece is set in tangential contact to the tool, so that a relative movement is reduced. Finally, the shaped sheet is post-stretched to reduce springback. For the forming of a typical aluminium copper alloy in aviation such as EN AW 2024, the Portevin–Le Chatelier effect limits the applicability of tangential stretch forming by the formation of local flow lines [12]. This can be countered by an additional thermal process control, which can be carried out either as forming in the solution-annealed state [13] or as multi-stage forming with intermediate heat treatment [14]. Nevertheless, it can be summarized that both of the presented forming processes and their variants are characterized by one or more of the following disadvantages.
- The stress state consists of a superposition of different stress types, which can lead to an inhomogeneous strain distribution and sheet thickness reduction [14].
- In combination with different flow path lengths, as shown by Panton et al. [15] for a roll forming process, this supports an unfavourable material distribution in the context of lightweight construction.
- The relative movement between the tool and the workpiece influences the surface of the components and makes the use of environmentally harmful lubricants necessary [16].
- In conventional stretch forming, the shape of the tool constrains the flexibility of the process [17].
- A necessary heat treatment during stretch forming of aluminium copper alloys such as EN AW-2024 increases the process time and the unit costs [14].
- Material waste is produced in stretch forming by removing the clamping areas [11].
With the emergence of the patented Deharde Polygon Forming® (DPF®) in 2020 [18], an alternative for the production of cylindrical and conical aircraft fuselage shells exists in industrial application. In this process, large workpieces are positioned on a two-part bed and are free-bent step by step by alternating the downward movement of a sword and the feed of the workpiece. The height of the incrementally applied bending stresses just exceeds the required yield stress and thus contributes to a homogeneous shape formation and material distribution, which is advantageous in terms of lightweight construction compared to conventional forming processes. In addition to the simple tool design, the process sequence and the stress state, the DPF® shows a high potential due to the following characteristics. The use of spring steel sheets as an intermediate layer between the workpiece and the bed enables supported shaping of the edge areas, which leads to a reduced material waste compared to stretch forming [18]. The application of tailored infills made of ABS to compensate for milled pockets, holes or differences in material thickness makes it possible to form a workpiece that has already been machined and thus enables a significant reduction in unit cost. By pre-positioning the machining process in the process chain, plane sheets can be machined in a shorter process time using more cost-effective three-axis machines [18]. In addition, the forming process is lubricant-free due to the relatively motionless contact between the workpiece and the tool.
In addition to incremental bending, single or multiple point incremental forming is also a subject of current research. Both processes are suitable for forming cylindrical geometries, as demonstrated by the approach of Sun et al. [19]. The forming of spherical components is presently still a challenge for the processes mentioned, which is exemplified by the work of Zhang et al. [20]. In order to further develop incremental bending from the cylindrical process variant, FE simulation is an established method. Already in 2007, Gajjar et al. [21] showed that LS-Dyna is well suited to predict the mechanical behaviour of thick sheets under bending by comparing the hardening behaviour during the simulation of bending with the experimentally determined stress–strain curves. In addition, the suggestion was made to exploit the symmetry in bending to optimise the computation time. In this context, the publication of Froitzheim et al. [22] should also be mentioned. Although Froitzheim’s study is limited to the simulation of a single stroke, a possibility is shown to model the elastic deformation of the tool in LS-Dyna in order to obtain more realistic and accurate results. For this purpose, the otherwise rigid bed is loosely supported in the direction of the stroke on a beam element whose material behaviour is defined by the experimentally determined force–displacement curve of several empty strokes. In 2013, Fu et al. [23] showed a method for how to model a multi-stage bending process including springback in ABAQUS. A comparison of the springback angle after nine strokes shows a very good prediction accuracy of the simulation including a new embedded material model according to Hill. Based on the current state of the art, the aim of this paper is to show a method to model and validate Deharde Polygon Forming® in LS-Dyna. This includes a methodology to automatically perform and evaluate the simulation of 24 strokes consisting of forming, springback and gravity simulation for positioning by means of a Python script. Finally, the results of the simulation are validated by comparing the geometric shape and force–displacement curves for a selected stroke with the experiment. Accordingly, the presented methodology for numerical modelling of multi-stage incremental processes is a contribution to digitalisation in aerospace, an industry in which a large number of manufacturing processes are not yet digitalised [24].
2. Materials and Methods
2.1. Material Modelling
The incremental bending process is characterised by recurring bending operations in which, depending on the feed rate of the workpiece, already formed and springback areas are partially formed again. Therefore, the isotropic hardening, a yield criterion in the two-dimensional stress space, as well as the kinematic hardening must be modelled by suitable approaches in order to describe the mechanical material behaviour. Investigations are conducted on the aluminium copper alloy EN AW 2024–T351 whose sheet thickness of 3.2 mm is selected in the project in accordance with the dimensions of conventional fuselage shells. To model the isotropic hardening, tensile tests were first carried out. Following DIN EN ISO 6892–1 [25], three A80 tensile specimens were loaded quasistatically on a Dyna Mess S100 testing machine in the rolling direction at room temperature with a strain rate of = 0.001 s−1 until failure. The induced strains were measured by digital image correlation (DIC) with a 3D-Aramis system of the company Carl Zeiss GOM Metrology GmbH in Brunswick, Germany. The experimental data were fitted with different yield curve models such as Ludwik–Hollomon, Swift, Gosh, Voce and Hockett–Sherby based on the root mean square error (RMSE). It is evident that the Hockett–Sherby yield curve approach, shown in Figure 1a, has the lowest deviation from the experimental data. From Figure 1b, it is also evident that especially for a true plastic strain below 0.02 as induced by DPF®, the square error is infinitesimal. Therefore, the Hockett–Sherby [26] approach with the parameters given in Figure 1b is used to model the isotropic hardening during incremental bending.
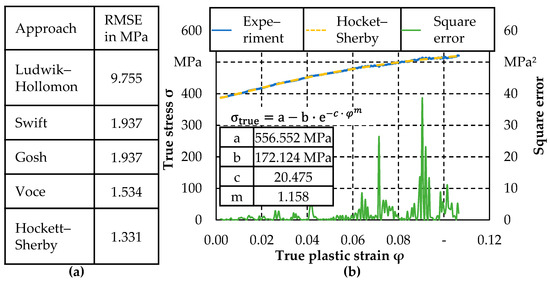
Figure 1.
(a) RMSE between different approaches for modelling isotropic hardening and the experimental result; (b) Flow curve of the experiment and the model according to Hockett–Sherby including parameterisation and square error between experiment and model.
For the modelling of the onset of yielding for EN AW-2024-T351 in the two-dimensional stress space, the yield criteria of von Mises, Hill48, Hill90 and Barlat2000 were modelled. Depending on the yield criterion, the experimentally determined yield point and r-values following DIN EN ISO 10113 [27] from tensile tests at 0°, 45° and 90° to the rolling direction and the isotropically evaluated yield point from the layer compression test were used for parameterisation. The simplification of an isotropic evaluation of the layer compression test with a biaxial anisotropy coefficient of rb = 1 has only a negligible influence on the shape of the advanced anisotropic yield criteria at the biaxial point. Due to the plane strain during incremental bending, the applied approach is not significant. The tensile tests at 45° and 90° to the rolling direction were performed in the same way as described above. The layer compression tests with n = 4 specimens were also carried out quasistatically with a strain rate of = 0.002 s−1 at room temperature on the thermal–mechanical forming simulator Gleeble-GTC3800 from Dynamic System Inc. (DSI) in Poestenkill, NY, USA. In order to select a suitable yield criterion, plane strain compression tests, shear tests and tensile tests on notched samples were carried out following the descriptions in Table 1.

Table 1.
Test setup and evaluation method of plain strain compression test, shear test and tensile test with notched specimen.
The yield locus determined in the shear test, notched tensile test and plane strain compression test were used to calculate the second principal stress according to Isik et al. [34]. Subsequently, the smallest vectorial deviations between the stress states of the validation points and the yield locus curve were determined to calculate the RMSE. The results are shown in Figure 2a. At this point, however, it must be critically mentioned that due to the analytically based calculation of the second principal stress and the use of the smallest vectorial deviation, this methodology only provides assistance in decision making. Therefore, a numerical validation as carried out in this paper is required.
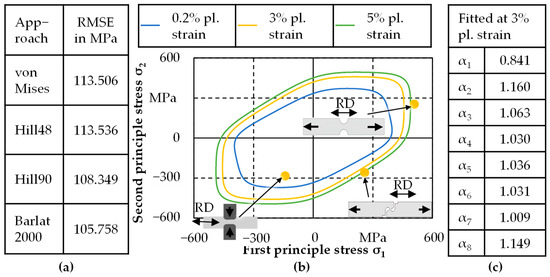
Figure 2.
(a) RMSE of different yield criteria; (b) Yield criterion Barlat2000 for different plastic strains; (c) Calculated material parameters following Barlat2000 for FE-Modelling.
Accordingly, the yield criterion of Barlat2000 (Yld2000) [35] is used to model the onset of yielding, due to having the lowest RMSE of all models. Figure 2b shows the yield locus for different plastic strains and the results of the plane strain compression test, shear test and notched tensile test for 3% plastic strain. It is evident that the shape of the yield locus curve changes with increasing strain. In order to minimise possible errors in the determination of the onset of yielding, the parameter identification is carried out for a plastic strain of 3%, since the local hardening exponent decreases with increasing strains and any deviations therefore also scale less. The calculated material constants for modelling of the yield locus can be found in Figure 2c. The subsequent scaling of the yield locus in the FE-modelling is carried out by the exponential flow curve approach by Hockett–Sherby.
In addition, the inside and outside of the workpiece are subject to a permanent load change during incremental bending due to changes between forming and springback. Thus, the corresponding tension–compression tests shown in Figure 3 were conducted on four miniaturised specimens originally optimised for dilatometer by Behrens et al. [36].
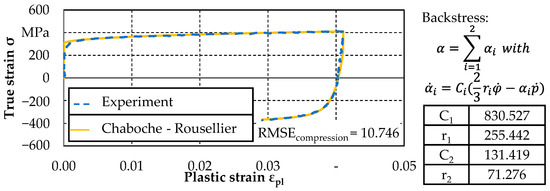
Figure 3.
Tension–compression test results and modelling of kinematic hardening by the approach of Chaboche–Rousellier.
The tests were carried out with a strain rate of = 0.002 s−1 at 0° to the rolling direction at room temperature on a Dyna Mess S100 testing machine. The strain measurement was realised by means of DIC with a 3D-Aramis System of Carl Zeiss GOM Metrology GmbH. Figure 3 shows the results of the tension–compression test and the modelling of the kinematic hardening according to Chaboche–Rousellier [37]. The corresponding material constants for the backstress equation with two terms following Suttner et al. [38] and the RMSE for the compression state are also shown.
2.2. Numerical Setup
The general structure of the numerical model based on a scaled experimental dummy process of the Deharde Polygon Forming® is explained in Figure 4.
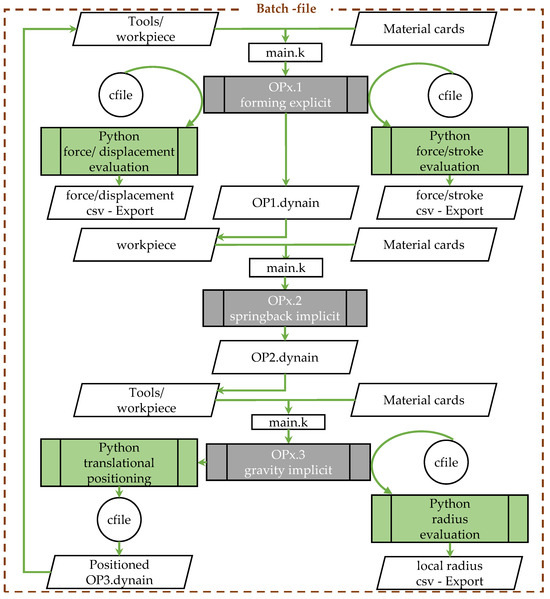
Figure 4.
Setup of the model with automatic evaluation for the simulation of incremental bending.
Following Figure 4, the simulation for an incremental stroke is divided into forming (OPx.1), springback (OPx.2) and gravity (OPx.3). Each operation (OP) is run x = 24 times. Starting with the forming operation, the four adjustable bed tools, the sword, the workpiece made of EN AW-2024-T351, a spring steel package consisting of 3 layers of 1.1274 and the corresponding material cards are included in a separate keyword called main.k. The setup of the forming simulation in LS-PrePost 4.8 is visualized in Figure 5. The sword and the bed are modelled as rigid bodies with shell elements. To account for the necessary elastic deformation of the tool during bending, the rigid bed is loosely supported on beam elements according to the approach of Froitzheim et al. [22]. The material card *MAT_Linear_Elastic_Discrete_Beam (*MAT_067) of the beam elements, deformable in the z-direction, contains a force–displacement curve averaged from three experimental empty runs. The individual layers of the spring steel package are modelled as shell elements with Belytschko–Lin–Tsay formulation (ELFORM = 2). They are approximately stressed elastically and are therefore represented by the material card *MAT_Elastic (*MAT_001) with a density of 7.8 kg/m3, a modulus of elasticity of 210 GPa and a Poisson’s ratio of 0.3. Since relative movements during incremental bending with DPF® are negligible, the coefficient of friction was not determined experimentally. Accordingly, a low coefficient of friction of 0.1 was assumed for all contacts.
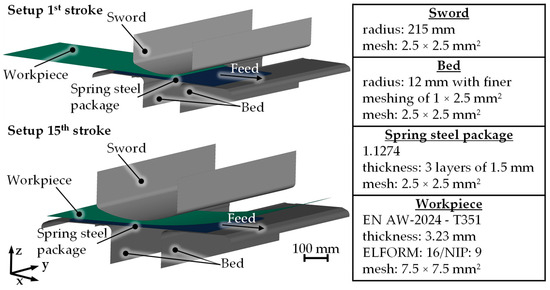
Figure 5.
Setup of the forming simulation for the first stroke and for the 15th stroke with preformed sheet.
According to Figure 4, the workpiece is implemented as a separate keyword in the first stroke and as a dynain file in the following 23 strokes. The dynain file is an LS-Dyna internal result file in text form, which contains information on the residual stresses and strains and the current sheet thickness. Figure 5 shows an example of the structure for the 15th stroke with the imported dynain file. The sheet is modelled in its half dimension of 500 × 250 × 3.23 mm3 due to an axisymmetric boundary condition in the width direction (y-direction) to save computational costs. The coarse mesh of the workpiece with fully integrated shell elements (ELFORM = 16) and a dimension of 7.5 × 7.5 mm2 is the result of a preliminary study with focus on mesh and time scaling. Here, a calculation effort optimal time scaling was determined by a factor of 20 compared to the experiment. This implies that the sword’s stroke is executed at a velocity of 200 mm/s. The combination of coarse meshing and low time scaling satisfies the requirements regarding the evaluation of the geometrical and mechanical parameters and at the same time prevents the occurrence of oscillations at the free ends of the sheet. In addition, a critical time step for mass-scaled solutions in LS-Dyna was calculated using the Courant criterion for potential scaling of the mass during forming simulation. Since the calculated critical time step of is not exceeded, no mass scaling is necessary. Besides the general modelling of the workpiece, it should be noted that the material constants from the previous section are assigned by the material card *MAT_Barlat_YLD2000 (*MAT_133). The forming simulation for the numerical validation within this paper relates to a bed width of 132 mm, measured between the highest contact points of the roller bed. The stroke was set with a bottom dead centre of −0.8 mm in the z-direction. Strokes are performed every 20 mm, starting 20 mm from the edge of the sheet up to a number of 24 strokes. The explicit forming operation is calculated within 40 min by the LS-Dyna mpp solver R12 in single precision. After calculation, the force–displacement curve of the stroke and a continuous file with the maximum force of the respective stroke is generated in csv format by an LS-Dyna internal commando file called cfile and a Python script.
The forming simulation is followed by the static springback simulation of the deformed axisymmetric sheet implemented as a dynain file, with two constraints on the symmetry line defined according to Maker and Zhu [39]. For the implicit calculation of the springback with a duration of 15 min, the smp solver R13 from LS-Dyna in double precision is used.
The sheet exported after springback is oriented diagonally in space. To ensure the equivalent positioning as in the experiment, an extended implicit gravity simulation is calculated in 10 min by the same solver as the springback simulation. The sheet is first lowered onto a rigid support and then positioned by loading the undeformed free edge of the sheet with 100 N. This ensures that the next stroke is executed perpendicular to the surface of the sheet. The orientation of the workpiece is now rotationally in accordance with the experiment. To ensure that the translational position also corresponds to that of the experiment, a Python script queries the coordinates of the node at the intersection of the symmetry line and the undeformed sheet edge. Based on the coordinates, the translational displacements are calculated so that a stroke can be performed every 20 mm. The calculated displacements are written into a cfile template, which is then executed in LS-PrePost and is responsible for the final positioning of the workpiece for the subsequent stroke. After gravity simulation, the coordinates of three cross-sections are exported by a cfile to evaluate the local radius. These are located on the symmetry line and approx. 100 mm and 200 mm away from the symmetry line in the y-direction. The exported coordinates of the cross-sections are used by a Python script to calculate the local radius based on the calculated unrolled length starting at the leading edge in the feed direction. For the first stroke, the local radius is calculated up to an unrolled length of 40 mm. For each subsequent stroke, the local area increases by an unrolled length of 20 mm contrary to the feed direction.
In order to validate the presented FE model and the methodical procedure, the presented simulation with shell elements was used. Additionally, for a more detailed analysis and validation of the force–displacement curves, a single stroke with spring steel package and workpiece modelled with constant stress solid elements (ELFORM = 1) was simulated. For this purpose, a preformed sheet metal was converted from shell elements into volume elements.
In general, a corresponding experiment is necessary for the validation, whose realistion is described in the following section.
2.3. Experimental Setup
The experimental execution of the scaled Deharde Polygon Forming® was conducted by the tool shown in Figure 6, developed by Müller et al. [40]. The active parts of the sword and the bed were made of polypropylene and were designed in analogy to the FE-model with radii of 215 mm and 12 mm. A three-layer spring steel package of 1.1274 with a sheet thickness of 1.5 mm each and a total dimension of 510 mm × 300 mm × 4.5 mm was placed on the bed to enable the forming of the edges. The centre line of the spring steel package was highlighted to ensure repeatable positioning and forming and the relative orientation to the bed was marked on the latter. As the EN AW-2024-T351 workpiece with a dimension of 500 mm × 500 mm × 3.23 mm was placed on the spring steel package, the feed was manually controlled by means of appropriate markers every 20 mm.
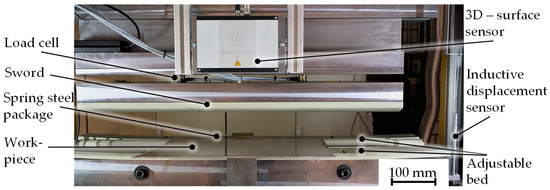
Figure 6.
Experimental setup of the scaled Deharde Polygon Forming® process with extended measuring technology.
The tool was placed in a hydraulic press Dunkes type HDZ 400, which performed the strokes in a path-controlled manner at a forming speed of 10 mm/s. The experimental tests were carried out similar to the simulation with a bed width of 132 mm up to a bottom dead centre of −0.8 mm. To validate the simulation on the experiment, three scaled fuselage shells were formed.
2.4. Evaluation Methods
During the forming process, the load cell and the inductive displacement sensor were used to measure the force–displacement curves of each stroke in order to validate the simulation. On one hand, the curves of the maximum sword force over the number of strokes for experiment and simulation were compared on the basis of the relative deviation. On the other hand, the RMSE between the experimental and the simulated force–displacement curves were calculated for the fourth stroke and divided by the maximum experimental sword force. The fourth stroke was chosen for the comparison because from the third to the 22nd stroke the maximum force is almost at the same level and the fourth stroke is therefore representative for this range.
A further validation parameter is the averaged inner radius of the bent sheets. To determine the inner radius, the geometry of the scaled fuselage shells was first measured optically by an ATOS 2 400 device of Carl Zeiss GOM Metrology GmbH. After the recording, a local coordinate system was defined at the edge of the sheet. Figure 7a shows the position of five cross-sections defined on the symmetry line in the centre and ±100 mm and ±200 mm distant in the x-direction.
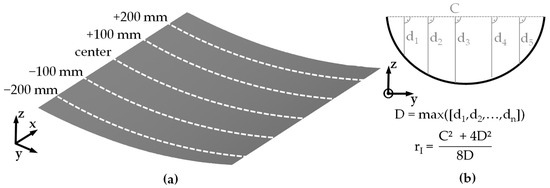
Figure 7.
(a) Location of cross–sections (b) Calculation methodology for the inner radius [41].
Subsequently, 2D coordinate data for the y- and z-coordinates of each cross-section were exported and the inner radius rI was calculated according to the approach of Quirion et al. [41], as shown in Figure 7b. Finally, the averaged inner radius of the five cross-sections from the experiment was compared with the averaged radius from three cross-sections from the simulation. The same positioning and calculation method from Figure 7 was used for the cross-sections from the simulation, whose number is lower due to the symmetry boundary condition. The calculated prediction accuracy results from the division of the averaged inner radius of simulation and experiment.
3. Results
First, the validation of the simulation with the methods from Section 2 including a comparison of the forces during forming to evaluate the forming simulation is discussed. Then, the inner radii of the final geometries are analysed in cross-section to evaluate the entire consecutive simulation setup.
3.1. Validation Based on Sword Force
For the test setup described in Section 2, Figure 8 depicts the results of the maximum sword force over the individual strokes for experiment and simulation. In addition, the relative deviation of simulation and experiment is plotted in percentage.
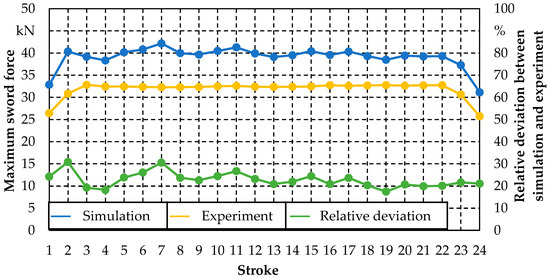
Figure 8.
Maximum sword force across all strokes and relative deviation between simulation and experiment.
Figure 8 shows that both the experimental and the simulated maximum force curve have lower values at the beginning and the end of the incremental bending process. One reason for that is that the sheet has indirect contact with the bed on one side during these strokes and the other side is only countered by the spring steel package. For the experimental strokes with bed contact on both sides, a constant maximum force level of about 32 kN with a maximum standard deviation of 1.4% is achieved. The same qualitative progression of the maximum force can be observed in the simulation. In contrast to the experiment, the plateau of the calculated maximum force is at a higher level with values between 38 kN and 42 kN. Thus, significant relative deviations of 17% to about 30% are found.
To enable a more representative validation, the force–displacement curves of the simulation and experiment were compared for the fourth stroke. For a more detailed analysis, the simulation was additionally modelled with a spring steel package and workpiece consisting of volume elements, as already mentioned in Section 2.
Accordingly, Figure 9 compares the experiment with the results of the simulations with a spring steel package and workpiece using shell and solid elements. It is evident that the force–displacement curve of the simulation is above the results of the experiment. For the modelling with shell elements, an increasing divergence of the curves can be found from a displacement of 3 mm. Overall, the RMSE between experiment and simulation with shell elements is about 3.7 kN. For the RMSE referenced to the maximum experimental sword force, a relative deviation of about 11.5% is obtained.
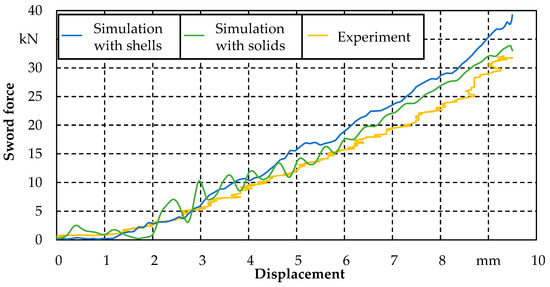
Figure 9.
Force–displacement curves of experiment and simulation for the fourth stroke.
Although the simulation with volume elements is not optimised against oscillation, the force–displacement curve shows a better convergence with the experimental values from a displacement of 4.5 mm, resulting in a decreased RMSE of about 2.6 kN compared to the application of shell elements and a correspondingly lower relative deviation of 7.5%. Thus, it can be stated that the forming simulation with shells has a very high prediction accuracy of 88.5%, which can be increased to 92.5% by using solids.
3.2. Validation Based on Cross–Sectional Inner Radius
In order to validate the entire consecutive simulation setup after the sole consideration of the forming simulation, mid cross-sections of the final geometry from simulation and experiment are compared by the averaged inner radius in Figure 10.
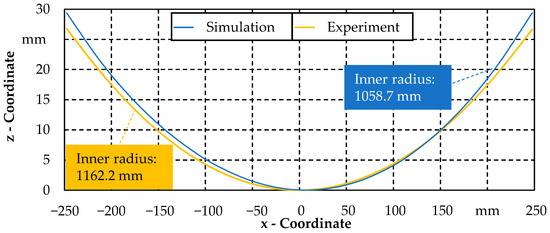
Figure 10.
Mid cross–sections and inner radii for experiment and simulation.
From the scaled representation in Figure 10, it follows that both cross-sections are approximately symmetrical. The locally varying deviations are small and are increased by the differences in the centre of mass. Overall, the cross-section of the experiment has a larger average inner radius of 1162.2 mm compared to the simulation. With a calculated average inner radius of 1058.7 mm, the simulation shows a prediction accuracy of the final geometry of 91%.
4. Discussion
Overall, the results show that the numerical methodology presented is suitable for modelling an incremental process such as Deharde Polygon Forming® and for digitising the process design. Nevertheless, the validation of the maximum force has to be discussed with regard to the lower forces in the first and last stroke and the deviation between simulation and experiment. The lower forces at the beginning and end of the incremental process result from a change in the contact conditions. Due to the position of the workpiece, the leading edge is primarily supported by the spring steel package during the first strokes. The secondary support effect of the bed is less since the sheet has not yet fed to the point where it is vertically above the bed on both sides. The same applies to the last strokes and the trailing edge. Overall, both simulation and experiment show the same qualitative progression. Quantitatively, the results of the maximum force in the simulation significantly exceed those in the experiment. To discuss the existing deviations, the results of the force–displacement curves in Figure 9 are suitable. The significant improvement of the prediction accuracy in the simulation with solids compared to shells is due to the element selection and the corresponding assumptions. Following Haufe et al. [42], the assumptions according to Reissner–Mindlin apply to the fully integrative shell elements used with the formulation ELFORM = 16. Accordingly, the cross-section is assumed to be straight and unstretched, which explains the lower prediction accuracy compared to solids. In addition to solids, thickness-enhanced shell formulations such as ELFORM = 26 also offer the possibility to measure thickness stretch [42]. However, 3D constitutive models are necessary for this, similar to solids [42]. Since the constitutive models in sheet metal forming were originally optimised for 2D modelling of sheet metal anisotropy with shells, existing 3D extensions for solids are rarely implemented in commercial FE software. Furthermore, the majority of currently implemented 3D constitutive models are optimised for bulk forming processes, neglecting anisotropy. Thus, an improvement of the prediction accuracy due to the choice of solids or thickness-enhanced shells often implies a simultaneous degradation of accuracy due to the use of isotropic 3D constitutive models. Since the release of LS-Dyna version R12, the material card *MAT_Barlat_YLD2000 (*MAT_133) used can also be applied for the modelling of solid elements [43]. For the three-dimensional extension of the yield criterion, the approach according to Dunad et al. [44] was implemented by LS-Dyna. However, the extension of the yield criterion is only available for the explicit analysis [43]. Therefore, it is not possible to perform the entire incremental process with the implicit springback and positioning simulation via gravity. A validation of the geometry, as in Figure 10, after simulation with solid elements is thus not possible. In addition, the improvement in accuracy due to the application of volume elements results in an increase in computation time of 30% just for the explicit simulation of the forming process. Finally, the deviations in the final geometry in Figure 10 can be explained on the one hand by the selection of shell elements. On the other hand, the manual positioning of the workpiece in the experiment influences the final geometry. The differences in the centres of mass of the blanks are an indication of this. In addition to the improvements associated with modelling using volume elements, an overestimation of the necessary forming force remains. This may be due to the simplified determination and modelling of the elastic deflection of the bed, which only take into account the elastic deflection in the stroke direction and not the expansion of bed width transverse to the stroke direction. A more detailed modelling of the elastic deflection of the bed, which includes an increase in the bed width, would result in a decrease in forming force and an increase in the inner radius and could therefore contribute to increasing the accuracy of the prediction.
5. Conclusions and Outlook
From the validation of the simulation on the force–displacement curve and the cross-sectional inner radius of the experiment, it follows that the presented methodology is suitable to predict the incremental bending process with a high accuracy around 90%. Deviating from single-stage bending processes, the material modelling was extended to include kinematic hardening. This is necessary due to the incremental forming, in which areas that have been already formed and spring back are partially formed again during the next stroke. Thus, the state of the art was used to optimise the individual simulations. For the automation of a large number of simulations with LS-Dyna, as required for incremental forming processes, there are no validated approaches published so far since automation is not absolutely necessary for conventional forming processes such as deep drawing. For the modelling of incremental bending with Deharde Polygon Forming® for the presented benchmark consisting of 24 strokes, a methodology was developed, including a solution for the correct positioning of the preformed sheet with all information on the induced residual stresses and thinning. By validating over the cross-sectional inner radius, the fully automated simulation was evaluated. All in all, the presented methodology enables the process design of the incremental bending process with high accuracy. At the same time, the high computation time and the late feedback of the simulation would lower efficiency in the practical application. In order to meet both requirements of high accuracy and short feedback time, surrogate models can be a solution. Accordingly, future work in this project will deal with FEM-based surrogate modelling of Deharde Polygon Forming®.
Author Contributions
Conceptualization, J.J.; methodology, J.J.; software, J.J.; validation, J.J. and P.M.; formal analysis, J.J.; investigation, J.J.; data curation, J.J.; writing—original draft preparation, J.J.; writing—review and editing, H.W., P.M., S.H. and S.W.; visualization, J.J.; supervision, B.-A.B. and H.W.; project administration, B.-A.B.; funding acquisition, H.W., S.H. and B.-A.B. All authors have read and agreed to the published version of the manuscript.
Funding
This research was funded by the Investitions- und Förderbank Niedersachsen—NBank, grant number ZW1-80159743.
Data Availability Statement
The data presented in this paper are available on request from the corresponding author.
Acknowledgments
This paper was created within the collaborative project “Aggregated Polygon Forming based Processes for large Fuselage Components” (ZW1-80159743). The authors gratefully acknowledge Deharde GmbH for excellent collaboration.
Conflicts of Interest
Author Simon Wehrmann was employed by the company Deharde GmbH. The remaining authors declare that the research was conducted in the absence of any commercial or financial relationships that could be construed as a potential conflict of interest.
References
- Lufthansa Group. New Normal; New Strength: Annual Report 2021. Available online: https://investor-relations.lufthansagroup.com/fileadmin/downloads/en/financial-reports/annual-reports/LH-AR-2021-e.pdf (accessed on 8 August 2023).
- Airbus Customer Services. Getting to Grips with Fuel Economy. Available online: https://ansperformance.eu/library/airbus-fuel-economy.pdf (accessed on 8 August 2023).
- Airbus, S.E. Orders and Deliveries in 2022. Available online: https://www.airbus.com/en/products-services/commercial-aircraft/market/orders-and-deliveries (accessed on 8 August 2023).
- Achternbosch, M.; Bräutigam, K.-R.; Kupsch, C.; Ressler, B.; Sardemann, G. Flow analysis–A comparison of manufacturing, use and fate of CFRP-fuselage components versus aluminium-components for commercial airliners. Fresenius Environ. Bull. 2002. [Google Scholar]
- European Union Aviation Safety Agency. Type-Certificate Data Sheet: No. EASA.A.064 for Airbus A318-A319-A320-A321; European Union Aviation Safety Agency: Cologne, Germany, 2022. [Google Scholar]
- Peng, J.; Li, W.; Wan, M.; Zhang, C.; Li, J.; Sun, G. Investigation on three-roller cylindrical bending of 2060-T8 Al-Li alloy plate for aircraft fuselage skin components. Int. J. Mater. Form. 2018, 11, 269–278. [Google Scholar] [CrossRef]
- Wang, Y.; Zhu, X.; Wang, Q.; Cui, X. Research on multi-roll roll forming process of thick plate. Int. J. Adv. Manuf. Technol. 2019, 102, 17–26. [Google Scholar] [CrossRef]
- Panton, S.M.; Zhu, S.D.; Duncan, J.L. Fundamental deformation types and sectional properties in roll forming. IJMS 1994, 36, 725–735. [Google Scholar] [CrossRef]
- Yoon, S.J.; Yang, D.Y. An Incremental Roll Forming Process for Manufacturing Doubly Curved Sheets from General Quadrilateral Sheet Blanks with Enhanced Process Features. CIRP Annals 2005, 54, 221–224. [Google Scholar] [CrossRef]
- Peng, J.; Li, W.; Han, J.; Wan, M.; Meng, B. Kinetic locus design for longitudinal stretch forming of aircraft skin components. Int. J. Adv. Manuf. Technol. 2016, 86, 3571–3582. [Google Scholar] [CrossRef]
- Lange, K. (Ed.) Handbook of Metal Forming; Society of Manufacturing Engineers: Dearborn, MI, USA, 1985. [Google Scholar]
- Delaunois, F.; Denil, E.; Marchal, Y.; Vitry, V. Accelerated Aging and Portevin-Le Chatelier Effect in AA 2024. MSF 2016, 879, 524–529. [Google Scholar] [CrossRef]
- Jambu, S.; Juhl, K.; Lenczowski, B. Method for Shaping Structures Comprised of Aluminum Alloys. WO 02/26414, 4 April 2002. [Google Scholar]
- Kurukuri, S.; Miroux, A.; Wisselink, H.; van den Boogaard, T. Simulation of stretch forming with intermediate heat treatments of aircraft skins. Int. J. Mater. Form. 2011, 4, 129–140. [Google Scholar] [CrossRef]
- Panton, S.M.; Duncan, J.L.; Zhu, S.D. Longitudinal and shear strain development in cold roll forming. J. Mater. Process. Technol. 1996, 60, 219–224. [Google Scholar] [CrossRef]
- Zhang, H.H.; Li, M.Z.; Fu, W.Z.; Feng, P.X. Numerical Simulation of Multi-Roll Stretch Forming Process with Different Lubrication and Rollers. AMM 2011, 110–116, 1512–1518. [Google Scholar] [CrossRef]
- Seo, Y.H.; Heo, S.C.; Park, J.W.; Ku, T.W.; Song, W.J.; Kim, J.; Kang, B.S. Development of Stretch Forming Apparatus using Flexible Die. Trans. Mater. Process. 2010, 19, 17–24. [Google Scholar] [CrossRef]
- Blazek, I.; Brestrich, M.; Frerichs, H.; Harms, M.; Lautenbach, S.; Eilert, W. Method and Arrangement for Changing the Shape of a Sheet-Like Workpiece. WO 2020/14793, 23 July 2020. [Google Scholar]
- Li, W.; Sun, Z.; He, K.; Zuo, Q.; Liu, Q.; Du, R. Study on Tool Path Design for a Novel Incremental Sheet Metal Bending Process. In Current Trends in Computer Science and Mechanical Automation; Wang, S.X., Ed.; De Gruyter Open Ltd.: Warsaw, Poland, 2017; Volume 2, pp. 437–448. [Google Scholar]
- Zhang, F.; He, K.; Wei, B.; Huang, B. Multi-point incremental bending of doubly curved high strength steel sheet under minimum strain energy loading path. Int. J. Adv. Manuf. Technol. 2023, 127, 1797–1809. [Google Scholar] [CrossRef]
- Gajjar, H.V.; Gandhi, A.H.; Raval, H.K. Finite Element Analysis Of Sheet Metal Airbending Using Hyperform Ls-Dyna. Int. J. Aerosp. Mech. Eng. 2007, 1, 395–400. [Google Scholar]
- Froitzheim, P.; Fuchs, N.; Flügge, W.; Woernle, C. Characterization of metal sheet forming by free bending with LS-Dyna. In Proceedings of the 15th LS-Dyna Forum, Bamberg, Germany, 15–17 October 2018. [Google Scholar]
- Fu, Z.; Chen, W.; Tian, X.; Hu, B. Modeling and simulation for multiple-step incremental air-bending forming of sheet metal. Int. J. Adv. Manuf. Technol. 2014, 72, 561–570. [Google Scholar] [CrossRef]
- Digital: The Next Horizon for Global Aerospace and Defense. Available online: https://www.mckinsey.com/industries/aerospace-and-defense/our-insights/digital-the-next-horizon-for-global-aerospace-and-defense (accessed on 19 July 2023).
- DIN EN ISO 6892-1; Metallic Materials–Tensile Testing–Part 1: Method of Test at Room Temperature. DIN German Institute for Standardization; Beuth Verlag GmbH: Berlin, Germany, 2020.
- Hockett, J.E.; Sherby, O.D. Large strain deformation of polycrystalline metals at low homologous temperatures. J. Mech. Phys. Solids 1975, 23, 87–98. [Google Scholar] [CrossRef]
- DIN EN ISO 10113; Metallic Materials–Sheet and Strip–Determination of Plastic Strain Ratio. DIN German Institute for Standardization; Beuth Verlag GmbH: Berlin, Germany, 2021.
- Peirs, J.; Verleysen, P.; Degrieck, J. Novel Technique for Static and Dynamic Shear Testing of Ti6Al4V Sheet. Exp. Mech. 2012, 52, 729–741. [Google Scholar] [CrossRef]
- Behrens, B.-A.; Rosenbusch, D.; Wester, H.; Dykiert, M. Comparison of different testing approaches to describe the fracture behaviour of AHSS sheets using experimental and numerical investigations. In Proceedings of the IDDRG 2021, Stuttgart, Germany, 21 June–2 July 2021. [Google Scholar]
- Becker, N.; Pöhlandt, K.; Lange, K. Improvement of the Plane-Strain Compression Test for Determining Flow Curves. CIRP Annals 1989, 38, 227–230. [Google Scholar] [CrossRef]
- Chermette, C.; Unruh, K.; Peshekhodov, I.; Chottin, J.; Balan, T. A new analytical method for determination of the flow curve for high-strength sheet steels using the plane strain compression test. Int. J. Mater. Form. 2020, 13, 269–292. [Google Scholar] [CrossRef]
- Merklein, M.; Biasutti, M. A Contribution to the Optimisation of a Simple Shear Test. KEM 2009, 410–411, 467–472. [Google Scholar] [CrossRef]
- Flores, P.; Tuninetti, V.; Gilles, G.; Gonry, P.; Duchêne, L.; Habraken, A.M. Accurate stress computation in plane strain tensile tests for sheet metal using experimental data. J. Mater. Process. Technol. 2010, 210, 1772–1779. [Google Scholar] [CrossRef]
- Isik, K.; Soyarslan, C.; Richter, H.; Tekkaya, A.E. Analysis of formability of advanced high strength steel sheets with phenomenologically based failure criteria with separate treatment of instability, shear and normal fracture. In Proceedings of the 8th European LS-Dyna Users Conference, Strasbourg, France, 23–24 May 2011. [Google Scholar]
- Barlat, F.; Brem, J.C.; Yoon, J.W.; Chung, K.; Dick, R.E.; Lege, D.J.; Pourboghrat, F.; Choi, S.-H.; Chu, E. Plane stress yield function for aluminum alloy sheets—Part 1: Theory. Int. J. Plast. 2003, 19, 1297–1319. [Google Scholar] [CrossRef]
- Behrens, B.-A.; Bouguecha, A.; Kammler, M.; Schrödter, J.; Hadifi, T.; Götze, T. Assessment of a Modified Tensile Specimen Geometry for the Characterization of 22MnB5 with a Quenching and Deformation Dilatometer. In Proceedings of the IDDRG 2012, Mumbai, India, 25–29 November 2012. [Google Scholar]
- Chaboche, J.L.; Rousselier, G. On the Plastic and Viscoplastic Constitutive Equations—Part I: Rules Developed with Internal Variable Concept. J. Press. Vessel Technol. 1983, 105, 153–158. [Google Scholar] [CrossRef]
- Suttner, S.; Rosenschon, M.; Merklein, M. Methodology for the parameter identification of the kinematic hardening law according to Chaboche and Rousellier. In Fortschritte in der Werkstoffprüfung für Forschung und Praxis; Verlag Stahleisen: Dusseldorf, Germany, 2013; pp. 205–212. [Google Scholar]
- Maker, B.N.; Zhu, X. Input Parameters for Springback Simulation Using LS-DYNA; Livermore Software Technology Corporation: Livermore, CA, USA, 2001. [Google Scholar]
- Müller, P.; Behrens, B.-A.; Hübner, S.; Jepkens, J.; Wester, H.; Lautenbach, S. Development of polygon forming processes for aerospace engineering. In Proceedings of the Sheet Metal 2023, Erlangen, Germany, 3–5 April 2023. [Google Scholar]
- Quirion, D.; Manna, M.; Hidalgo, S.; Pellegrini, G. Manufacturability and Stress Issues in 3D Silicon Detector Technology at IMB-CNM. Micromachines 2020, 11, 1126–1148. [Google Scholar] [CrossRef] [PubMed]
- Haufe, A.; Schweizerhof, K.; Dubois, P. Properties & Limits: Review of Shell Element Formulations. Available online: https://www.dynamore.de/de/download/papers/2013-ls-dyna-forum/documents/review-of-shell-element-formulations-in-ls-dyna-properties-limits-advantages-disadvantages (accessed on 23 December 2023).
- Livermore Software Technology (LST), An Ansys Company. LS-Dyna Keyword User’s Manual: Volume 2 Material Models. Available online: https://ftp.lstc.com/anonymous/outgoing/web/ls-dyna_manuals/R14/LS-DYNA_Manual_Volume_II_R14.pdf (accessed on 23 December 2023).
- Dunand, M.; Maertens, A.P.; Luo, M.; Mohr, D. Experiments and modeling of anisotropic aluminum extrusions under multi-axial loading–Part I: Plasticity. Int. J. Plast. 2012, 36, 34–49. [Google Scholar] [CrossRef]
Disclaimer/Publisher’s Note: The statements, opinions and data contained in all publications are solely those of the individual author(s) and contributor(s) and not of MDPI and/or the editor(s). MDPI and/or the editor(s) disclaim responsibility for any injury to people or property resulting from any ideas, methods, instructions or products referred to in the content. |
© 2023 by the authors. Licensee MDPI, Basel, Switzerland. This article is an open access article distributed under the terms and conditions of the Creative Commons Attribution (CC BY) license (https://creativecommons.org/licenses/by/4.0/).