Article

Flow Structures and Aerodynamic Behavior of a Small-Scale Joined-Wing Aerial Vehicle under Subsonic Conditions

1
School of Mechanical and Aerospace Engineering, Nanyang Technological University, 50 Nanyang Avenue, Singapore 639798, Singapore
2
German Aerospace Center (DLR), Institute of Air Transportation Systems, 21079 Hamburg, Germany
*
Author to whom correspondence should be addressed.
Aerospace 2023, 10(8), 661; https://doi.org/10.3390/aerospace10080661
Submission received: 27 May 2023 / Revised: 20 July 2023 / Accepted: 22 July 2023 / Published: 25 July 2023

Abstract

:
Flow behavior and aerodynamic performance of a small-scale joined-wing unmanned aerial vehicle (UAV) was studied experimentally and numerically under various pitch and yaw angle combinations in subsonic flow conditions. Selected numerical results are compared against experimental results obtained using surface oil flow visualizations and force measurements, with additional simulations expanding the range of combined pitch and yaw configurations. Under zero-yaw conditions, increasing the pitch angle leads to the formation of symmetric ogive vortex roll-ups close to the fuselage and their significant interactions with the fore-wing. Additionally, contributions to lift and drag coefficients under zero-yaw conditions by the key UAV components have been documented in detail. In contrast, when the UAV is subjected to combined pitch and yaw, no clear evidence of such ogive vortex roll-ups can be observed. Instead, asymmetric flow separations occur over the fuselage’s port side and resemble bluff-body flow behavior. Additionally, these flow separations become more complex, and they interact more with the fuselage and fore- and aft-wings when the yaw angle increases. Lift and drag variations due to different pitch and yaw angle combinations are also documented. Finally, rolling and yawing moment results suggest that the present UAV possesses adequate flight stability unless the pitch and yaw angles are high.

1. Introduction

Of the many different forms of aircraft configurations, the joined-wing aircraft configuration can be considered to be one of the most intriguing and aerodynamically efficient designs. Geometrically speaking, a joined wing occurs when the rear horizontal stabilizers of an aircraft are designed to sweep forward significantly instead of backwards, such that they join the aircraft main wings at the wing tips. As a result of this radical design, the aircraft will possess unique “diamond-shaped” outlines when viewed from both the frontal and planform perspectives. Such a concept was first proposed by [1], though its genesis can be traced back to a much earlier work by [2], where the latter’s goal was to come up with an aircraft configuration that incurs the lowest induced drag levels. Since then, significant work have gone towards their general aerodynamic characterization and understanding their flight performance under specific design considerations. This can be seen in studies conducted throughout the years by [3,4,5,6,7,8,9,10,11,12,13,14,15,16,17], just to name a few.
With the above and other studies, much better understanding on the possibility of utilizing joined-wing configurations has gradually been achieved, be it from lift, drag, aeroelasticity, structural, or flight control perspectives. On the other hand, it should be highlighted that most earlier studies focused upon the use of joined-wing configurations in commercial airliners or relatively large-scale aircrafts, with little attention paid towards small-scale aerial vehicles. However, the use of small-scale fixed-wing unmanned aerial vehicles (UAVs) has seen huge popularity in recent years, particularly in the areas of intelligence, surveillance, and reconnaissance. More recently, target acquisition has also emerged as an area of importance for such UAVs when it comes to conflicts. Regardless of the exact role, some of the more critical requirements of small-scale UAVs that are meant to loiter over areas of interests or contested areas include high aerodynamic efficiency and adequately small-sized overall airframe; the latter of which would be particularly important if the UAVs were to be operated from limited ground space or to maintain low detectability during flights. With these considerations in mind, the use of joined wings for small-scale UAVs thus becomes an attractive proposition.
Having said that, small-scale UAVs tend to experience more viscous-related flow effects than larger-scale UAVs and commercial airliners, due to their generally lower flight speeds and typically thicker boundary layers forming over their fuselage and wings. That in turn means that more attention will need to be paid towards the flow behavior and associated higher possibility of flow separations occurring along the fuselage and wings. In particular, detailed information on the various flow interactions and junction flow phenomena will be needed to assess the flight envelope and suitability of small-scale joined-wing aerial vehicles, much of which is currently lacking in the research literature. And to make things more challenging, aerodynamic characteristics of joined-wing aircrafts are typically sensitive towards the exact geometrical designs of the joined wings and they vary across the board for realistic UAVs. As such, the present study was motivated by several key interests—firstly, a desire to capture and understand the aerodynamic characteristics associated with a small-scale UAV, secondly, to obtain first-hand information on the flow structures and behavior that give rise to the observed aerodynamic performance, and thirdly, to study if there exist potential flow behavioral or aerodynamical issues associated with heightened viscous effects or specific designs related to the present small-scale UAV and low-speed flight conditions.
To address the above considerations, a steady-state numerical study has been carried out for the present small-scale UAV under incompressible subsonic flow conditions, extending the earlier work by [12]. In the study, surface flow patterns from the numerical study are subsequently compared to those captured experimentally to ensure a reasonable numerical approach, before new results associated with the lift and drag characteristics are provided to shed light upon the expected aerodynamic performance. Last but not least, flow behavior under selected conditions will be presented to discuss the flow differences at small and large pitch angles and their potential impact upon the present joined-wing UAV.

2. Experimental Setup and Numerical Procedures

2.1. Wind Tunnel Facility and Force Measurements

A subsonic closed-looped wind tunnel with a test section size measuring 720 mm (H) × 780 mm (W) × 2000 mm (L) and test velocity of 30 m/s (i.e., Mach number of 0.087) was used for this study. The test velocity was measured using a fixed pitot-static tube setup located approximately 1 m upstream of the model, after the wind tunnel contraction section. Hence, the actual free-stream velocity at the model location will be higher and may be estimated based on the wall boundary layer information provided later. A streamwise turbulence intensity level of 0.1% was achieved through the use of a honeycomb section, three anti-turbulence screens, and a 9:1 contraction chamber to condition the free stream before it entered the test section. A sting-balance system measured the aerodynamic forces and moments acting on the mounted test model, while the pitch angle of the test model, α , was varied from −10 ° to 25 ° during the present study. These angular adjustments were carried out through computer control and all data acquisitions were performed by a National Instruments data acquisition platform using National Instruments LabViewTM software (https://unites-systems.com/product/labview-0-44?gclid=Cj0KCQjw5f2lBhCkARIsAHeTvlhGBxSSOWB5BFSFJyPP6BLDF6qmQIkbfcrigp_-LoZOCgsX5gfb9O8aAkiiEALw_wcB, accessed on 27 May 2023). During the experiments, the data were acquired at a sampling rate of 47 Hz for 30 s for each selected pitch angle during the testing. This led to more than 1000 instantaneous force and moment datapoints for each setting to be used for time averaging to arrive at the experimental mean force and moment coefficients presented later. Experimental uncertainty analysis based on the 3 σ statistical approach shows that the maximum uncertainty levels for the force and moment coefficients were approximately 0.0313 and 0.0464, respectively. Note that this wind tunnel has been used satisfactorily in earlier experimental studies by [12,18,19].

2.2. Joined-Wing UAV Geometry

Figure 1 shows the overall geometry and key dimensions of the joined-wing UAV (abbreviated as UAV from here on) used; note that, except for the bolting holes and flushed attachment points, they are similar to those of the model used for the numerical simulations. Note that this test model is similar to that used in an earlier study by [12]. Figure 2 shows how it looked when mounted onto the sting-balance system. The fuselage of the UAV was modelled as a simple sharp-tipped ogive cylinder section of 2.5 fineness ratio followed by a constant 60 mm diameter straight cylindrical section, which make up a total fuselage length of 528 mm. As with most joined-wing configurations, the horizontal stabilizers of the present UAV are swept forward and extended to form an aft-wing until they are joined with the swept-back fore-wings with a pre-determined wingspan of 372 mm. Based on the wind tunnel test section geometry and flow conditions, the boundary layers developing along the wind tunnel walls were estimated to be approximately 36 mm [20]. With the present wingspan, the clearances between the UAV wing tips and the two wind tunnel walls were approximately 200 mm under pitch-only configurations. On the other hand, the minimum clearance between the UAV and the nearest wind tunnel wall was approximately 96 mm when the maximum yaw angle of 30 ° was used. These clearances were significantly larger than the boundary layer thickness along the wind tunnel walls; hence, wall interference effects were not expected to be discernible in the present study. Additional details with regards to the geometry and dimensions of the present UAV are provided in Table 1. Based on the present test velocity that was maintained throughout the present study, the Reynolds number based on the mean wing aerodynamic chord of the model is estimated to be approximately R e = 6.2 × 10 4 .
The fuselage of the UAV was machined out of 6061 aluminium alloy with a maximum specified surface roughness of Ra 40 microns. On the other hand, the joined wings were manufactured through additive manufacturing with polyamide (PA) 2200 (i.e., nylon), as they were too thin to be manufactured reliably and accurately using conventional machining. Nylon was used, as it provided an optimal balance between material strength, surface finishing, and fabrication costs. In particular, the nylon material used here has a flexural modulus and flexural strength of 1500 MPa and 58 MPa, respectively, which were deemed to be sufficient for the present study. To prevent any significant presence of surface irregularities on the additively manufactured wings, they were further hand-sanded with 2000-grit sandpaper.

2.3. Surface Oil Flow Visualizations

One of the present objectives is to understand the flow structures and behavior surrounding the present UAV; surface oil flow visualizations were hence conducted to capture the flow patterns along the UAV fuselage and wing surfaces. Another advantage of conducting this series of experiments is that surface flow patterns could be extracted from the simulations and compared with the surface oil flow visualizations to ascertain that the numerical approaches are reasonable and capture the flow behavior satisfactorily. For the present study, the pigment used was luminescent zinc sulphide (which glows neon green in the absence of light) mixed in white oil and CarlubeTM oil (Tetrosyl Express Ltd., Rochdale, OL, USA). A thin layer of this pigment–oil mixture was then applied onto the UAV, which had been previously spray-painted with a matte black finish to provide good contrast to the luminescent pigment. To ensure that the surface oil flow patterns had fully developed and stabilized, each test typically lasted around 3 min before photos were taken. A digital single-lens reflex (DSLR) camera equipped with a 50 mm, f 1.4 lens was used to capture the stabilized surface oil flow patterns on the UAV. The camera was located facing the test section side normally to capture the surface oil flow patterns along the side of the UAV, but to capture the corresponding surface patterns on the upper surfaces of the UAV, the model would be rotated via the sting-balance system to face the camera normally. Note that this was done to address the lack of optical access from the top of the wind tunnel test section.

2.4. Numerical Simulations

Numerical simulations were carried out using ANSYS Fluent software (https://www.ansys.com/products/fluids/ansys-fluent, accessed on 29 May 2023) according to the same test conditions and UAV geometry as per the wind tunnel experiments. As details of the numerical approaches had been described by [12], they will only be briefly covered here. A steady-state Reynolds-averaged Navier–Stokes (RANS) approach was used, as it was found to be sufficiently accurate in terms of predicting the aerodynamic characteristics of aerofoils and finite wings [21,22,23], which aligns with the primary concern here of evaluating the joined-wing configuration and how it performs. Note that the one-equation Spalart–Allmaras model was also used to model the flow field turbulence for the sake of simplicity and computational efficiency. Due to the UAV’s geometrical symmetry, a half-model approach was taken where it was meshed using an unstructured tetrahedral grid with symmetric boundary conditions to further save on computational resources, as shown in Figure 3a.
To further improve numerical simulation accuracy, the top and bottom far-field boundaries of the computational domain are located at 10 times the fuselage length away, as shown in Figure 3b, while the upstream and downstream boundaries are located at 20 times the fuselage length away. As such, these distances are more than the recommended 100 times of the reference chord [24] and would prevent any artificial flow influences from the boundaries. Last but not least, prismatic inflation layers were used along the physical boundaries of the UAV to ensure a y + value of less than 1 and therefore ensured that the boundary layers would be adequately captured by the simulations.
Three different mesh configurations of 3.8 million, 6.7 million, and 12.6 million cells (i.e., coarse, medium, and fine) were considered. This gives a refinement ratio of approximately 1.2 between each level of mesh. A mesh dependency check based on the methodology as prescribed by [25] was used to evaluate the discretization error for the drag coefficient at a pitch angle of 0 ° , with the details shown in Table 2. It should be mentioned that the characteristic length (l) is the representative cell size of the grid, and is described by
l = 1 N i = 1 N V i 1 / 3 ,
where N is the total number of cells used, and V i is the volume of the ith cell. It is used for estimating the uncertainty due to discretization in CFD applications, based on the grid convergence index (GCI) method [25]. Together with this quantity, variables of interest, such as the drag coefficient in this case, can be selected and used to determine if the mesh refinement is sufficient to capture the flow field. Based on the procedure outlined by [25], a minimum of three grids of increasing fineness, with a recommended grid refinement factor ( l c o a r s e / l f i n e ) of approximately 1.3, are required to estimate the GCI. This methodology has been used for reporting the uncertainty of numerical simulation results for various aerodynamic phenomena such as vortex shedding of flapping wings [26], flow separation [27], and wing–propeller interaction [28].
The numerical uncertainty in the fine-grid solution for the drag coefficient is 0.505% and deemed to be sufficiently satisfactory for the purpose of the present work. As such, all subsequent numerical simulations were conducted based on this configuration. For simulations involving non-zero yaw angles, the full 3D geometry of the UAV would be used with similar numerical approach and mesh configurations. Lastly, the text matrix for all experiments and numerical simulations conducted in this study is summarized in Table 3.

3. Results and Discussions

3.1. Flow Behavior under Pitch Conditions without Yaw

To get a first-hand appreciation of the key flow behavior associated with the present UAV, Figure 4 and Figure 5 show the side views of the surface oil flow visualizations and surface streamlines from the wind tunnel tests and numerical simulations, respectively. Results from six different pitch angles at α = 0 ° , 6 ° , 10 ° , 18 ° , 20 ° , and 24 ° are presented here, so as to show the changes in flow patterns along the fuselage as the pitch angle increases gradually. Starting with the experimental results, it can be observed that flows remain almost completely attached to the fuselage up to α = 10 ° . There appears to be minor dark streaks along the upper fuselage that indicate flow separation/reattachments, reminiscent of oil flow patterns observed by [29,30] for ogive cylinders at subsonic, low-pitch-angle conditions. Such oil flow patterns are well-documented to be associated with the formation of a pair of counter-rotating vortex roll-ups at the lee side of the ogive cylinder due to flow separations occurring on both sides of the ogive cylinder. The formations of vortex roll-ups on both sides of an ogive cylinder or slender bodies with ogive forebodies have also been reported by [31,32], and they are known to exist in symmetrical forms at low pitch angles but destabilize to asymmetrical forms at high pitch angles. As such, it can be deduced that a similar vortex roll-up initiates at approximately a quarter of the fuselage length downstream of the ogive cylinder tip at about α = 10 ° . As the pitch angle continues to increase to α = 18 ° and beyond, flow patterns show that vortex roll-ups begin to form right off the ogive cylinder tips, with clear flow separation/reattachment lines tracing along the length of the fuselage. More importantly, the vortex roll-ups encounter and interact with the fore-wing root, such that their trajectories are affected even as they remain close to the fuselage. As such, the vortex roll-ups continue to remain approximately parallel to the fuselage and below the aft-wing.
A comparison with the numerical results will reveal more flow details, as Figure 5 shows. Note that the UAV surface is color-tagged with the pressure coefficient, with orange and green denoting higher and lower pressure levels, for better appreciation. Just like the experimental results, flow patterns show that no clear formations of vortex roll-ups associated with the ogive cylinder tip can be observed up to α = 10 ° . Hence, there is good agreement between the experiments and simulations so far. On the other hand, the junction flows between the fore-wing root and the flow along the fuselage can clearly be discerned even at α = 0 ° . As the pitch angle increases, the junction flow distorts the fuselage surface flow from α = 6 ° onwards, such that they divert upwards and towards the vertical stabilizer. There are two reasons why this is happening. Firstly, the fore-wing is inclined at the same pitch angle as the fuselage and that produces an asymmetrical flow scenario leading to lower pressure above the fore-wing. Secondly, the increasing higher pressure levels along the lower fuselage region, resulting from the increasingly larger blockage area posed by the fuselage as its pitch angle increases, will also complement the lower pressure effects above the fore-wing. And in agreement with the experiments, vortex roll-ups are formed once the pitch angle reaches α = 18 ° and beyond, with clear flow separation/reattachment lines originating from the ogive cylinder tip. Due to the flow influences described above, the vortex roll-ups are also diverted towards the upper fuselage and vertical stabilizer. In fact, the interactions between the vortex roll-ups with the fore-wing root predicted by the simulations in Figure 5d–f can also be seen in their experimental counterparts in Figure 4d–f. Last but not least, it could also be that the low pressure level generated by the suction side of the fore-wing expands along the fuselage as the pitch angle increases.
Next, attention will be paid towards the flow patterns as observed from the top view, as shown in Figure 6, so as to complement the side views in Figure 4 and Figure 5. Note that due to the flow pattern symmetry about the fuselage centerline for both the experimental and simulation results, each of their halves are arranged side-by-side for ease of comparison. Returning to Figure 6, it can be discerned that the fuselage flow patterns obtained from the experiments are in reasonable agreement with the simulation results. For instance, the initiation and growth in formations of the vortex roll-ups from the ogive cylinder tip from α = 10 ° onwards can be observed in both of them. On the other hand, there exist some subtle differences in the joined-wing flow patterns observed experimentally and those predicted by the simulations. For instance, while flow separation lines/regions and recirculating flow regions along both the fore- and aft-wings can be seen for both approaches, their exact locations or extents differ for larger pitch angles. There are several plausible reasons for these discrepancies. Firstly, it can be challenging to achieve the right fluorescent oil mix that works under different test conditions, and occasional pooling was detected during the experiments, which could introduce errors in the identifications of flow separation/recirculating regions despite best efforts. This is especially the case when the UAV was rotated to capture its top view flow visualizations. Secondly, discrepancies between the experimental free-stream characteristics and the turbulence model adopted in the simulations could also lead to the differences observed, since no single turbulence model can fully describe the actual wind tunnel flow conditions exactly. Having said that, the general flow separation and recirculating flow characteristics predicted by the simulations are deemed to be sufficiently reasonable and agreeable when compared to the experiments, considering the research goal of better understanding how the present sharp-tipped UAV behaves under a variety of pitch and/or yaw conditions for design purposes.
To better understand the flow patterns observed thus far, Figure 7 shows the flow behavior along the suction surfaces of both fore- and aft-wings under closer inspection using streamline plots based on simulation results. Results from three representative pitch angles will only be shown for the sake of brevity, where they show “clean” flows with little/no flow separations, mild flow separations and/or spanwise flows, and lastly, significant flow separations and spanwise flows. Starting with the fore-wing, with the expectation that its behavior could affect that of the aft-wing depending on the pitch angle, it can be observed that only a small recirculating region at the wing root and some slight flow separations exist along the fore-wing at a small pitch angle of α = 6 ° , shown in Figure 7a(i). Despite their occurrences, however, much of the flow leaves the fore-wing without discernible flow separations that could destabilize or increase the free-stream turbulence levels upstream of the aft-wing. Furthermore, if one were to inspect closely the joined-wing design presented in Figure 1 earlier, a small pitch angle of α = 6 ° will see the fore-wing remaining substantially lower than the aft-wing. This implies that much of the flow leaving the fore-wing trailing edge is unlikely to confer significant influences upon the aft-wing, which agrees well with the result presented for the aft-wing shown in Figure 7b(i), where little or no separation occurs along the aft-wing. As the pitch angle increases to α = 10 ° , the recirculating region at the wing root, as well as flow separations and spanwise flows along the fore-wing, become more apparent, as shown in Figure 7a(ii). However, they are not sufficiently severe to reduce the quality of the free stream ahead of the aft-wing (see Figure 7b(ii)), on top of the fact that the fore-wing remains lower than the aft-wing at that pitch angle. Hence, the flow behavior along the aft-wing does not deviate much from that observed at α = 6 ° . When the pitch angle increases further to α = 24 ° , spanwise flows along the fore-wing become far more pronounced. In particular, Figure 7a(iii) shows a strong junction vortex arising from interactions between the fuselage and fore-wing boundary layers, which serves to drive highly intense spanwise flows along the entire suction surface of the fore-wing. Flow separations are also significantly more pronounced along the fore-wing now. Interestingly, it does not appear to have significant impact upon the lift generation, even though it is undesirable flow-wise, as will be seen in the lift coefficient results later on. As for the aft-wing depicted in Figure 7b(iii), significant flow separations, recirculating and spanwise flows, can finally be seen to manifest at this highest pitch angle. It is very likely that this is the direct result of the wake from the separated flow along the fore-wing coming sufficiently close to or even impinging upon the aft-wing to impart drastically destabilizing flow effects. This is especially the case when one considers the larger α = 24 ° pitch angle here, where the fore- and aft-wings would be much closer in terms of height separation. Similarly, even though the flow behavior depicted in Figure 7b(iii) appears to be severe, the lift generation does not appear to suffer, as will be seen in the lift coefficient results later. It should be noted that while the present simulations are able to predict these flow separations, the present RANS approach with the Spalart–Allmaras turbulence model was meant to capture the general mean flow and aerodynamics trends in mind. Numerical approaches with higher-order turbulence modelling that are better in predicting their unsteady flow behavior at higher fidelity levels would likely provide more accurate predictions and transient flow characteristics, if appropriate computational resources and time are available.

3.2. Lift and Drag Characteristics under Pitch Conditions without Yaw

The impact of the flow behavior observed in Figure 4, Figure 5, Figure 6 and Figure 7 can be better discerned from Figure 8, where detailed breakdowns of the lift and drag coefficients contributed by the five physical components of the UAV (i.e., fore- and aft-wings, fuselage, wing joint, and vertical stabilizer) are shown. As the overall lift and drag coefficients of the entire UAV itself have been presented and discussed previously by [12], they will not be covered here for the sake of brevity. In Figure 8a, where different lift coefficient components are shown, it can be discerned that the wing joint is unsurprisingly insensitive towards the pitch angle, due to its vertical orientation and small physical size. Having said that, the vertical stabilizer does demonstrate lift increments as the pitch angle increases, even though the maximum lift reaches an asymptotic value of approximately C L = 0.04 . Upon closer inspection, in conjunction with Figure 4 and Figure 5, this could be explained by the proximity of the vortex roll-ups on both sides of the vertical stabilizer, which could have led to corresponding low-pressure regions and hence minor lift generation. In contrast, the fuselage produces moderate lift levels that grow relatively linearly with the pitch angle throughout the test range. This can be accounted for by the formation of the vortex roll-ups and their growing strengths as the pitch angle increases. Note that the maximum pitch angle of α = 24 ° used here remains sufficiently moderate for the ogive-tip cylinder, such that the vortex roll-ups do not abruptly detach themselves away from the fuselage with a corresponding sudden reduction in lift levels. Last but not least, the lift coefficient contributions from the fore- and aft-wings exhibit complementary behavior. While the aft-wing produces comparatively higher lift levels over the fore-wing up until α = 14 ° , the former stalls at α = 10 ° and its lift level subsequently drops thereafter. However, the fore-wing continues to see lift increments until it stalls at a significantly higher pitch angle of α = 20 ° with much shallower lift reductions after that. The end result of this is highly beneficial, sustained high lift levels until the maximum pitch angle of α = 24 ° investigated here.
As for the drag coefficient contributions shown in Figure 8b, the trends exhibited by the wing joint and vertical stabilizer are relatively similar to their lift coefficient counterparts, where their contributions remain small. Drag coefficient behavior for both fore-and aft-wings does not show significant deviations as well, with both contributing moderately low drag levels up to α = 10 ° . However, they do quickly increase as the pitch angle increases further. As for the fuselage, it makes the largest contribution towards the overall drag levels and, being the component that incurs the largest flow blockage, this does not come as a surprise. In fact, fuselage drag level is approximately 3.5 to 5 times that of the fore- and aft-wing drag levels at α = 0 ° . However, as the pitch angle increases, their discrepancies reduce drastically as the fore- and aft-wing drag levels increase substantially. Nevertheless, it is clear that while the ogive cylinder tip provides additional lift over the joined wings through the vortex roll-ups, it also produces significant drag levels. At this point, a few notions can be surmised from Figure 8. Firstly, through the use of the present joined-wing design, the UAV stalls at a much higher pitch angle than if only the fore-wing was used, as with most other conventional fixed-wing UAVs. Secondly, the ability of the ogive cylinder tip to generate additional lift by producing vortex roll-ups may be useful for further stall-delaying efforts. However, this consideration will have to take into account the drag penalty that accompanies such a configuration and specific mission requirements for the UAV.

3.3. Effects of Yaw on Flow Characteristics
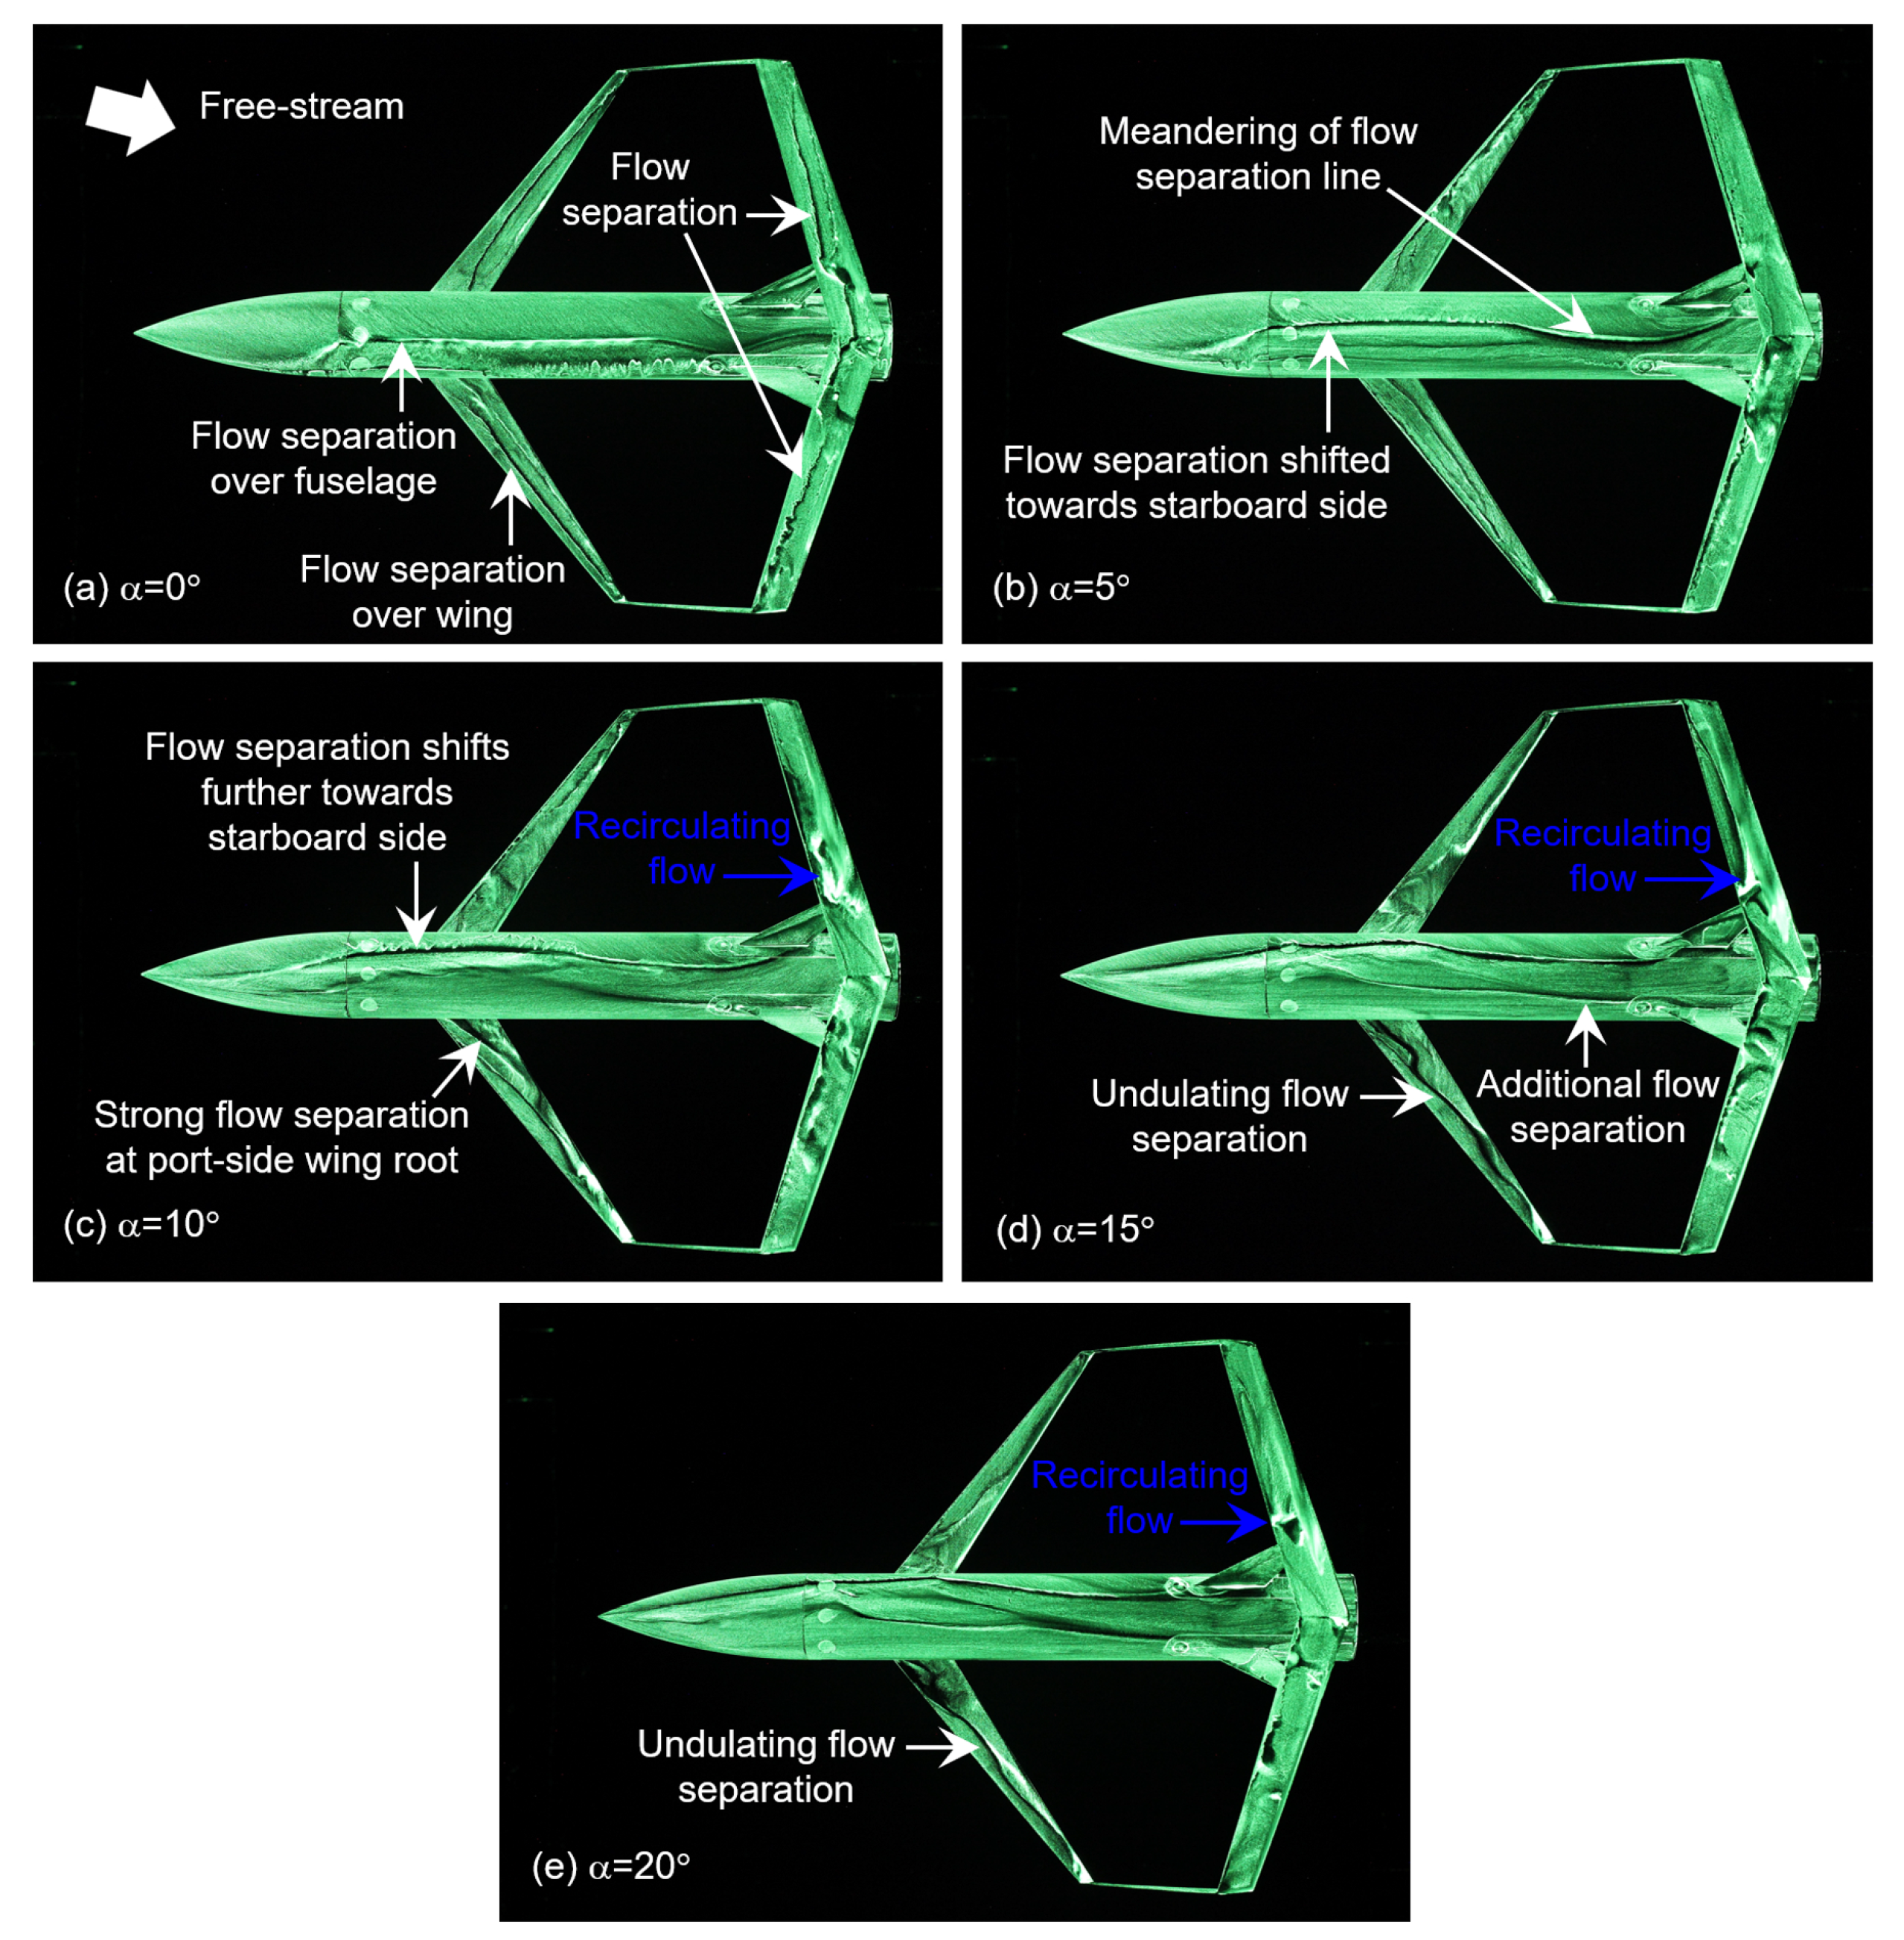
Figure 9 and Figure 10 show comparisons between the experimental surface oil flow visualizations and numerical surface streamlines when the UAV is pitched at α = 0 ° , 5 ° , 10 ° , 15 ° , and 20 ° with a non-zero yaw angle of β = 15 ° imposed. The imposition of a 15 ° yaw angle leads to an asymmetric flow behavior, where flow separations over much of the straight cylindrical fuselage along the port side can be observed in Figure 9a. Note that this flow separation does not lead to formation of the ogive vortex roll-ups. Clear flow separations can also be discerned along all fore- and aft-wings. As the pitch angle increases to α = 5 ° and beyond, the flow separation line(s) shift gradually towards the starboard side, with some meandering occurring just upstream of the vertical stabilizers. A second fuselage flow separation appears to manifest on the port side of the first one at a pitch angle of α = 10 ° , where they have very similar trajectories along the cylindrical fuselage. However, they become rather complex and interact with one another at a pitch angle of α = 20 ° . It cannot be ascertained at this point if the two fuselage flow separations actually produce the ogive vortex roll-ups, though that is unlikely to be the case due to the yaw direction. Flow separations along the aft-wings will also evolve to produce small recirculating flow regions that persist until α = 20 ° 
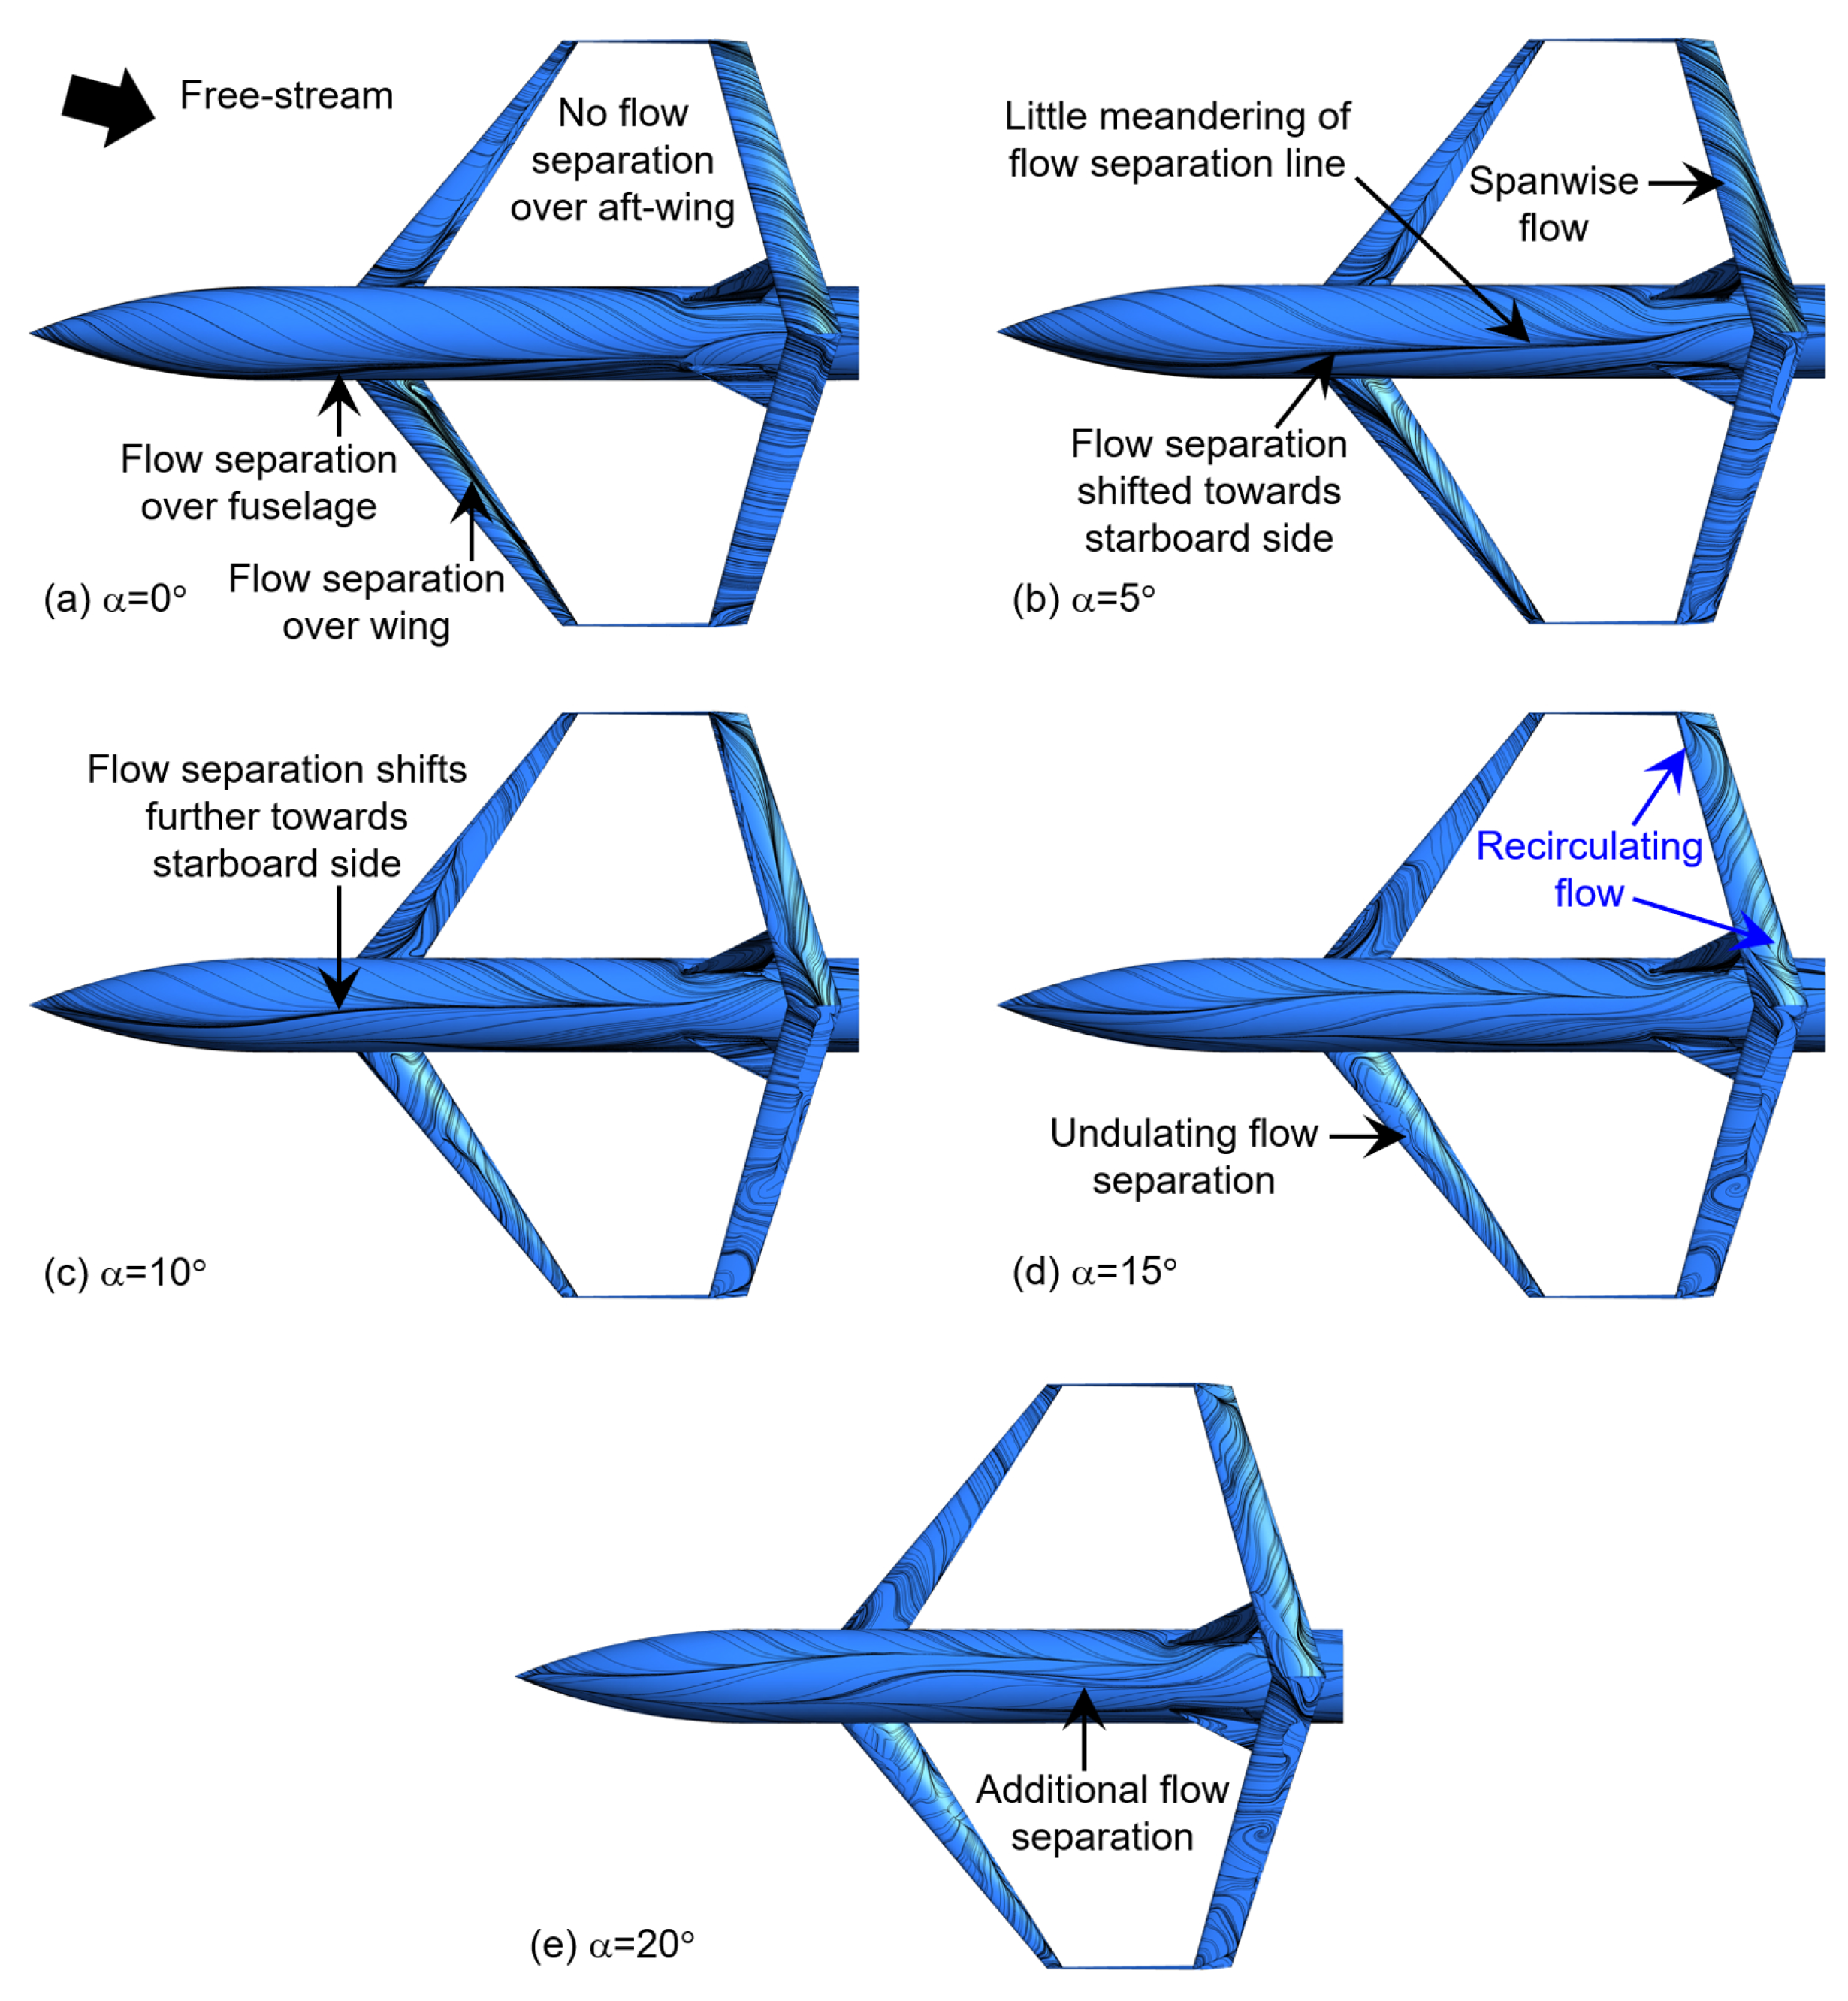
. As for the flow separations along the fore-wings, it is interesting to note that they become more convoluted and stronger (presumably due to the fuselage flow separations) as pitch angle increases and take on undulating distributions along the wingspan at higher pitch angles. The numerical results in Figure 10 show general agreements, though aft-wing flow separations are predicted later with less meandering of the flow separation line observed. Additionally, the complex flow separation behavior at α = 20 ° is not predicted numerically either. With regards to flow influences conferred by the fore-wing upon the aft-wing, it is challenging to differentiate between them and effects caused by the non-zero yaw angle. However, if one were to take a closer look at Figure 10a–c, the streamlines along the aft-wing indicate that they are more or less aligned with the yaw angle, with little interference coming off the fore-wing. In contrast, the streamline patterns on the aft-wing at higher pitch angles of α = 15 ° and 20 ° do not reflect that, thereby suggesting that the fore-wing is likely to impart more flow effects upon the aft-wing at higher pitch angles, similar to the non-yawed test cases. In fact, results associated with a β = 30 ° yaw angle to be presented later show relatively similar outcomes.
When the yaw angle doubles to β = 30 ° , as shown in the experimental surface oil flow visualizations in Figure 11, fuselage flow separation behavior remains largely similar, even though it becomes more complex earlier, from α = 15 ° . In contrast to the β = 15 ° yaw angle, however, there is significantly less meandering of the flow separation lines. As for the fore- and aft-wings, flow separations over them are also more complex than those observed for a smaller yaw angle of β = 15 ° . Numerical results captured for the same yaw angle of β = 30 ° shown in Figure 12 predicted the fuselage flow separations, though they are not located as much towards the starboard side as the experimental results. Additionally, flow separations over the fore- and aft-wings are not that well-predicted by the numerical results, particularly at higher pitch angle angles of α = 10 ° and beyond. Nevertheless, the numerical results provide an acceptable appreciation of the most significant differences between the two yaw angles studied here.

3.4. Effects of Yaw on Lift and Drag Characteristics

As mentioned earlier, one of the aims here is to understand how the UAV will behave aerodynamically under non-zero sideslip conditions (i.e., non-zero yaw) in combination with non-zero pitch angle for a more realistic assessment of its performance. As such, experiments and simulations were conducted to assess its lift, drag, and lateral force coefficients across different pitch angles from α = 10 ° to 25 ° , in conjunction with two different yaw angles of β = 15 ° and 30 ° . These two yaw angles were selected to represent small and moderate sideslip conditions, respectively, and the results are presented in Figure 13. At a small yaw angle of β = 15 ° , no stall occurs within the pitch angle range tested and drag levels increase moderately from α = 0 ° as well. The lift and drag trends and levels are also relatively similar to what had been reported by [12] without yaw, which indicates that small sideslip conditions do not alter the aerodynamic characteristics much. Additionally, the lateral force coefficient remains moderate and stable, although it does increase slightly as the pitch angle increases. Equally important is the fact that there is good agreement between the experiments and simulations, despite the simulations predicting slightly lower lift coefficients. With a larger yaw angle of β = 30 ° , however, the discrepancies in the lift coefficient between the experiments and simulations become more significant. While the trends remain similar with steady lift increments as the pitch angle increases, the lift coefficients predicted by the simulations progressively become lower than the experiments. This suggests that the simulations could be significantly under-predicting pressure differentials or over-predicting flow separations for the joined wings under significant sideslip conditions, evident from the surface flow patterns presented in Figure 11 and Figure 12. On the other hand, while discrepancies increase slightly for the lateral force coefficients, experimental and predicted drag levels continue to agree very well.
With the awareness that simulations tend to under-predict the lift coefficients under moderate yaw angles and beyond, Figure 14 shows the experimental lift and drag coefficient results obtained across a much wider range of pitch angle and yaw angle combinations, which would reveal more about the flight envelope of the present UAV. In this case, the pitch angle ranges from α = 0 ° to 25 ° , while the yaw angle ranges from β = 5 ° to 30 ° . One thing to note before going into the details is that the lift coefficient continues to increase as the pitch angle used increases, regardless of the exact yaw angle. However, the increment becomes smaller despite the constant 5 ° pitch angle intervals used and that would be due to the complex flow interactions when yaw angle varies. As Figure 14a shows, the lift coefficients remain relatively stable across the entire yaw angle range at small pitch angles of α = 0 ° and 5 ° . On the other hand, moderate pitch angles of α = 10 ° and 15 ° lead to progressively lower lift coefficients once the yaw angle reaches β = 30 ° and beyond. More interesting though is that once the pitch angles reach α = 20 ° and 25 ° , the lift coefficient increases in general across the yaw angle range. Nevertheless, the lift behavior remains stable despite these variations, and this shows that it is not significantly affected across the yaw angle range used here. This also implies that the present UAV is expected to be stable towards any abrupt changes in the lateral direction of the free stream.
On the other hand, the drag coefficient tends to increase at a higher rate as the pitch angle increases for the same yaw angle, opposite to what had been observed for lift coefficient previously. These observations are not unexpected, however, as the imposition of non-zero yaw angles is expected to decrease lift and increase drag due to more complex flow blockages and interactions. Referring to Figure 14b, little increase in drag is incurred across all yaw angles when pitch angle increases from α = 0 ° to 5 ° , but that changes when the pitch angle increases to α = 10 ° and beyond where drag levels increase much more substantially. Clearly, this signifies that a significant drop in the lift-to-drag ratio occurs when large pitch angle and yaw angle combinations are used. Next, Figure 15 shows the yawing and rolling moment coefficients obtained experimentally, where they will be analyzed as markers of directional and lateral stabilities. Note that good directional and lateral stabilities are typically represented by positive and negative yawing and rolling moment slopes, respectively, as described by [33], and that is indeed the case shown in Figure 15, save for some instances. However, those instances tend to occur mostly at high pitch angles at α = 20 ° to 25 ° , which the UAV is unlikely to operate at for prolonged periods of time. It should also be highlighted that Figure 15b shows that the rolling moment slopes are sometimes close to zero when small pitch angles are used, which suggest that the statically neutral state may require external interventions to correct any perturbations. Nonetheless, results seen thus far prove that the present UAV generally possesses adequate directional and lateral stability, and flight control surfaces could be used to correct for any instabilities.

4. Conclusions

A combined experimental and numerical study has been conducted to investigate the flow separation behavior and aerodynamic performance of a small-scale joined-wing UAV under combined pitch and yaw conditions. Surface oil flow visualizations show that for the baseline configuration where the UAV undergoes pitching without yawing, considerably symmetric results demonstrate that ogive cylinder vortex roll-ups are formed at pitch angles of α = 18 ° and beyond. While they interact with the fore-wings significantly, their behavior is stable and they remain close to the fuselage. In particular, these interactions lead to strong junction vortices forming at the fore-wing roots and subsequent flow separations and spanwise flows. While stall occurs along the aft-wing before the fore-wing at α = 10 ° , higher lift coefficients by the latter at higher pitch angles ensure that the combined lift behavior remains good. The UAV fuselage contributes towards the largest drag component, followed by the aft- and fore-wings, respectively.
When the UAV is subjected to both pitching and yawing conditions, of which two yaw angles of β = 15 ° and 30 ° are used, asymmetric flow structures along the fuselage will be produced. Due to the present non-zero yaw angle, flow separates along the fuselage’s port side first and increasing the pitch angle will see the flow separation line shift towards the fuselage’s starboard side. A second flow separation line is visible when the pitch angle reaches α = 15 ° and beyond, with the overall flow separation behavior becoming more convoluted and complex as the pitch angle increases. At this point, the two fuselage flow separations do not appear to be associated with the classical ogive vortex roll-ups, due to the yaw direction. Surface streamlines captured by numerical simulations are in general agreement with the surface oil flow visualization results, considering the complexity of the UAV geometry.
The agreement between experimental and numerical approaches also extends to the lift, drag, and lateral force coefficients captured by wind tunnel testing and numerical simulations. The numerical predictions for a smaller yaw angle of β = 15 ° come close to the wind tunnel test results, though increasing the yaw angle to β = 30 ° will lead to more significant discrepancies in the lift and lateral force coefficients. Numerical results for yaw angles from β = 5 ° to 30 ° predict continuing lift and drag increments as the pitch angle increases, though the pace of increments decreases for the former and increases for the latter eventually. Yawing and rolling moment results predict that the UAV tends to have good flight stability up to moderate pitch angles. In contrast, flight stability may need to be better controlled using flight control surfaces when the pitch angle reaches α = 20 ° and beyond.

Author Contributions

Conceptualization, T.H.N., Z.W.T. and B.N.; methodology, T.H.N., Z.W.T. and B.N.; investigation, Z.W.T., S.L. and Z.A.O.; resources, T.H.N. and B.N.; data curation, T.H.N. and Z.W.T.; writing—original draft preparation, T.H.N. and Z.W.T.; writing—review and editing, T.H.N., Z.W.T. and B.N.; supervision, T.H.N.; project administration, T.H.N. and B.N.; funding acquisition, T.H.N. and B.N. All authors have read and agreed to the published version of the manuscript.

Funding

This research was funded by the School of Mechanical and Aerospace Engineering, Nanyang Technological University and Helmholtz Association International Research Group grant.

Data Availability Statement

The data presented in this study are available on request from the corresponding author.

Acknowledgments

The authors gratefully acknowledge the support for the study by the School of Mechanical and Aerospace Engineering, Nanyang Technological University, German Aerospace Center, and Helmholtz Association of German Research Centers. Support for the study by T. Pfeiffer and V. Gollnick is also deeply appreciated.

Conflicts of Interest

The authors declare no conflict of interest. The funders had no role in the design of the study; in the collection, analyses, or interpretation of data; in the writing of the manuscript; or in the decision to publish the results.

References

  1. Wolkovitch, J. The joined wing—An overview. J. Aircr. 1986, 23, 161–178. [Google Scholar] [CrossRef]
  2. Prandtl, L. Induced Drag of Multiplanes; NACA-TN-182; NASA: Washington, DC, USA, 1924.
  3. Kroo, I.; Gallman, J.; Smith, S. Aerodynamic and structural studies of joined-wing aircraft. J. Aircr. 1991, 28, 74–81. [Google Scholar] [CrossRef]
  4. Gallman, J.W.; Smith, S.C.; Kroo, I.M. Optimization of joined-wing aircraft. J. Aircr. 1993, 30, 897–905. [Google Scholar] [CrossRef]
  5. Nangia, R.; Palmer, M.; Tilmann, C. Unconventional high aspect ratio joined-wing aircraft with aft-and forward-swept wing-tips. In Proceedings of the 41st Aerospace Sciences Meeting and Exhibit, Reno, NV, USA, 6–9 January 2003. AIAA-2003-0506. [Google Scholar]
  6. Rasmussen, C.C.; Canfield, R.A.; Blair, M. Joined-wing sensor-craft configuration design. J. Aircr. 2006, 43, 1470–1478. [Google Scholar] [CrossRef]
  7. Mamla, P.; Galinski, C. Basic induced drag study of the joined-wing aircraft. J. Aircr. 2009, 46, 1438–1440. [Google Scholar] [CrossRef]
  8. Cuerno-Rejado, C.; Alonso-Albir, L.; Gehse, P. Conceptual design of a medium-sized joined-wing aircraft. Proc. Inst. Mech. Eng. Part G J. Aerosp. Eng. 2010, 224, 681–696. [Google Scholar] [CrossRef]
  9. Cavallaro, R.; Demasi, L. Challenges, ideas, and innovations of joined-wing configurations: A concept from the past, an opportunity for the future. Prog. Aerosp. Sci. 2016, 87, 1–93. [Google Scholar] [CrossRef]
  10. Andrews, S.A.; Perez, R.E. Comparison of box-wing and conventional aircraft mission performance using multidisciplinary analysis and optimization. Aerosp. Sci. Technol. 2018, 79, 336–351. [Google Scholar] [CrossRef]
  11. Kaparos, P.; Papadopoulos, C.; Yakinthos, K. Conceptual design methodology of a box wing aircraft: A novel commercial airliner. Proc. Inst. Mech. Eng. Part G J. Aerosp. Eng. 2018, 232, 2651–2662. [Google Scholar] [CrossRef]
  12. Teo, Z.W.; New, T.H.; Li, S.; Pfeiffer, T.; Nagel, B.; Gollnick, V. Wind tunnel testing of additive manufactured aircraft components. RApid Prototyp. J. 2018, 24, 886–893. [Google Scholar] [CrossRef]
  13. Zhang, C.; Zhou, Z.; Zhu, X.; Meng, P. Nonlinear static aeroelastic and trim analysis of highly flexible joined-wing aircraft. AIAA J. 2018, 56, 4988–4999. [Google Scholar] [CrossRef]
  14. Cai, Y.; Liu, G.; Zhu, X.; Tu, Q.; Hong, G. Aerodynamic interference significance analysis of two-dimensional front wing and rear wing airfoils with stagger and gap variations. J. Aerosp. Eng. 2019, 32, 04019098. [Google Scholar] [CrossRef]
  15. Russo, L.; Tognaccini, R.; Demasi, L. Box wing and induced drag: Compressibility effects in subsonic and transonic regimes. AIAA J. 2020, 58, 2398–2413. [Google Scholar] [CrossRef]
  16. Salem, K.A.; Cipolla, V.; Palaia, G.; Binante, V.; Zanetti, D. A physics-based multidisciplinary approach for the preliminary design and performance analysis of a medium range aircraft with box-wing architecture. Aerospace 2021, 8, 292. [Google Scholar] [CrossRef]
  17. Cipolla, V.; Abu Salem, K.; Palaia, G.; Binante, V.; Zanetti, D. Prediction of maximum lift coefficient of box-wing aircraft through the combination of an analytical adaptation of the DATCOM method and vortex-lattice simulations. J. Aerosp. Eng. 2022, 35, 04022026. [Google Scholar] [CrossRef]
  18. Cheawchan, A.U.; Wen, Y.; Teo, Z.W.; Ng, B.F.; New, T.H. Flow behavior of skewed vortex generators on a backward-facing ramp. Proc. Inst. Mech. Eng. Part G: J. Aerosp. Eng. 2021, 235, 2299–2314. [Google Scholar] [CrossRef]
  19. Cheawchan, A.; Mohamed, M.A.; Ng, B.F.; New, T.H. Flow structures of wishbone vortex generators and their interactions with a backward-facing ramp. J. Aerosp. Eng. 2023, 36, 04022120. [Google Scholar] [CrossRef]
  20. Schlichting, H. Turbulent boundary layers at zero pressure gradient. In Boundary-Layer Theory, 7th ed.; McGraw Hill: New York, NY, USA, 1979; pp. 635–638. [Google Scholar]
  21. Ma, R.; Liu, P. Numerical simulation of low-Reynolds-number and high-lift airfoil S1223. In Proceedings of the World Congress on Engineering, London, UK, 1–3 July 2009. [Google Scholar]
  22. Catalano, P.; Tognaccini, R. RANS analysis of the low-Reynolds number flow around the SD7003 airfoil. Aerosp. Sci. Technol. 2011, 15, 615–626. [Google Scholar] [CrossRef]
  23. Bui, T.T. Analysis of stall aerodynamics of a swept wing with laminar-flow glove. J. Aircr. 2015, 52, 867–871. [Google Scholar] [CrossRef]
  24. Slotnick, J.P.; Hannon, J.A.; Chaffin, M. Overview of the first AIAA CFD high lift prediction workshop. In Proceedings of the 49th AIAA Aerospace Sciences Meeting, Orlando, FL, USA, 4–7 January 2011. AIAA-2011-0862. [Google Scholar]
  25. Celik, I.B.; Ghia, U.; Roache, P.J.; Freitas, C.J.; Coleman, H.; Raad, P.E. Procedure for estimation and reporting of discretization error in CFD applications. J. Fluids Eng. Trans. ASME 2008, 130, 078001. [Google Scholar]
  26. Feaster, J.; Battaglia, F.; Bayandor, J. The two-dimensional aerodynamic analysis of various cross-sections of a morphologically accurate bee wing in forward flight. Fluids Eng. Div. Summer Meet. Am. Soc. Mech. Eng. 2017, 58066, V01CT21A009. [Google Scholar]
  27. Cheawchan, A.; Mohamed, M.A.; Ng, B.F.; New, T.H. A numerical investigation on flow past skewed vortex generators ahead of a backward facing ramp. Aerosp. Sci. Technol. 2022, 123, 107435. [Google Scholar] [CrossRef]
  28. Ciliberti, D.; Della Vecchia, P.; Orticalco, V.; Nicolosi, F. Aero-propulsive interactions between UAV wing and distributed propellers due to their relative position. Drones 2023, 7, 49. [Google Scholar] [CrossRef]
  29. Keener, E.R. Oil flow separation patterns on an ogive forebody. AIAA J. 1983, 21, 550–556. [Google Scholar] [CrossRef] [Green Version]
  30. Degani, D.; Tobak, M.; Zilliac, G.G. Surface flow patterns on an ogive-cylinder at incidence. AIAA J. 1992, 30, 272–274. [Google Scholar] [CrossRef]
  31. Malcolm, G.N. Forebody vortex control. Prog. Aerosp. Sci. 1991, 28, 171–234. [Google Scholar] [CrossRef]
  32. Zeiger, M.D.; Telionis, D.P.; Vlachos, P.P. Unsteady separated flows over three-dimensional slender bodies. Prog. Aerosp. Sci. 2004, 40, 291–320. [Google Scholar] [CrossRef]
  33. Nelson, R.C. Flight Stability and Automatic Control, Volume 2; WCB/McGraw Hill: New York, NY, USA, 1998. [Google Scholar]
Figure 1. Geometry and key dimensions of the joined-wing UAV used in present study.
Aerospace 10 00661 g001
Figure 2. Photo of the joined-wing UAV mounted onto the sting-balance system.
Aerospace 10 00661 g002
Figure 3. Schematics showing the (a) half-model approach and associated mesh close to its solid boundaries, as well as where the UAV geometry was located within the (b) computational domain.
Aerospace 10 00661 g003
Figure 4. Side views of the surface oil flow visualizations at pitch angles of (a) α = 0 ° , (b) α = 6 ° , (c) α = 10 ° , (d) α = 18 ° , (e) α = 20 ° , and (f) α = 24 ° .
Aerospace 10 00661 g004
Figure 5. Side views of the surface pressure distributions and surface streamlines taken from simulations at pitch angles of (a) α = 0 ° , (b) α = 6 ° , (c) α = 10 ° , (d) α = 18 ° , (e) α = 20 ° , and (f) α = 24 ° .
Aerospace 10 00661 g005
Figure 6. Top view comparisons of the surface oil flow visualizations from the experiments, as well as the surface pressure distributions and surface streamlines taken from simulations, at pitch angles of (a) α = 0 ° , (b) α = 6 ° , (c) α = 10 ° , (d) α = 18 ° , (e) α = 20 ° , and (f) α = 24 ° .
Aerospace 10 00661 g006
Figure 7. Three-dimensional views of the flow behavior along both (a) fore-wing and (b) aft-wing, showing increasingly strong spanwise flows along both wings as pitch angle increases.
Aerospace 10 00661 g007
Figure 8. Comparison between the (a) lift coefficient and (b) drag coefficient components contributed by the various UAV components from α = 10 ° to 25 ° .
Aerospace 10 00661 g008
Figure 9. Top view comparisons of the surface oil flow visualizations at pitch angles of (a) α = 0 ° , (b) α = 5 ° , (c) α = 10 ° , (d) α = 15 ° , and (e) α = 20 ° when the yaw angle is at β = 15 ° .
Aerospace 10 00661 g009
Figure 10. Top view comparisons of the surface streamlines taken from simulations at pitch angles of (a) α = 0 ° , (b) α = 5 ° , (c) α = 10 ° , (d) α = 15 ° , and (e) α = 20 ° when the yaw angle is at β = 15 ° .
Aerospace 10 00661 g010
Figure 11. Top view comparisons of the surface oil flow visualizations at pitch angles of (a) α = 0 ° , (b) α = 5 ° , (c) α = 10 ° , (d) α = 15 ° , and (e) α = 20 ° when the yaw angle is at β = 30 ° .
Aerospace 10 00661 g011
Figure 12. Top view comparisons of the surface streamlines taken from simulations at pitch angles of (a) α = 0 ° , (b) α = 5 ° , (c) α = 10 ° , (d) α = 15 ° , and (e) α = 20 ° when the yaw angle is at β = 30 ° .
Aerospace 10 00661 g012
Figure 13. Comparisons between the lift, drag, and lateral force coefficients captured by the experiments and simulations at yaw angles of (a) β = 15 ° and (b) β = 30 ° .
Aerospace 10 00661 g013
Figure 14. Variations in the (a) lift coefficients and (b) drag coefficients across yaw angles of β = 5 ° to 30 ° , when the UAV is pitched at pitch angles from α = 0 ° to 25 ° .
Aerospace 10 00661 g014
Figure 15. Variations in the (a) yaw moment and (b) roll moment coefficients across yaw angles of β = 0 ° to 30 ° , when the UAV is pitched at pitch angles from α = 0 ° to 25 ° .
Aerospace 10 00661 g015
Table 1. Geometrical parameters of the present UAV.
Geometrical ParameterDimension
Span [mm]372
Reference area [m2]0.022
Fore-wing sweep [ ° ]40
Aft-wing sweep [ ° ]−14.9
Fore-wing dihedral [ ° ]3.5
Aft-wing dihedral [ ° ]−11
Fore-wing root twist [ ° ]1
Fore-wing tip twist [ ° ]−3.5
Aft-wing root twist [ ° ]1
Aft-wing tip twist [ ° ]−3
Fore-wing taper ratio0.21
Aft-wing taper ratio0.71
Mean aerodynamic chord [mm]32
Wing tip stagger normalized by MAC2.9
Wing tip gap normalized by MAC1.7
Wing tip decalage [ ° ]−0.5
Vertical aspect ratio0.15
Table 2. Grid convergence check results.
ParameterCoarse MeshMedium MeshFine Mesh
Mesh count 3.8 × 10 6 6.7 × 10 6 12.6 × 10 6
Characteristic length [m]0.06920.05720.0464
Drag coefficient, C D 0.08140.0770 (−5.75%)0.0759 (−1.49%)
Apparent order, p 7.361
Extrapolated value 0.0756
Extrapolated relative error [%] 0.406
Fine-grid convergence index [%] 0.505
Table 3. Test matrix of experiments and numerical simulations.
Test CasesPitch Angle, α Yaw Angle, β
Pitch only (Experiments)−10 to 25, at 1° intervals
Pitch only (Numerical simulations)−10 to 24, at 2° intervals
Pitch and yaw (Experiments and numerical simulations)0 to 25, at 5° intervals5 to 25, at 5° intervals
Disclaimer/Publisher’s Note: The statements, opinions and data contained in all publications are solely those of the individual author(s) and contributor(s) and not of MDPI and/or the editor(s). MDPI and/or the editor(s) disclaim responsibility for any injury to people or property resulting from any ideas, methods, instructions or products referred to in the content.

