
Crashworthiness of Additively Manufactured Lattice Reinforced Thin-Walled Tube Hybrid Structures

 ,
,
Abstract
1. Introduction
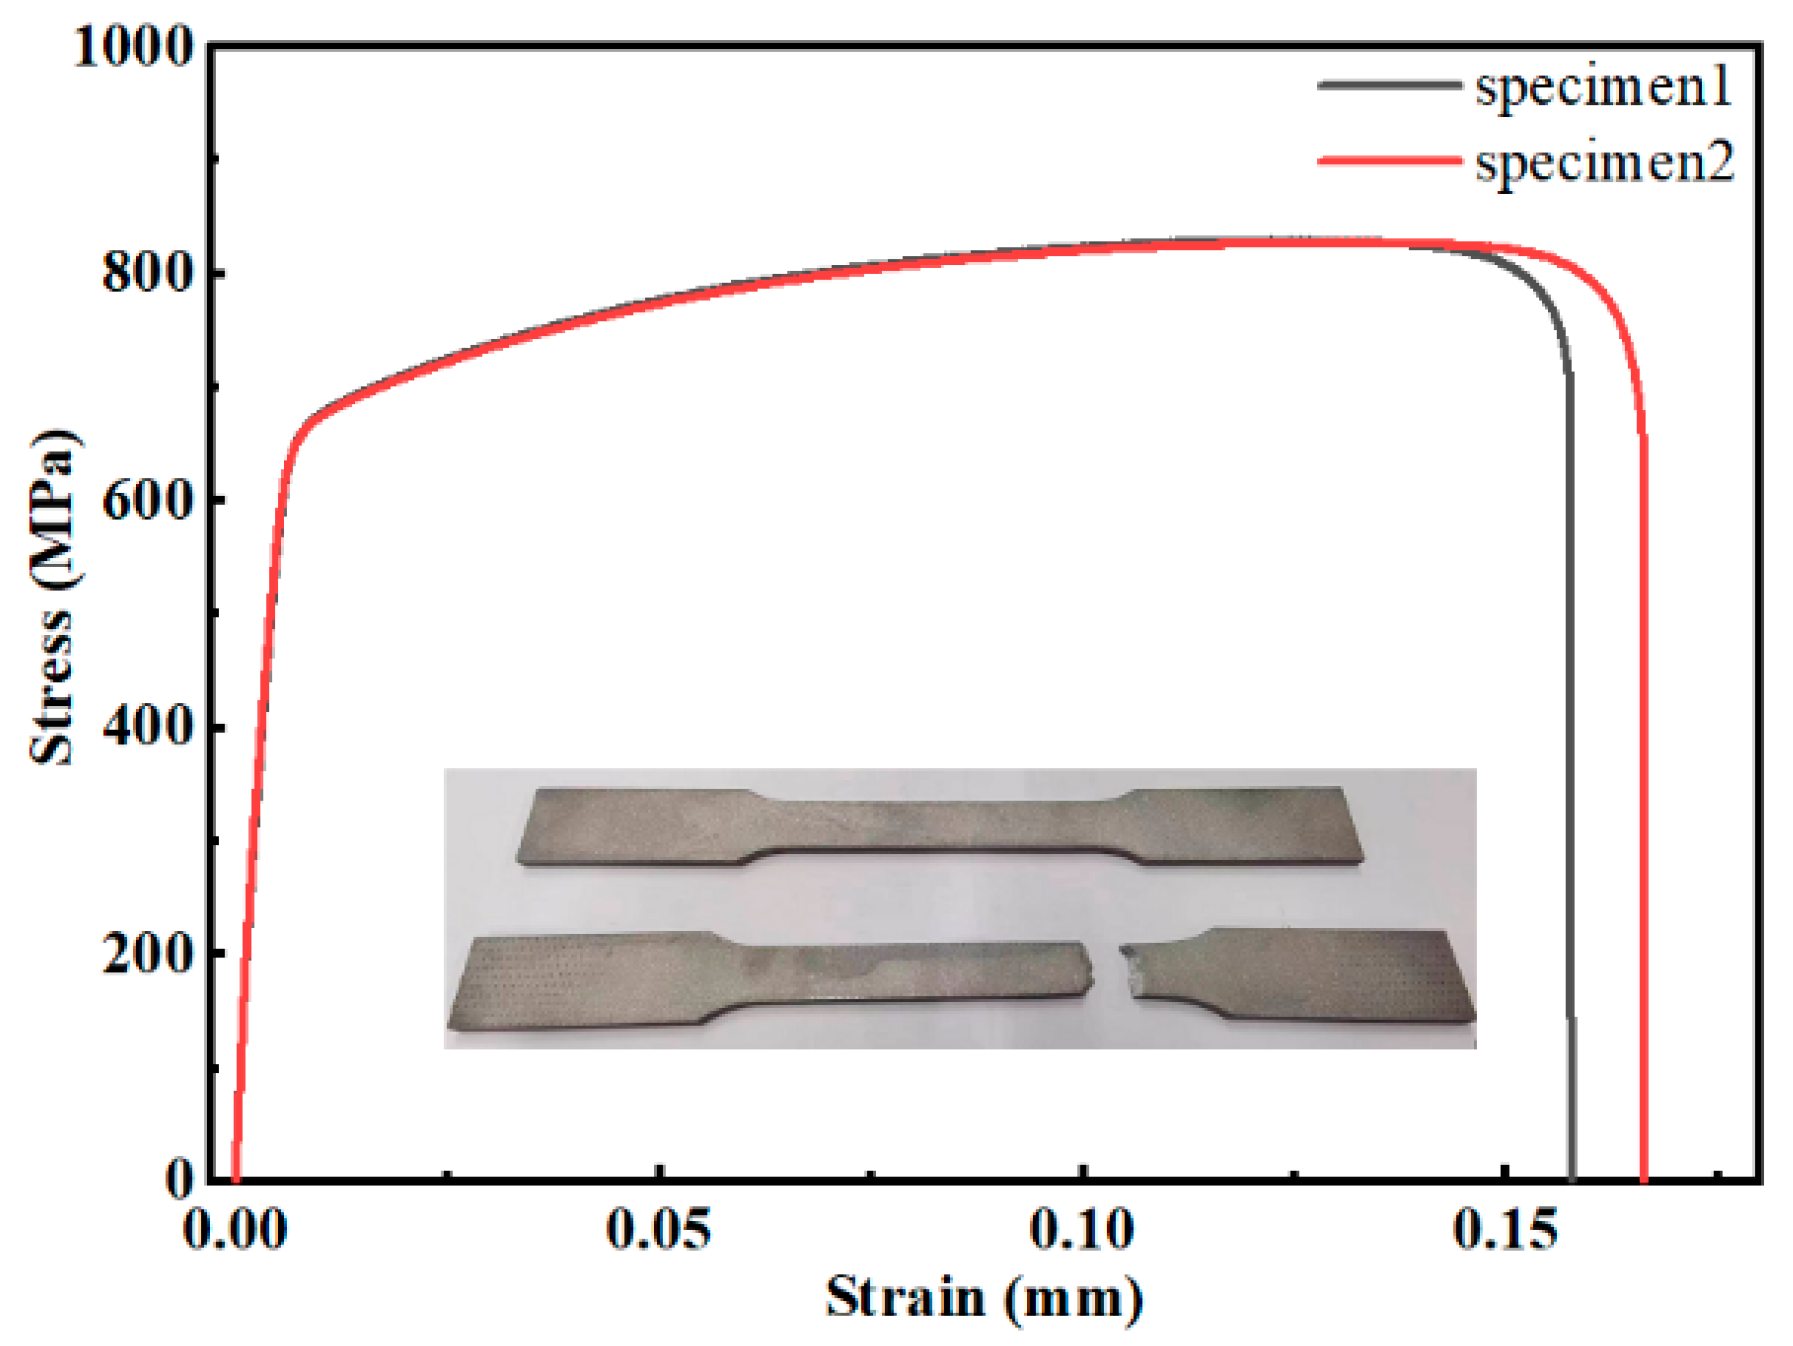
2. Materials and Methods
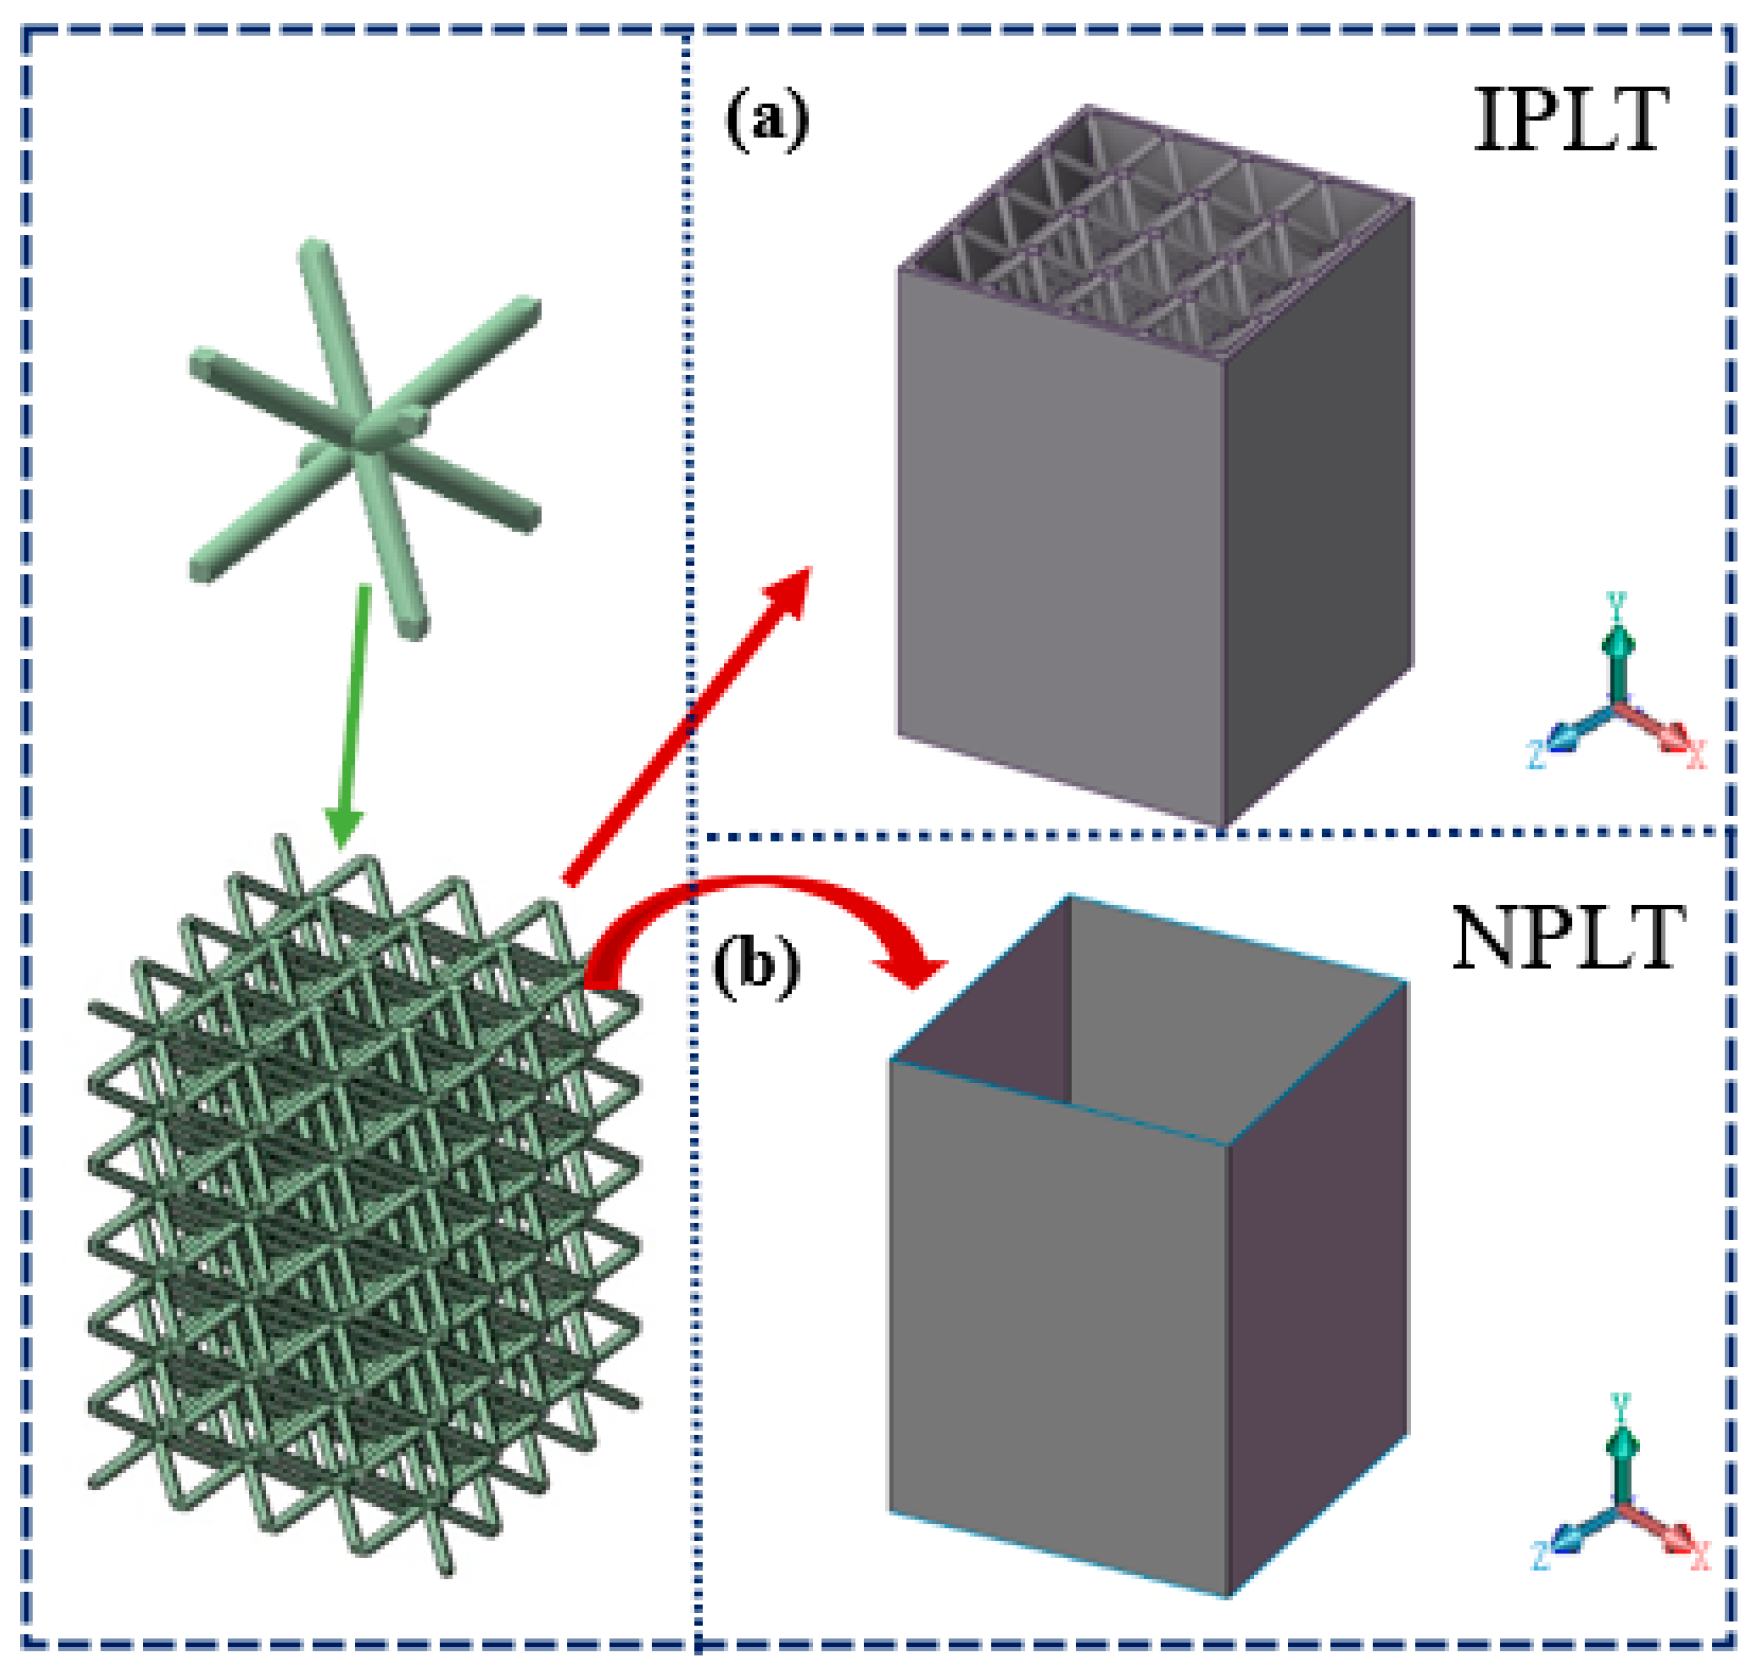
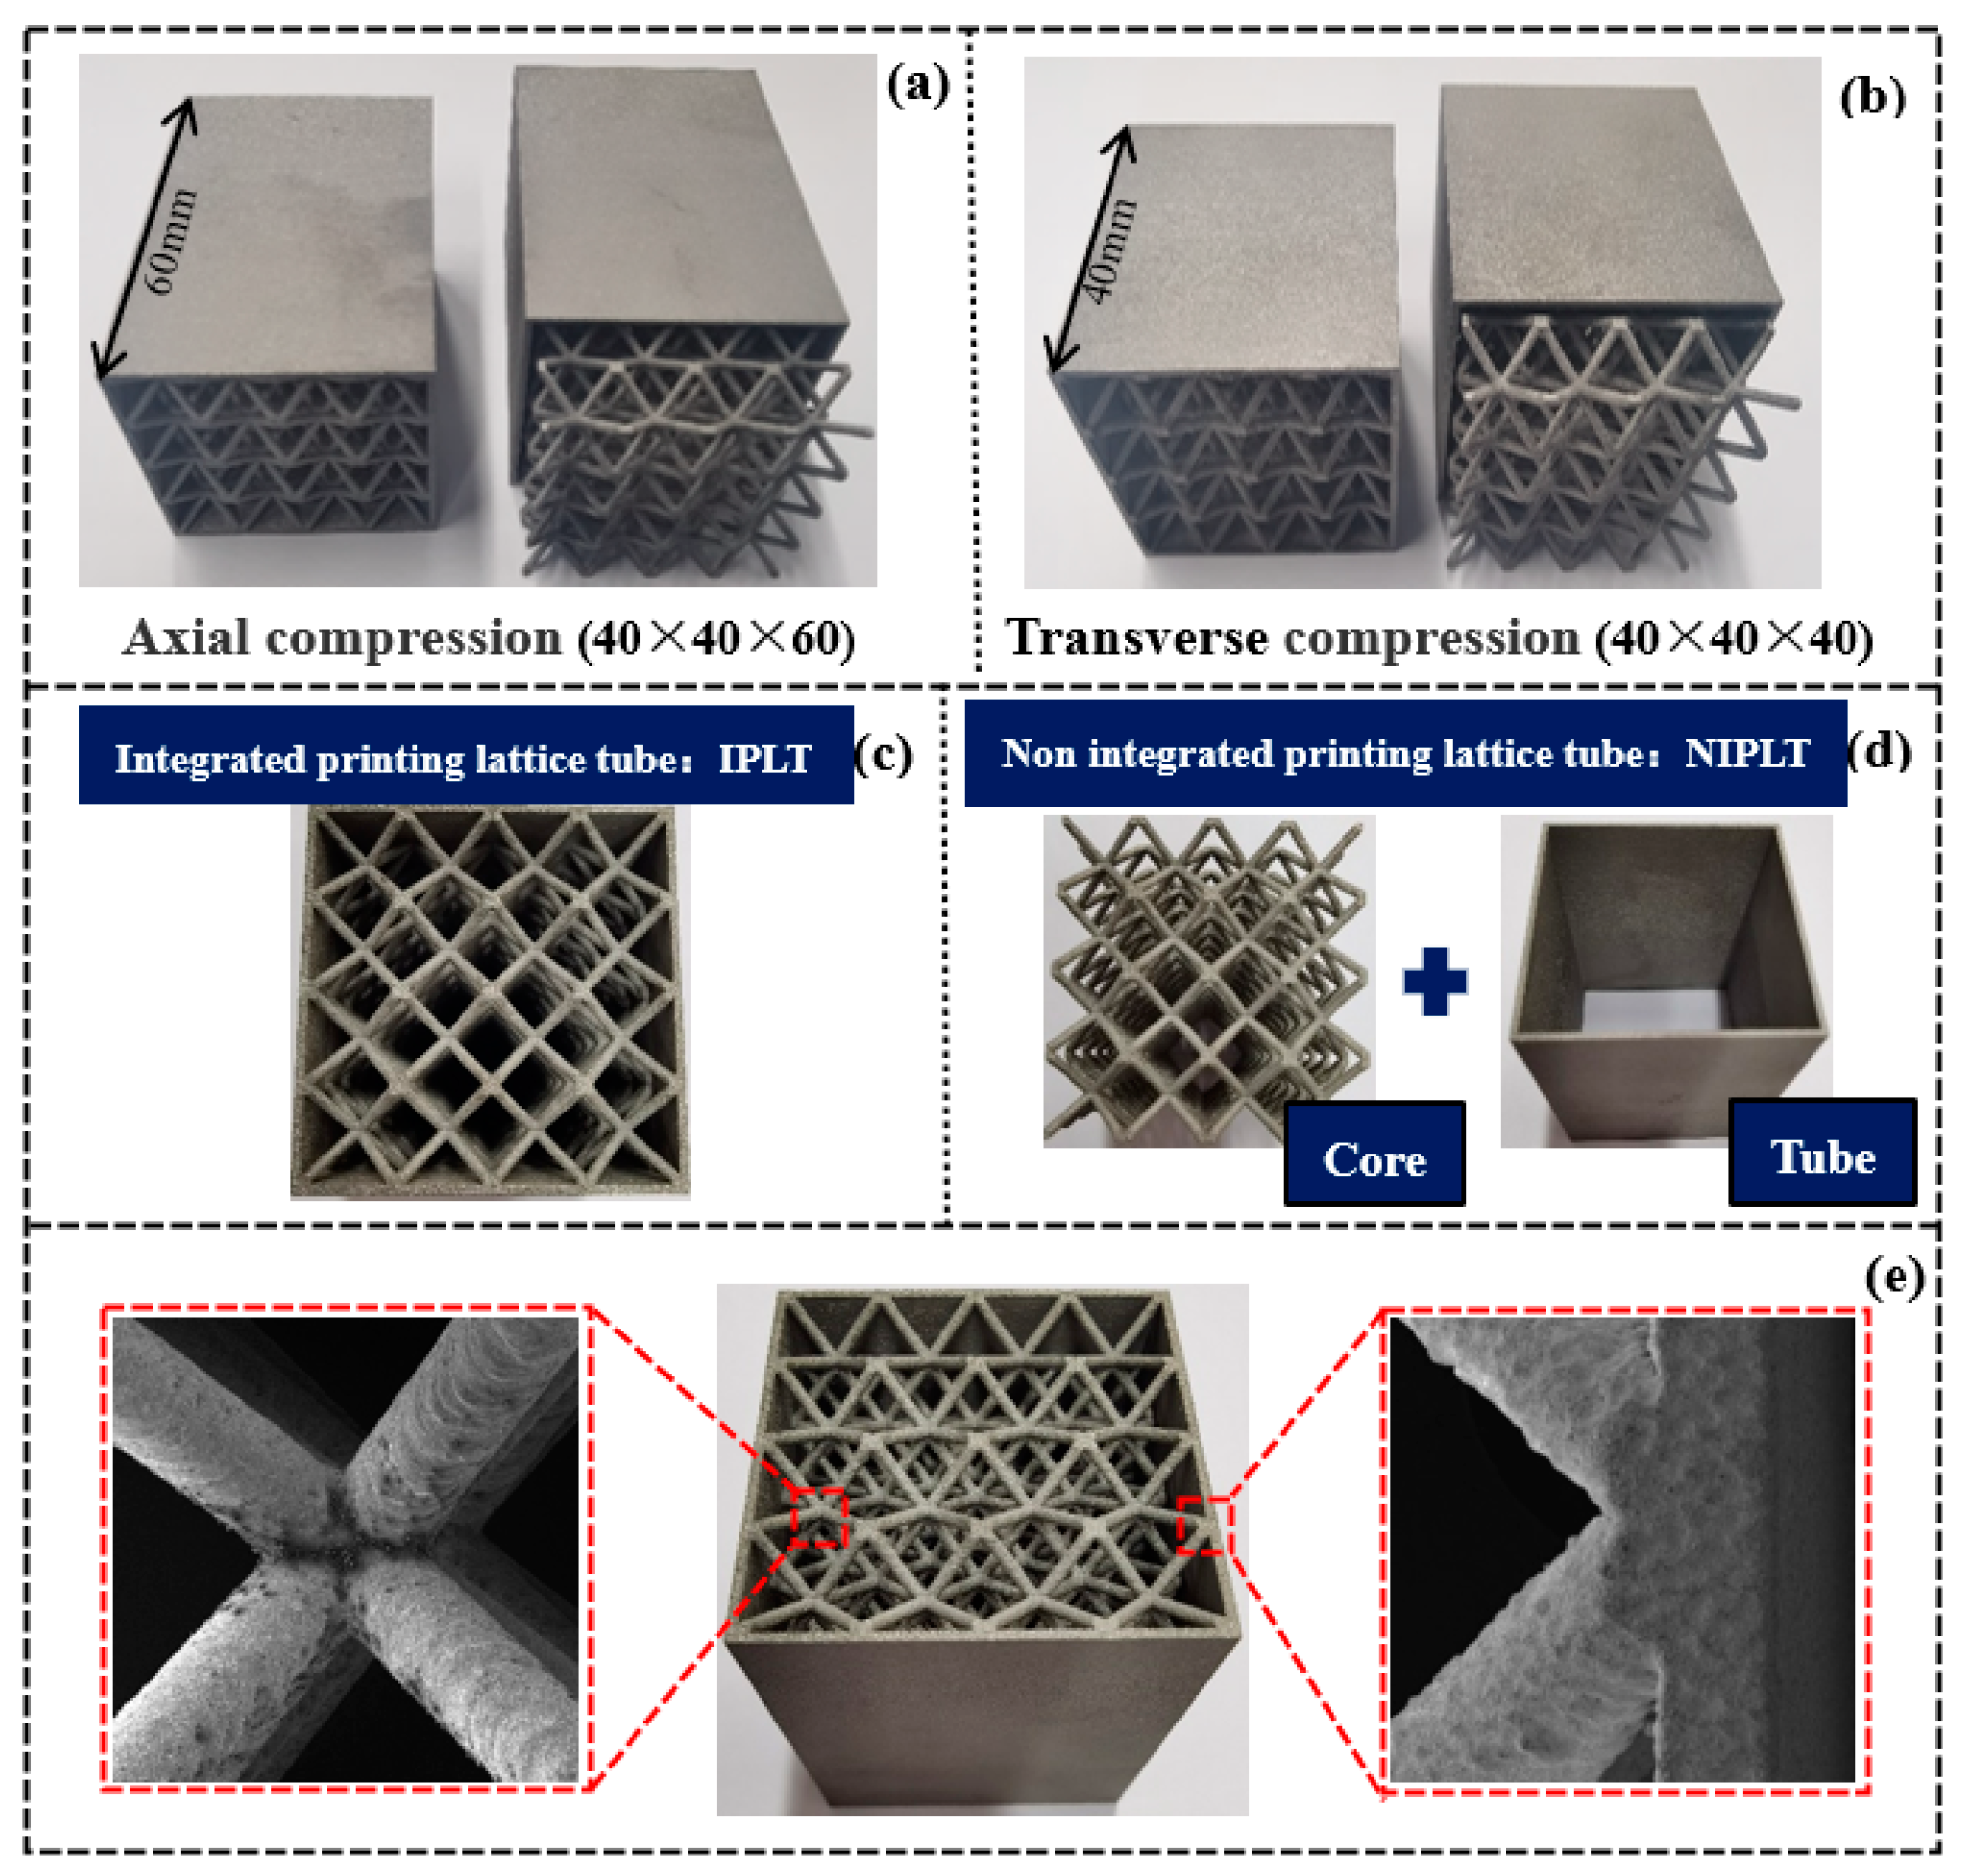
2.1. Geometric Description
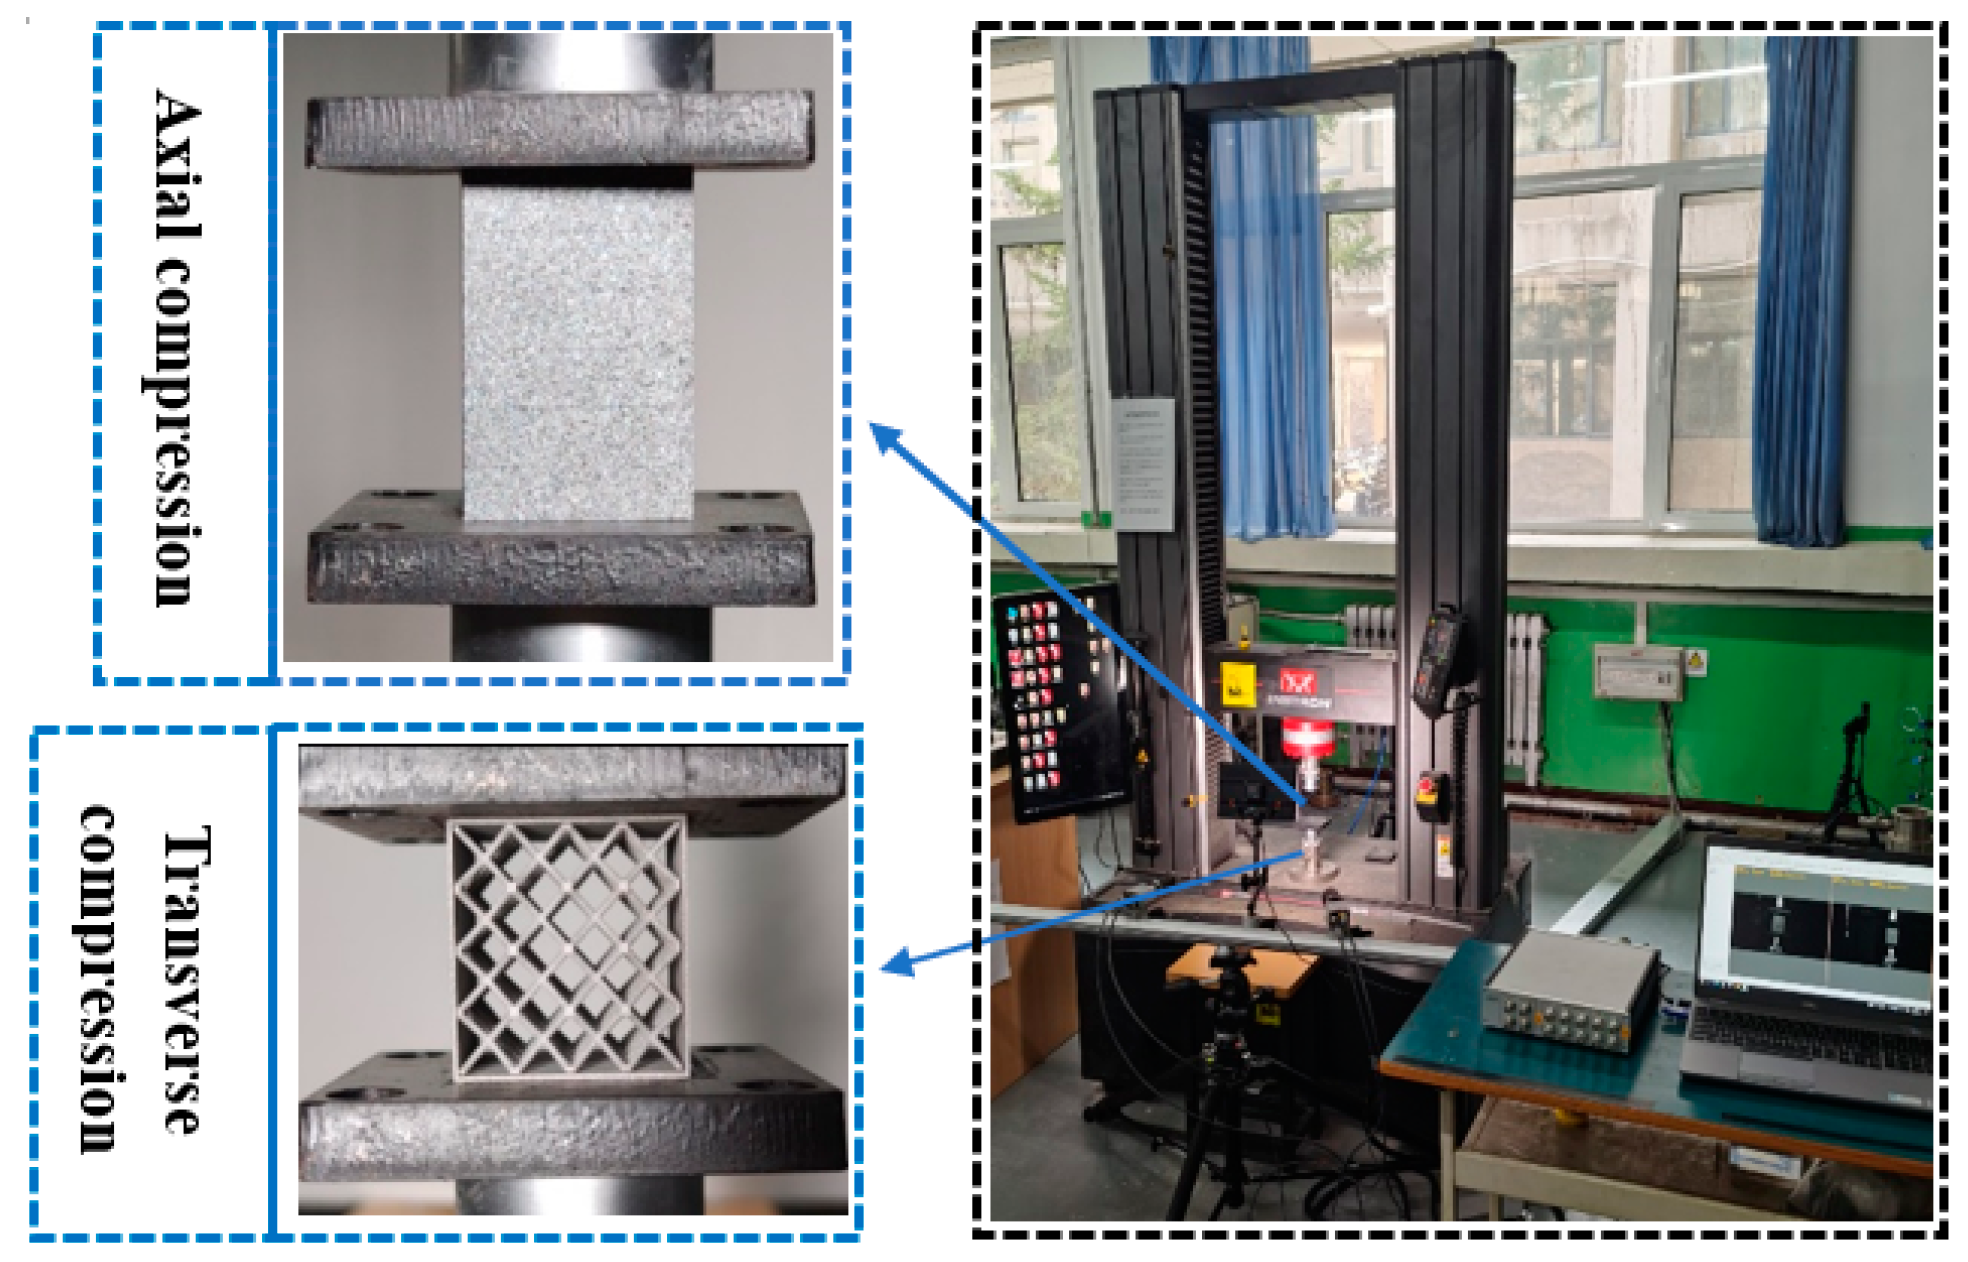
2.2. Experimental Setup
2.3. Crashworthiness Index
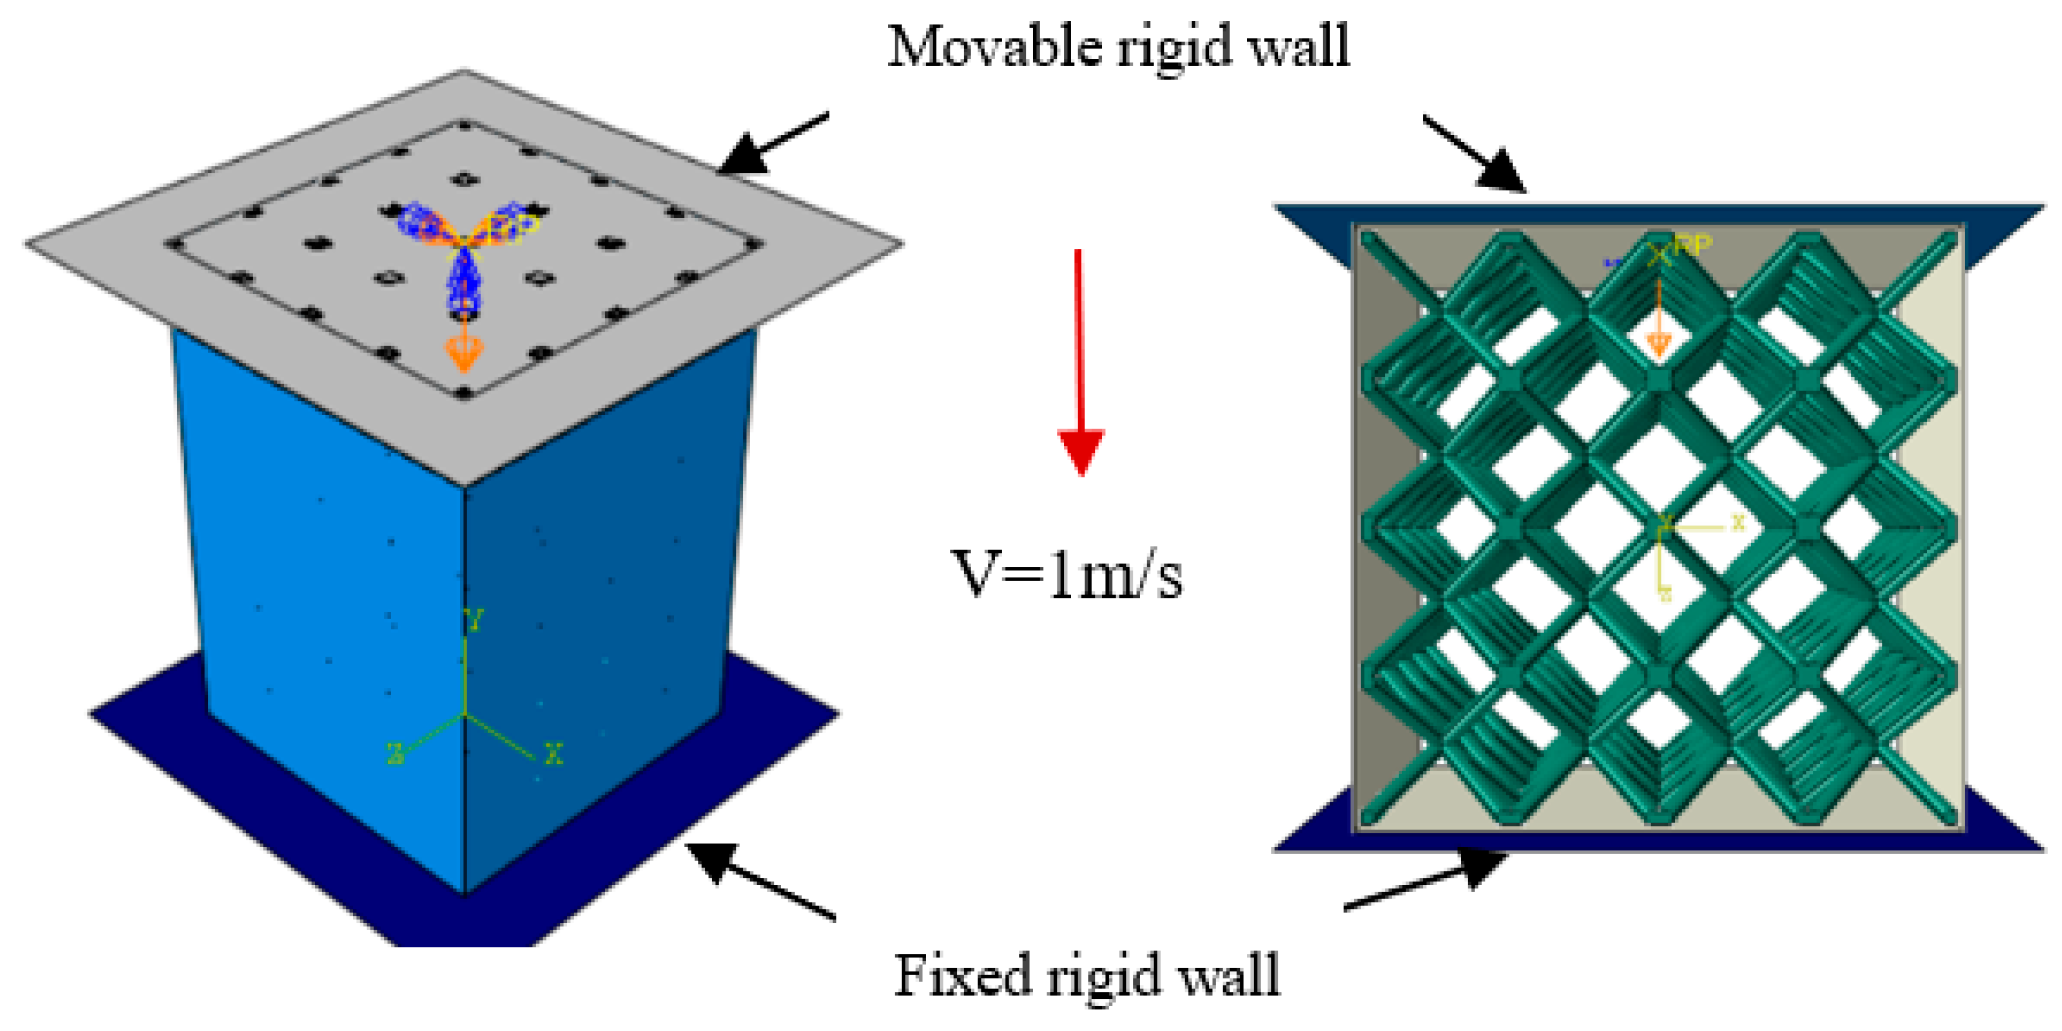
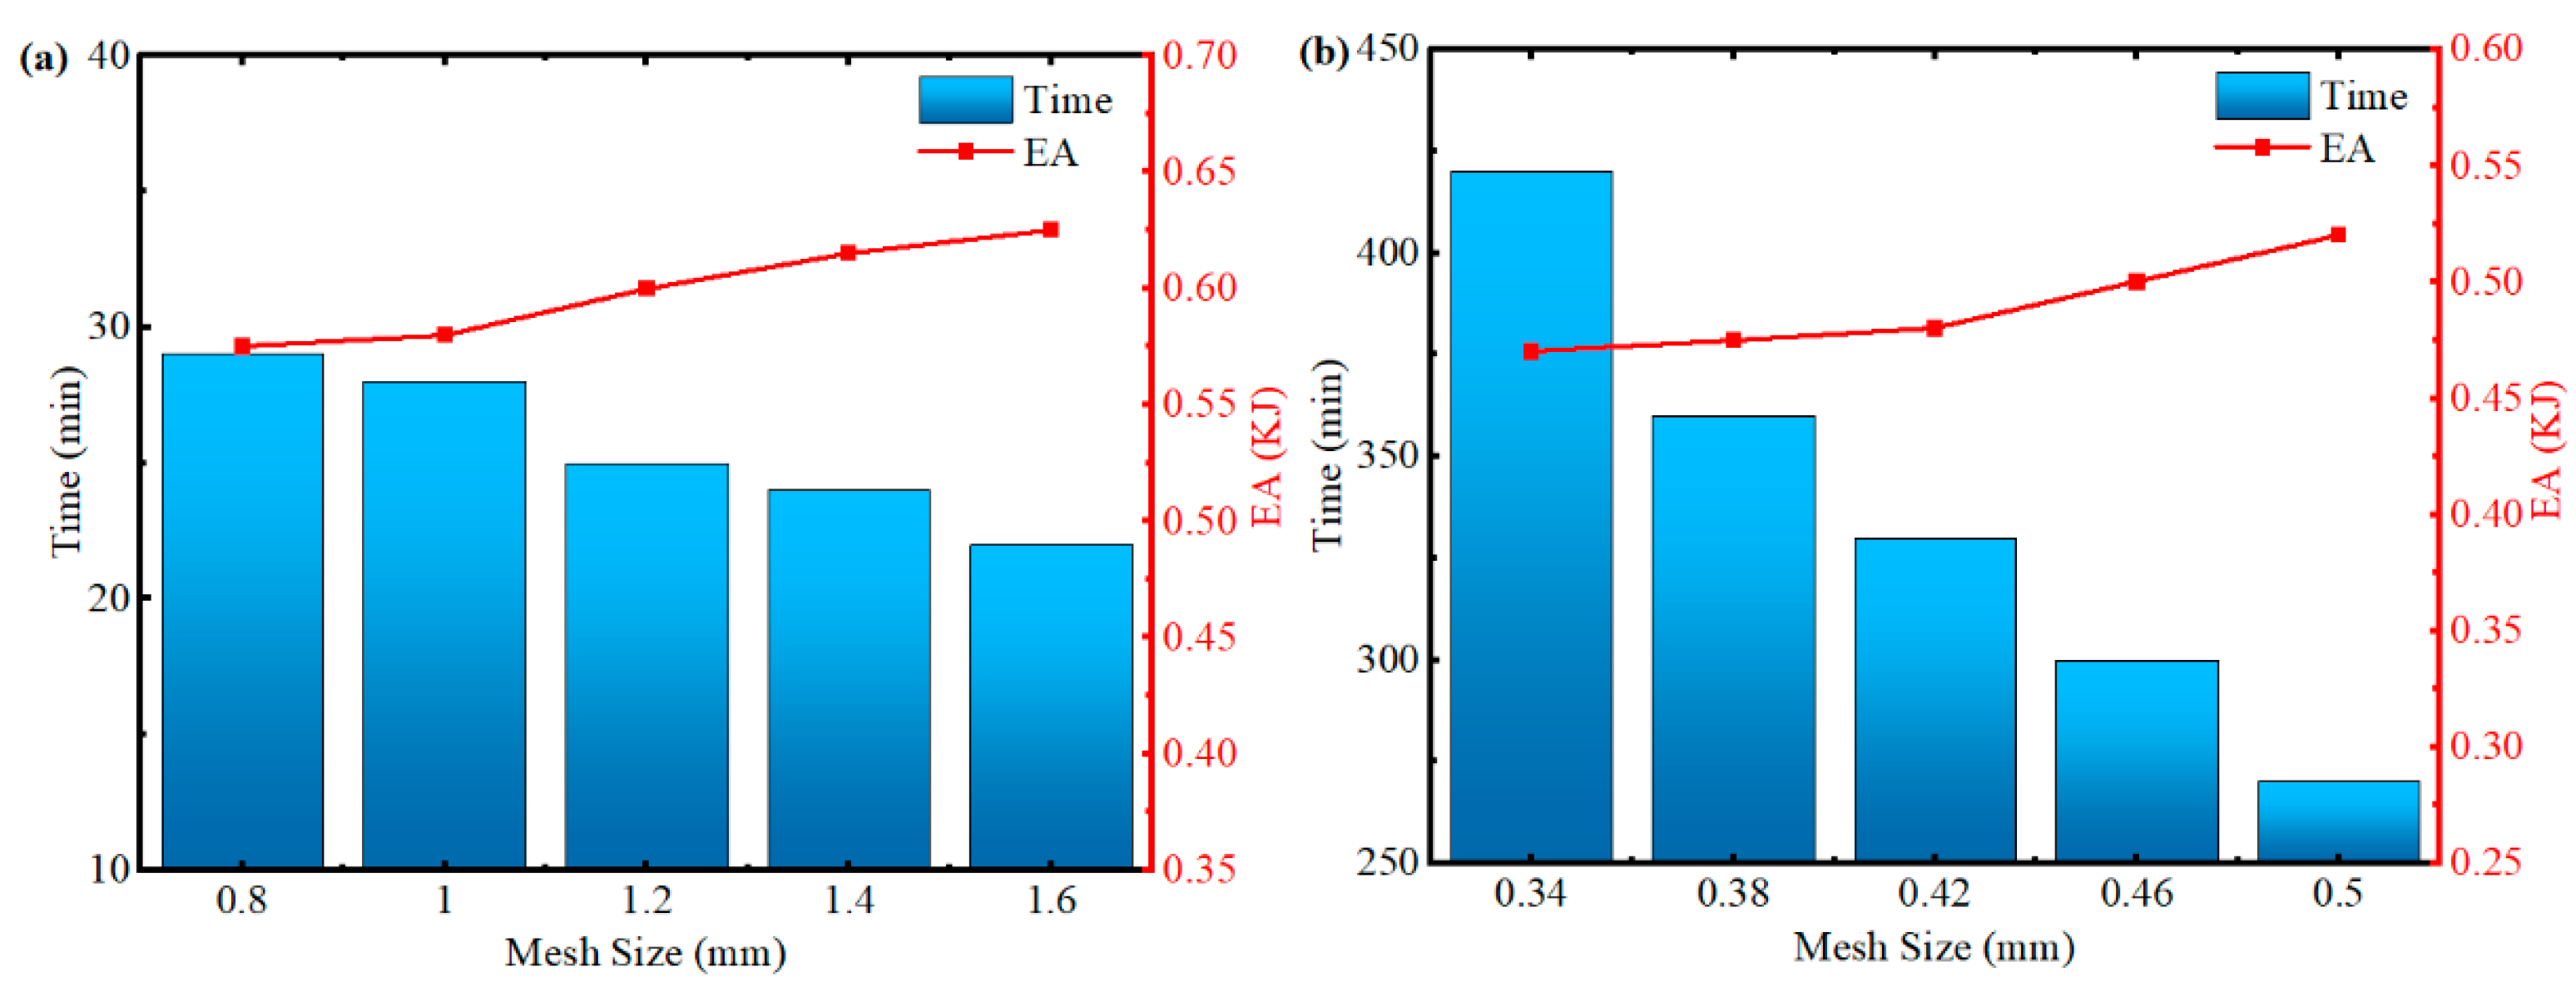
2.4. Finite Element Model
3. Results
3.1. Axial Compression
3.2. Transverse Compression
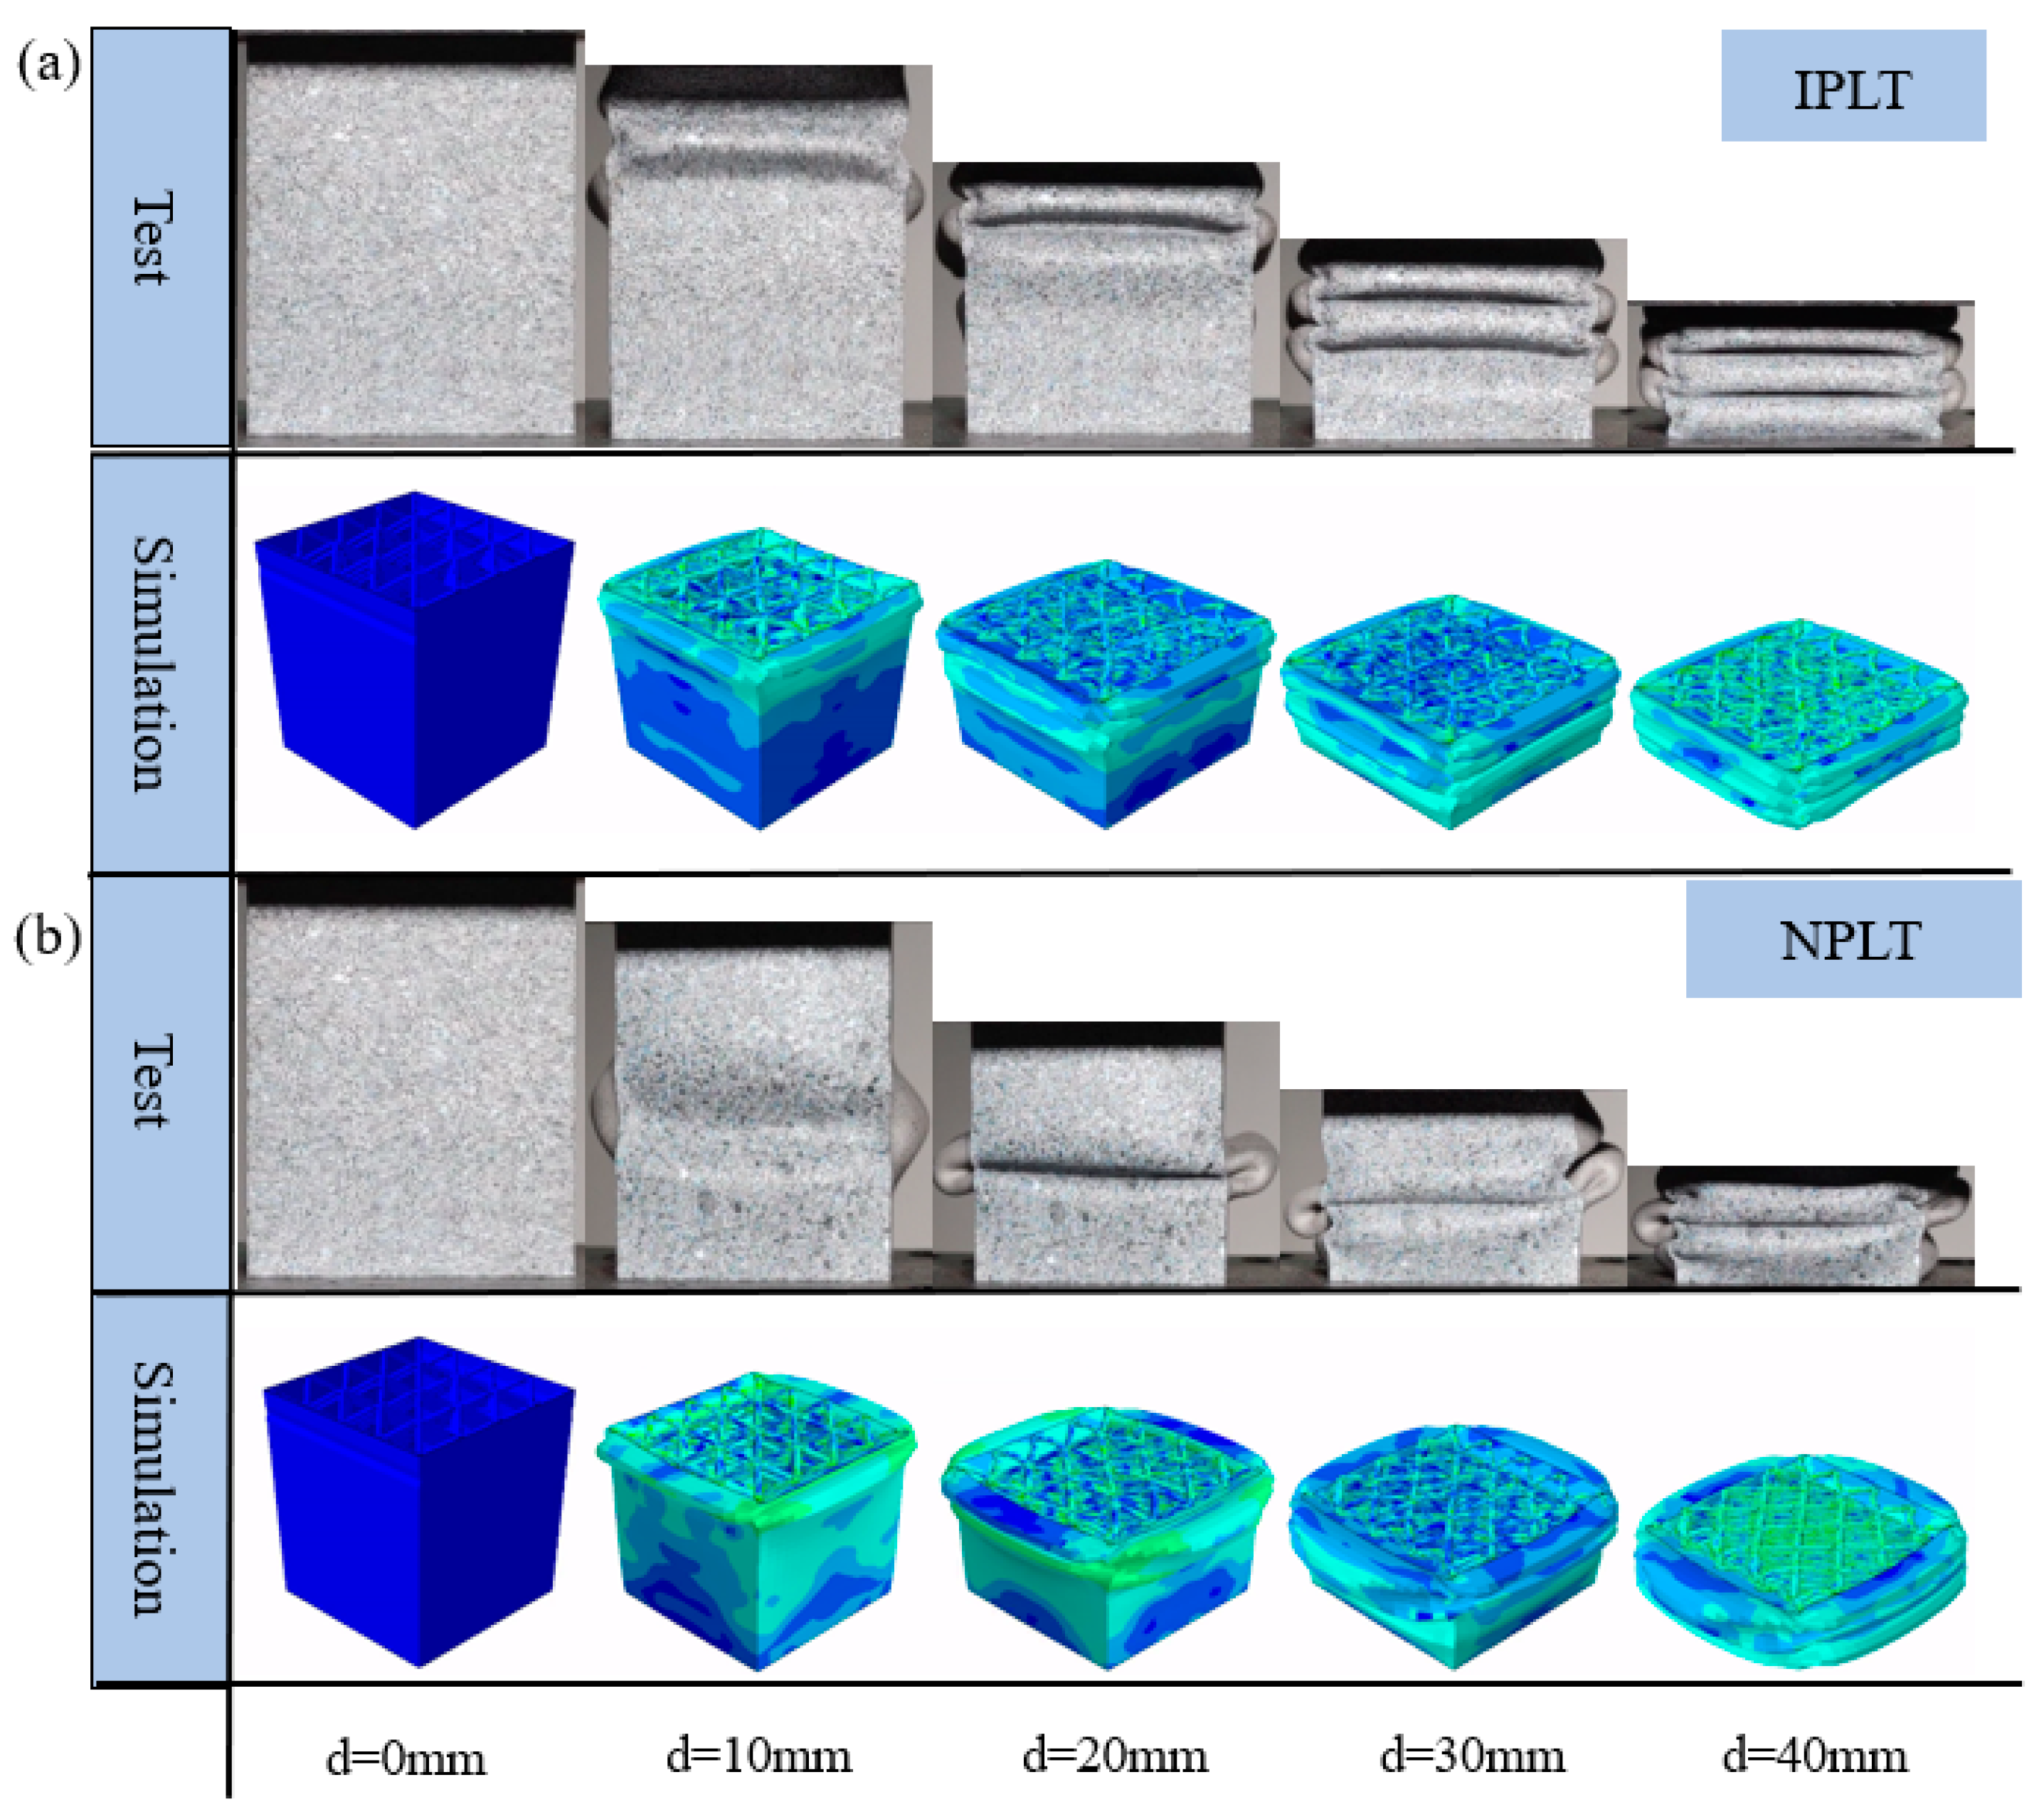
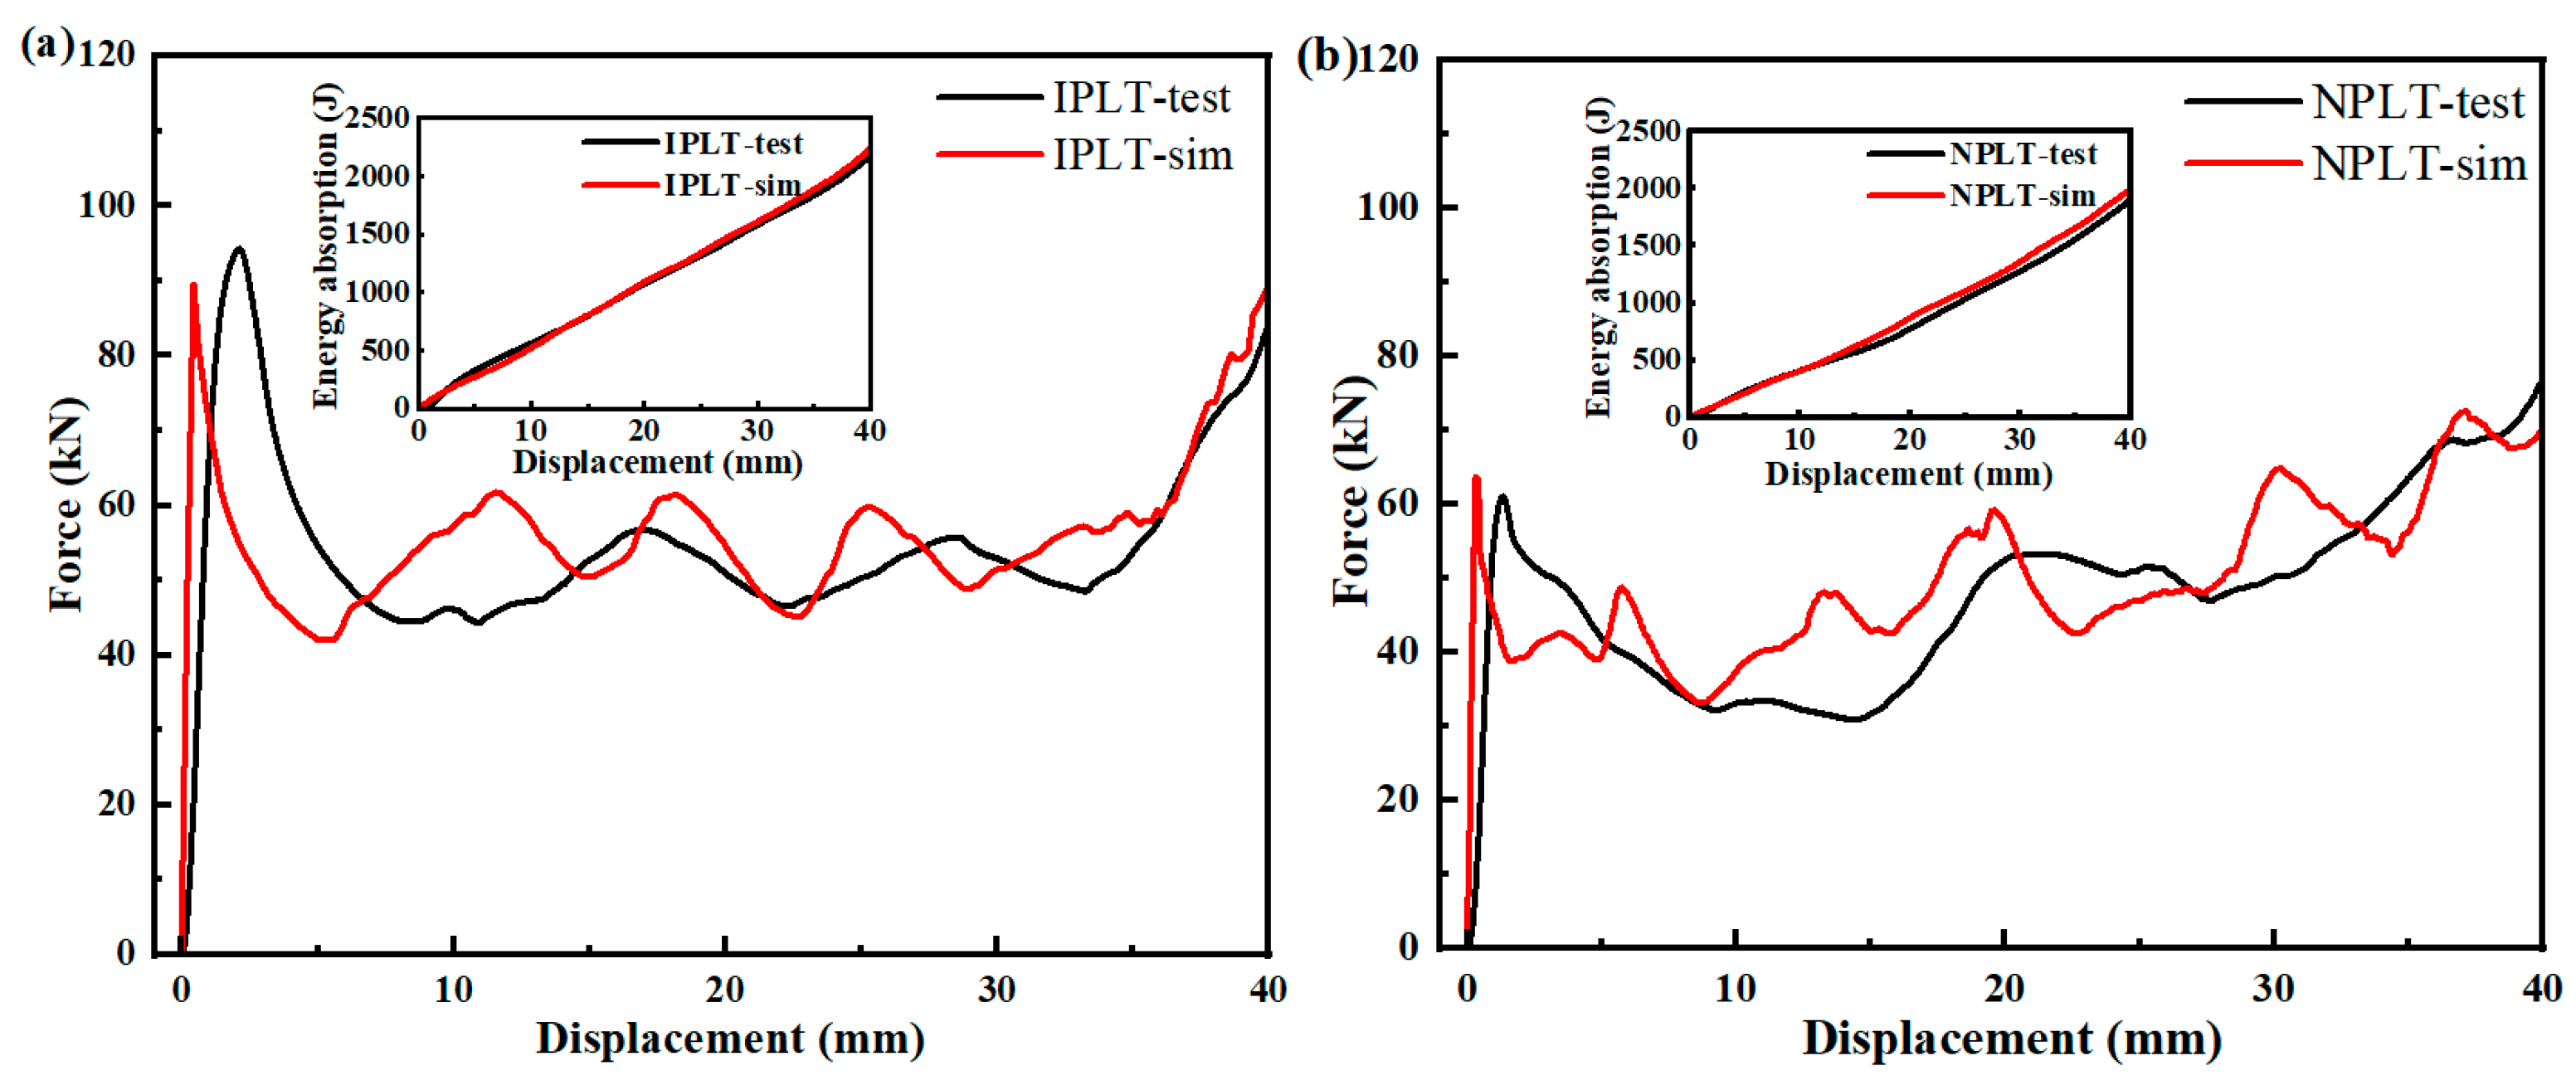
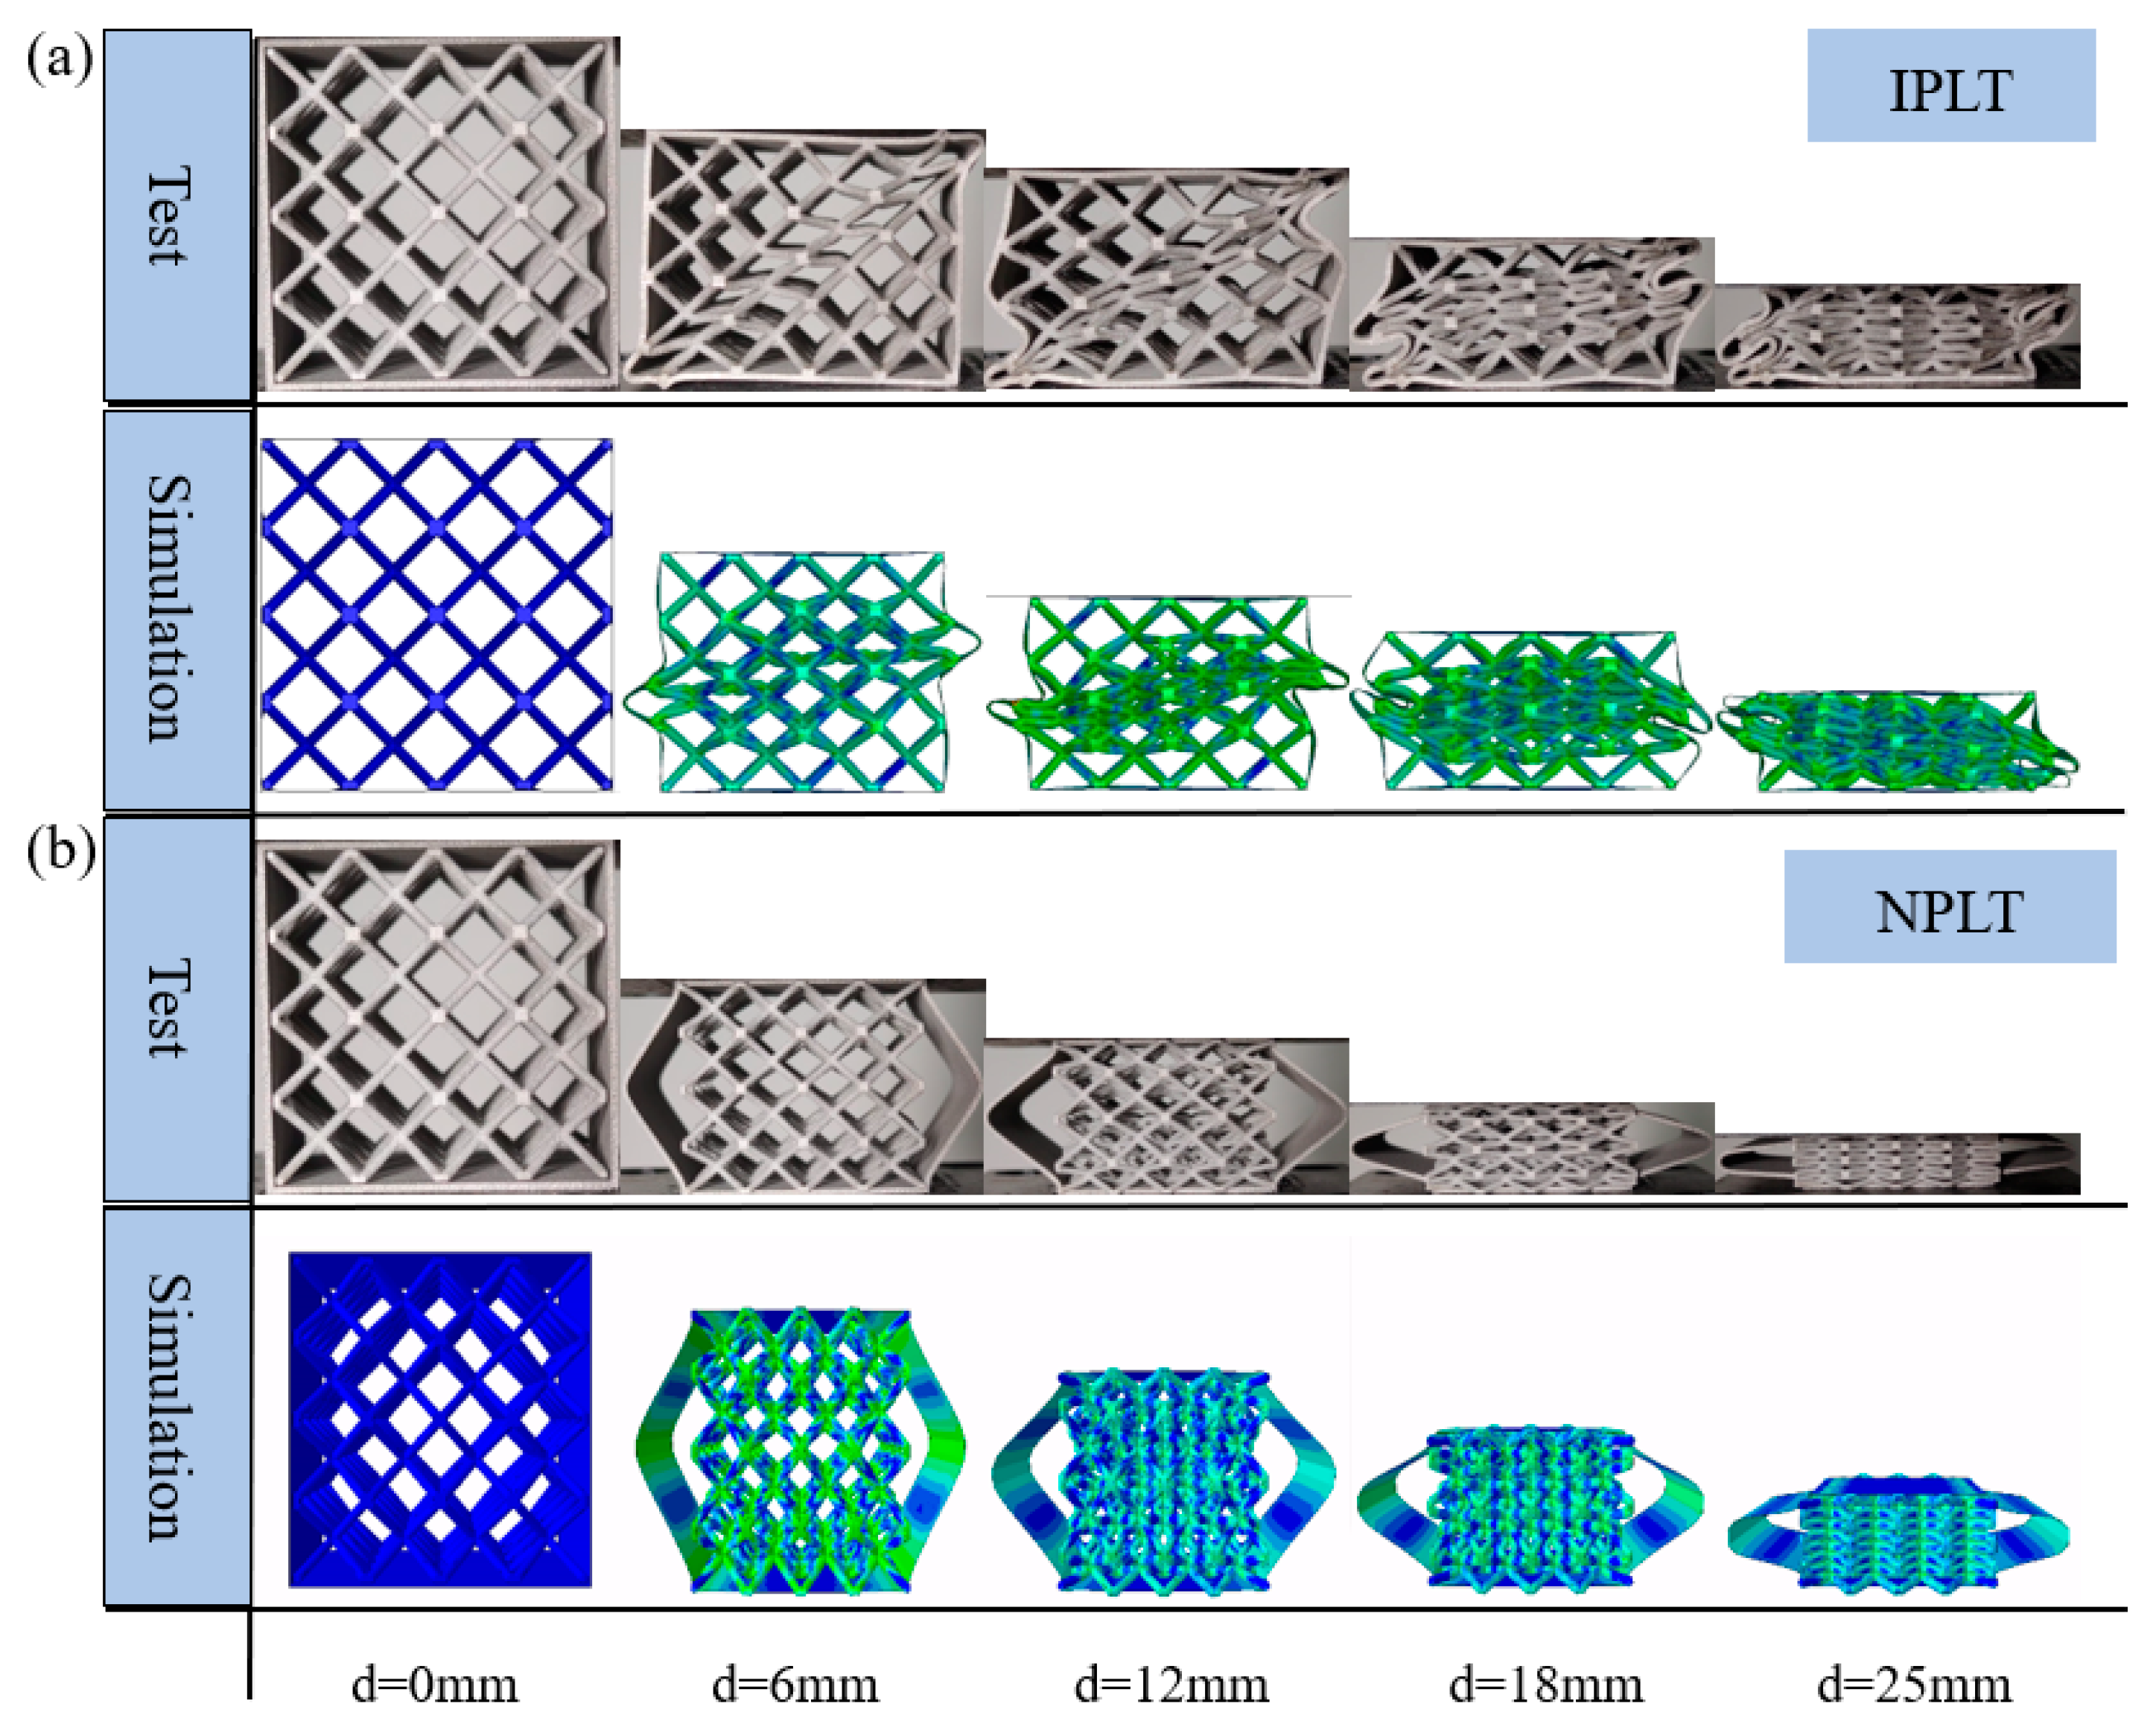
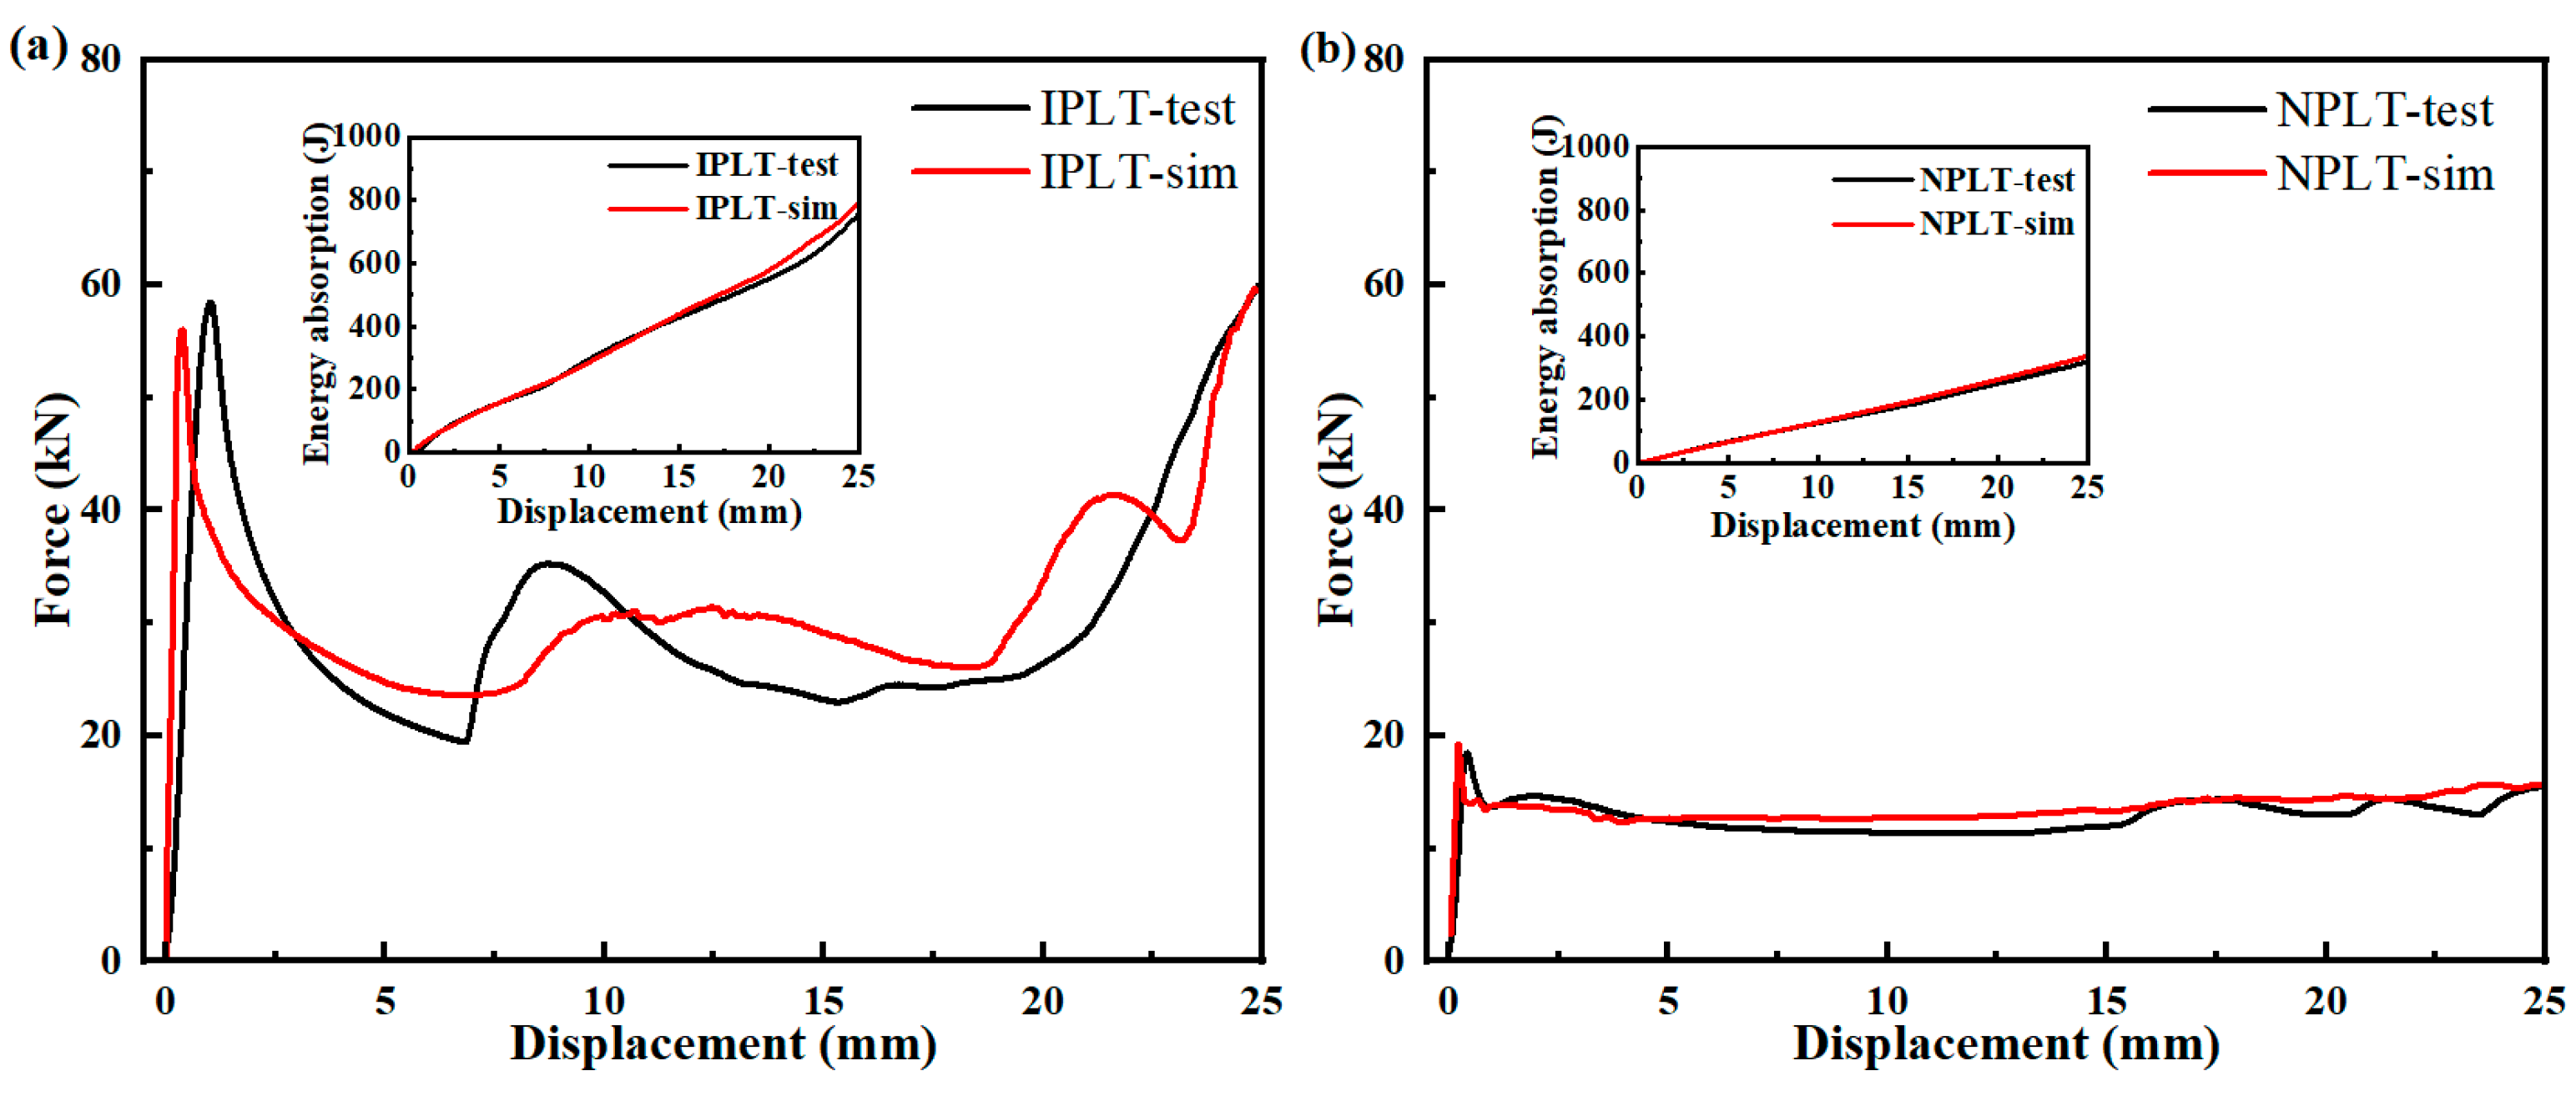
3.3. Finite Element Model Validation
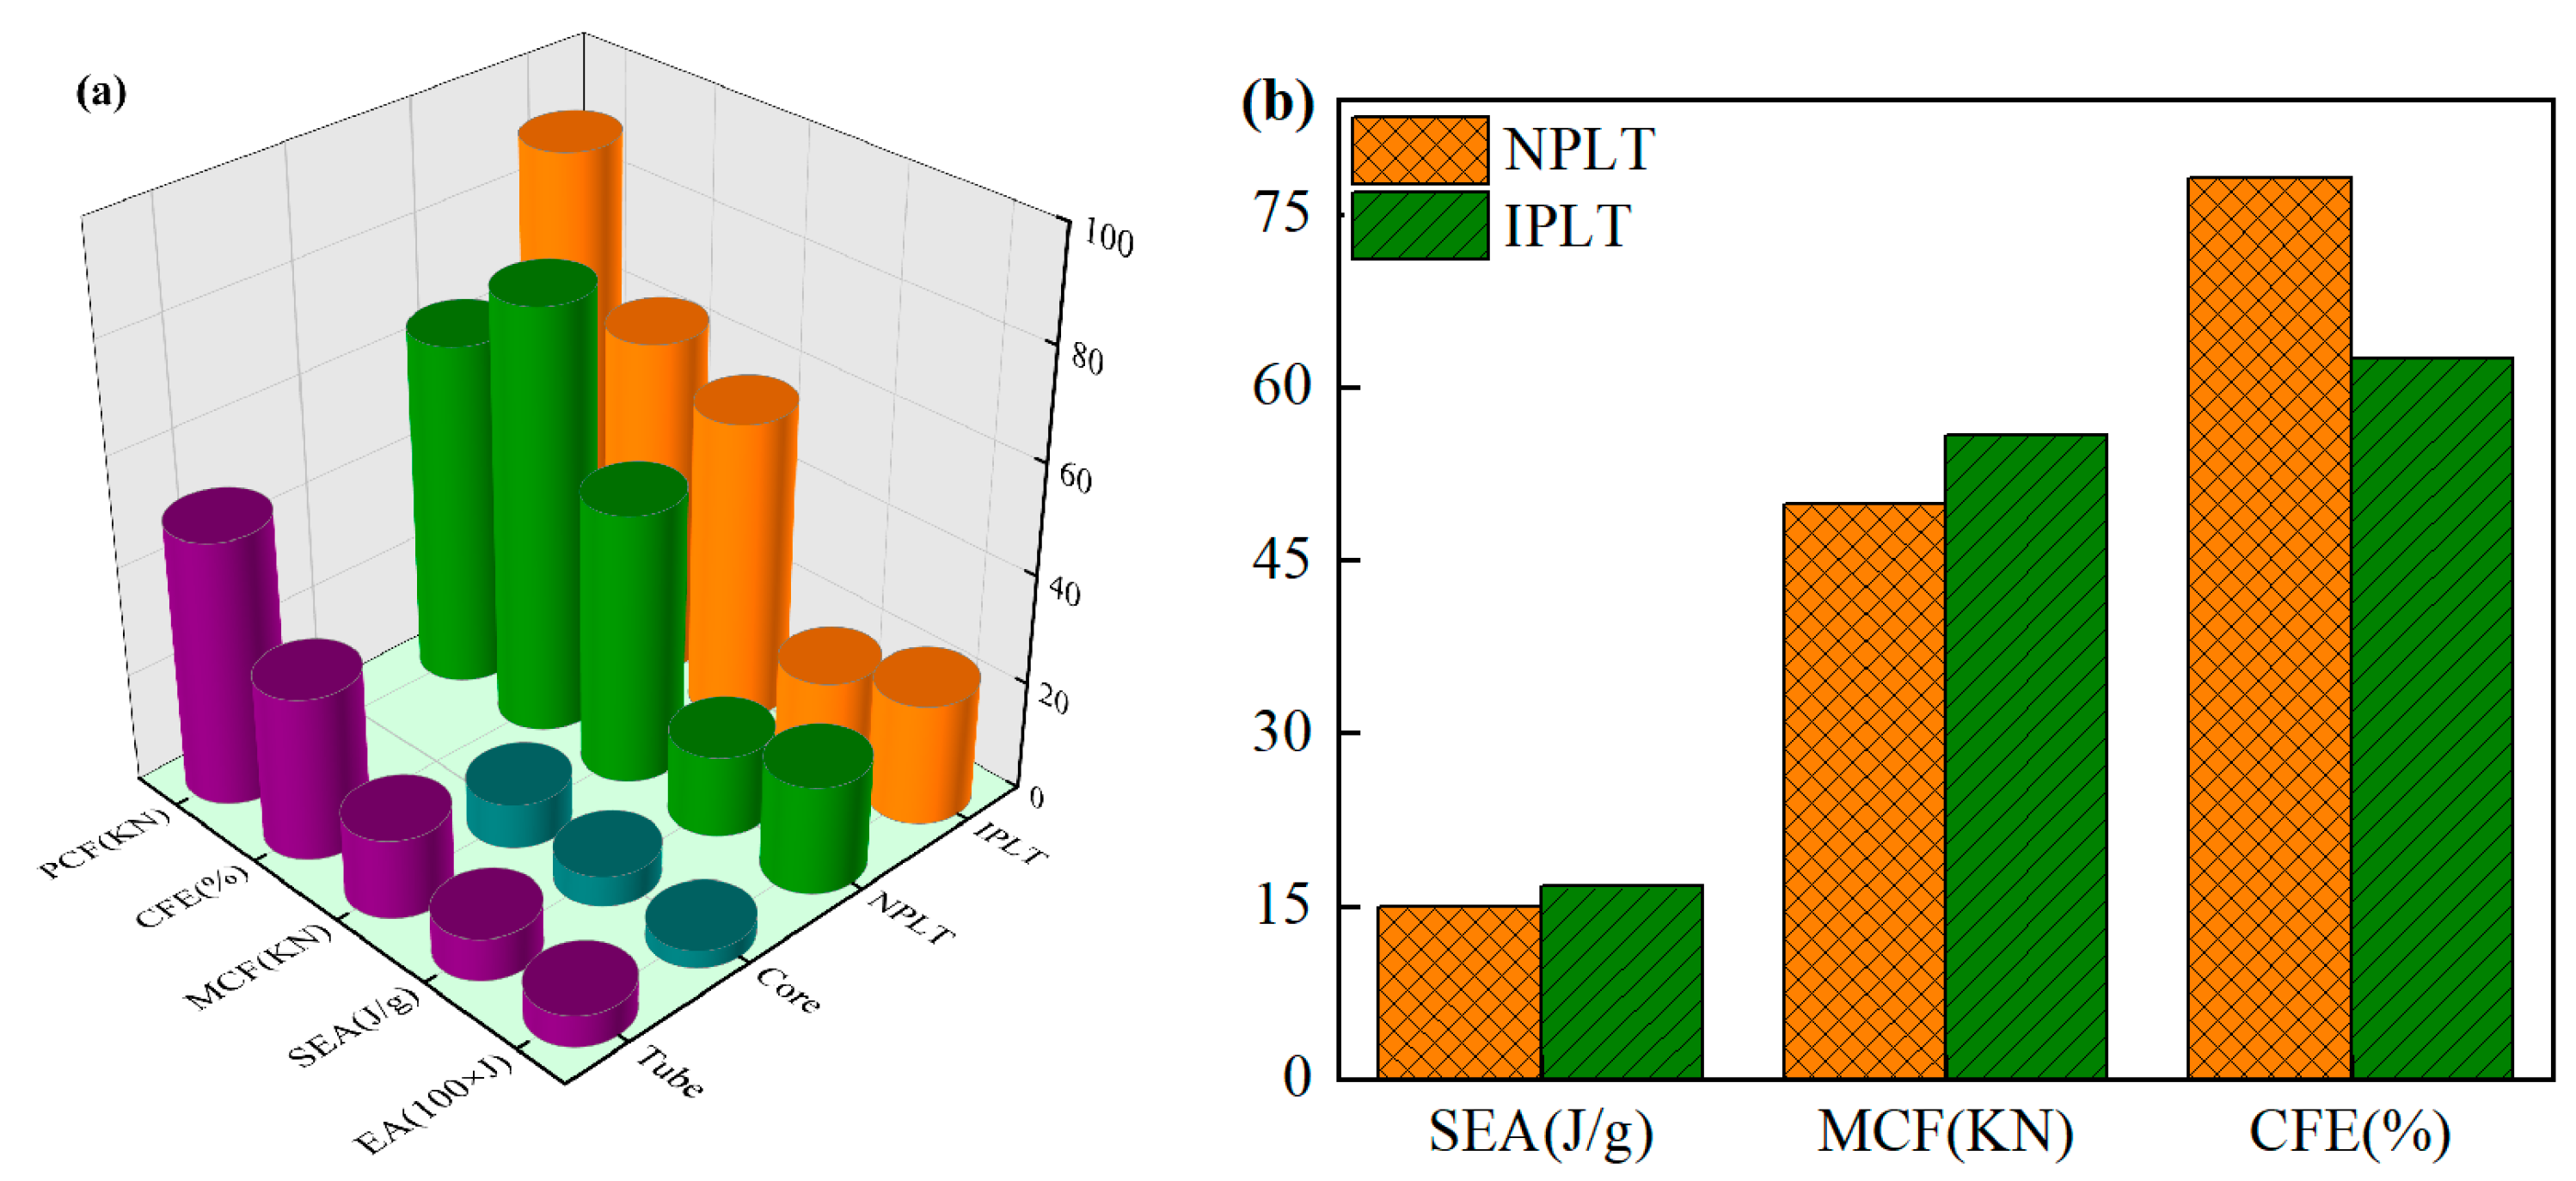
3.4. Crashworthiness Index Analysis
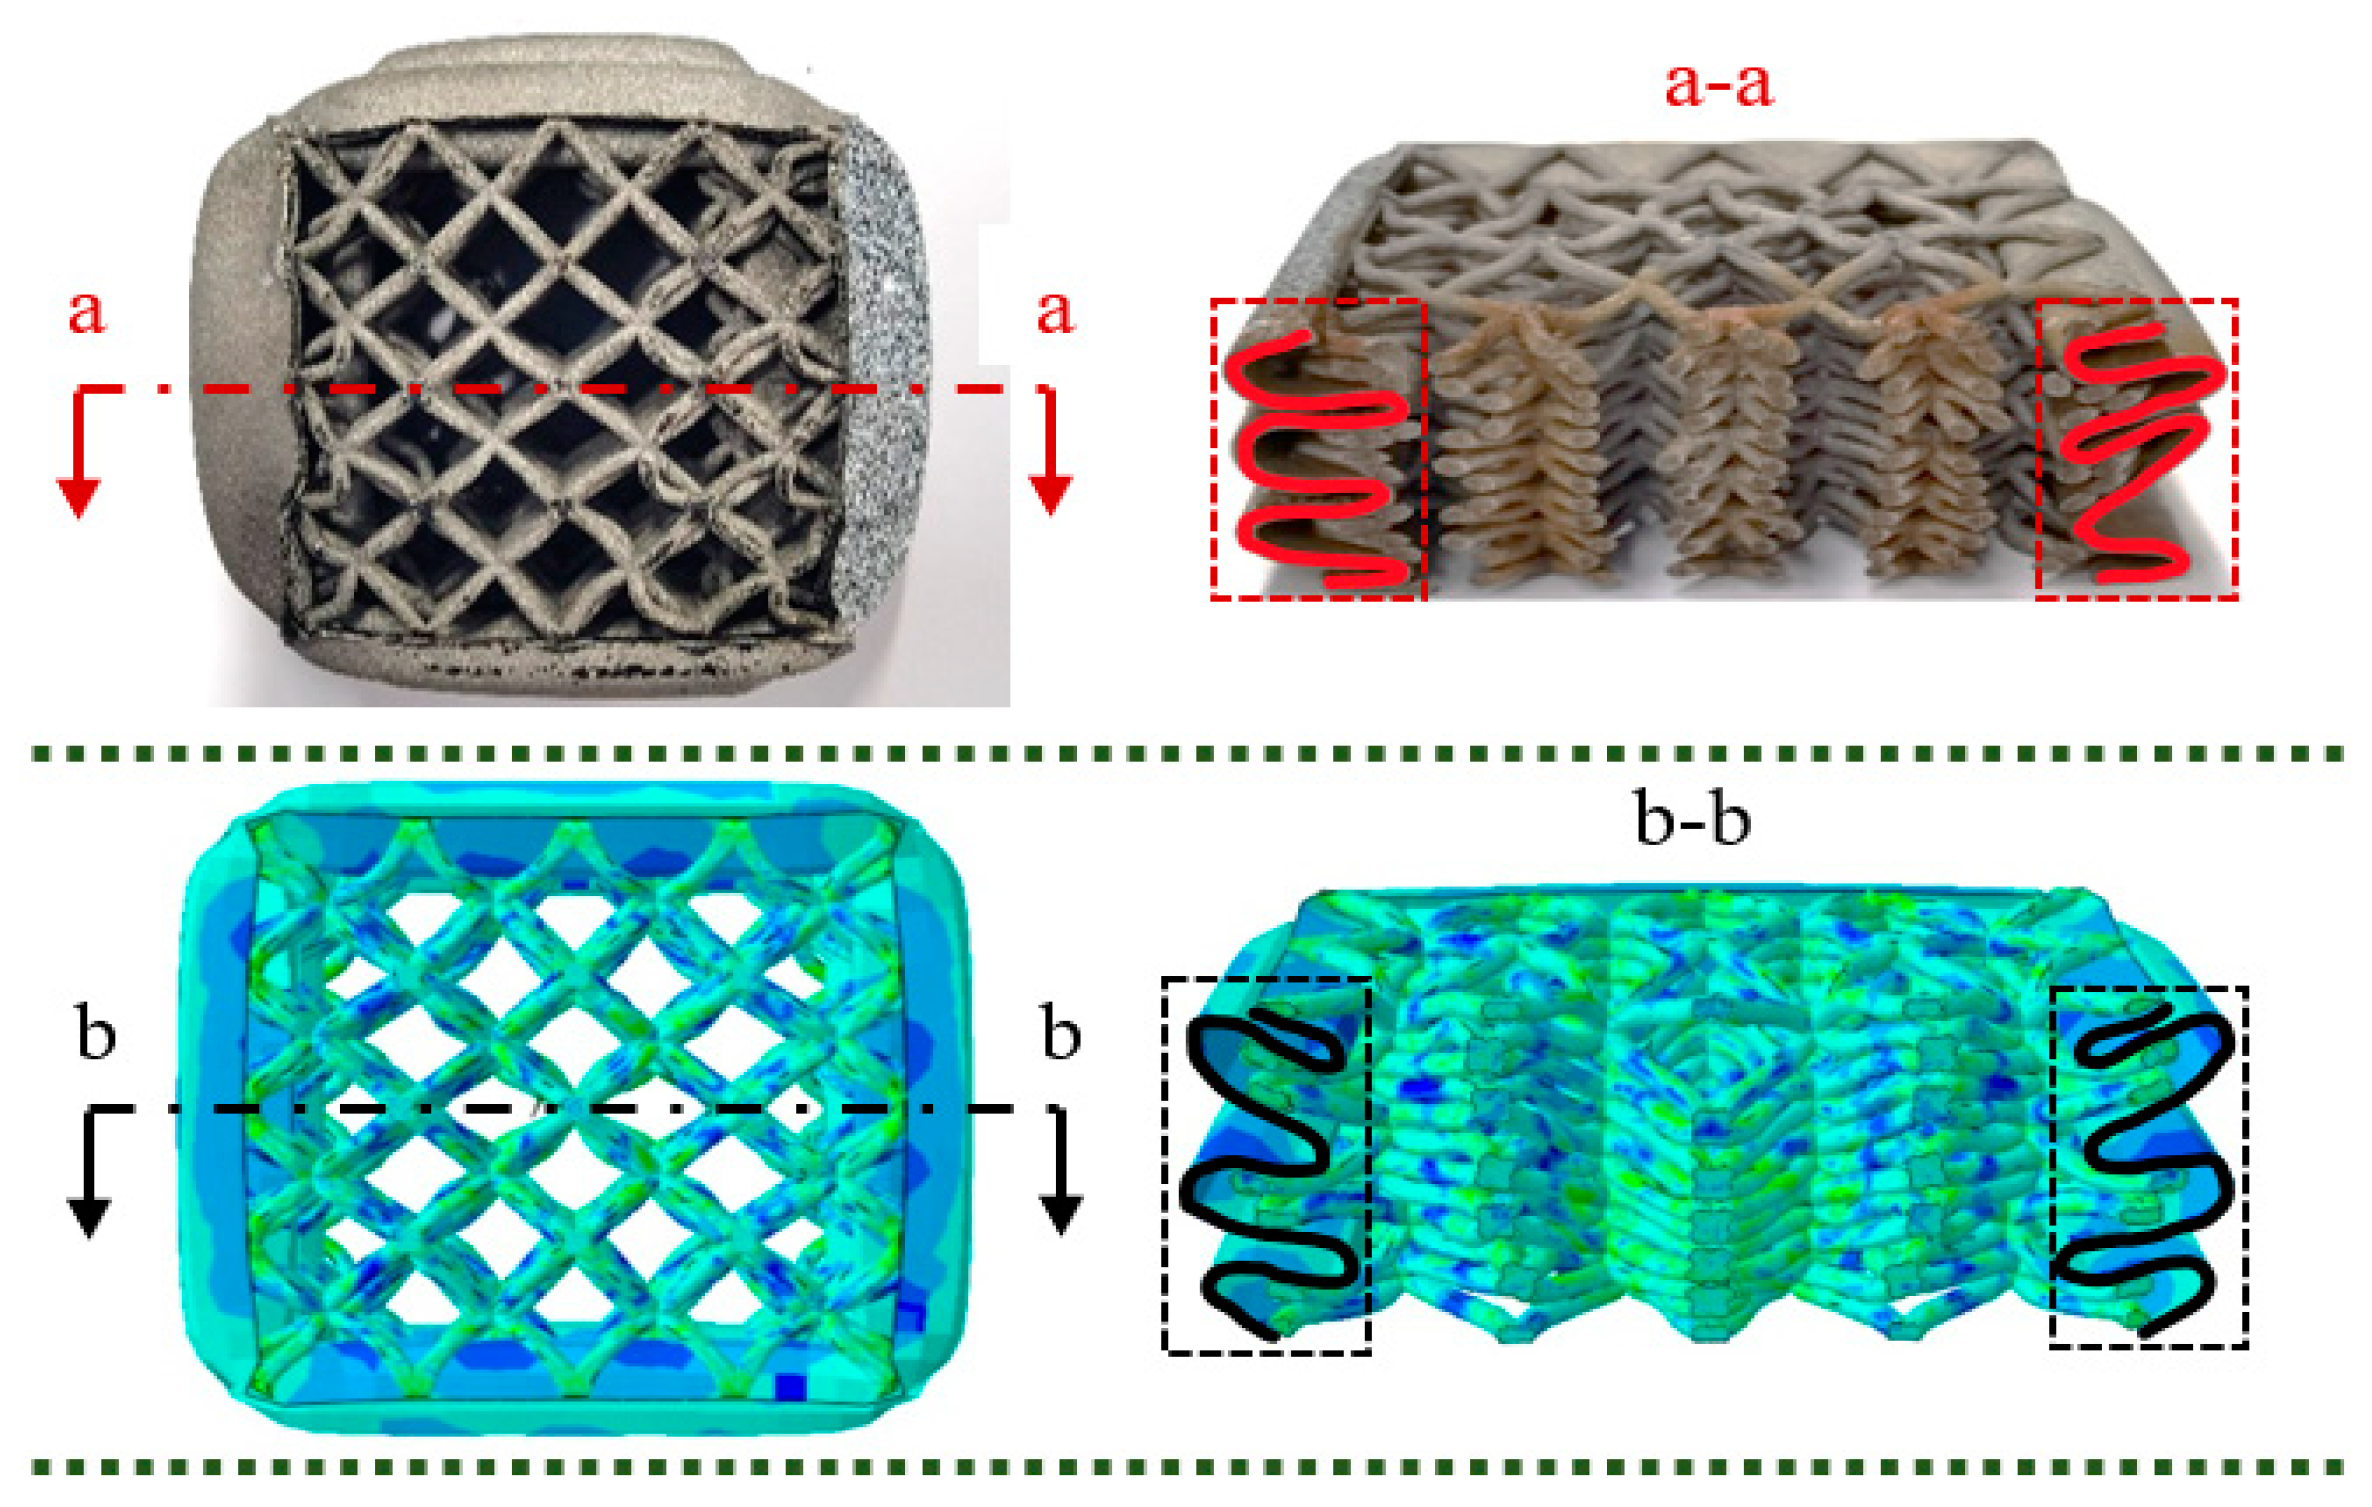
3.5. Mechanism of Coupling Action
3.5.1. Interaction of Lattice with Thin−Walled Tubes
3.5.2. Deformation Mechanism
4. Parameter Analysis
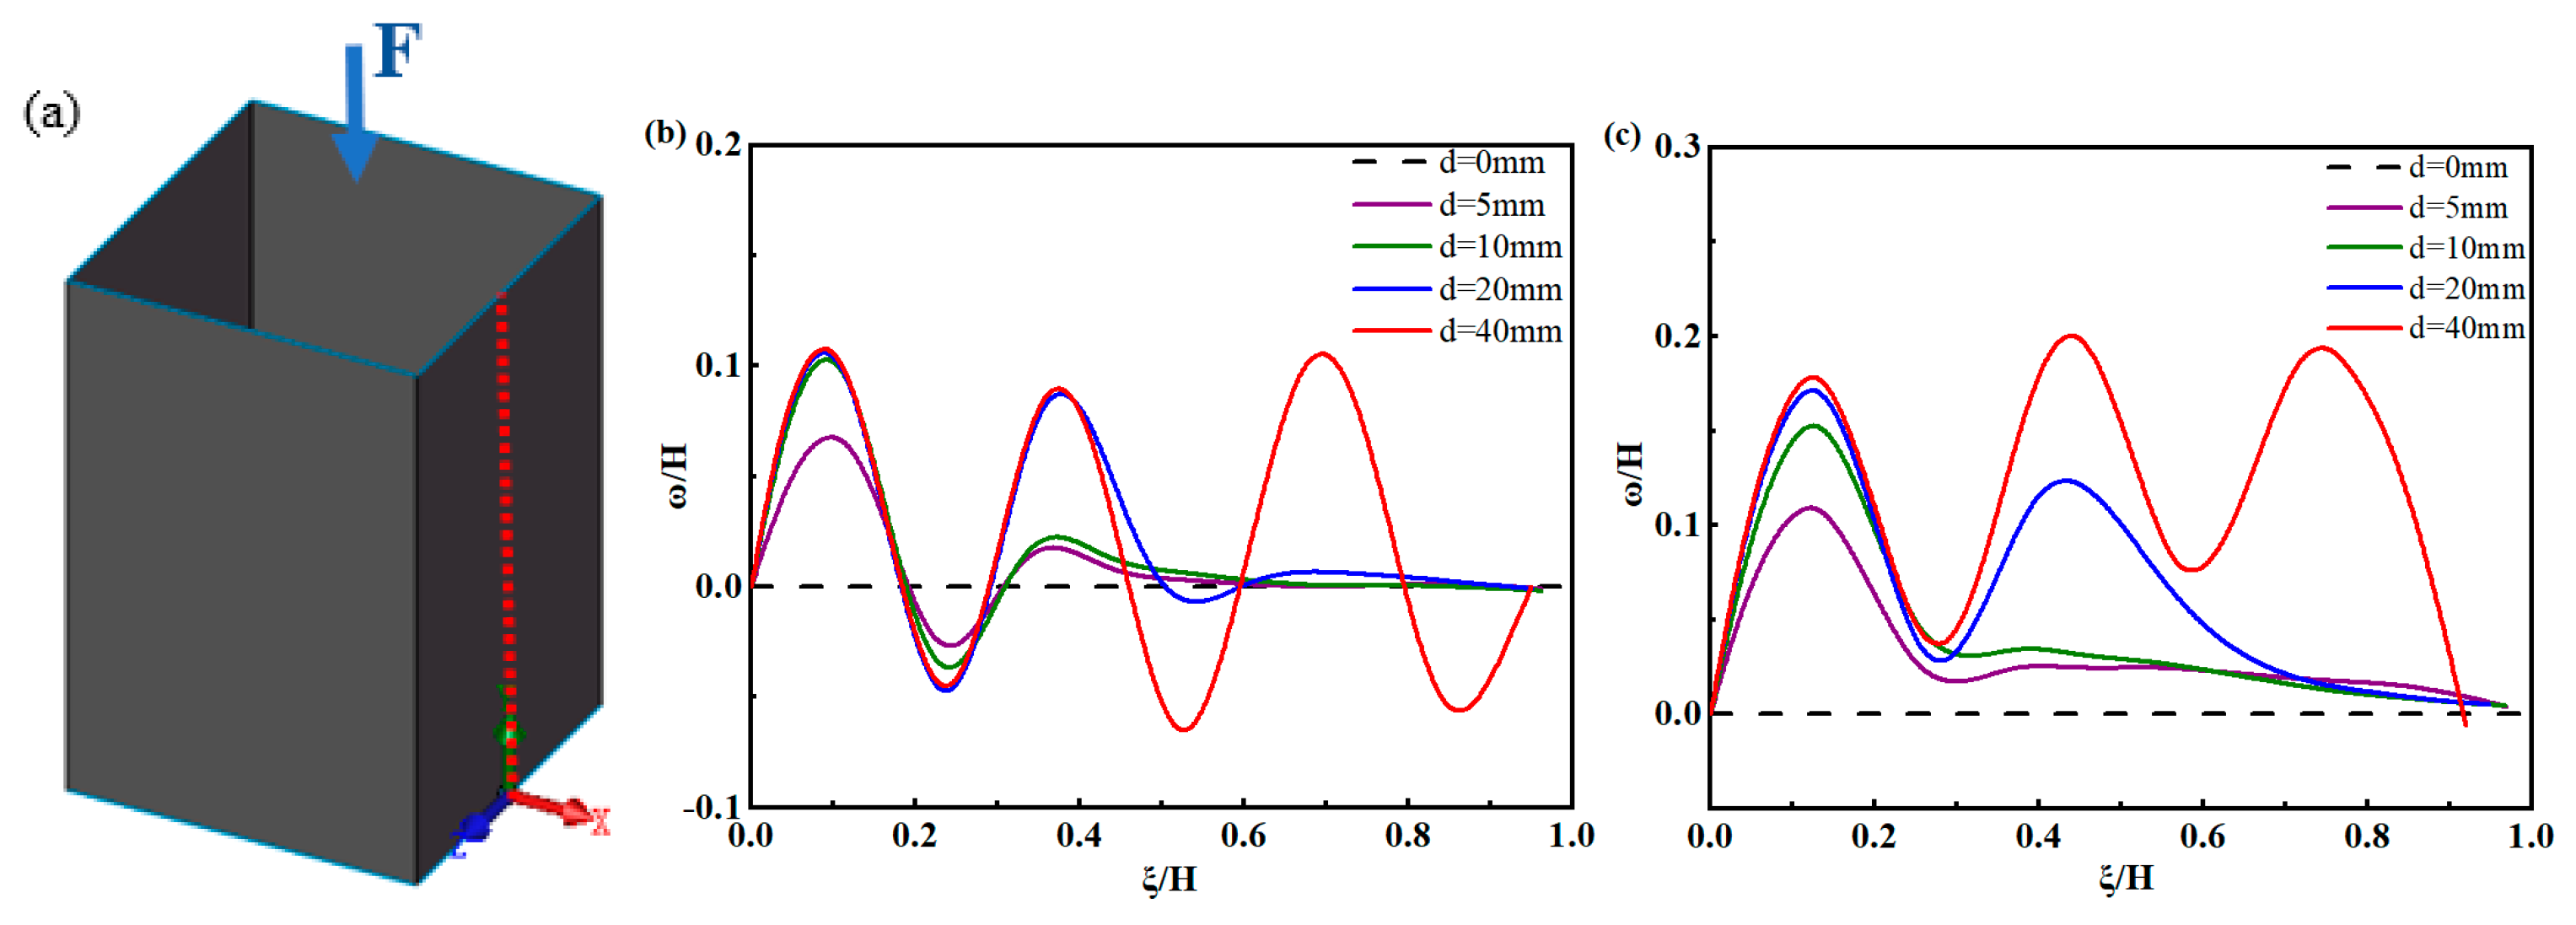
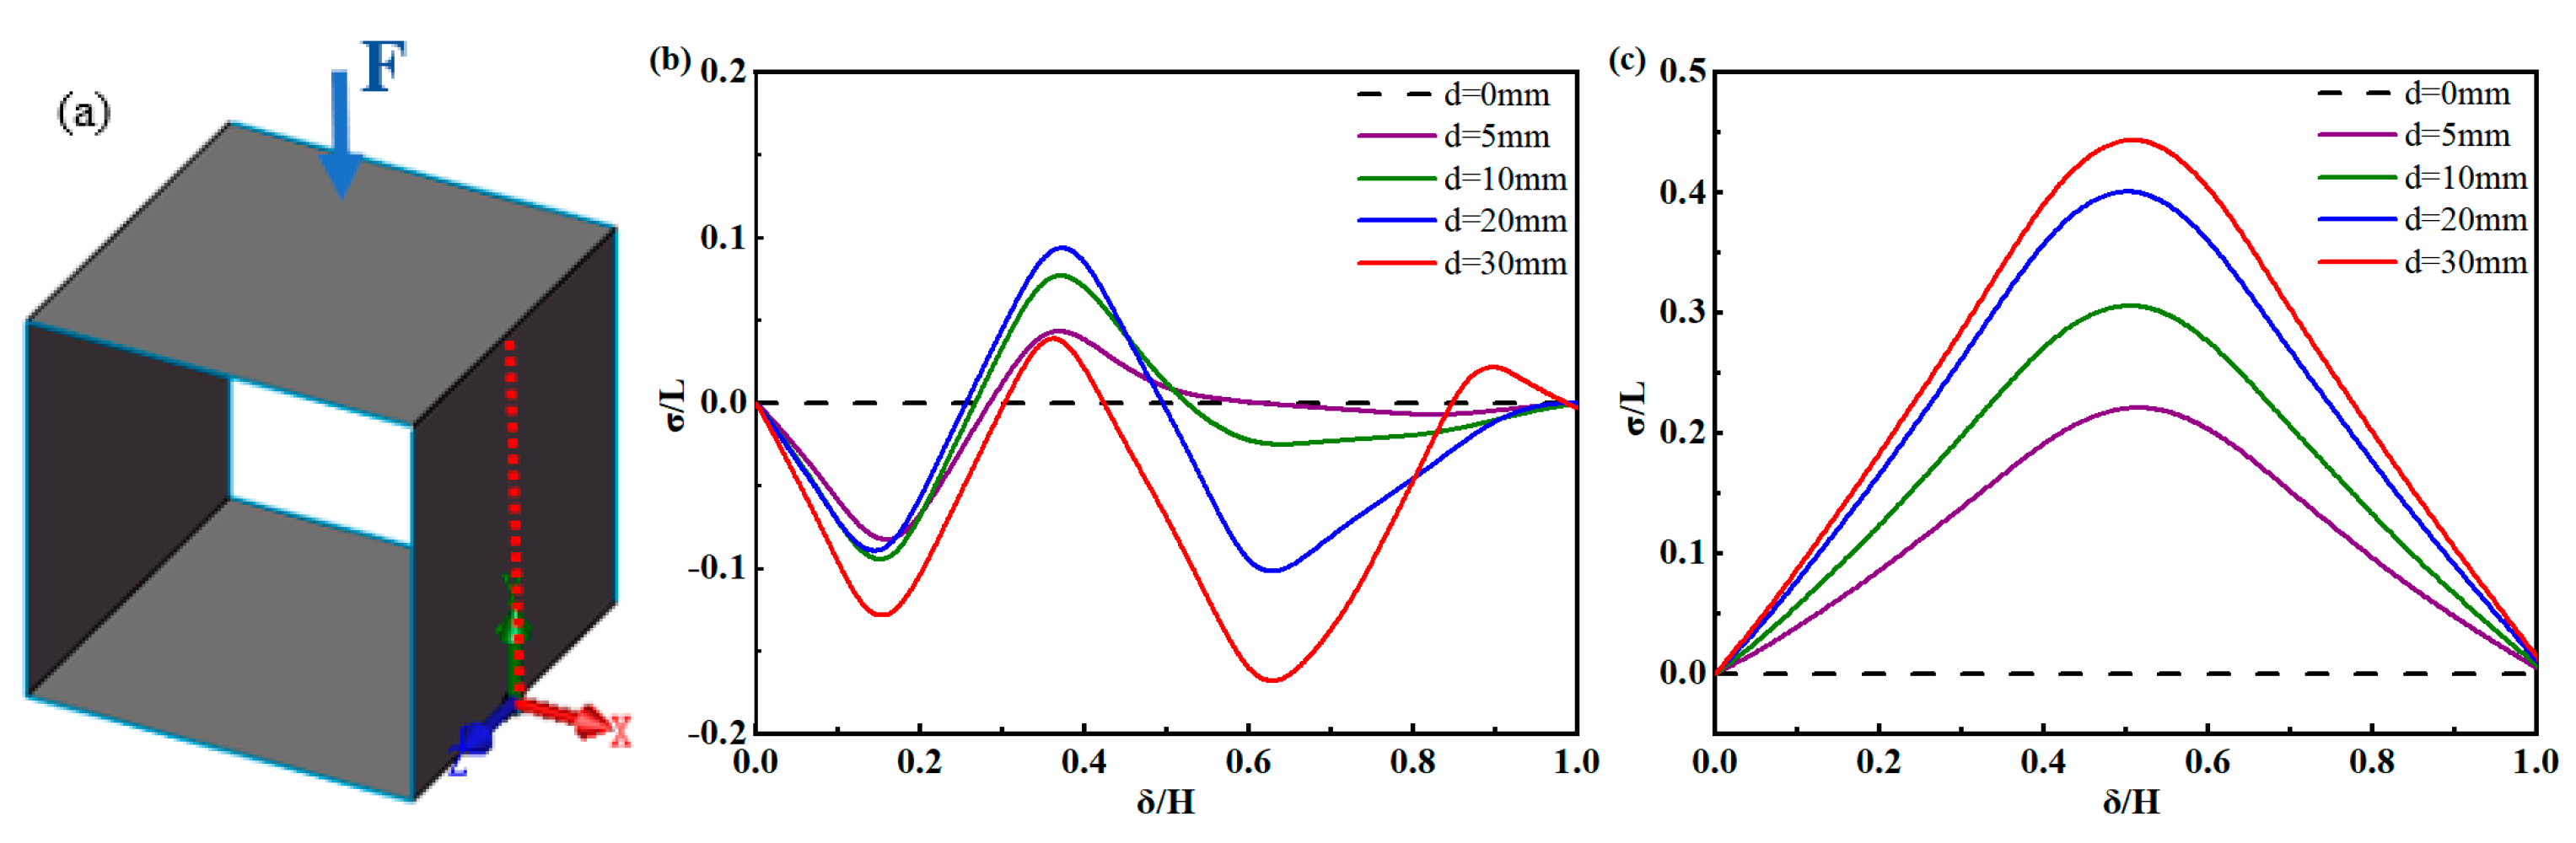
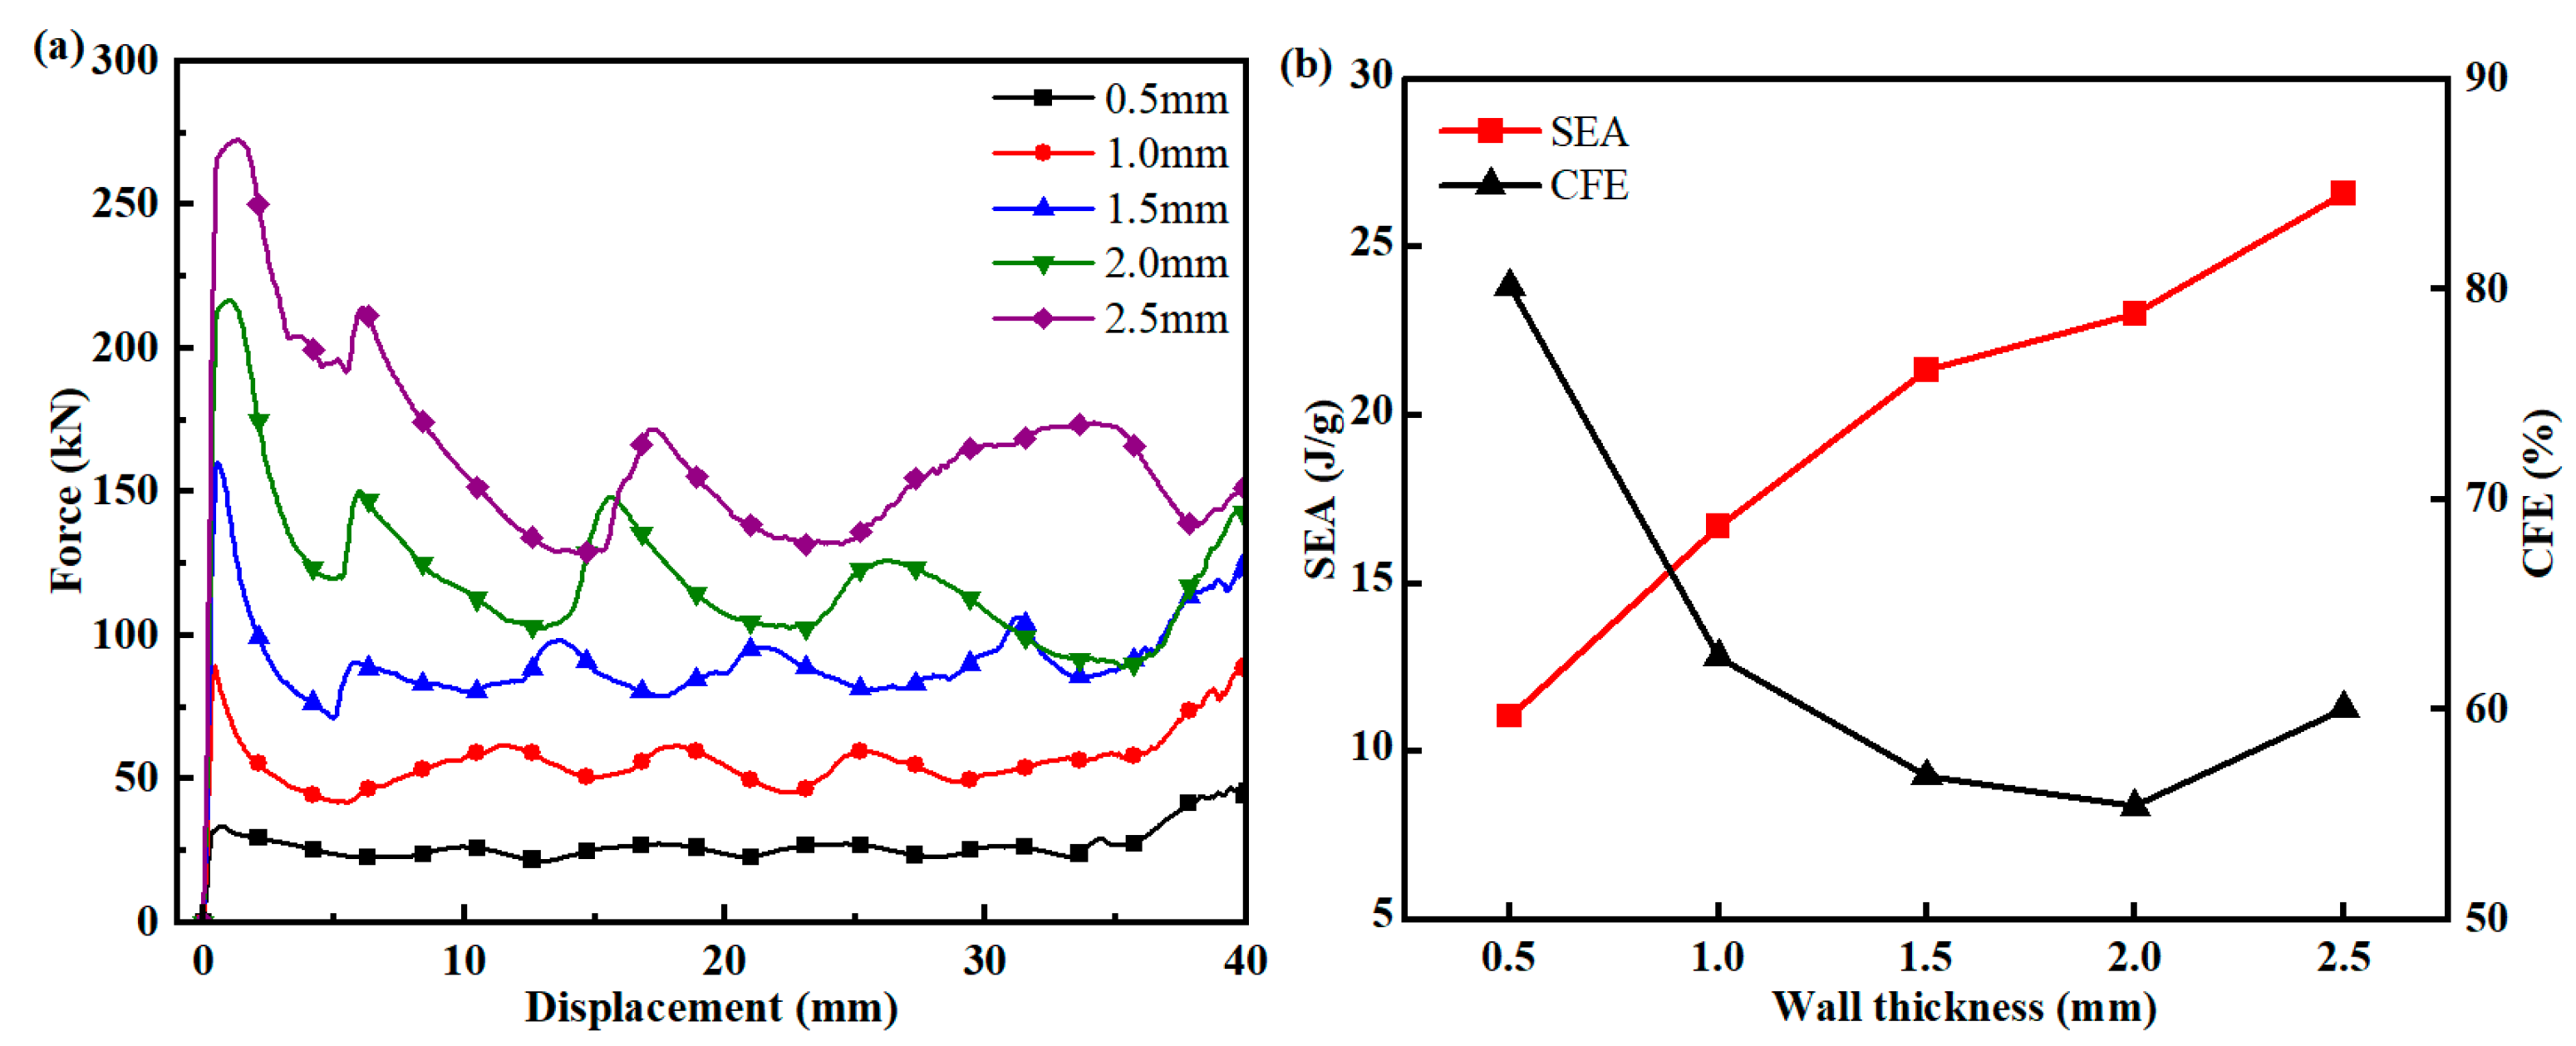
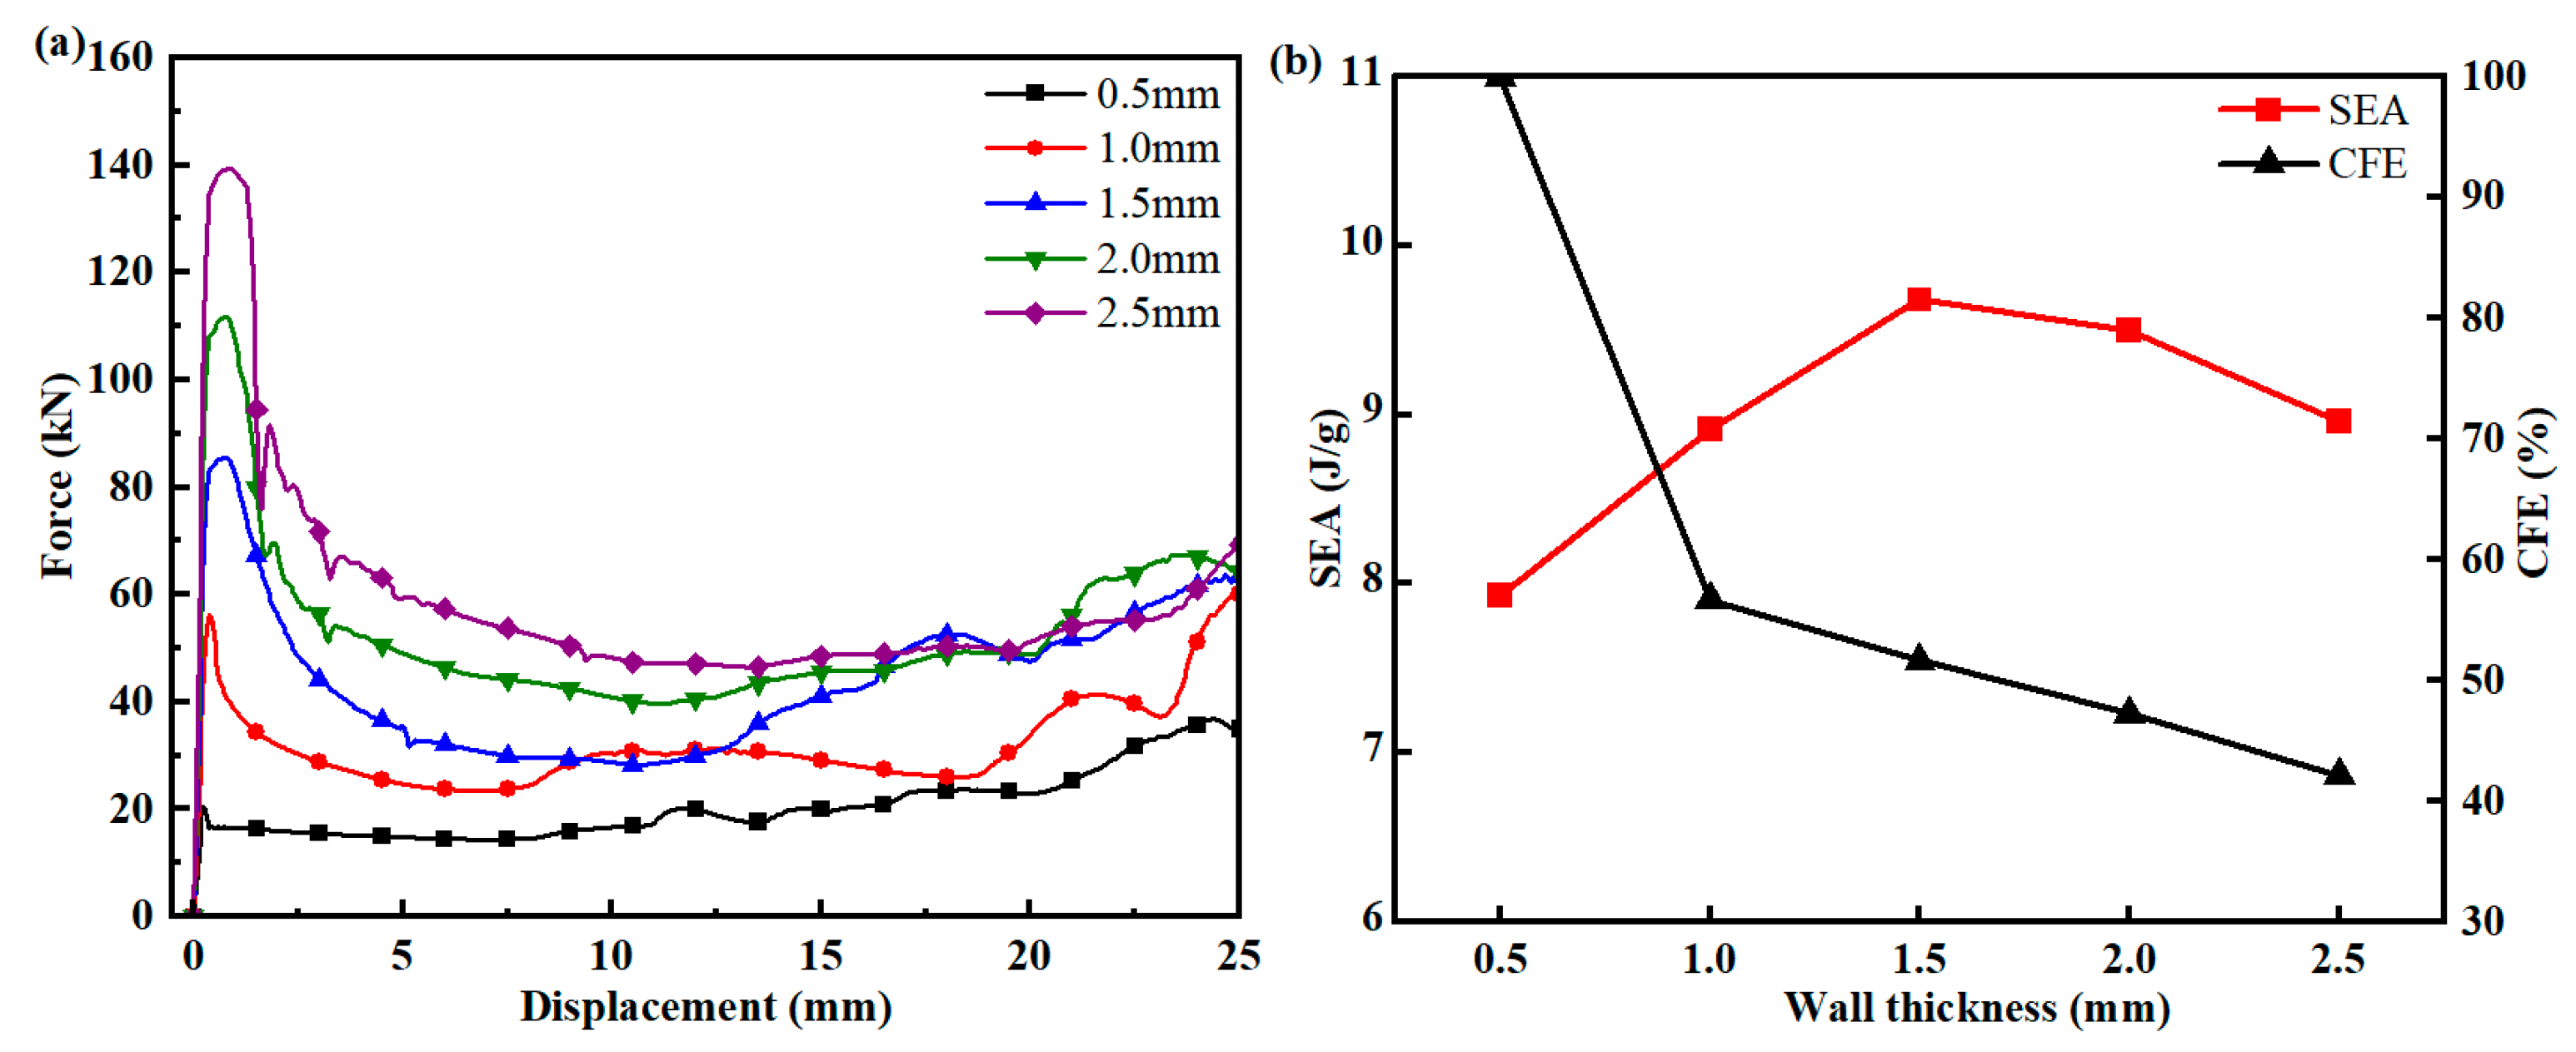
4.1. Effect of Thin−Walled Tube Thickness on Structural Crashworthiness
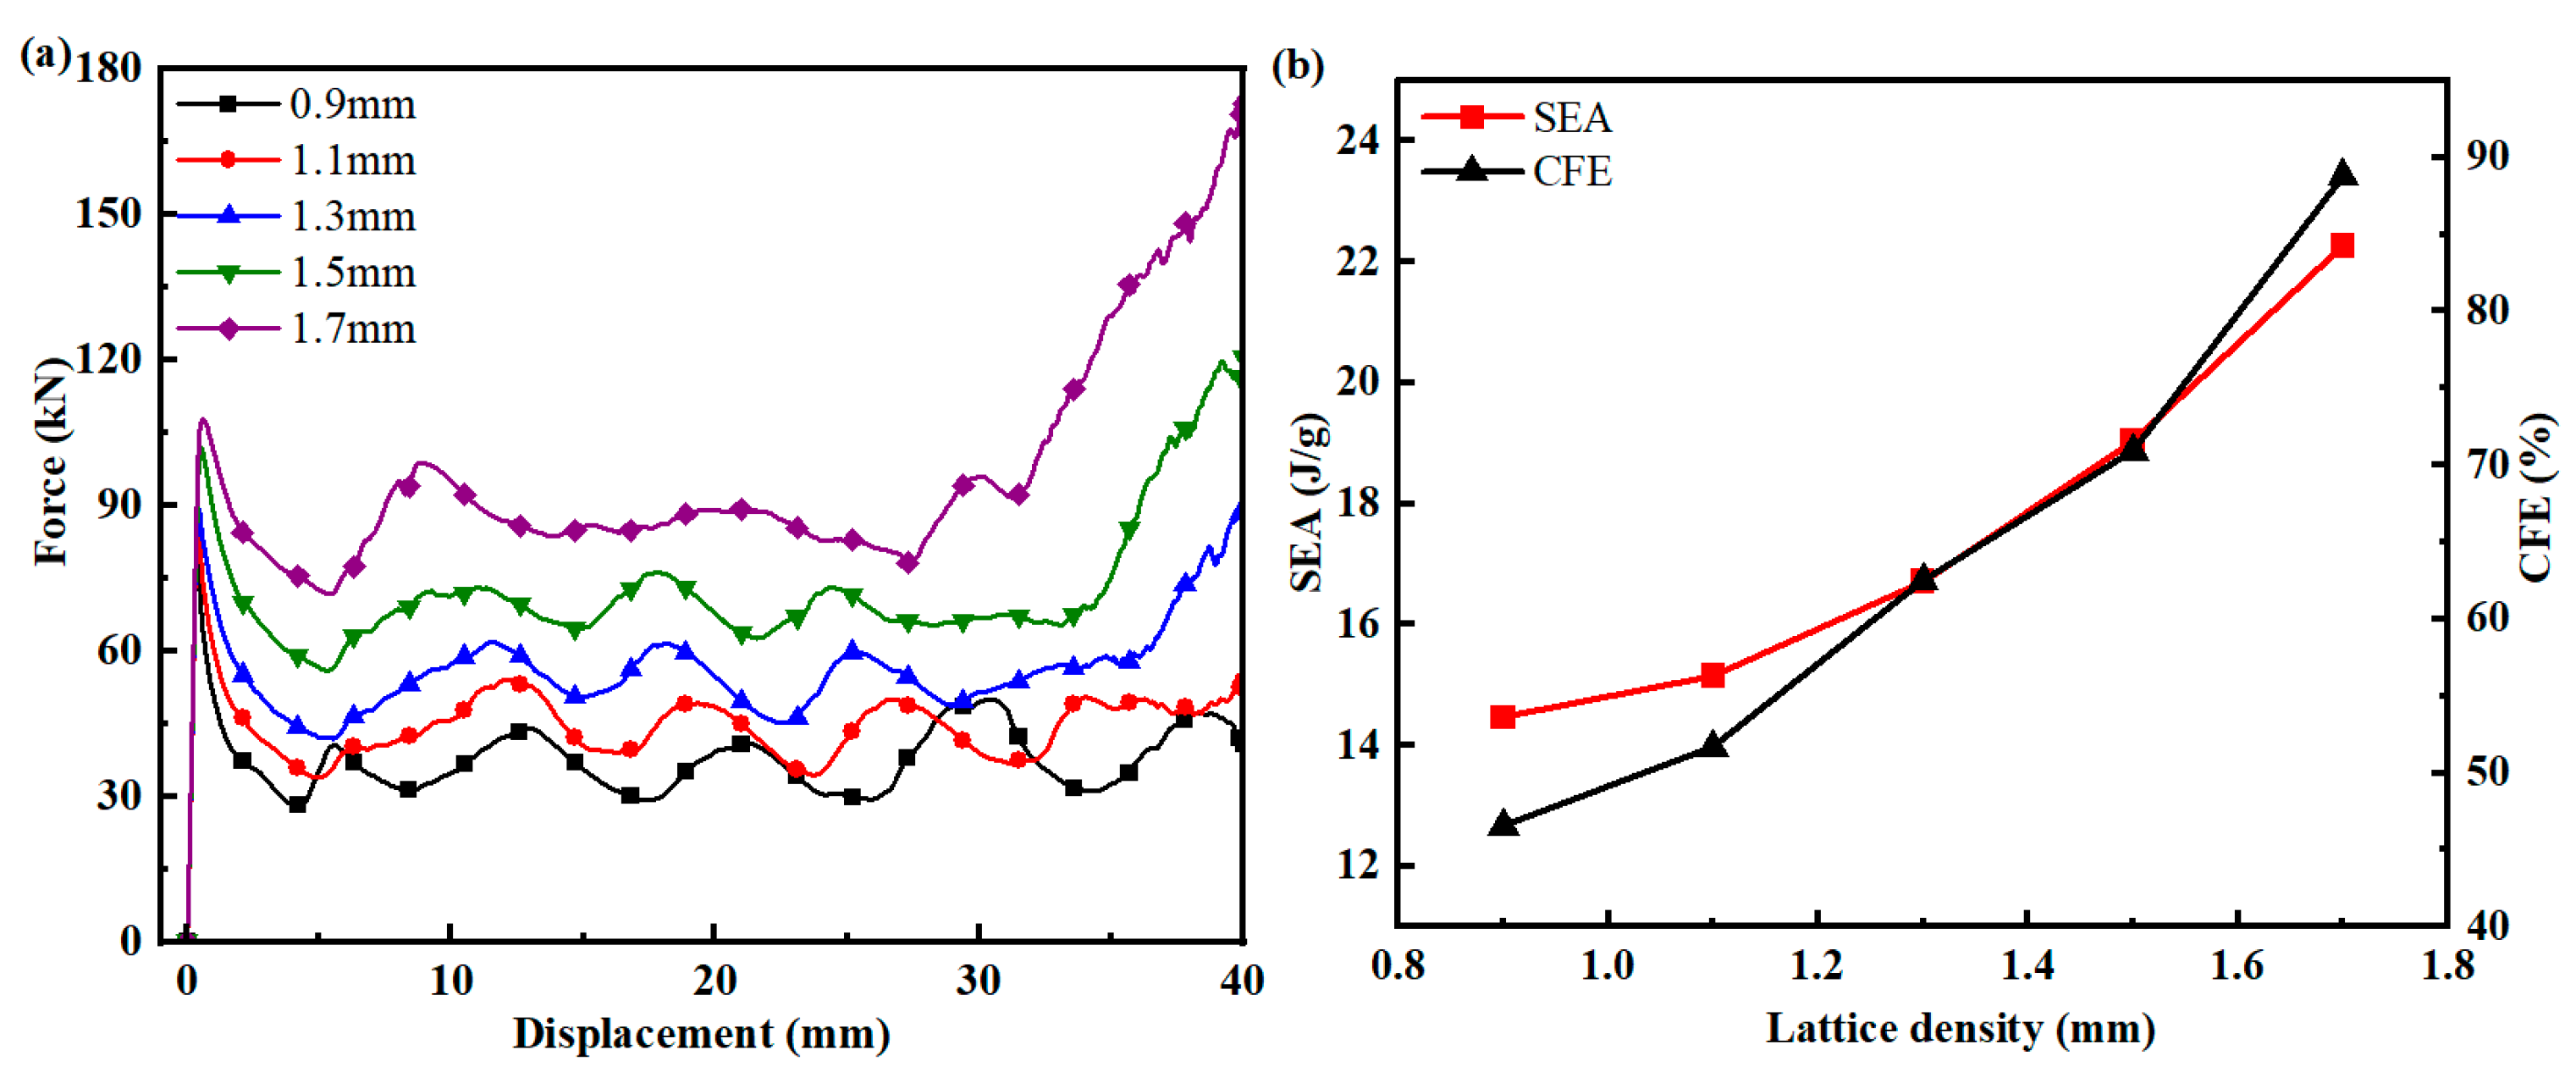
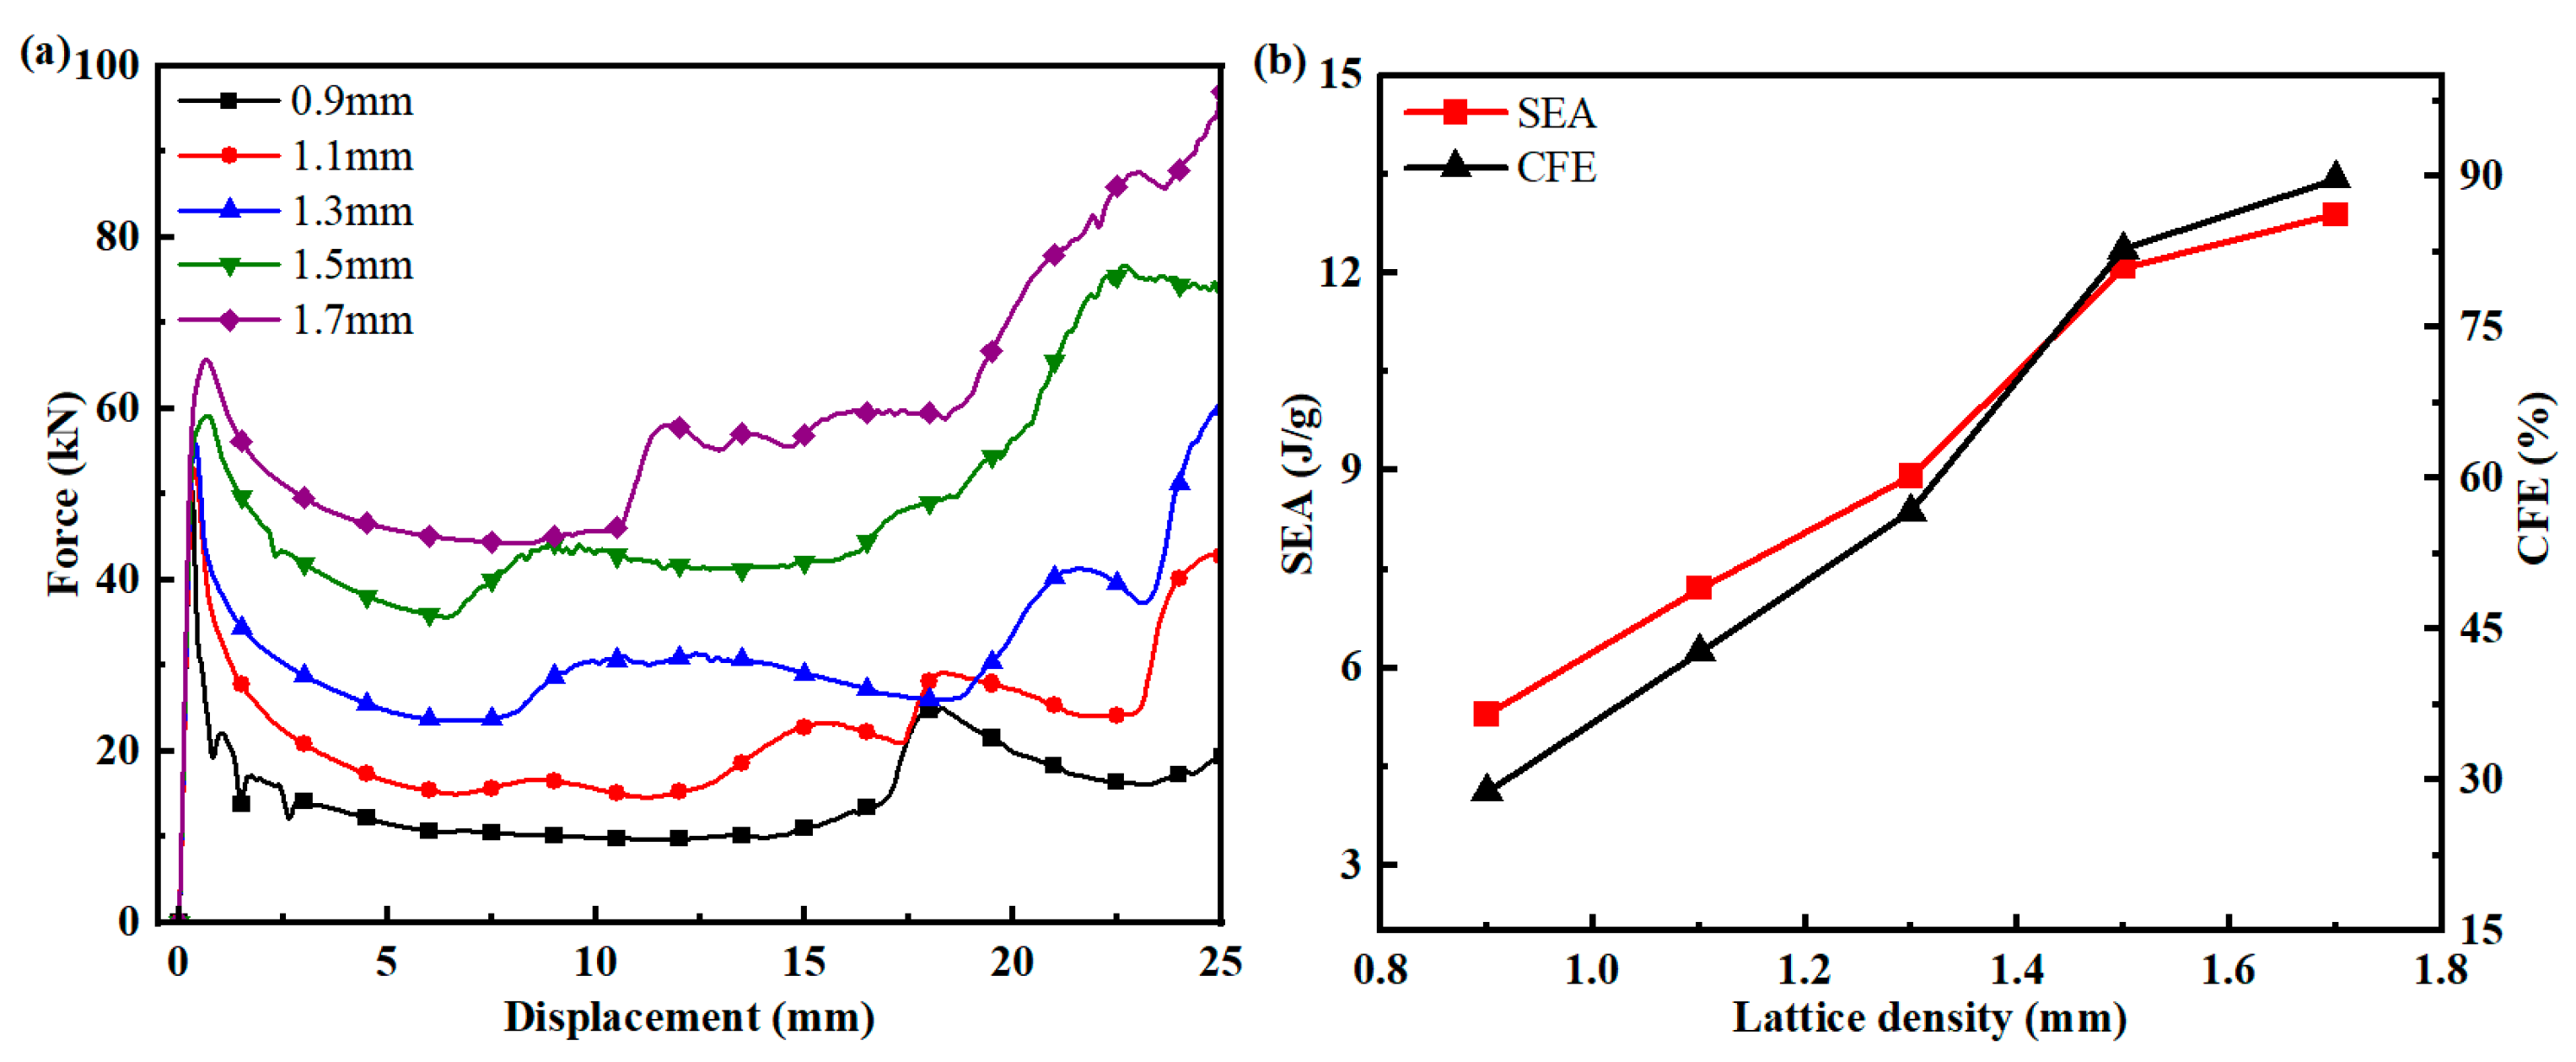
4.2. Effect of Lattice Density on Structural Crashworthiness
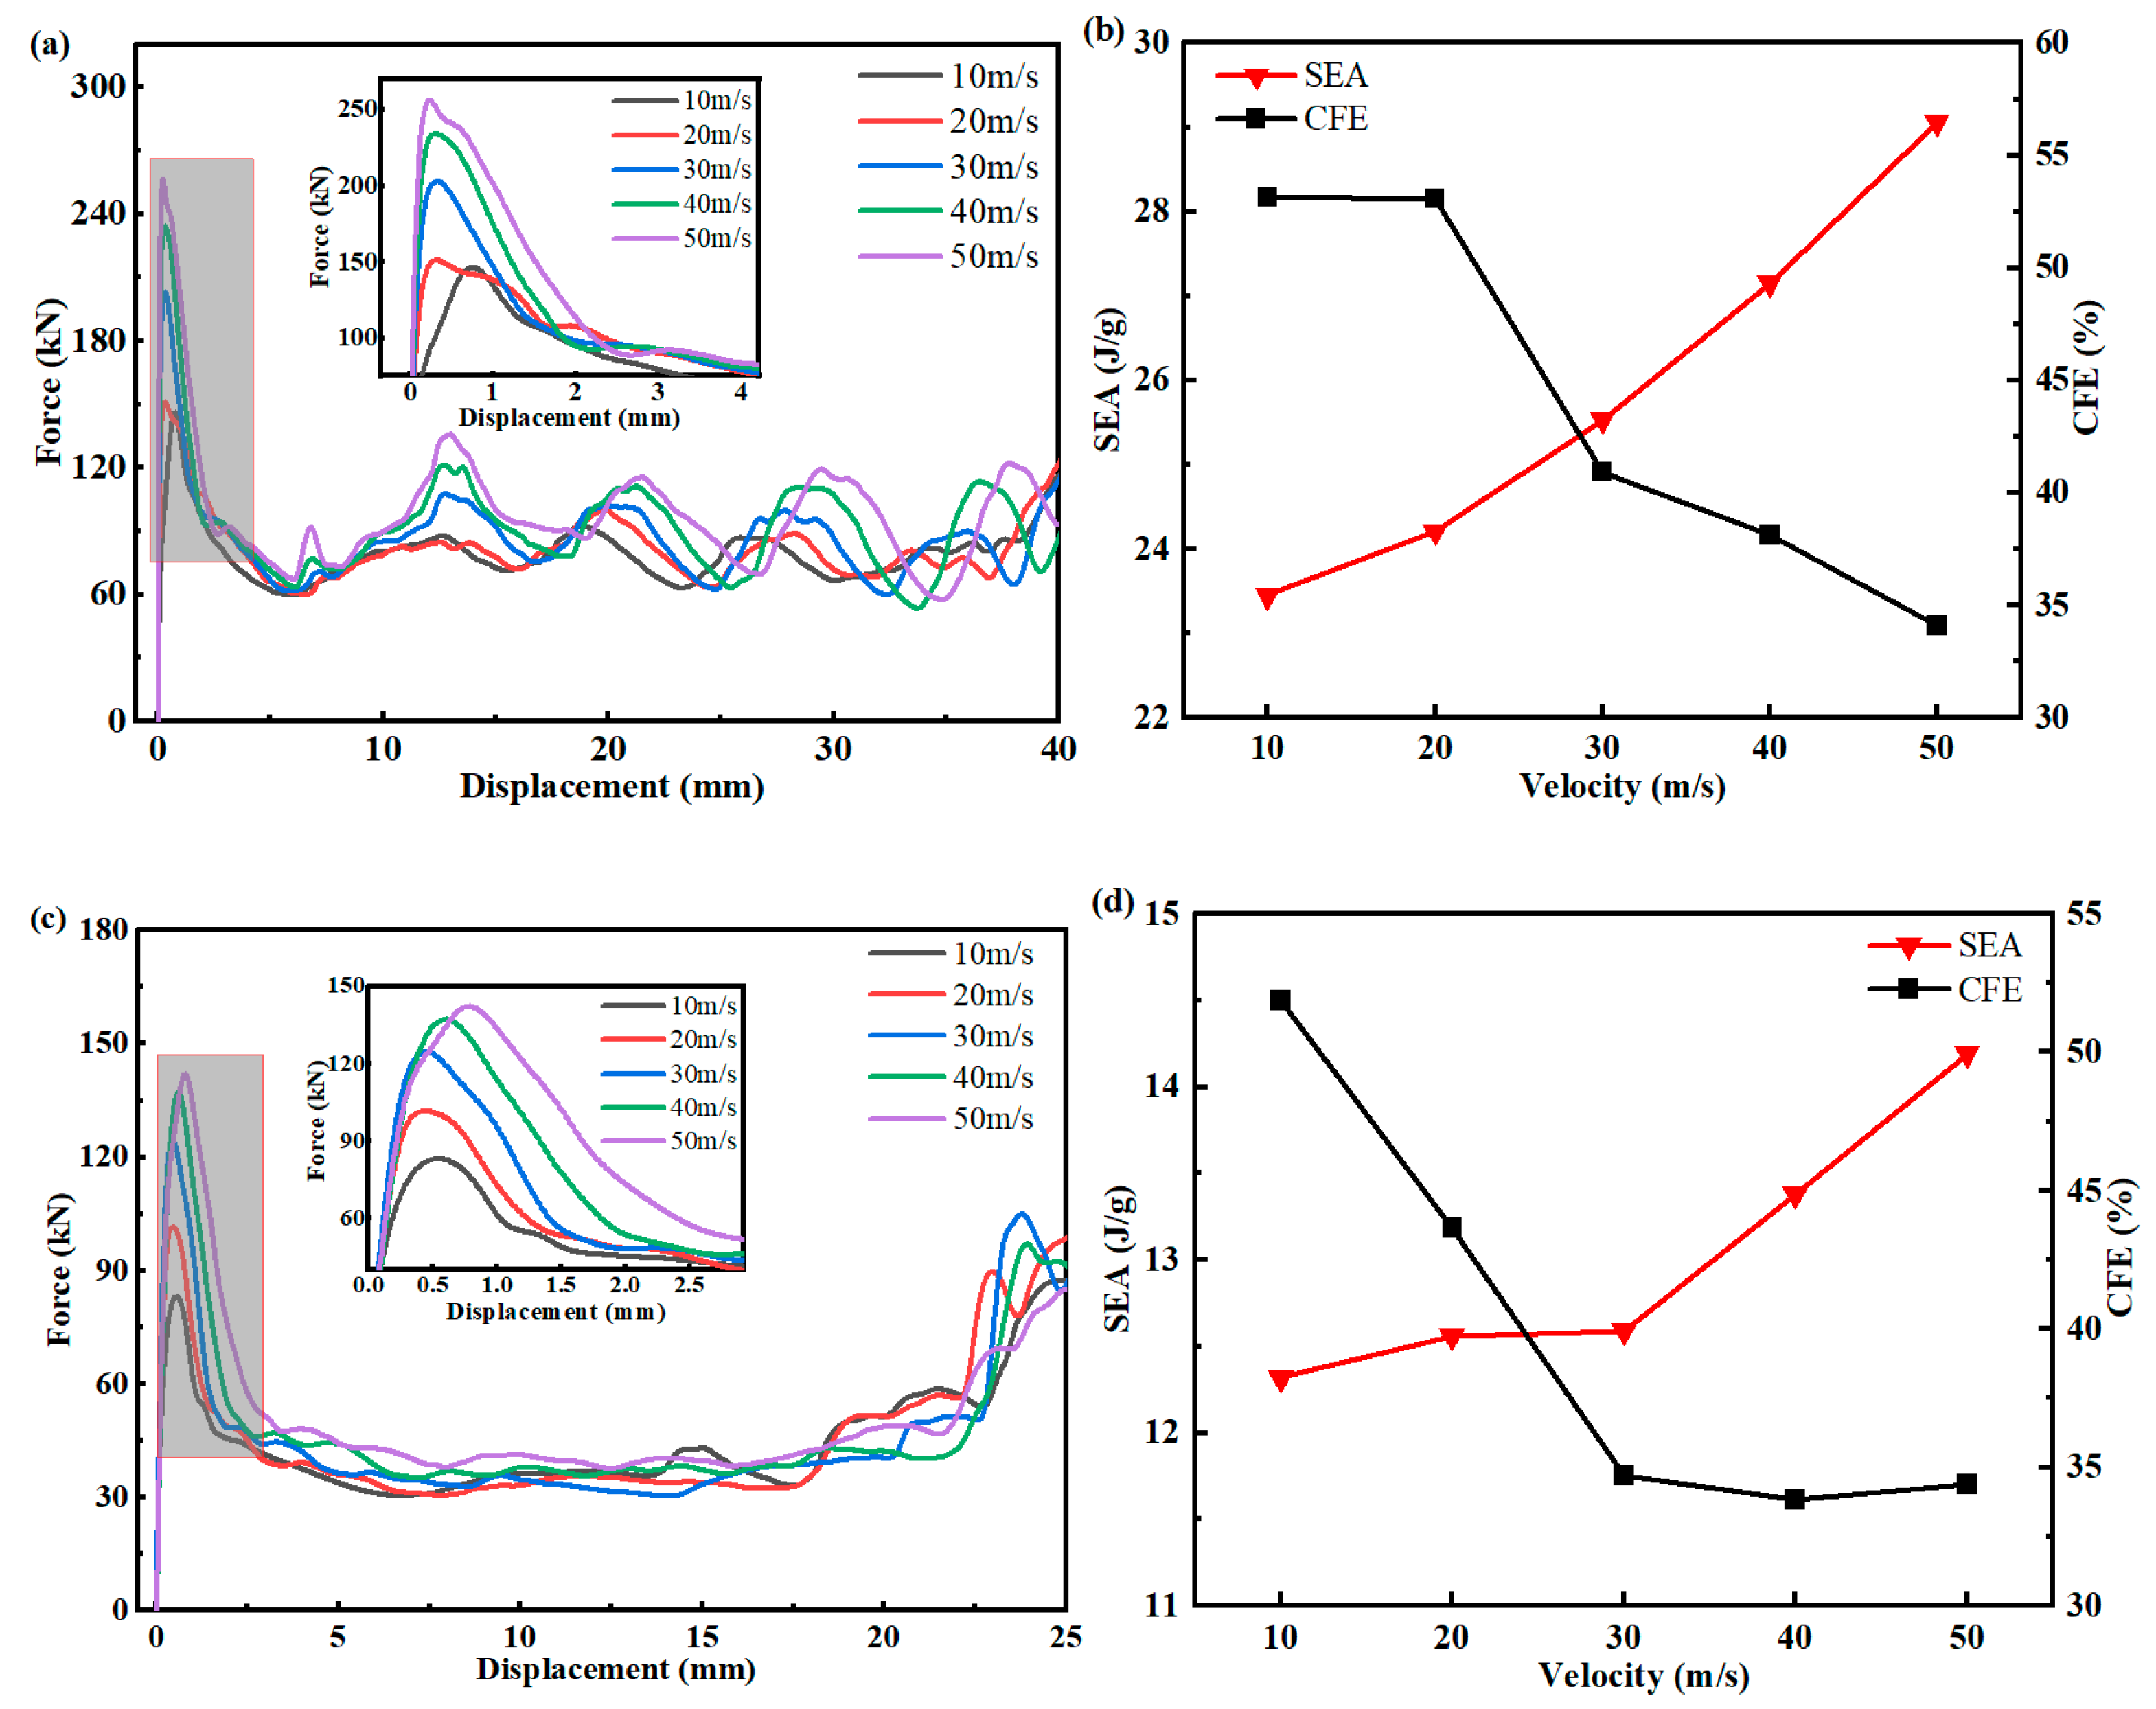
4.3. Effect of Loading Speed on Structural Crashworthiness
5. Conclusions
- (1)
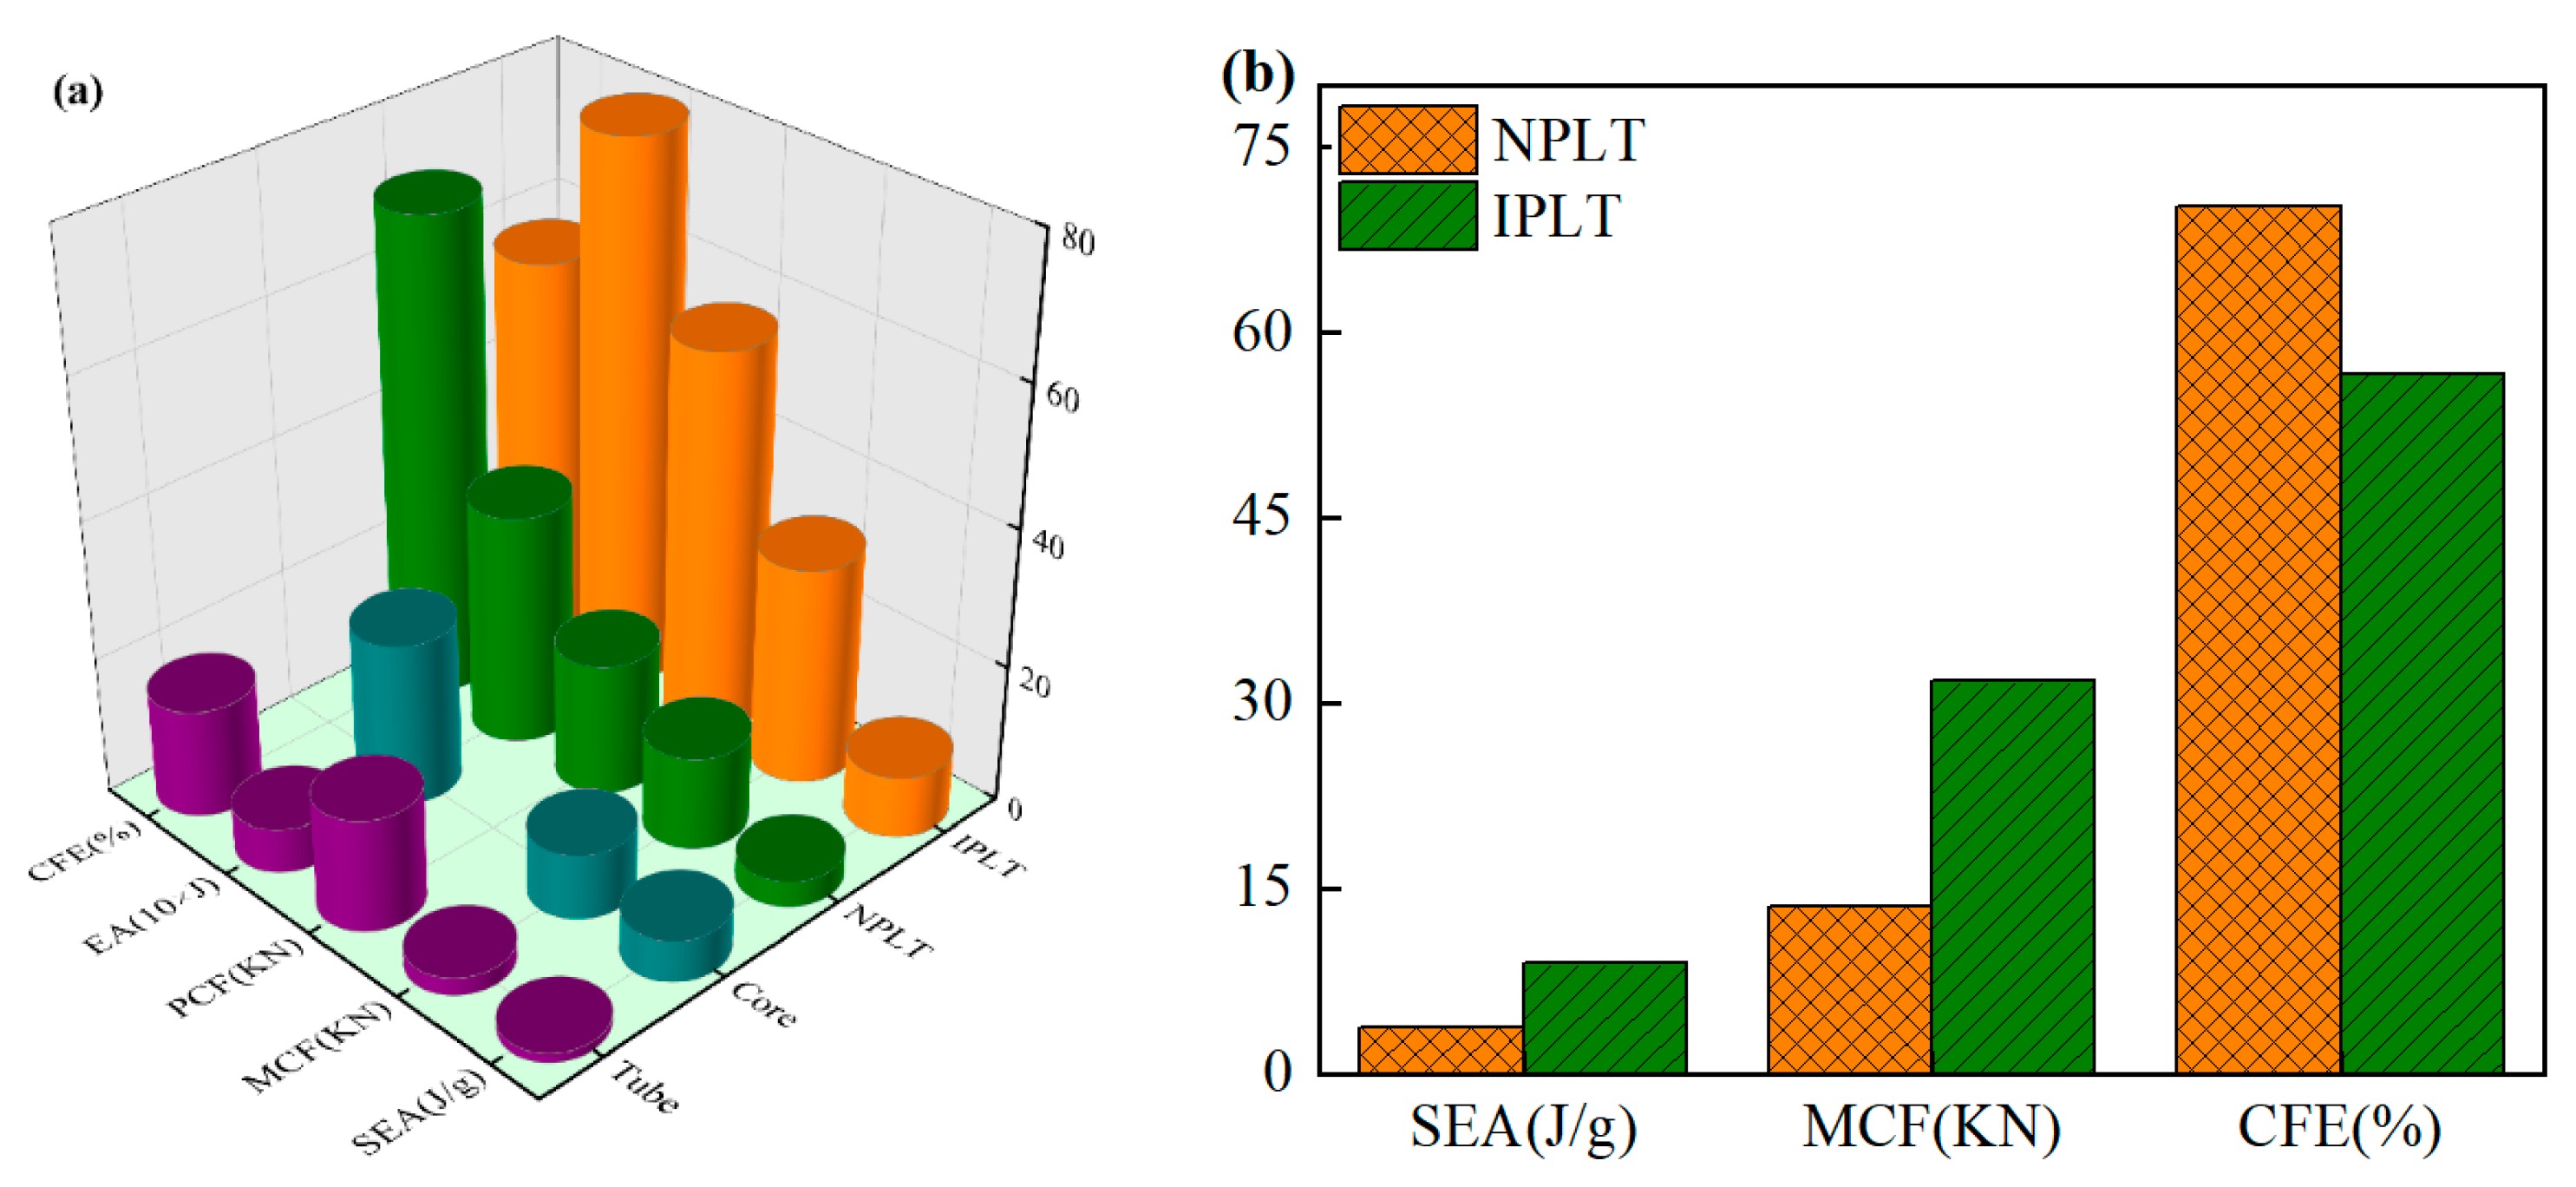
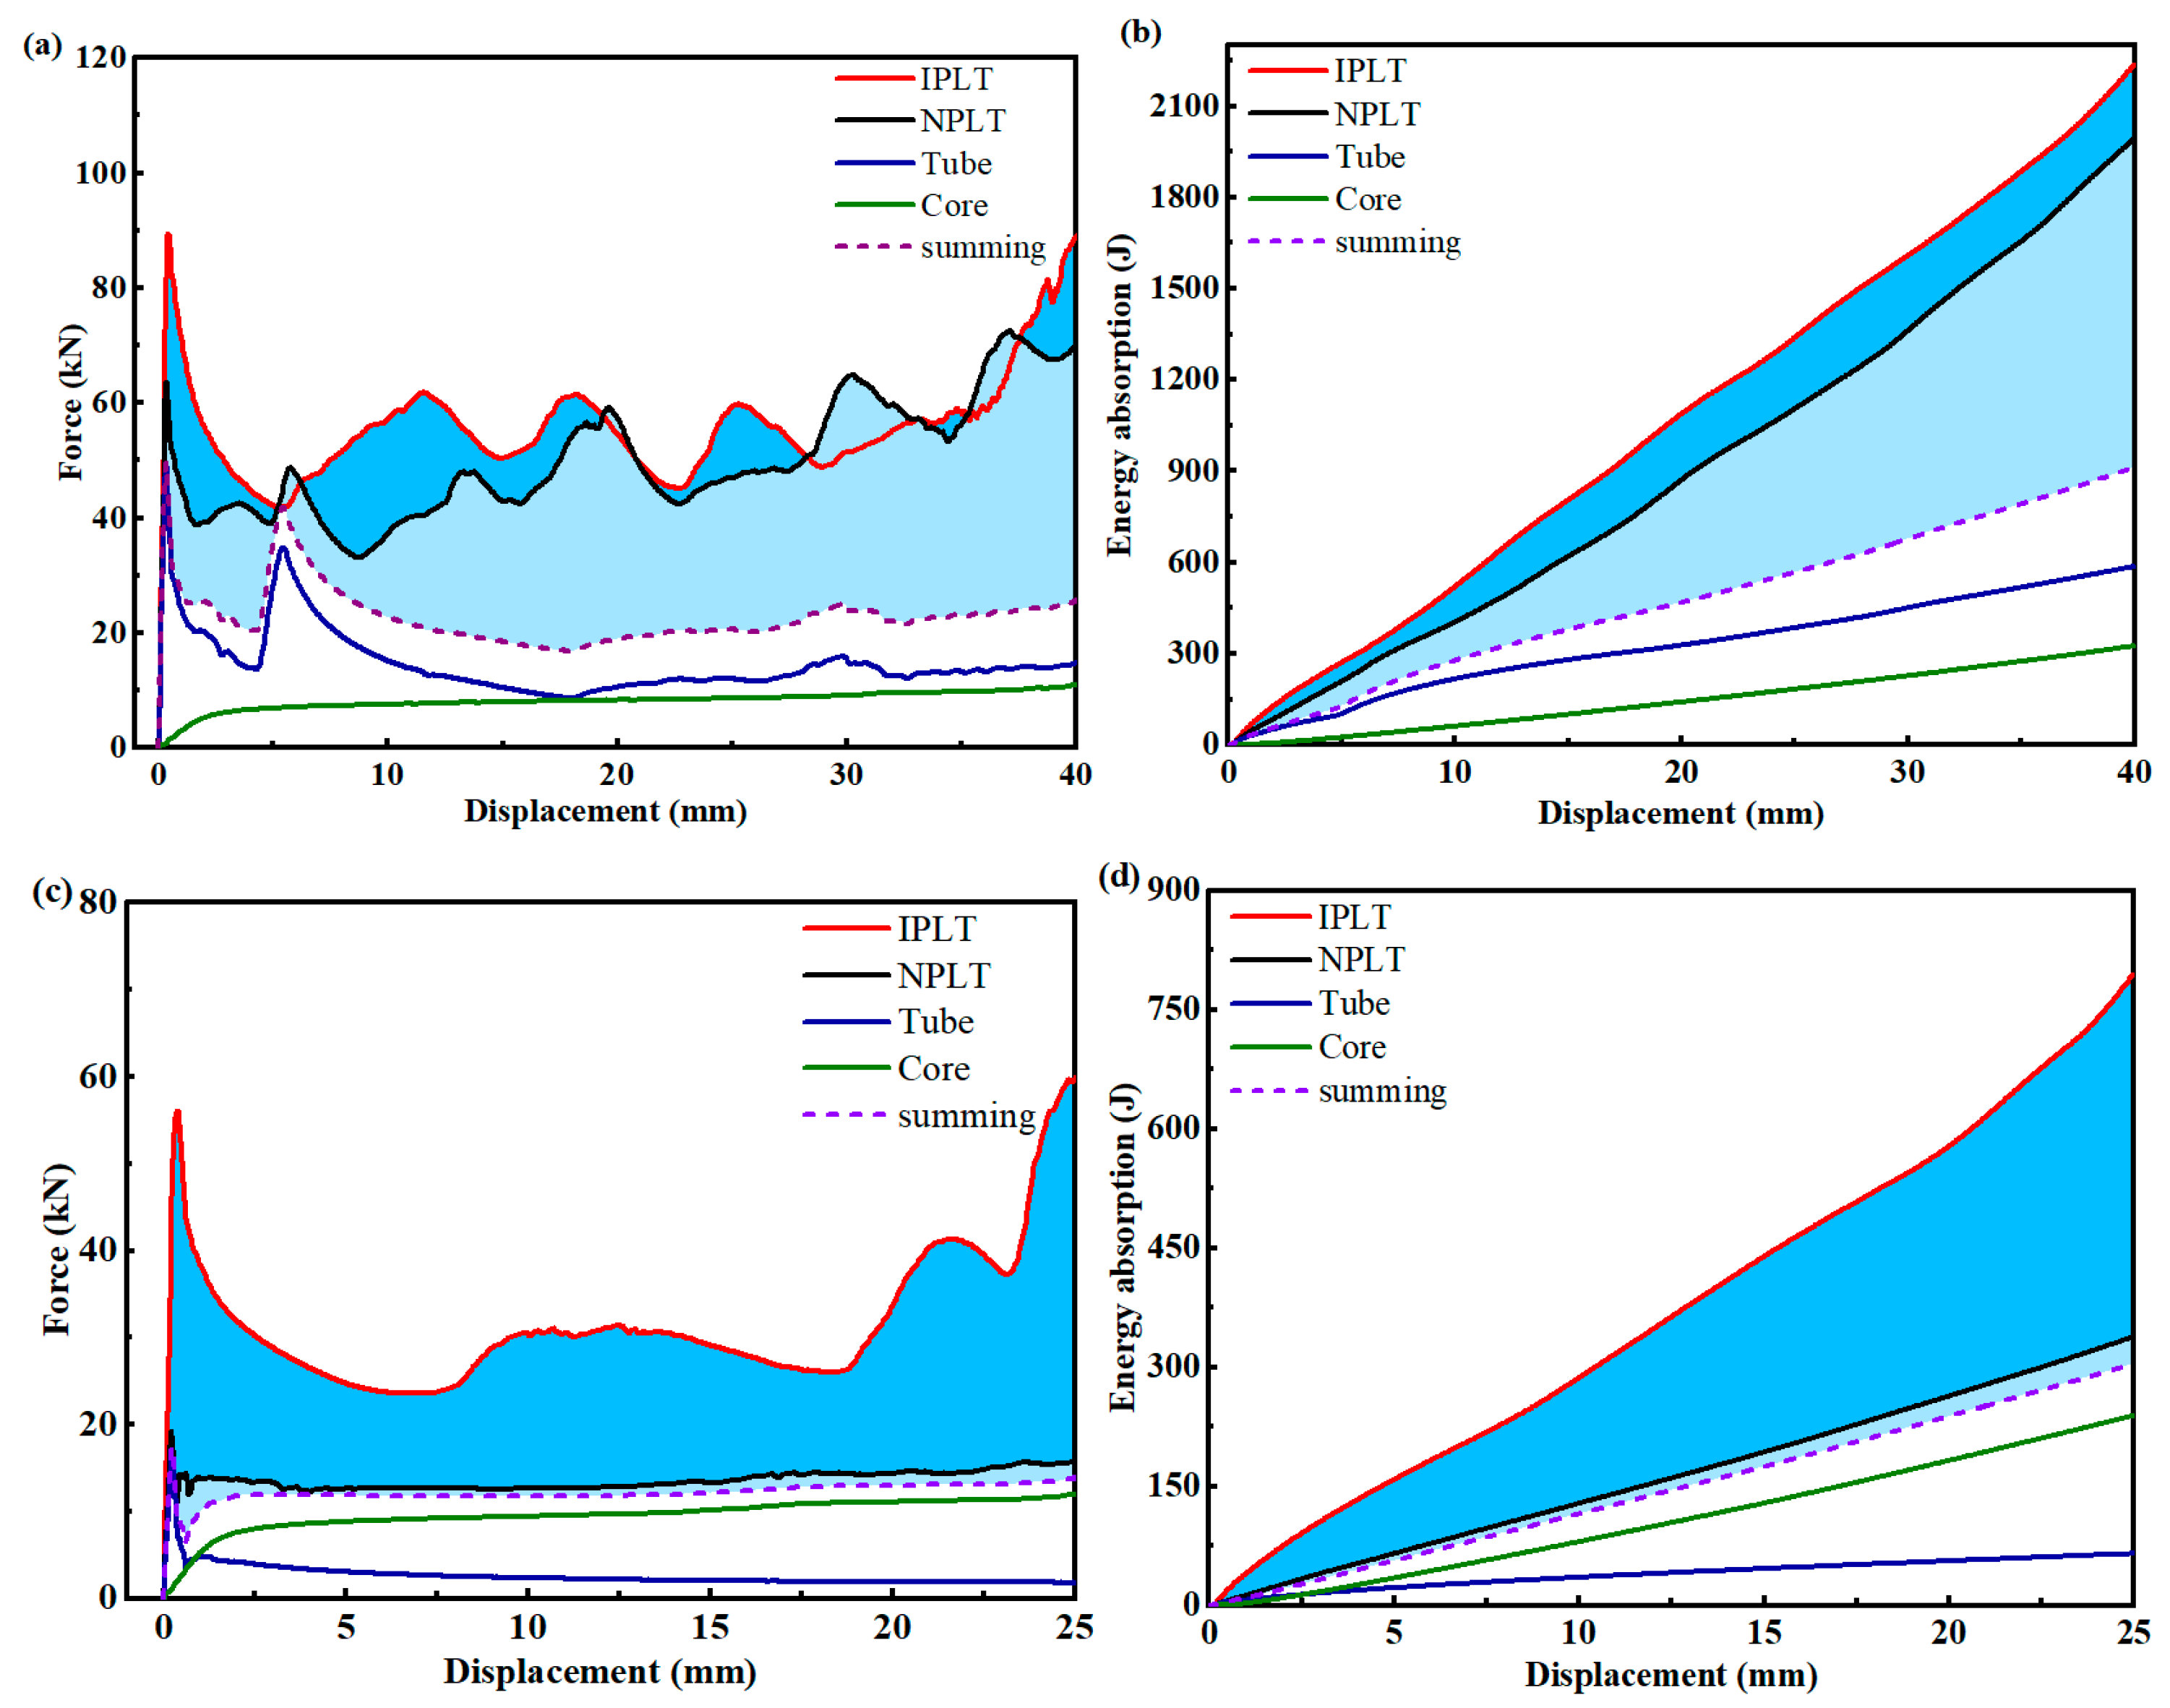
- Under quasi-static axial compression, the IPLT forms more folds with shorter wavelengths, and the SEA increases by 12.14% compared to the NPLT. Under quasi-static transverse compression, the IPLT is not completely separated from the deformation, and the SEA increases by 134.83% compared to the NPLT.
- (2)
- The designed hybrid structure has a 112.60% (580.15%) increase in specific energy absorption under axial compression (under transverse compression) compared to an empty tube.
- (3)
- For IPLT with the increase in wall thickness, the energy absorption is increased, but the excessive wall thickness will make the overall structure less stable. For IPLT with the increase in lattice density, the energy absorption increases. The load capacity of the IPLT−filled tube increases with the increase in loading speed.
Author Contributions
Funding
Institutional Review Board Statement
Informed Consent Statement
Data Availability Statement
Conflicts of Interest
References
- Chen, D.H.; Masuda, K. Estimation of Collapse Load for Thin−Walled Rectangular Tubes Under Bending. J. Appl. Mech. Trans. ASME 2016, 83, 8. [Google Scholar] [CrossRef]
- Duarte, I.; Krstulovic−Opara, L.; Vesenjak, M. Characterisation of aluminium alloy tubes filled with aluminium alloy integral-skin foam under axial compressive loads. Compos. Struct. 2015, 121, 154–162. [Google Scholar] [CrossRef]
- Kim, J.S.; Yoon, H.J.; Shin, K.B. Experimental Investigation of Composite Sandwich Square Tubes under Quasi−Static and Dynamic Axial Crushing. Adv. Compos. Mater. 2011, 20, 385–404. [Google Scholar] [CrossRef]
- Xiang, X.M.; Xiao, C.K.; Ha, N.S.; Lu, G.X.; Zhang, S.L.; Liu, Y.J. The quasi-static compressive mechanical properties of barnacle bioinspired structures. Eng. Struct. 2023, 275, 15. [Google Scholar] [CrossRef]
- Zhang, H.; Gao, Z.P.; Ruan, D. Square tubes with graded wall thickness under oblique crushing. Thin-Walled Struct. 2023, 183, 17. [Google Scholar] [CrossRef]
- Fang, J.G.; Sun, G.Y.; Qiu, N.; Kim, N.H.; Li, Q. On design optimization for structural crashworthiness and its state of the art. Struct. Multidiscip. Optim. 2017, 55, 1091–1119. [Google Scholar] [CrossRef]
- Mahidan, F.M.; Ifayefunmi, O. Buckling of Axially Compressed Cones with Imperfect Axial Length. Lat. Am. J. Solids Struct. 2020, 17, 20. [Google Scholar] [CrossRef]
- Xie, S.C.; Zhang, J.; Liu, X.; Zheng, S.W.; Liu, Z.A. A reinforced energy-absorbing structure formed by combining multiple aluminum foam-filled open-hole tubes. Int. J. Mech. Sci. 2022, 224, 15. [Google Scholar] [CrossRef]
- Zhang, C.; Saigal, A. Crash behavior of a 3D S−shape space frame structure. J. Mater. Process. Technol. 2007, 191, 256–259. [Google Scholar] [CrossRef]
- Singace, A.A. Further experimental investigation on the eccentricity factor in the progressive crushing of tubes. Int. J. Solids Struct. 1996, 33, 3517–3538. [Google Scholar] [CrossRef]
- Singace, A.A. Axial crushing analysis of tubes deforming in the multi-lobe mode. Int. J. Mech. Sci. 1999, 41, 865–890. [Google Scholar] [CrossRef]
- Ha, N.S.; Pham, T.M.; Tran, T.T.; Hao, H.; Lu, G.X. Mechanical properties and energy absorption of bio-inspired hierarchical circular honeycomb. Compos. Part B Eng. 2022, 236, 19. [Google Scholar] [CrossRef]
- Yang, X.F.; Xi, X.L.; Pan, Q.F.; Liu, H. In-plane dynamic crushing of a novel circular-celled honeycomb nested with petal-shaped mesostructure. Compos. Struct. 2019, 226, 13. [Google Scholar] [CrossRef]
- Deng, X.L.; Qin, S.A.; Huang, J.L. Crashworthiness analysis of gradient hierarchical multicellular columns evolved from the spatial folding. Mater. Des. 2022, 215, 19. [Google Scholar] [CrossRef]
- Liu, W.Y.; Huang, J.L.; Deng, X.L.; Lin, Z.Q.; Zhang, L. Crashworthiness analysis of cylindrical tubes filled with conventional and negative Poisson’s ratio foams. Thin-Walled Struct. 2018, 131, 297–308. [Google Scholar] [CrossRef]
- Aktay, L.; Kroplin, B.H.; Toksoy, A.K.; Guden, M. Finite element and coupled finite element/smooth particle hydrodynamics modeling of the quasi-static crushing of empty and foam-filled single, bitubular and constraint hexagonal− and square-packed aluminum tubes. Mater. Des. 2008, 29, 952–962. [Google Scholar] [CrossRef]
- Aktay, L.; Toksoy, A.K.; Guden, M. Quasi-static axial crushing of extruded polystyrene foam-filled thin-walled aluminum tubes: Experimental and numerical analysis. Mater. Des. 2004, 27, 556–565. [Google Scholar] [CrossRef]
- Askari, M.; Hutchins, D.A.; Thomas, P.J.; Astolfi, L.; Watson, R.L.; Abdi, M.; Ricci, M.; Laureti, S.; Nie, L.Z.; Freear, S.; et al. Additive manufacturing of metamaterials: A review. Addit. Manuf. 2020, 36, 36. [Google Scholar] [CrossRef]
- Bartolomeu, F.; Fonseca, J.; Peixinho, N.; Alves, N.; Gasik, M.; Silva, F.S.; Miranda, G. Predicting the output dimensions, porosity and elastic modulus of additive manufactured biomaterial structures targeting orthopedic implants. J. Mech. Behav. Biomed. Mater. 2019, 99, 104–117. [Google Scholar] [CrossRef]
- Ding, R.C.; Yao, J.; Du, B.R.; Zhao, L.; Guo, Y.M. Mechanical Properties and Energy Absorption Capability of ARCH Lattice Structures Manufactured by Selective Laser Melting. Adv. Eng. Mater. 2020, 22, 9. [Google Scholar] [CrossRef]
- Li, C.L.; Lei, H.S.; Liu, Y.B.; Zhang, X.Y.; Xiong, J.; Zhou, H.; Fang, D.N. Crushing behavior of multi-layer metal lattice panel fabricated by selective laser melting. Int. J. Mech. Sci. 2018, 145, 389–399. [Google Scholar] [CrossRef]
- Baykasoğlu, A.; Baykasoğlu, C.; Cetin, E. Multi-objective crashworthiness optimization of lattice structure filled thin-walled tubes. Thin-Walled Struct. 2020, 149, 106630. [Google Scholar] [CrossRef]
- Li, D.M.; Qin, R.X.; Xu, J.X.; Zhou, J.X.; Chen, B.Z. Topology optimization of thin-walled tubes filled with lattice structures. Int. J. Mech. Sci. 2022, 227, 16. [Google Scholar] [CrossRef]
- Liu, H.; Chng, Z.X.C.; Wang, G.J.; Ng, B.F. Crashworthiness improvements of multi-cell thin-walled tubes through lattice structure enhancements. Int. J. Mech. Sci. 2021, 210, 19. [Google Scholar] [CrossRef]
- Cetin, E.; Baykasoglu, C. Crashworthiness of graded lattice structure filled thin-walled tubes under multiple impact loadings. Thin-Walled Struct. 2020, 154, 15. [Google Scholar] [CrossRef]
- Cetin, E.; Baykasoglu, C. Bending Response of Lattice Structure Filled Tubes under Transverse Loading. Hittite J. Sci. Eng. 2022, 9, 151–158. [Google Scholar] [CrossRef]
- Seitzberger, M.; Rammerstorfer, F.G.; Gradinger, R.; Degischer, H.P.; Blaimschein, M.; Walch, C. Experimental studies on the quasi-static axial crushing of steel columns filled with aluminium foam. Int. J. Solids Struct. 2000, 37, 4125–4147. [Google Scholar] [CrossRef]
- Cui, G.M.; Meng, L.Z.; Zhai, X.M. Buckling behaviors of aluminum foam-filled aluminum alloy composite columns under axial compression. Thin-Walled Struct. 2022, 177, 16. [Google Scholar] [CrossRef]
- Zhang, Z.J.; Wang, J.; Wang, Y.J.; Li, B.C.; Li, J.; Li, G.; Sui, Y.G.; Zhang, Q.C.; Jin, F. Elevated temperature axial crushing performance of multi-walled tube-reinforced aluminum foam. Thin-Walled Struct. 2023, 185, 12. [Google Scholar] [CrossRef]
- Bai, Y.C.; Gao, J.Y.; Huang, C.X. Mechanical properties and energy-absorption of integrated AlSi10Mg shell structures with BCC lattice infill. Chin. J. Mech. Eng. 2022. [Google Scholar] [CrossRef]
- Huang, Z.; Zhang, X.; Yang, C. Static and dynamic axial crushing of Al/CRFP hybrid tubes with single-cell and multi-cell sections. Compos. Struct. 2019, 226, 111023. [Google Scholar] [CrossRef]
- Blau, P.J. Friction Science and Technology; Taylor and Francis: Abingdon, UK; CRC Press: Boca Raton, FL, USA, 2010. [Google Scholar]
- Karagiozova, D.; Nurick, G.N.; Yuen, S.C.K. Energy absorption of aluminium alloy circular and square tubes under an axial explosive load. Thin-Walled Struct. 2004, 43, 956–982. [Google Scholar] [CrossRef]
- Nagel, G.M.; Thambiratnam, D.P. Dynamic simulation and energy absorption of tapered thin-walled tubes under oblique impact loading. Int. J. Impact Eng. 2005, 32, 1595–1620. [Google Scholar] [CrossRef]
- Song, J.; Zhou, Y.; Guo, F. A relationship between progressive collapse and initial buckling for tubular structures under axial loading. Int. J. Mech. Sci. 2013, 75, 200–211. [Google Scholar] [CrossRef]
- Yin, H.F.; Guo, D.L.; Wen, G.L.; Wu, Z.T. On bending crashworthiness of smooth-shell lattice-filled structures. Thin-Walled Struct. 2022, 171, 25. [Google Scholar] [CrossRef]
- Wlodzimierz, A.; Norman, J. Dynamic axial crushing of square tubes. Int. J. Impact Eng. 1984, 2, 179–208. [Google Scholar]
- Yang, M.; Han, B.; Mao, Y.; Zhang, J.; Lu, T.J. Crashworthiness of foam filled truncated conical sandwich shells with corrugated cores. Thin-Walled Struct. 2022, 179, 109677. [Google Scholar] [CrossRef]
- Chen, J.; Li, E.; Li, Q.; Hou, S.; Han, X. Crashworthiness and optimization of novel concave thin-walled tubes. Compos. Struct. 2022, 283, 115109. [Google Scholar] [CrossRef]


| Materials | Density (g/cm3) | Young’s Modulus (GPa) | Poisson Ratio | Yield Strength (MPa) |
|---|---|---|---|---|
| Stainless Steel 316 L | 7.9 | 100 | 0.3 | 670 |
| IPLT | NPLT | Tube | Core | |
|---|---|---|---|---|
| EA (J) | 2236.39 | 1994.35 | 586.87 | 325.20 |
| SEA (J/g) | 16.71 | 14.90 | 7.86 | 5.47 |
| MCF (kN) | 55.91 | 49.86 | 14.67 | 8.13 |
| PCF (kN) | 89.46 | 63.74 | 48.86 | − |
| CFE (%) | 62.50% | 78.22% | 30.02% | − |
| IPLT | NPLT | Tube | Core | |
|---|---|---|---|---|
| EA (J) | 794.54 | 338.35 | 65.05 | 239.26 |
| SEA (J/g) | 8.91 | 3.79 | 1.31 | 6.07 |
| MCF (kN) | 31.78 | 13.53 | 2.60 | 9.57 |
| PCF (kN) | 56.07 | 19.27 | 16.47 | − |
| CFE (%) | 56.68% | 70.21% | 15.79% | − |
| t (mm) | 0.5 mm | 1 mm | 1.5 mm | 2 mm | 2.5 mm |
|---|---|---|---|---|---|
| EA (J) | 1072.21 | 2236.39 | 3636.05 | 4800.73 | 6543.67 |
| SEA (J/g) | 11.05 | 16.71 | 21.34 | 23.02 | 26.61 |
| MCF (kN) | 26.81 | 55.91 | 90.90 | 120.02 | 163.59 |
| PCF (kN) | 33.45 | 89.46 | 159.95 | 216.69 | 272.49 |
| CFE (%) | 80.15% | 62.50% | 56.83% | 55.39% | 60.04% |
| UL C | 0.12 | 0.11 | 0.10 | 0.14 | 0.15 |
| t (mm) | 0.5 mm | 1 mm | 1.5 mm | 2 mm | 2.5 mm |
|---|---|---|---|---|---|
| EA (J) | 510.10 | 794.54 | 1104.52 | 1319.84 | 1468.30 |
| SEA (J/g) | 7.93 | 8.91 | 9.68 | 9.50 | 8.96 |
| MCF (kN) | 20.40 | 31.78 | 44.18 | 52.79 | 58.73 |
| PCF (kN) | 20.42 | 56.07 | 85.53 | 111.73 | 139.38 |
| CFE (%) | 99.92% | 56.68% | 51.68% | 47.25% | 42.14% |
| ULC | 0.24 | 0.18 | 0.26 | 0.20 | 0.20 |
| d (mm) | 0.9 | 1.1 | 1.3 | 1.5 | 1.7 |
|---|---|---|---|---|---|
| EA (J) | 1506.60 | 1786.26 | 2236.39 | 2891.45 | 3824.70 |
| SEA (J/g) | 14.46 | 15.15 | 16.71 | 19.04 | 22.27 |
| MCF (kN) | 37.67 | 44.66 | 55.91 | 72.29 | 95.62 |
| PCF (kN) | 80.93 | 86.38 | 89.46 | 101.90 | 107.70 |
| CFE (%) | 46.55% | 52.70% | 62.50% | 70.94% | 88.78% |
| ULC | 0.14 | 0.12 | 0.11 | 0.12 | 0.16 |
| d (mm) | 0.9 | 1.1 | 1.3 | 1.5 | 1.7 |
|---|---|---|---|---|---|
| EA (J) | 367.76 | 566.50 | 794.54 | 1224.01 | 1476.13 |
| SEA (J/g) | 5.29 | 7.21 | 8.91 | 12.09 | 12.89 |
| MCF (kN) | 14.71 | 22.66 | 31.78 | 48.96 | 59.05 |
| PCF (kN) | 51.01 | 53.00 | 56.07 | 59.19 | 65.74 |
| CFE (%) | 28.84% | 42.75% | 56.68% | 82.72% | 89.82% |
| ULC | 0.29 | 0.26 | 0.18 | 0.20 | 0.18 |
| v (m/s) | 10 m/s | 20 m/s | 30 m/s | 40 m/s | 50 m/s |
|---|---|---|---|---|---|
| EA (J) | 3139.05 | 3240.41 | 3417.13 | 3634.39 | 3890.26 |
| SEA (J/g) | 23.45 | 24.21 | 25.53 | 27.15 | 29.06 |
| MCF (kN) | 78.48 | 81.01 | 85.43 | 90.86 | 97.26 |
| PCF (kN) | 147.69 | 152.66 | 208.71 | 238.32 | 285.14 |
| CFE (%) | 53.14% | 53.07% | 40.93% | 38.13% | 34.11% |
| ULC | 0.11 | 0.13 | 0.16 | 0.19 | 0.19 |
| v (m/s) | 10 m/s | 20 m/s | 30 m/s | 40 m/s | 50 m/s |
|---|---|---|---|---|---|
| EA (J) | 1099.29 | 1120.72 | 1123.46 | 1184.24 | 1265.59 |
| SEA (J/g) | 12.32 | 12.56 | 12.59 | 13.28 | 14.19 |
| MCF (kN) | 43.97 | 44.83 | 44.94 | 47.37 | 50.62 |
| PCF (kN) | 84.73 | 102.68 | 129.55 | 139.99 | 147.13 |
| CFE (%) | 51.89% | 43.66% | 34.69% | 33.84% | 34.40% |
| ULC | 0.24 | 0.31 | 0.30 | 0.29 | 0.27 |
Disclaimer/Publisher’s Note: The statements, opinions and data contained in all publications are solely those of the individual author(s) and contributor(s) and not of MDPI and/or the editor(s). MDPI and/or the editor(s) disclaim responsibility for any injury to people or property resulting from any ideas, methods, instructions or products referred to in the content. |
© 2023 by the authors. Licensee MDPI, Basel, Switzerland. This article is an open access article distributed under the terms and conditions of the Creative Commons Attribution (CC BY) license (https://creativecommons.org/licenses/by/4.0/).
Share and Cite
Tao, C.; Wang, Z.; Liu, Z.; Wang, Y.; Zhou, X.; Liang, X.; Li, H. Crashworthiness of Additively Manufactured Lattice Reinforced Thin-Walled Tube Hybrid Structures. Aerospace 2023, 10, 524. https://doi.org/10.3390/aerospace10060524
Tao C, Wang Z, Liu Z, Wang Y, Zhou X, Liang X, Li H. Crashworthiness of Additively Manufactured Lattice Reinforced Thin-Walled Tube Hybrid Structures. Aerospace. 2023; 10(6):524. https://doi.org/10.3390/aerospace10060524
Chicago/Turabian StyleTao, Chenglin, Zhao Wang, Zeliang Liu, Yuan Wang, Xin Zhou, Xi Liang, and Huijian Li. 2023. "Crashworthiness of Additively Manufactured Lattice Reinforced Thin-Walled Tube Hybrid Structures" Aerospace 10, no. 6: 524. https://doi.org/10.3390/aerospace10060524
APA StyleTao, C., Wang, Z., Liu, Z., Wang, Y., Zhou, X., Liang, X., & Li, H. (2023). Crashworthiness of Additively Manufactured Lattice Reinforced Thin-Walled Tube Hybrid Structures. Aerospace, 10(6), 524. https://doi.org/10.3390/aerospace10060524