Article

Droplet Collection Efficiency Regularity of NACA0012 Airfoil Based on the Eulerian Method

1
Department of Energy and Power Engineering, Tsinghua University, Beijing 100084, China
2
Institute for Aero Engine, Tsinghua University, Beijing 100084, China
3
AECC Sichuan Gas Turbine Establishment, Mianyang 621000, China
4
Beijing Precision Technology Limited Company, Beijing 100084, China
*
Author to whom correspondence should be addressed.
Aerospace 2023, 10(5), 412; https://doi.org/10.3390/aerospace10050412
Submission received: 20 March 2023 / Revised: 26 April 2023 / Accepted: 27 April 2023 / Published: 28 April 2023
(This article belongs to the Section Aeronautics)

Abstract

:
Obtaining droplet collection efficiency (DCE) is vital for icing numerical simulations. A droplet impact model based on the Eulerian two-phase flow model was established in this work to analyze the influence of different incoming flow parameters on DCE. Then, the mathematical regularity of the DCE distribution was explored using the parametric description, and the functional relation of the regularity between the incoming condition and the DCE distribution was accomplished. The results showed that the calculated DCE of NACA0012 and the two-dimensional cylinder matched well with the test data. The incoming flow velocity and droplet size, rather than the liquid water content (LWC) of the incoming flow, affected the collection efficiency significantly. The DCE distribution under different conditions was normalized to the same mathematical form with the peak collection efficiency and maximum position. The mathematical form had a highly normal distribution, which was expressed with good regularity of the Reynolds number and droplet diameter. Regularity can greatly reduce the amount of calculation and improve the calculation accuracy, which plays a positive role in the numerical prediction of the icing problem.

1. Introduction

When an aircraft flies in the clouds and encounters supercooled water droplets, the aircraft surface (e.g., airfoil, fuselage, and tail surface) and the inlet components of the engine may freeze [1,2]. Irregular ices on the airfoil deteriorate the aerodynamic characteristic of the aircraft and affect its stability and maneuverability [3,4]. They may even be brought into the engine by airflow and damage high-speed compressor blades, which is a serious threat to flight safety [5,6]. The methods to obtain icing include a wind tunnel test, flight test, and numerical calculation. The test has the disadvantages of high cost, long cycle, and limited equipment conditions [7,8,9]. Therefore, many countries are committed to studying numerical calculation methods for aircraft icing.
The key step in icing research is to obtain the droplet collection efficiency (DCE). There are two main methods to solve collection efficiency: the Lagrange method and the Eulerian method [10,11]. The Lagrange method tracks the movement of water droplets in the flow field, while the Eulerian method regards the water droplets as a continuous phase [12]. The distribution of water droplet volume fraction and droplet velocity can be obtained by solving the continuity equation and momentum equation of the water droplet phase [13]. The Lagrange method is relatively convenient for two-dimensional or simple geometric surfaces. However, dealing with three-dimensional complex shapes such as multi-segment airfoils or engine inlets is more complex because the release position of the droplet is difficult to determine [14]. The Eulerian method has advantages in this problem and is suitable for solving the collection efficiency of three-dimensional complex surfaces.
Some classic numerical software, such as LEWIS, TRAJICE, and ONERA, use the inviscid potential flow model or the Euler equation with a boundary layer correction to solve the airflow field. Then, the Lagrange method is used to solve DCE [15,16,17,18]. The Euler method has been widely used. Bourgault and Habashi used the Eulerian method to calculate DCE and applied this method to their three-dimensional icing calculation software FENSAP-ICE [19,20]. Most of today’s studies are about the simulation and verification of DCE. For example, Wirogo used the Eulerian method to solve the DCE of typical objects such as cylinders, airfoils, and spheres using the software Fluent [21]. Tong proposed an adaptive numerical diffusion model and modified the Euler model to solve local solution singularity [22]. Iuliano and Brandi calculated the DCE of a multi-section airfoil using the Eulerian method and analyzed the influence of air viscosity on the calculation results [23]. Yoon corrected the influence of wall roughness on DCE and improved the capture accuracy of icing characteristics [24]. Li found that the difference between simulation results and experimental data came from the phase position of local DCE, which is a function of local vortex intensity [25]. Takahashi considered the effects of droplet splashing and fragmentation and studied the performance of DCE on axial compressors [26].
However, the existing method needs to recalculate the DCE distribution for each incoming condition, which brings some troubles to engineering. In fact, the calculation of the flow field and DCE take up the most time when solving the icing process. There is currently little research on the regularity of collection efficiency, and the results cannot judge or predict the distribution of DCE before calculation. This will increase the cost of anti-icing work in engineering and also increase the design cycle of icing experiments on high-altitude platforms. Therefore, the regularity analysis and parametric exploration of DCE need to be carried out in icing research so as to reduce the cost and period of engineering checks or relevant icing experiments.
The Eulerian method was used to establish the governing equation of the water droplet phase in this study, and then the distribution of DCE was solved. As the most commonly used model for icing experiments, the NACA0012 airfoil was chosen as the research object in this study. The effects of different incoming flows on the DCE distribution were analyzed. Meanwhile, we studied the regularity of DCE under different conditions, which conformed to certain characteristics. These methods bring great convenience to the simulation of collection efficiencies.

2. Methods and Numerical Models

2.1. Assumptions

Since one fluid unit contains a sufficient number of droplets, the continuous theory is appropriate for the droplet phase. The volume fraction of water droplets is small under an icing environment (about 1 g/m3). The density of the droplets is much larger than that of air, and the droplet diameter is much smaller than the feature size of the flow field. Therefore, only the effect of air on droplets is considered in the Eulerian method, while the effect of droplets on airflow is ignored. Meanwhile, the air phase and droplet phase can be solved separately and coupled unidirectionally. Based on the above characteristics, the following assumptions are made:
(1)
The distribution of water droplets is uniform, and they are simplified as spheres with medium volume. The average size remains unchanged without breaking during the motion process.
(2)
There is no heat or mass transfer between the droplets and air. The influence of droplets on the air phase is ignored, and the physical parameters of the water droplets will not change.
(3)
The effects of droplet collision, splash, and rebound are ignored, and only the resistance of the air to droplets is considered. In addition, the resistance is steady.
(4)
Gas viscosity does not affect the droplets.
Assumption 3 is based on the fact that icing studies mainly focus on common droplets with a particle diameter less than 50 μm rather than the supercooled large droplet (SLD) with a diameter larger than 50 μm. The existing icing theory does not consider the effect of SLD dynamic characteristics.

2.2. Governing Equation for Airflow

The three-dimensional Reynolds averaged Navier–Stokes equation (RANS) is used to calculate the airflow field. The ideal gas equation of state and the enthalpy equation are introduced to close the equations. The conservation equations for airflow are described as follows:
(1) Continuity equation:
ρ t + ( ρ u i ) x i = 0
(2) Momentum equation:
t ( ρ u i ) + x j ( ρ u j u i ) = p x i + τ i j x j
(3) Energy equation:
t ( ρ E ) + x j ( ρ u j H ) = x j ( u i τ i j q ˙ j )
The Spalart–Allmaras turbulence model and Boussinesq assumption are used to establish the relationship between the eddy viscosity coefficient and the transport variables. Compared with the two-equation turbulence model, the S-A model requires less computation and better stability, and the equation for the S-A model at one point is not affected by the solution of other points.

2.3. Equation for Droplet Motion and Impact

The droplet volume fraction α is introduced to present the proportion of the droplet volume in the total volume per unit. Combined with the above assumptions, the kinematic equation for water droplets is obtained as:
α ρ w t + ( α ρ w u w ) = 0
α ρ w u w t + ( α ρ w u w × u w ) = α ρ w g + F
where uw is the velocity vector of droplets and F is the force of air on droplets, which can be uniformly written as:
F = α ρ w f τ p ( u u w )
where τ p = ρ w d p 2 / 18 μ is slack time; dp is the average radius of water droplets; and f is the function of Reynolds number. The commonly used models include the Wen–Yu [27] and Gidaspow [28] models, and the form in Ref. [8] is used in this work.
f ( Re r ) = 1 + 0.15 Re r 0.687 + 0.0175 Re r 1 + 45000 Re r 1.16
Re r = ρ | u u w | d p μ

2.4. Boundary Condition

The impact surface has different properties for air and droplets. It is an ordinary solid wall for air; however, it is only allowed to enter and leave in one direction for water droplets. Supercooled droplets are very unstable under freezing conditions: they will freeze immediately after hitting the wall or adhere to the wall in the form of water films. If the splash of water droplets is not considered (see assumption 3), droplets hitting the wall should be excluded from the calculation domain. Therefore, the treatment of boundary conditions in the impact zone and the non-impact zone is different.
The following boundary conditions are used for the droplet motion equation on the impact wall:
α b = α ,   u w b = u w ,   if   u w n > 0
α b = α min ,   u w b = 0 ,   i f   u w n 0
where α and uw are the physical quantities of droplets at the center of the first layer grid near wall b; αmin is the lower limit of the specified volume fraction; and n is the normal direction outside the grid. Equations (9) and (10) point out that if the movement speed of water droplets points to the wall, (α, uw) is the wall boundary value obtained using zero gradient extrapolation; otherwise, (αmin, 0) is the wall boundary value.

2.5. Collection Efficiency Definition

There are three main parameters that measure the impact characteristics: impact limit, total collection efficiency Em, and local collection efficiency β. The positions of Su and St represent the upper and lower limits, respectively, and the area between St and Su is impacted by droplets (see Figure 1) [17].
Total collection efficiency Em is defined as the ratio of the actual droplet mass hitting the surface to the maximum possible droplet mass, and the maximum possible droplet mass is the droplet that will hit the surface along a straight line. Em can be expressed as:
E m = y o H
Local collection efficiency β is the ratio of the actual water collected in the local area to the maximum possible water that can be collected [21,22]. This parameter can reflect the impact range and the distribution of collected water. It is an important parameter affecting the final ice amount and is defined as:
β = Δ y 0 Δ s
β is usually solved with:
β = α n u n | u |
where u and n are the local droplet velocity vector and the normal vector of the impact surface, respectively; u represents the droplet velocity vector of free flow; and αn is the relative volume fraction of droplets and is defined as:
α n = α α = α ρ w L W C
where α is the local droplet volume fraction; α is the volume fraction of water droplets in free flow; and LWC is the liquid water content in the air.
Since the Eulerian method is based on the assumption of uniform diameter, the median volume diameter (MVD) is usually used in practice for which the water content of droplets smaller than the median is equal to the content of droplets larger than the median [29]. In addition, for the case of a certain diameter distribution, we can also solve the efficiency of each diameter, and a more precise collection efficiency can be obtained with the following formula:
β = i = 1 N p i β i
where pi is the water content proportion of droplets with the i-th diameter (di) [29].

3. Results and Verification of the Eulerian Method

3.1. NACA 0012 Airfoil

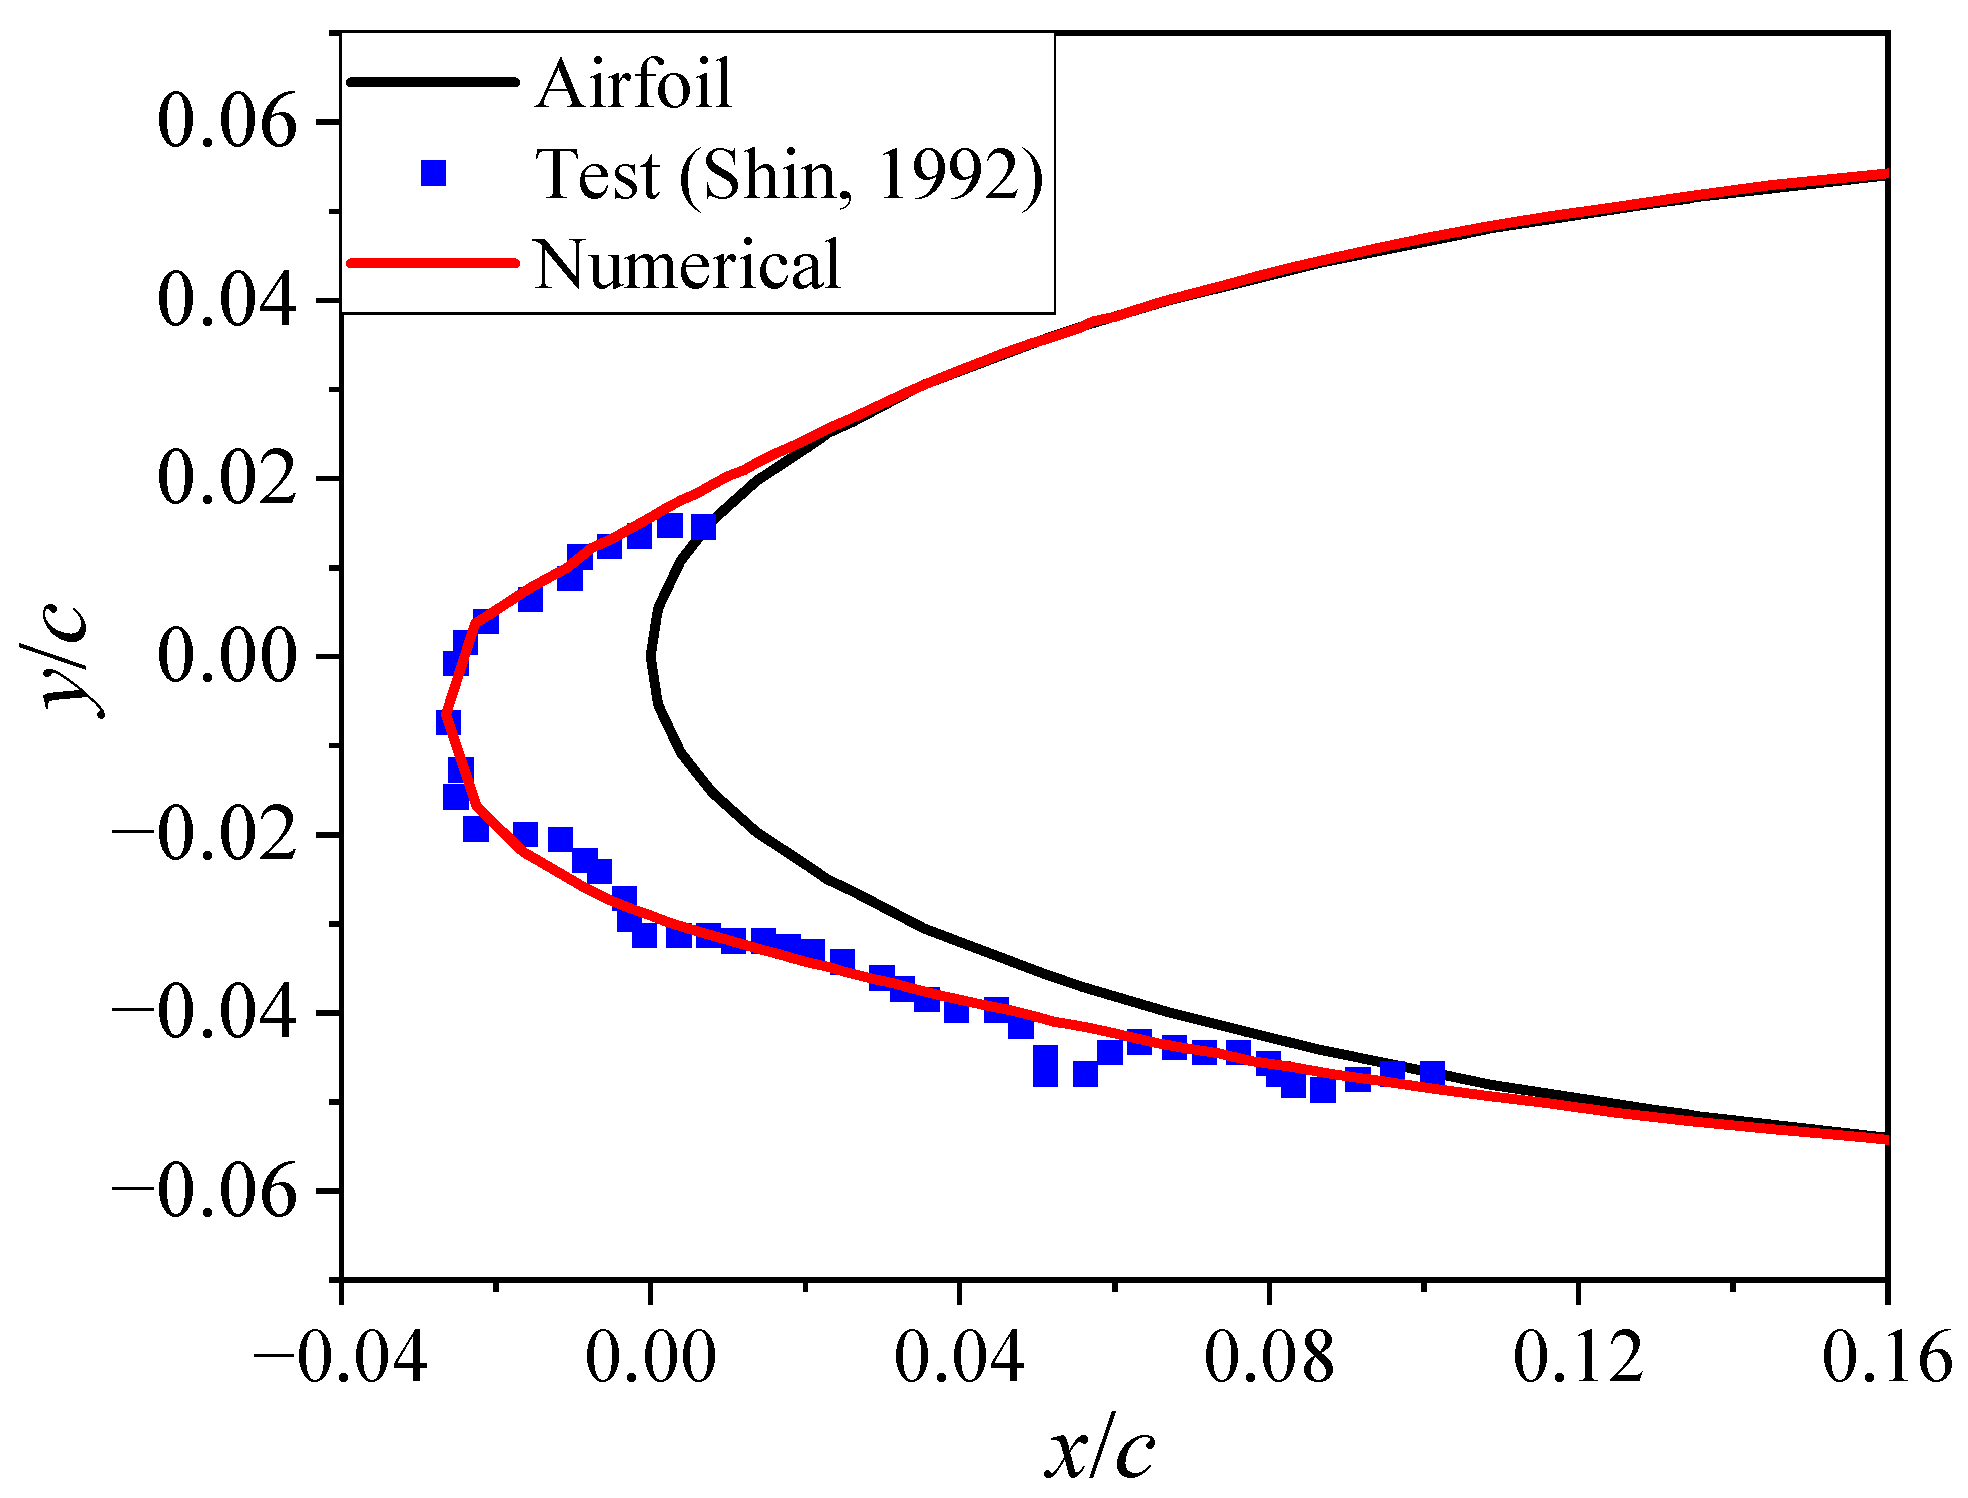
The corresponding program was developed using C++ to solve the characteristics of airflow and droplet motion in this study. The calculation was carried out using typical NACA0012 airfoil to verify the accuracy of the numerical method. The test data for the droplet impact characteristics of the airfoil are relatively complete in the published literature. For example, NASA has carried out corresponding test research on the droplet impact characteristics of NACA0012, which has become an important comparison standard in icing research [15,16].
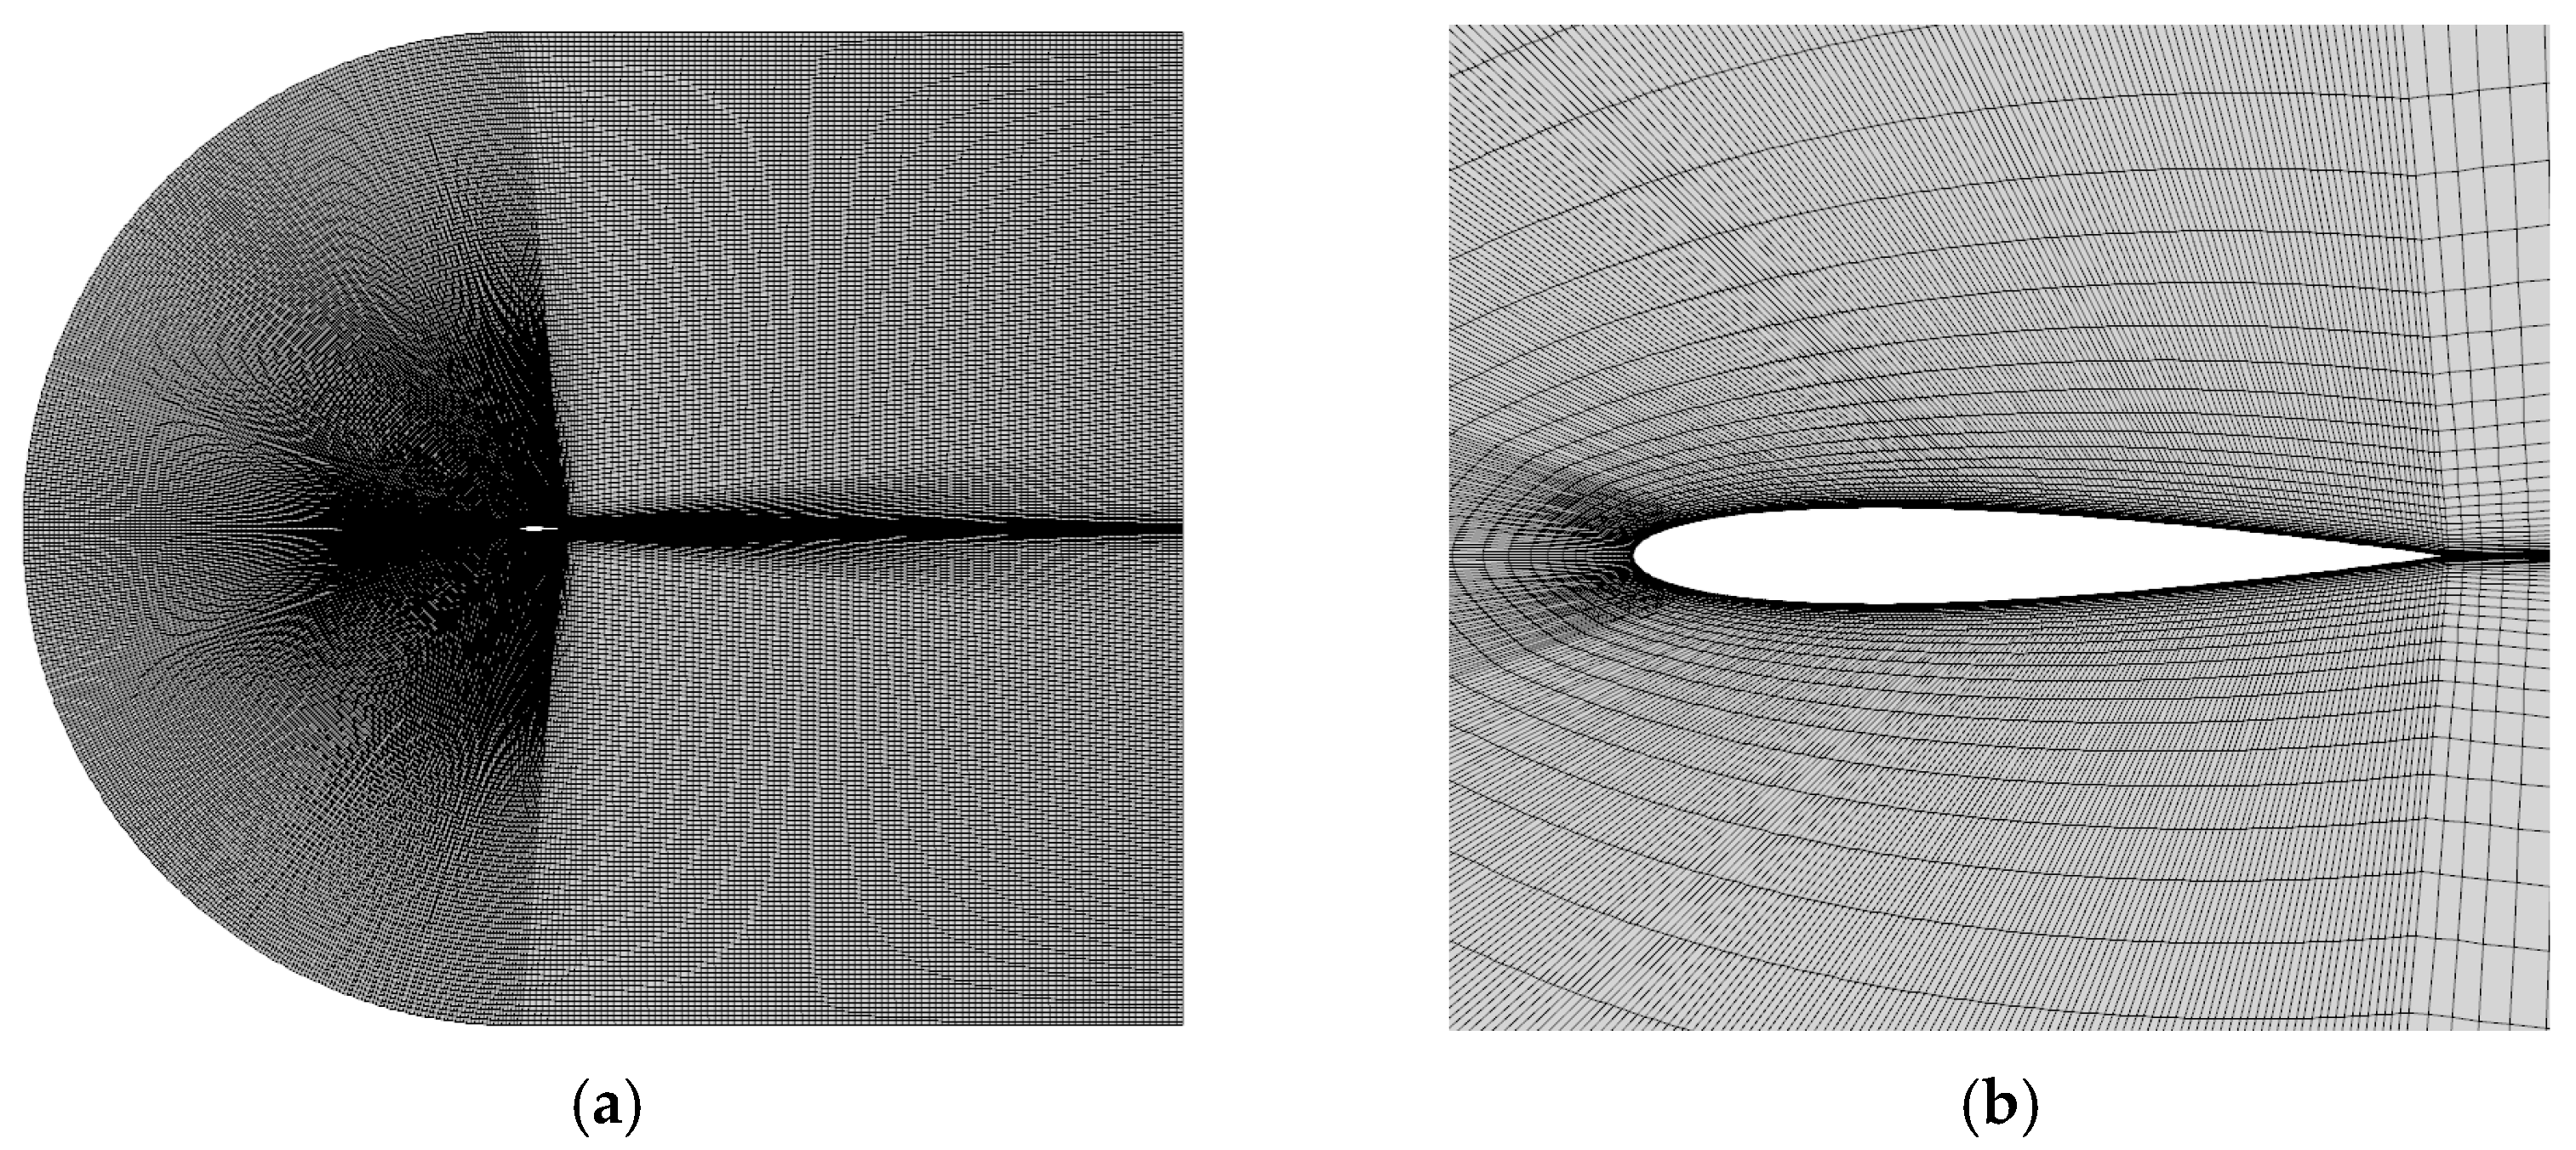
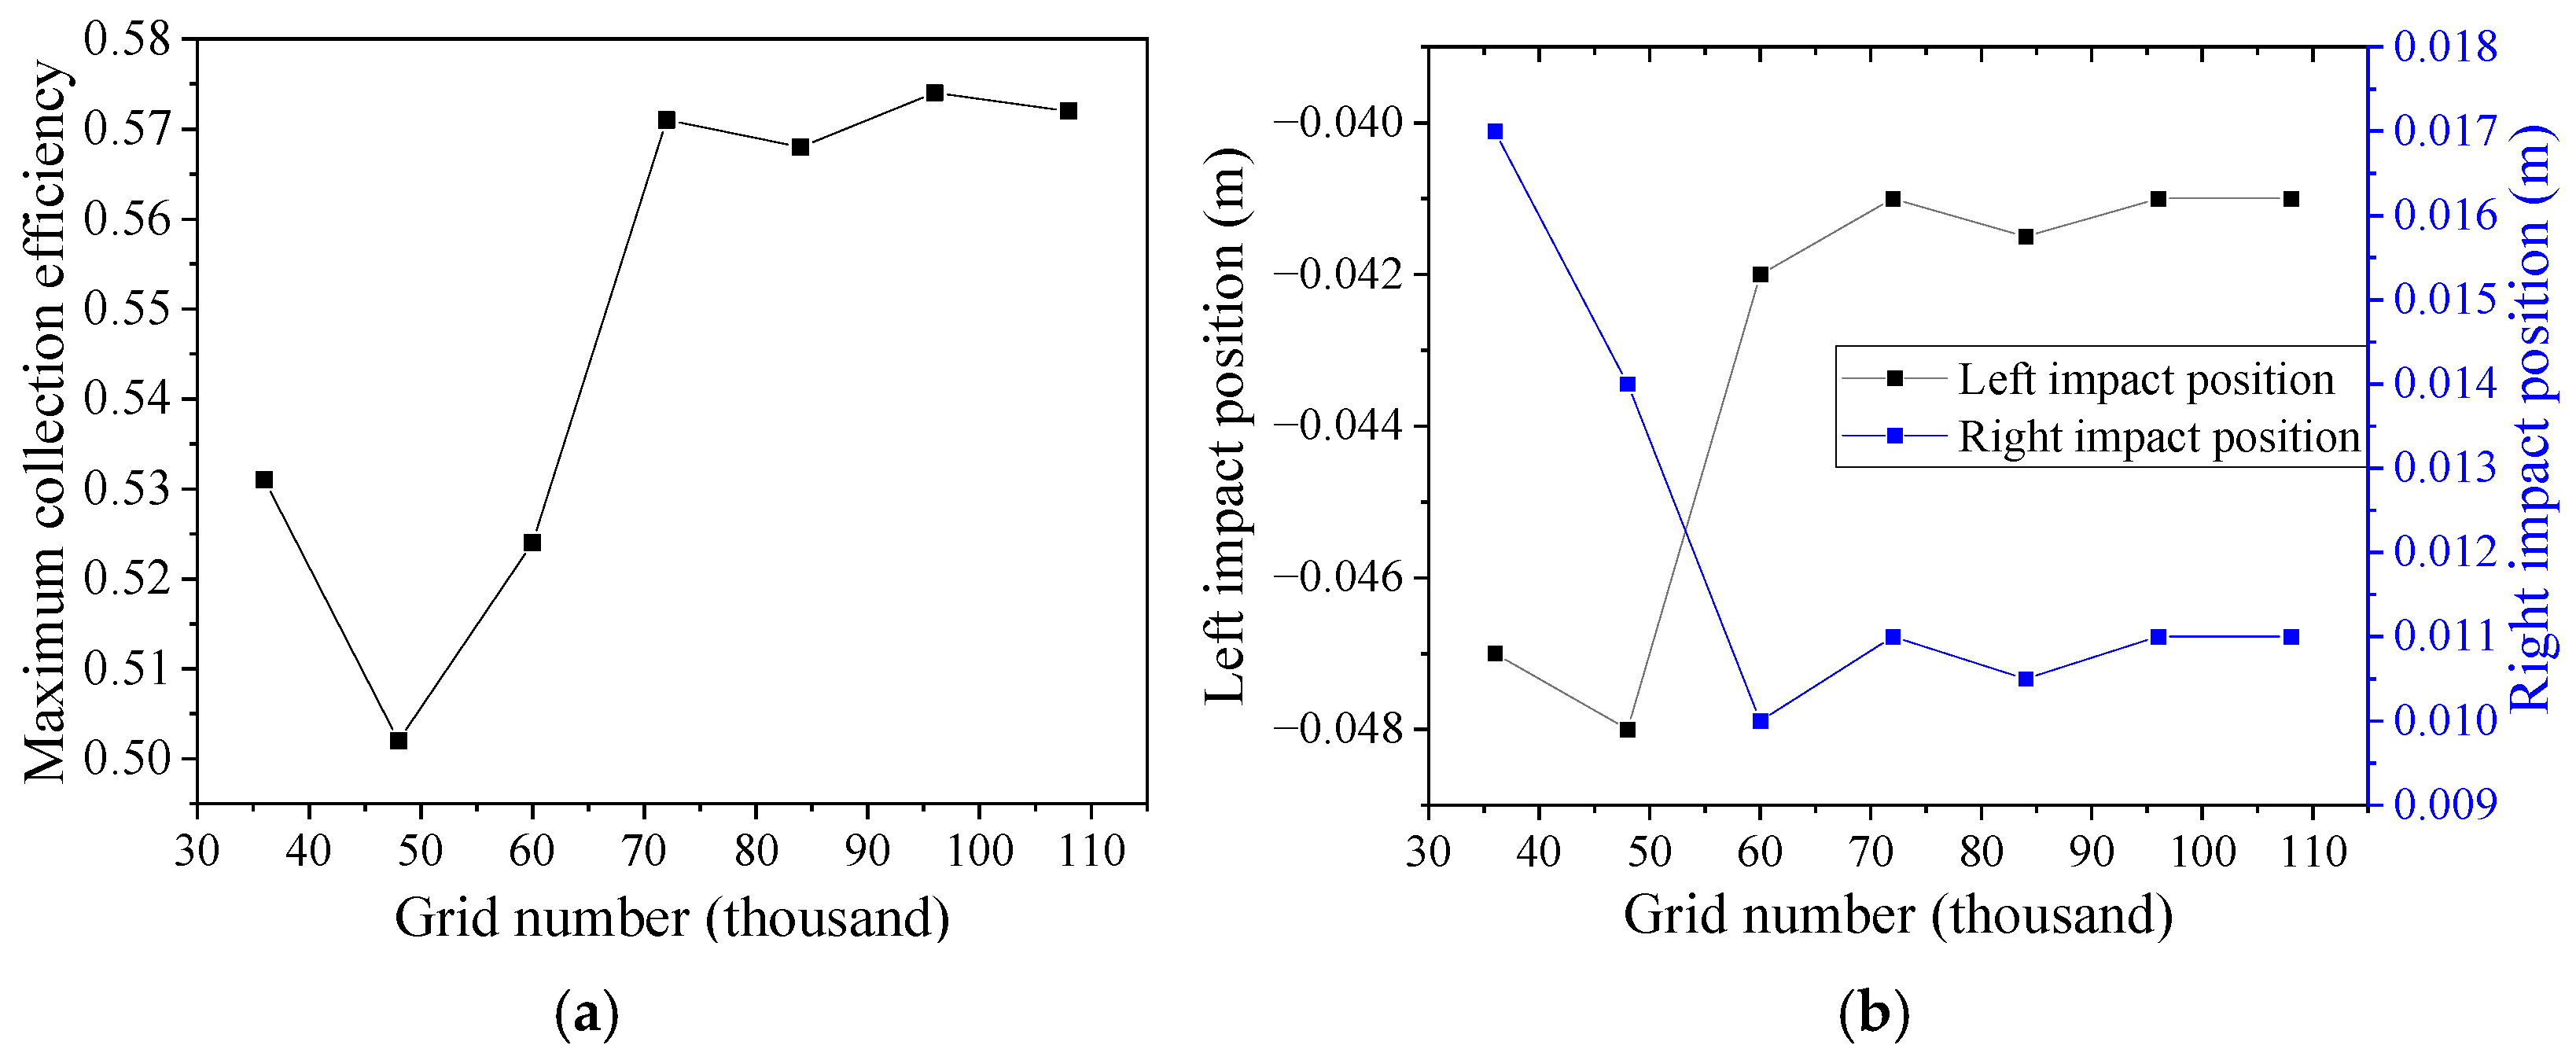
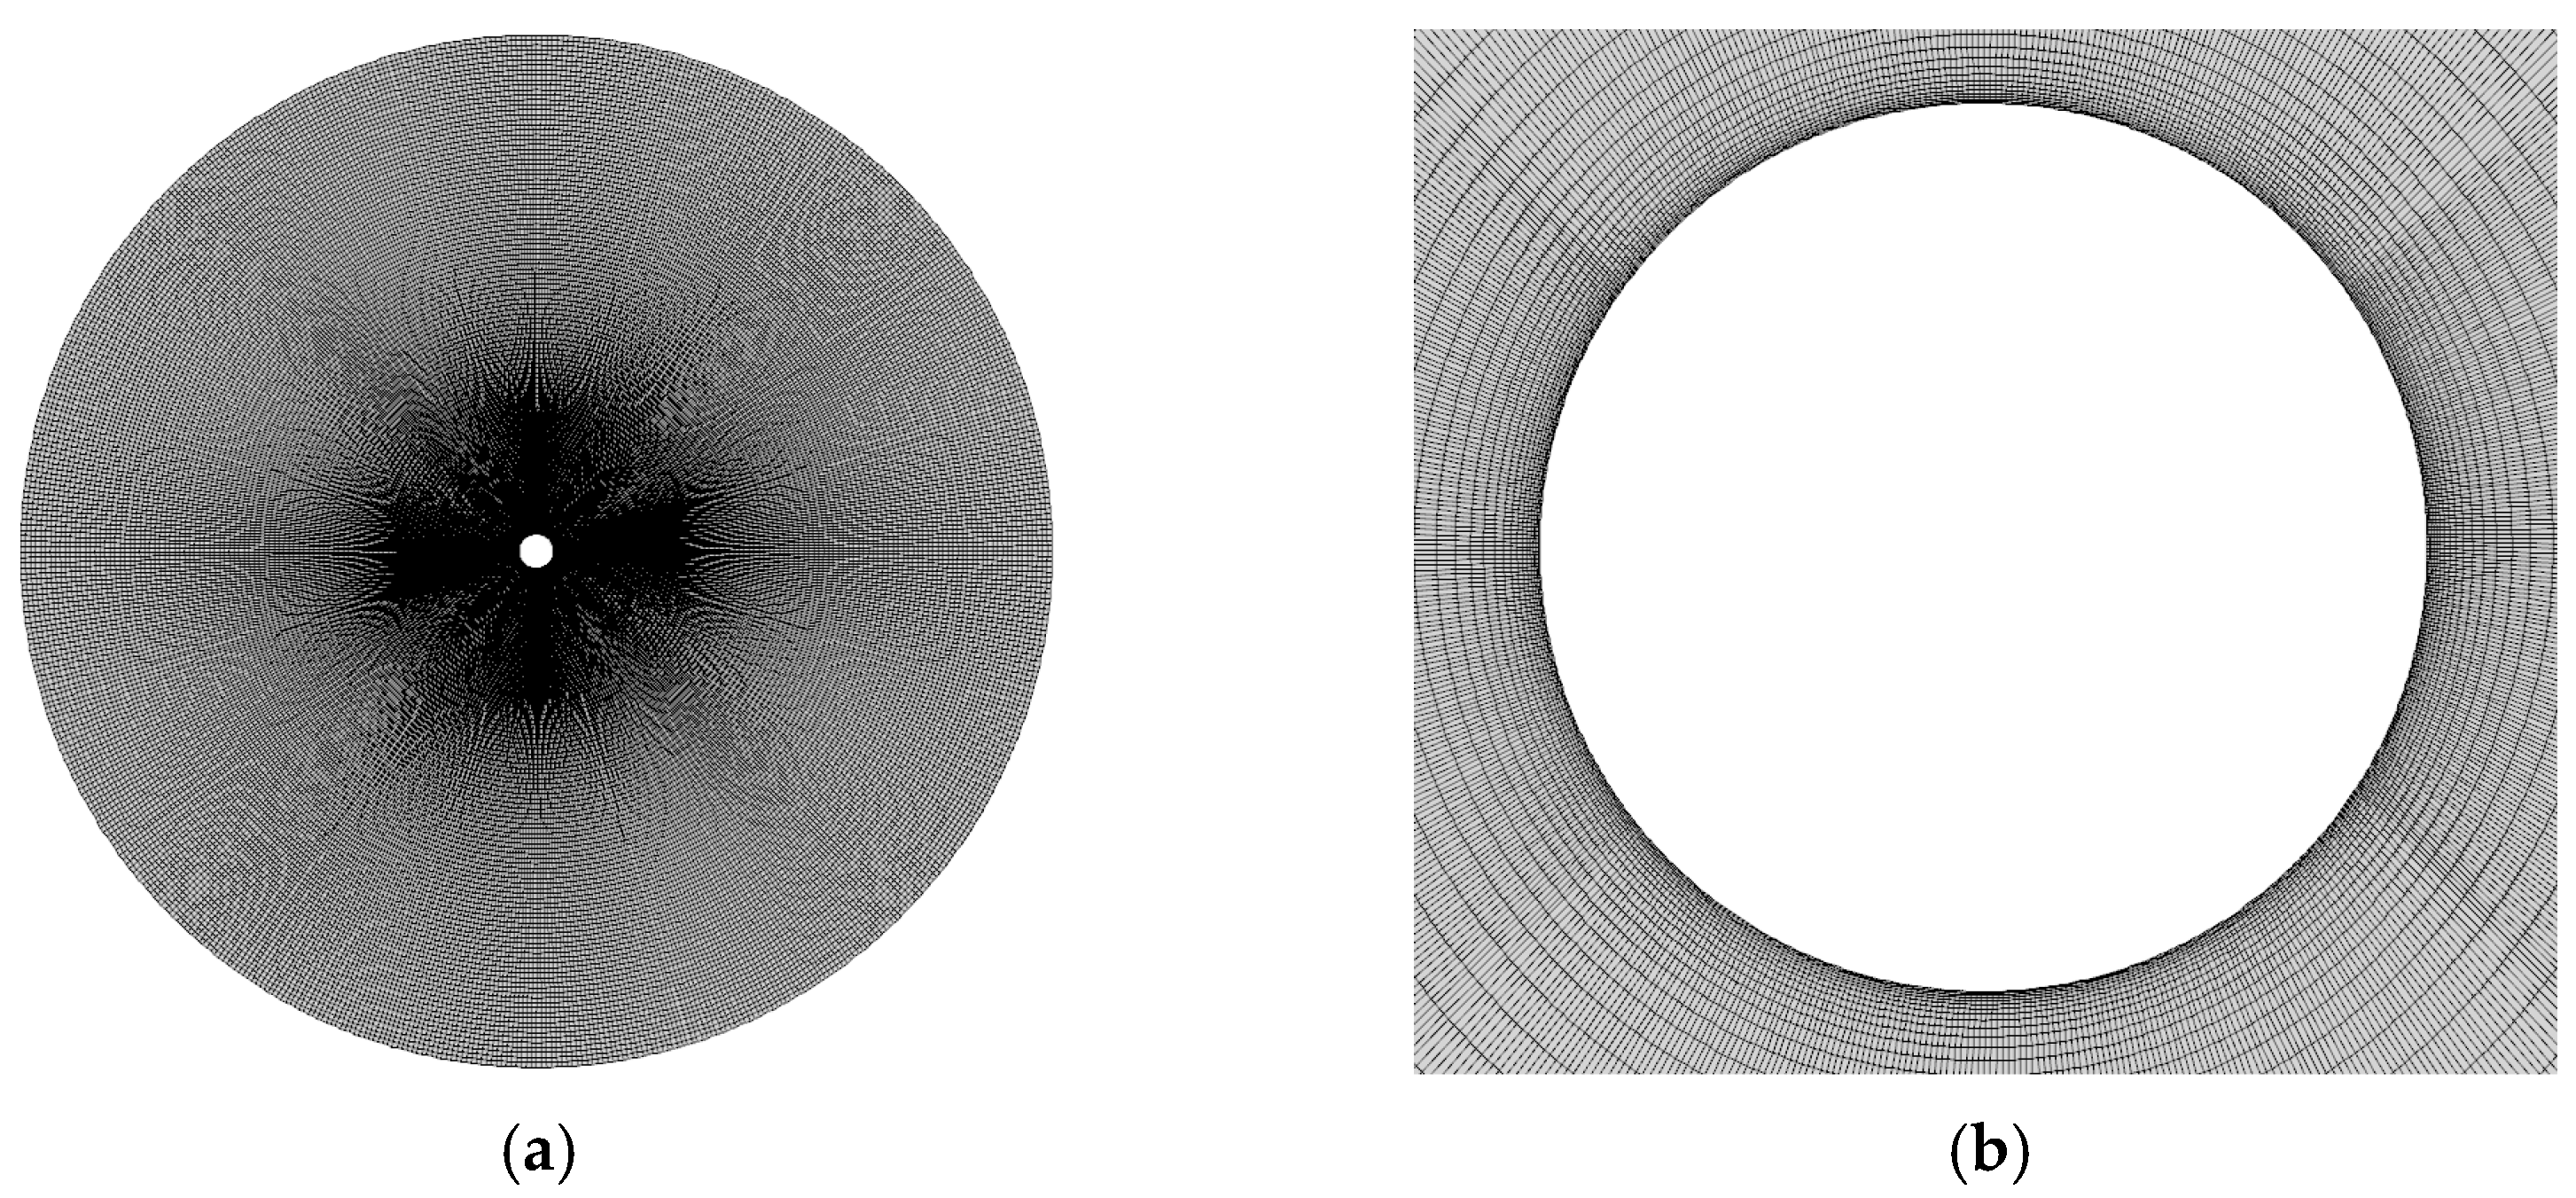
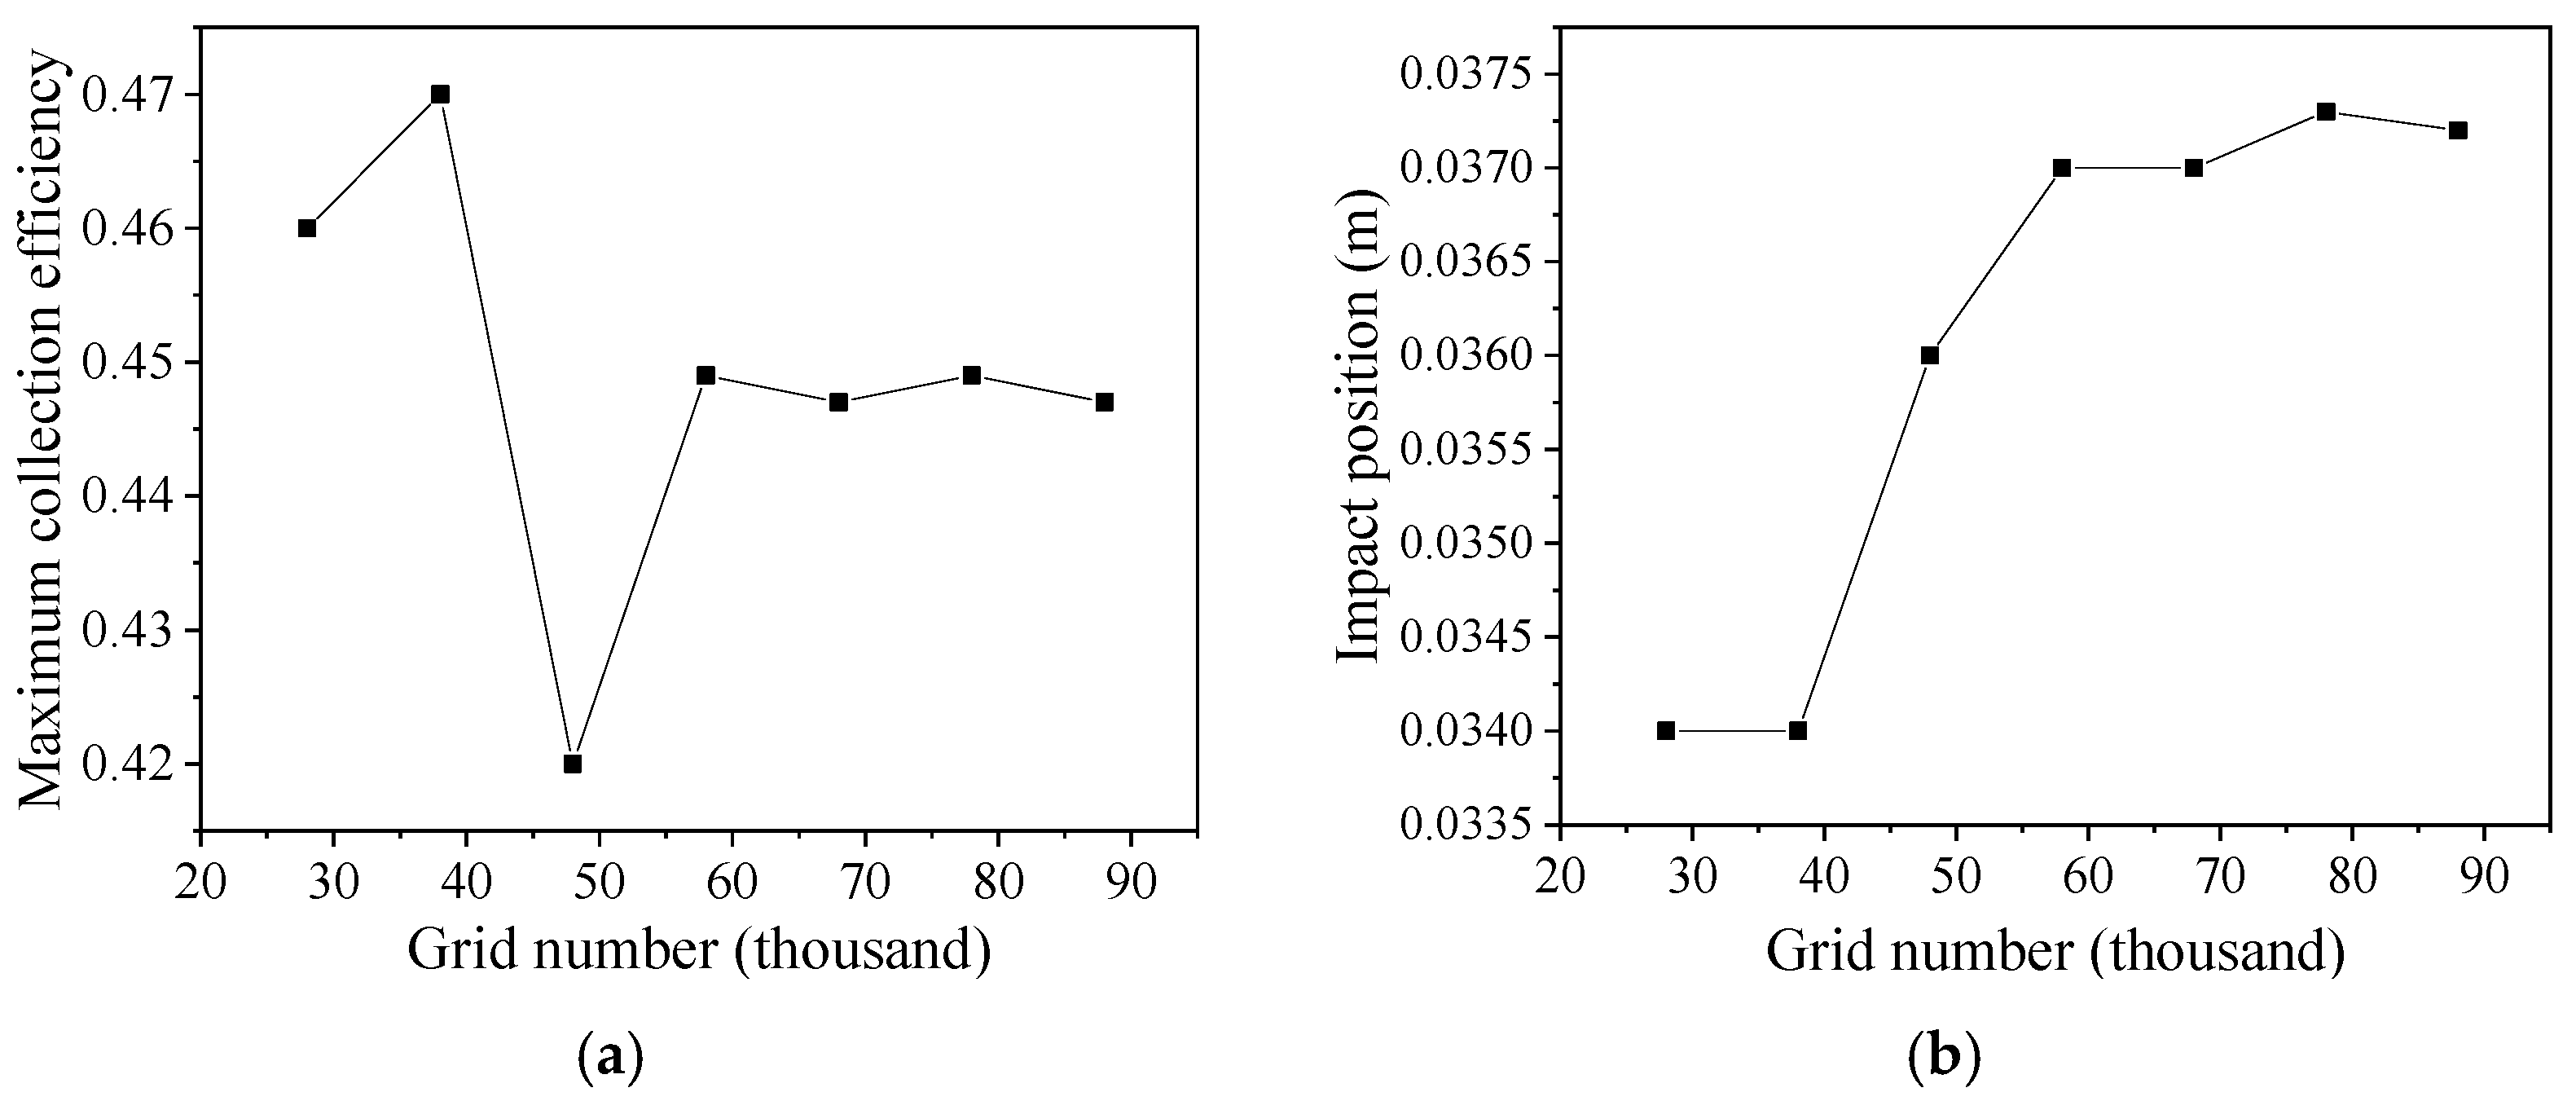
The calculation conditions are as follows: the chord length of the NACA0012 airfoil is 1 m with a span length of 0.5 m, an incoming Mach number of 0.4, an attack angle of 5°, a temperature of 300 K, and a pressure of 101,325 Pa. The liquid water content (LWC) is 1 g/m3, and the droplet diameter is 16 μm. The grid is generated using the software ICEM 2020 R1, in which the O-block with a structured grid is used to divide, and the total number of grids is 72,038 (see Figure 2). Since DCE is mainly concentrated on the leading edge, the leading edge of the airfoil is refined. A grid independence study was also conducted to ensure effectiveness, as shown in Figure 3.
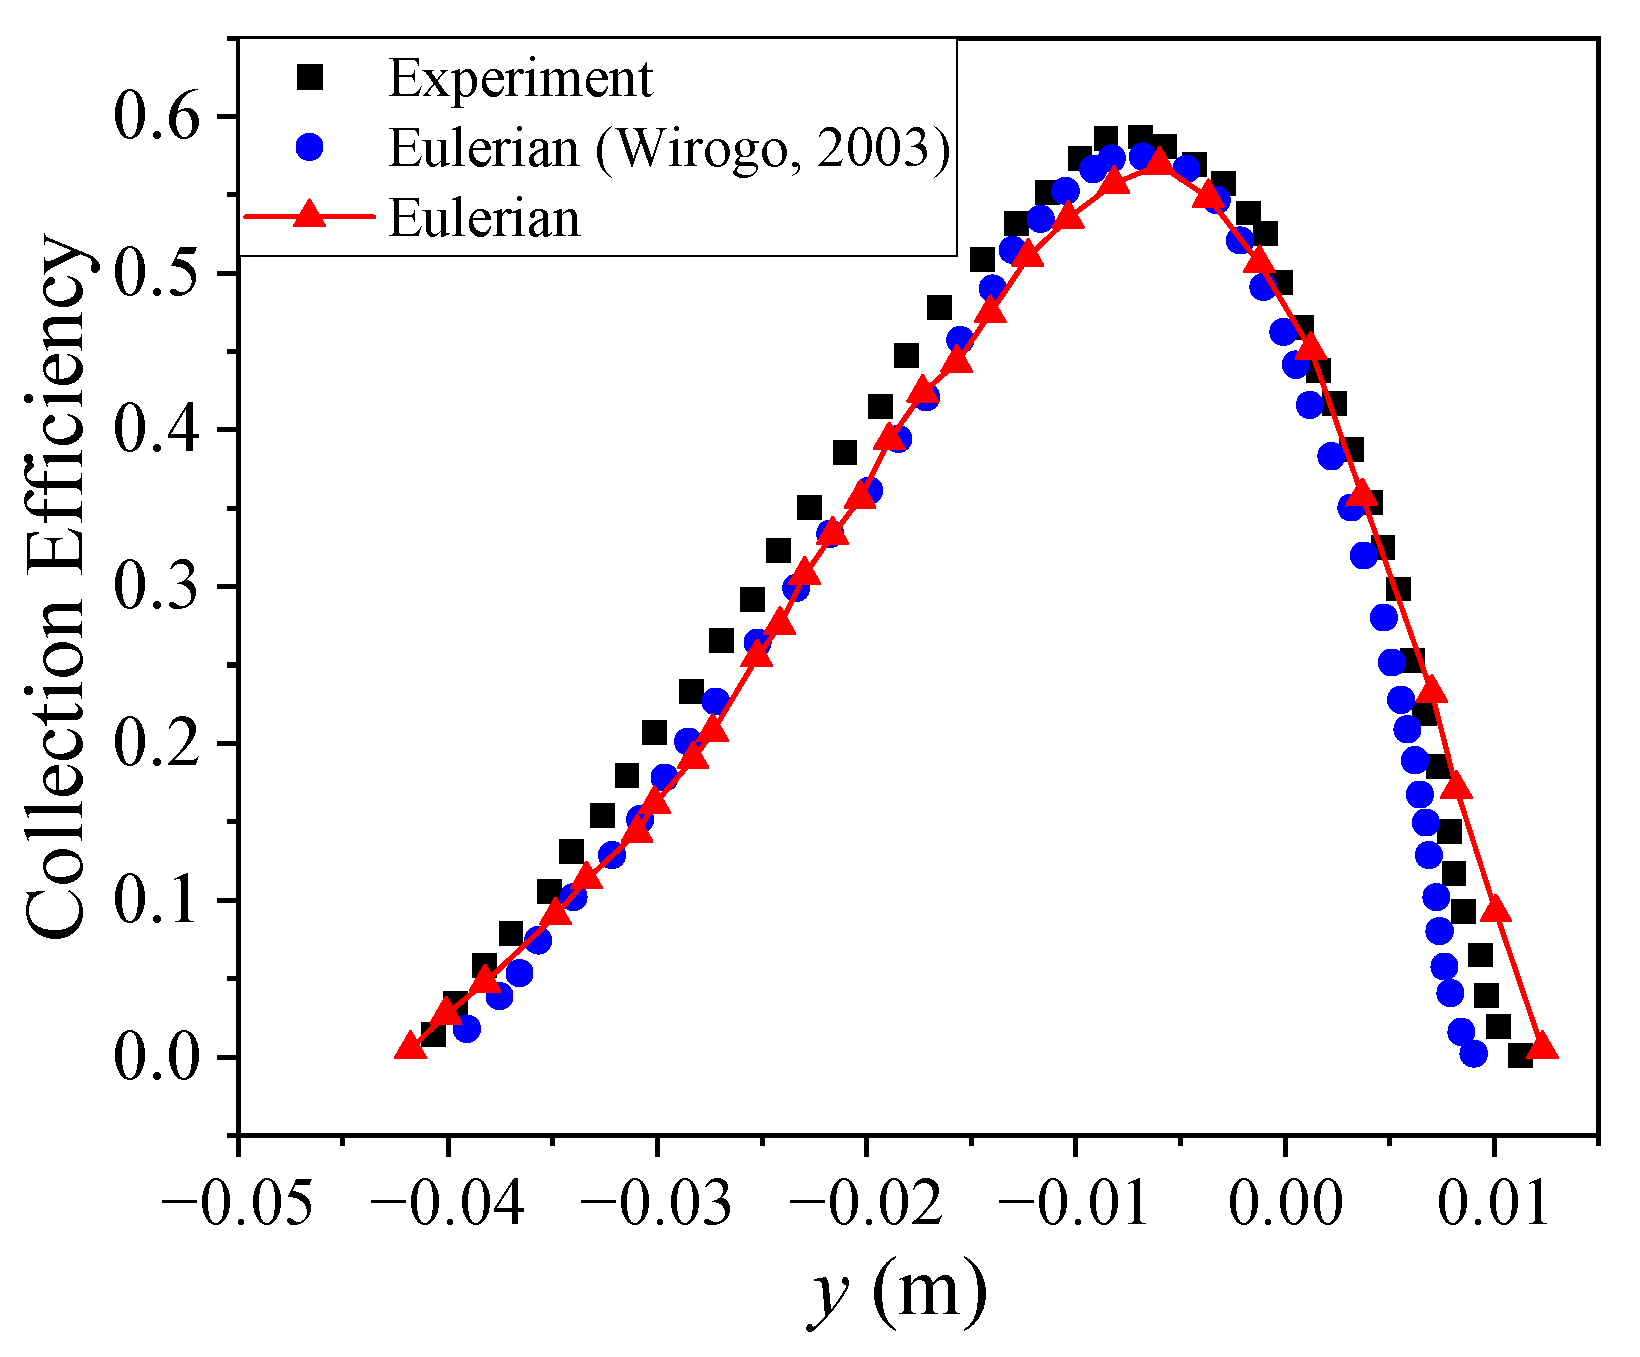
Figure 4 shows a comparison of the DCE with corresponding test results. On the whole, the shapes and trends in the curves are in good agreement, and the maximum collection efficiency is obtained at the lower airfoil position of y = −0.0069 m. As for the impact maximum position, the maximum coordinates on both sides of the test are −0.041 and 0.011 m, respectively, while those obtained in this study are located at −0.042 and 0.012 m. The maximum collection efficiency obtained in the experiment is 0.587, while that obtained in this work is 0.571. The deviations between curves are all less than 5% at other locations.
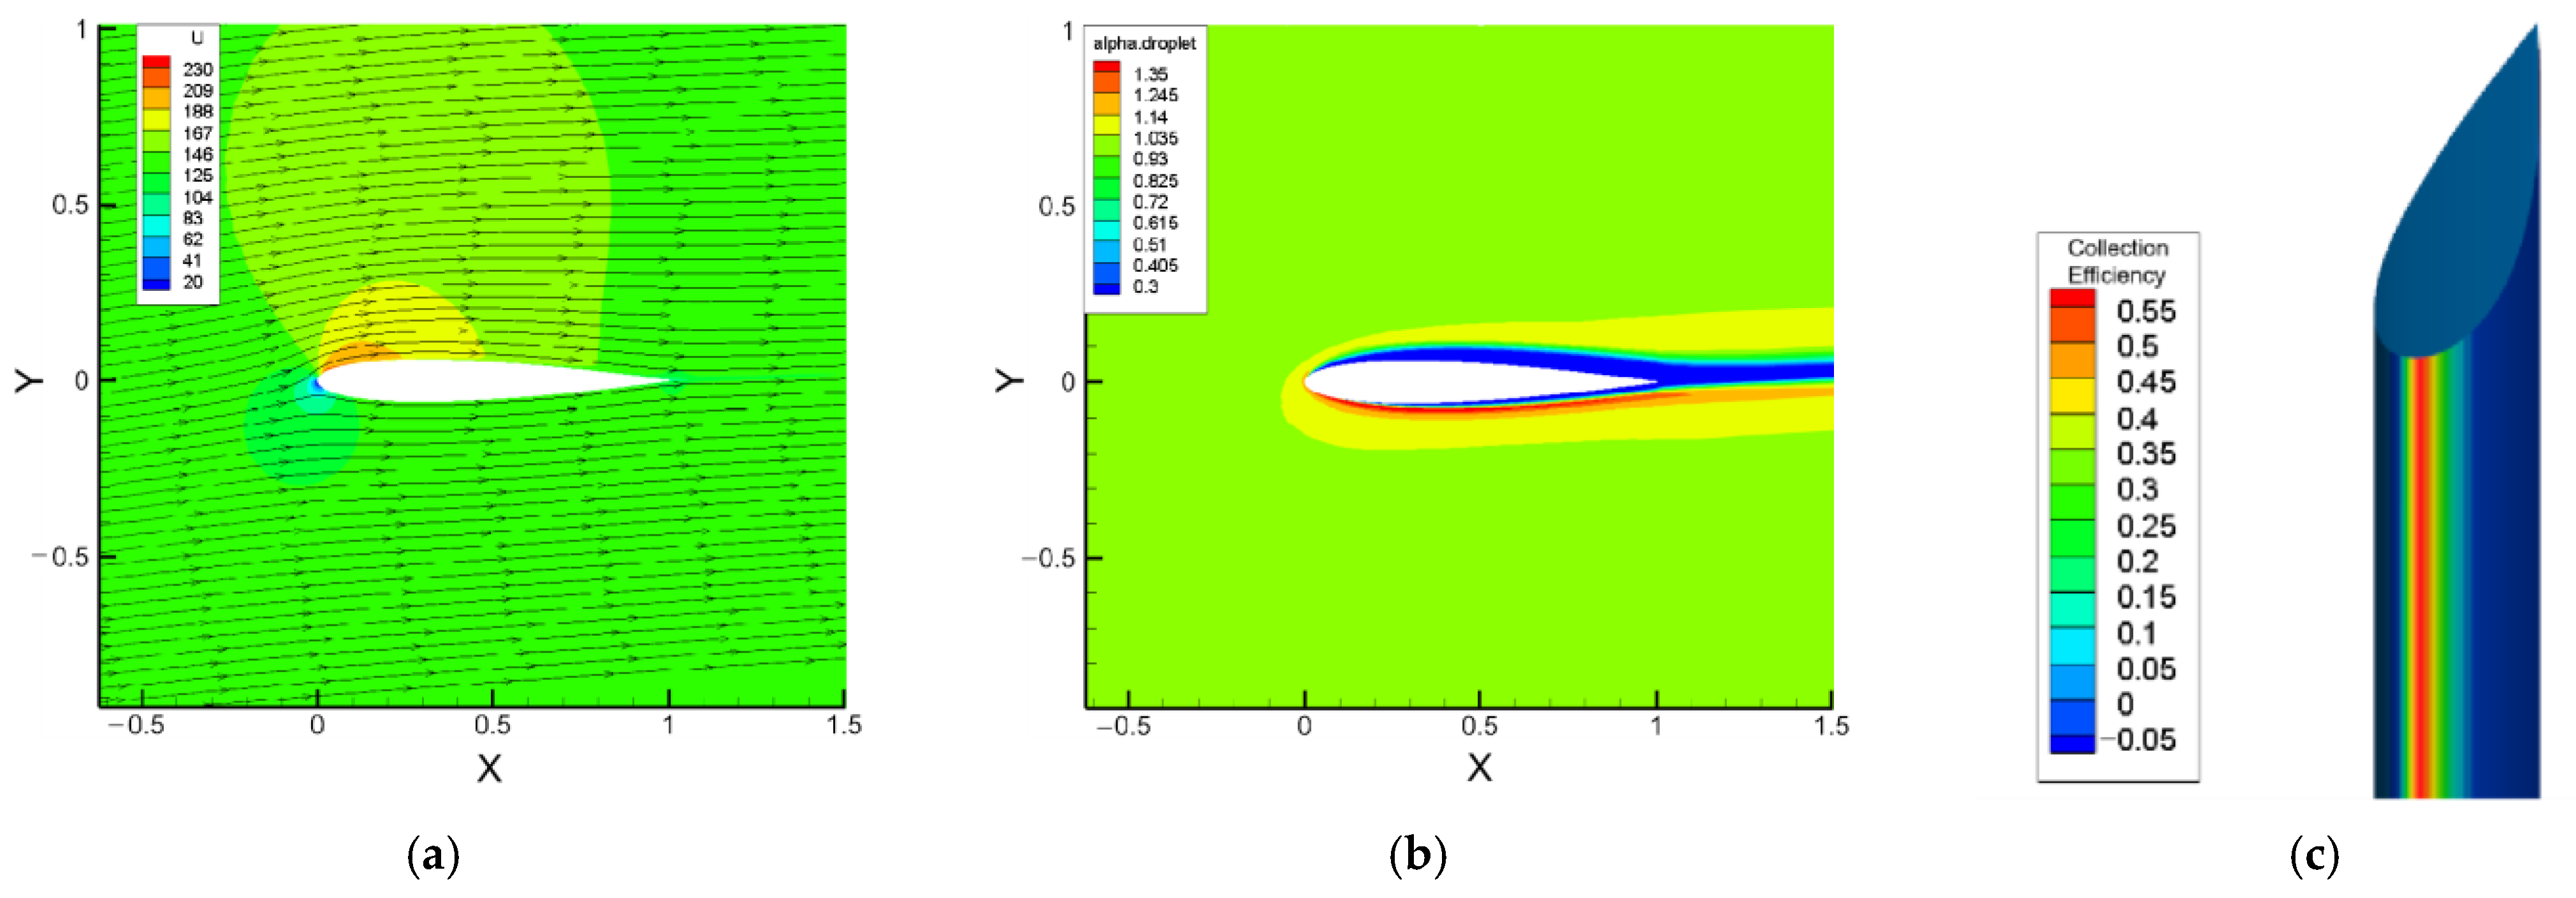
Figure 5 shows the distributions of physical quantities on the flow field and airfoil. The airflow stagnates below the leading edge of the airfoil due to the attack angle, and the peak efficiency value is obtained. The droplet volume fraction figure shows that a large shielding area is formed at the tail edge, and the shielding area on the upper surface is very significant, which is different from the flow distribution of airflow. The droplet does not flow along the wall after the maximum position like the airflow, which is determined by the wall boundary conditions of the droplet and airflow. Airflow adopts the non-slip wall, while the water drop adopts the permeable wall. In addition, the influence of viscosities is considered in the movement.
Calculating collection efficiency is the key step in the icing solution, which determines the accuracy of the icing result. The icing process for the NACA0012 airfoil is simulated after the verification of collection efficiency, in which the Messinger model is used in the icing solution [30]. The modified Stanford model is used to calculate the momentum and heat transfer coefficient of the rough wall surface, thus realizing the ability to solve the flow and impact effects of the rough wall surface after icing [31]. The icing shape calculated in this paper is in good agreement with NASA test results (see Figure 6), which further proves the importance of collecting efficiency for icing accuracy.

3.2. Cylinder

A two-dimensional cylinder is also used to verify DCE. The calculation conditions are as follows: the diameter of the cylinder is 0.1016 m with an incoming flow velocity of 80 m/s, a temperature of 300 K, a pressure of 89,867 Pa, and an average droplet diameter of 16 μm. The O-block is used for grid generation: the calculation domain is a large circle with a diameter of 20 times the diameter of the cylinder, and the number of grids is 57,882 (see Figure 7). Meanwhile, the results of the grid independence research are presented in Figure 8.
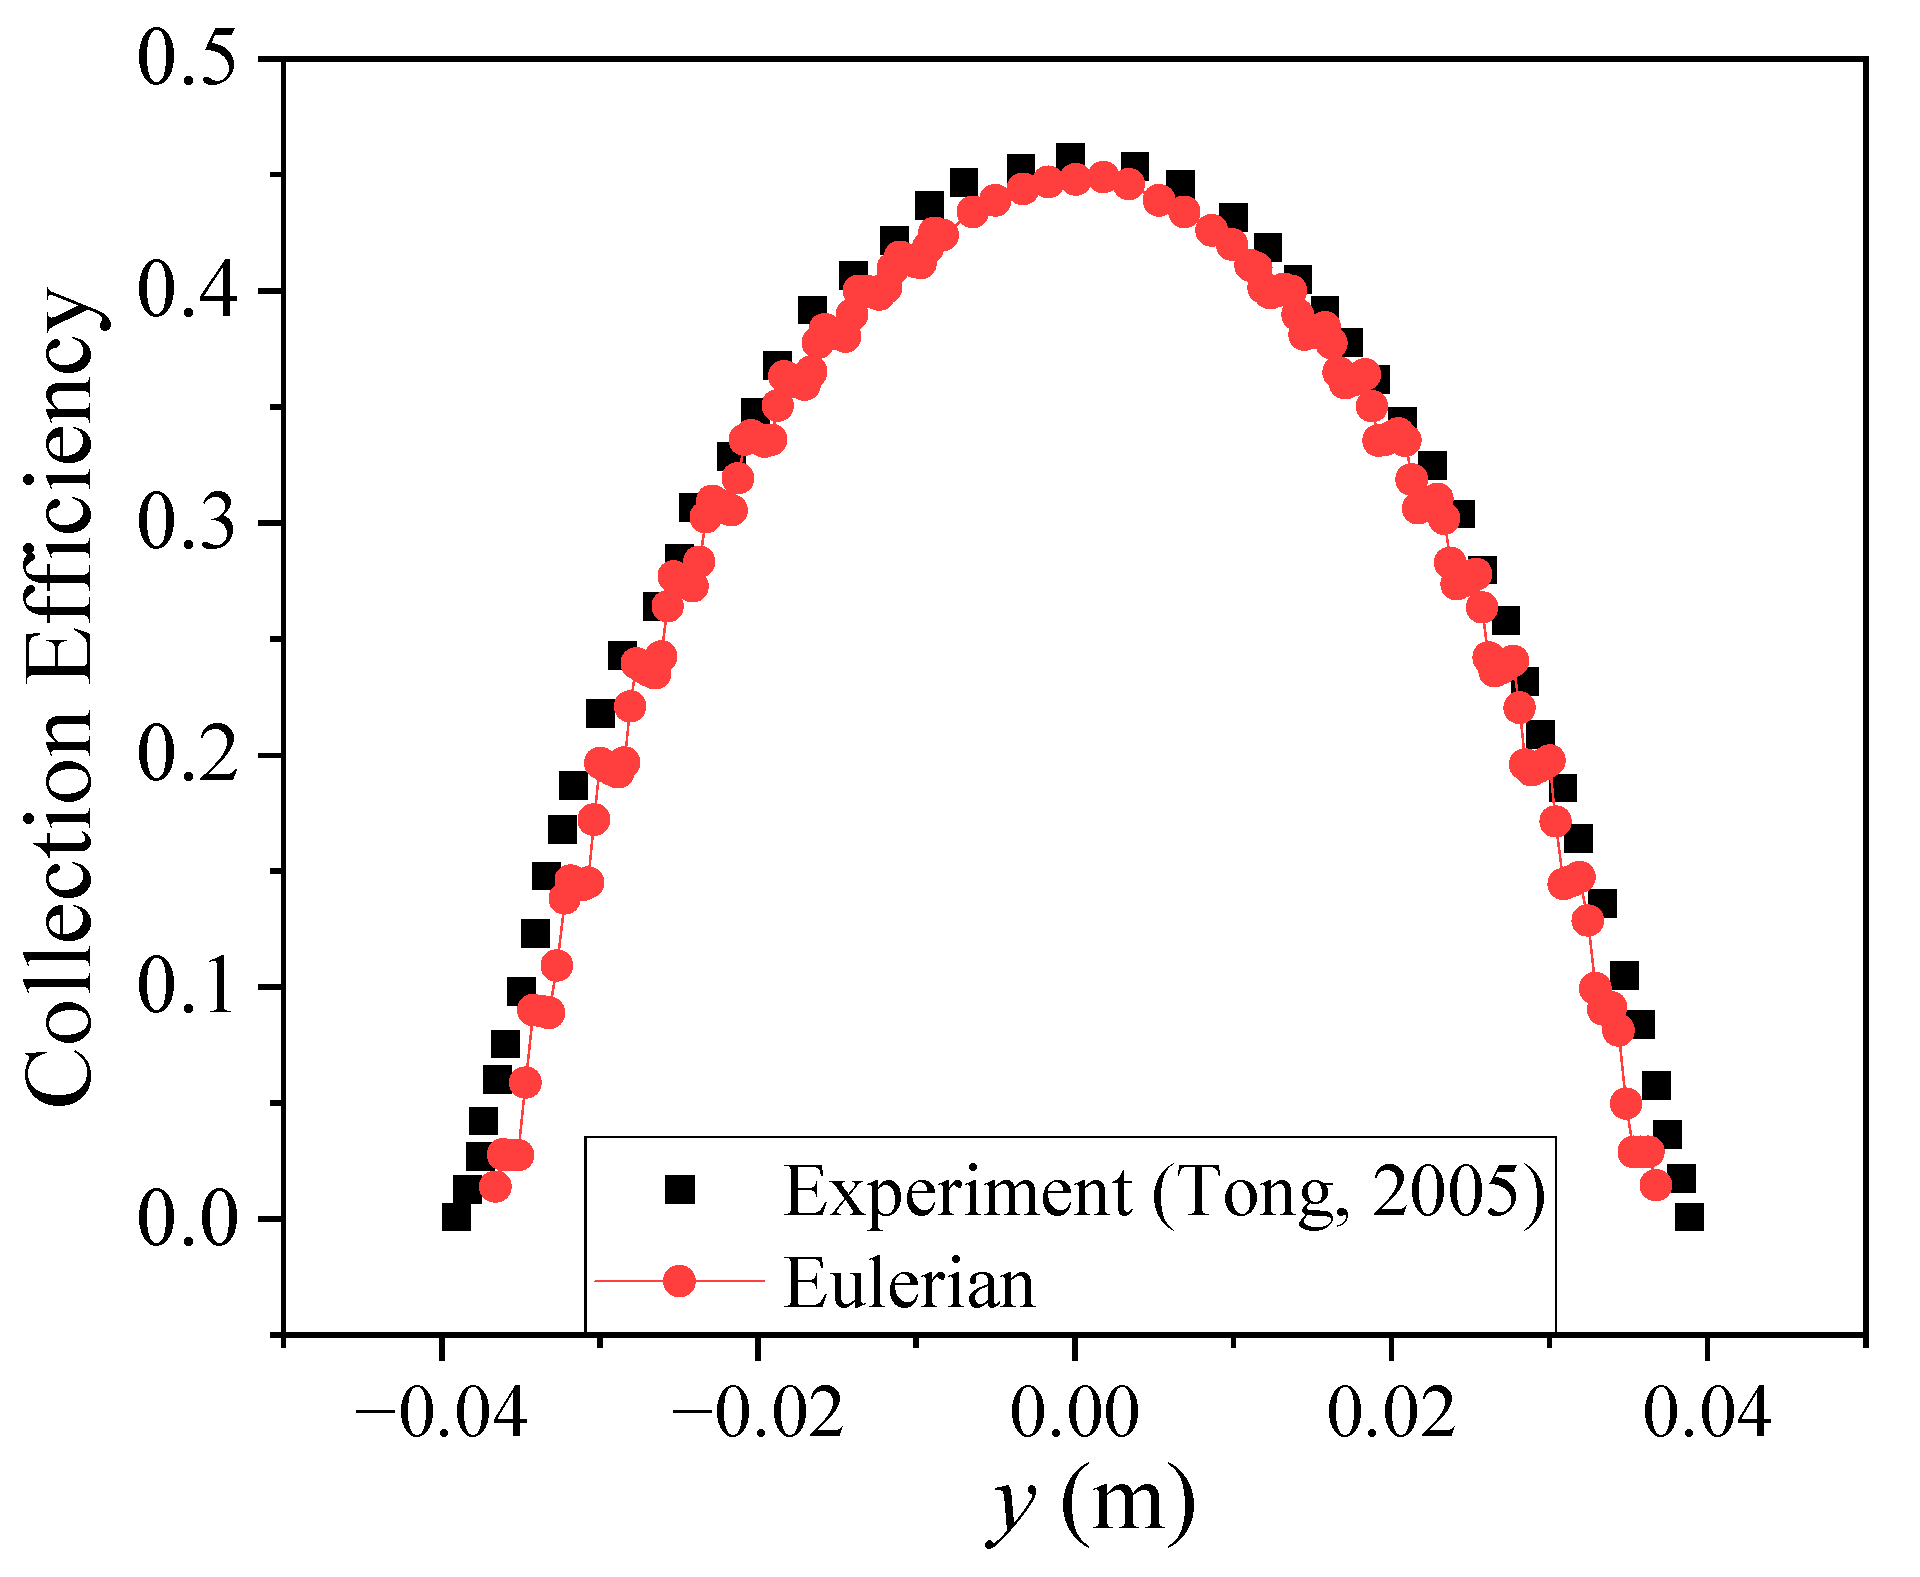
Figure 9 shows the DCE comparison between the calculation and the experiment in Ref. [22]. The trend in the collection efficiency obtained is consistent, and the numerical deviation also meets the requirements. Specifically, the research result and test value are 0.449 and 0.458 for the peak value of collection efficiency, respectively; the research result and literature value are 0.037 and 0.039 for the maximum position, respectively. Therefore, combined with the verification results for NACA0012 above, the collection efficiency obtained in this study can be well verified with the test values and meet the requirements of research.
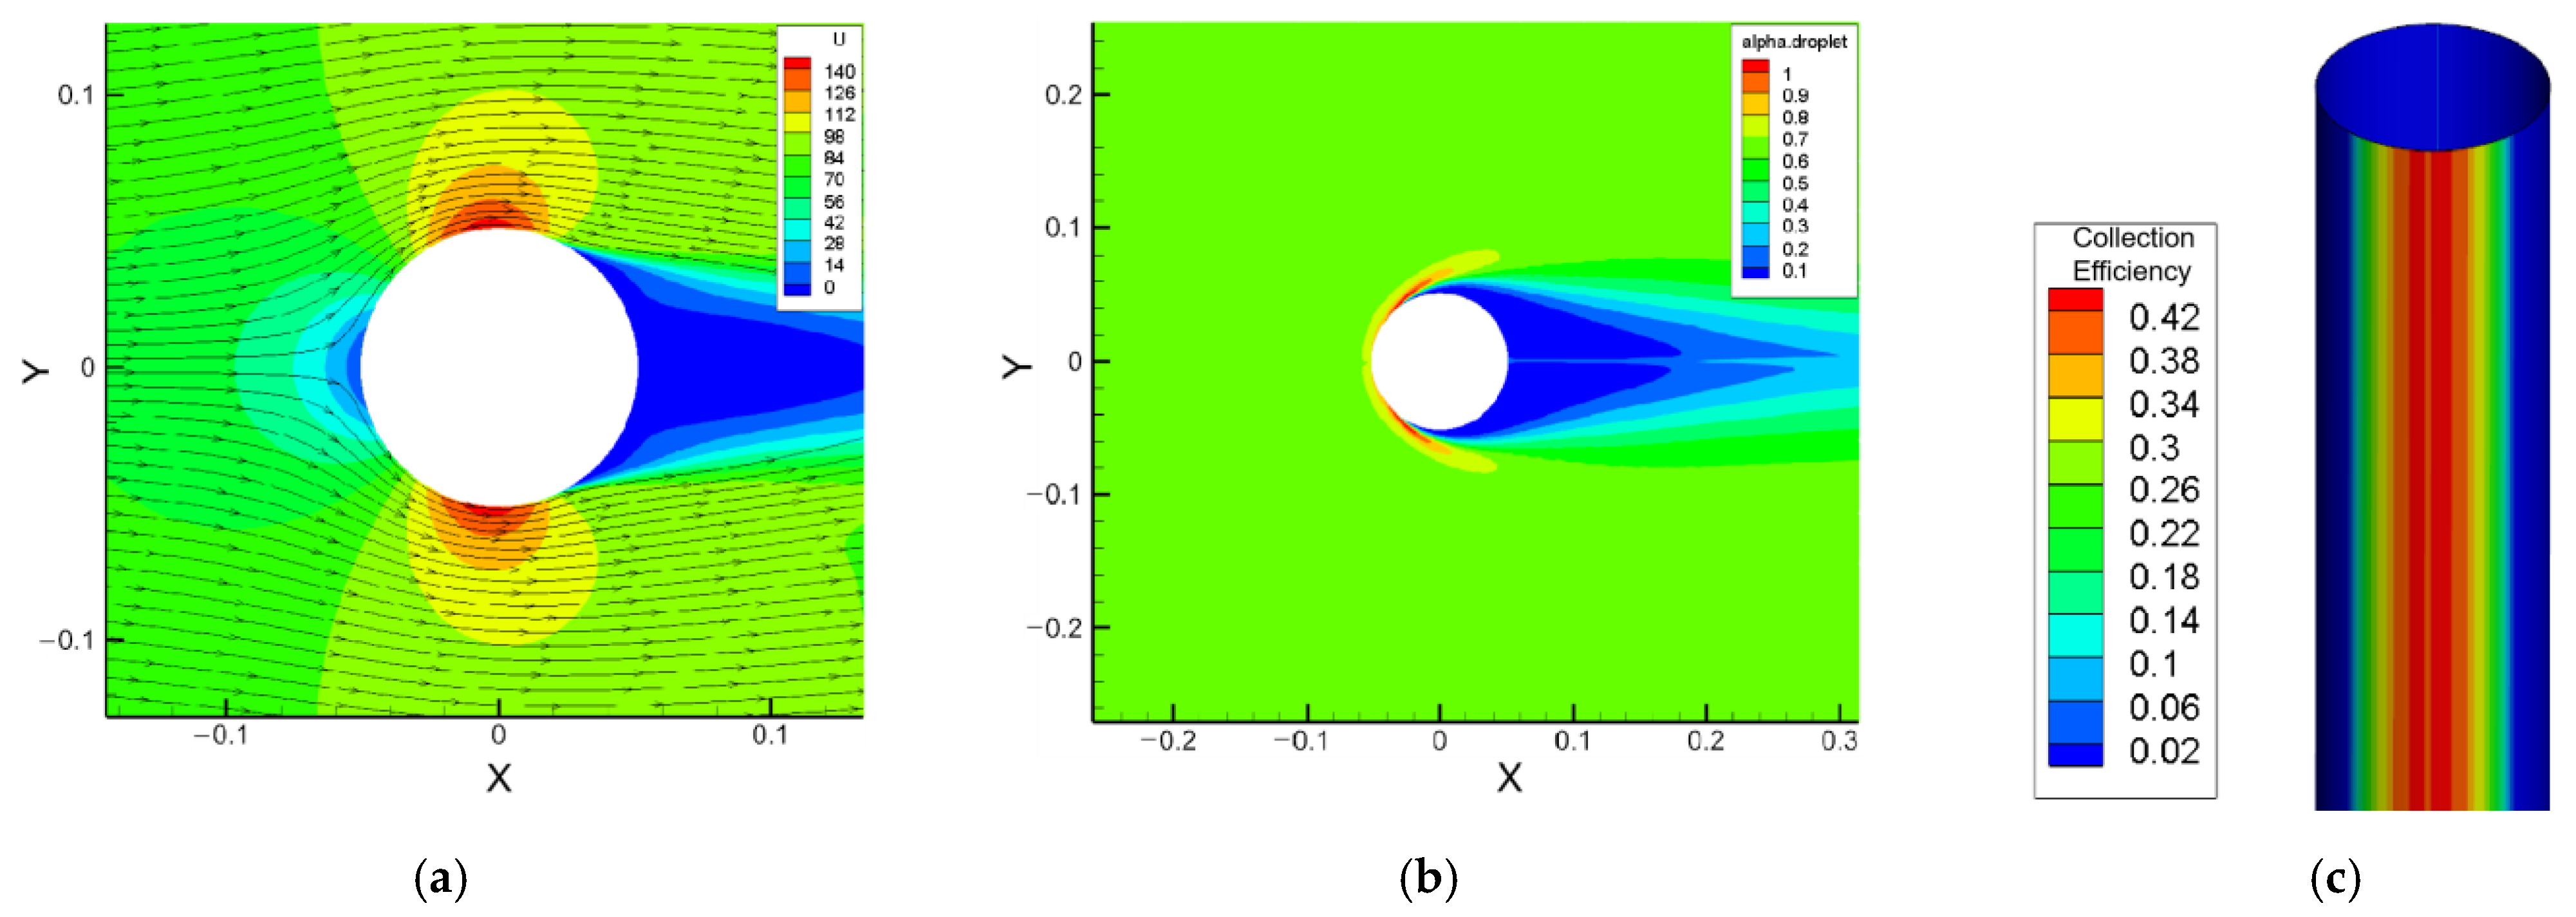
Figure 10 shows the distribution of flow and collection efficiency near the cylinder. Airflow forms stagnation in front of the cylinder and accelerates to form expansion waves on the upper and lower surfaces. Compared with the NACA0012 airfoil, its flow separation is more serious, and a larger low-speed area and shielding area are formed behind the cylinder.

4. Distribution Characteristics of Collection Efficiency

4.1. Influence of Different Inflow Parameters

The incoming flow parameters change constantly in reality, so it is necessary to analyze their influences on DCE. Due to the lack of heat exchange between air and droplets (see assumption 2), the temperature has no effect on DCE and it is not considered here. This study mainly explored the influence of incoming LWC, velocity, and droplet size. The research object was the NACA0012 airfoil used in the above verification process.

4.1.1. LWC

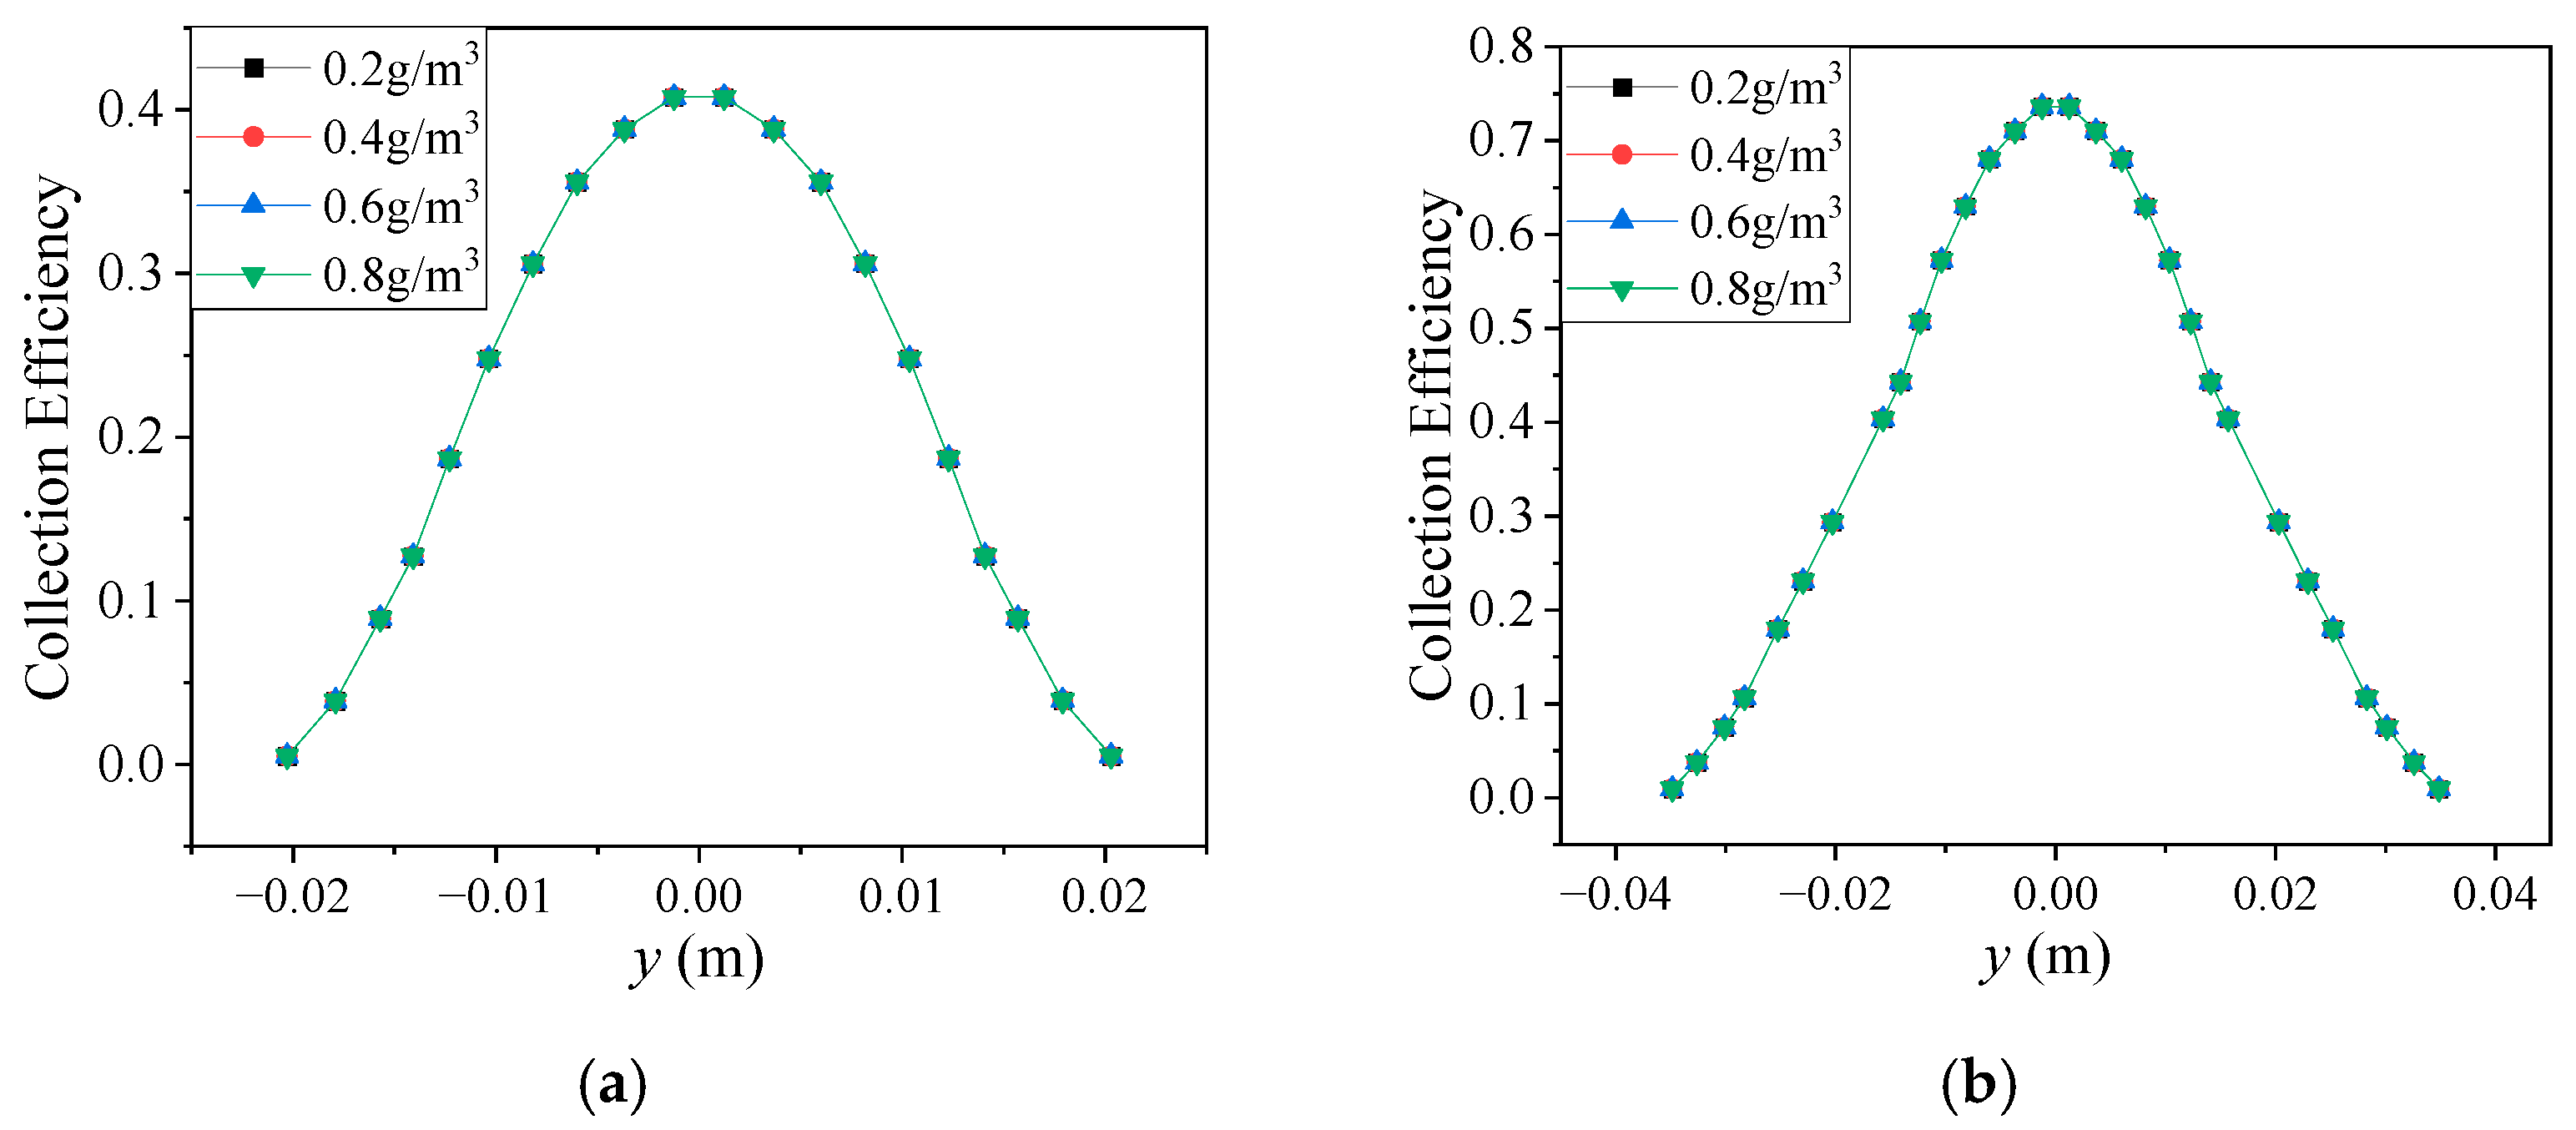
The influence of LWC on DCE was studied, and collection efficiency did not change with LWC (see Figure 11). Since the change in LWC does not change the force of airflow on droplets, it does not affect the velocity of droplets and collection efficiency on the airfoil.

4.1.2. Incoming Velocity

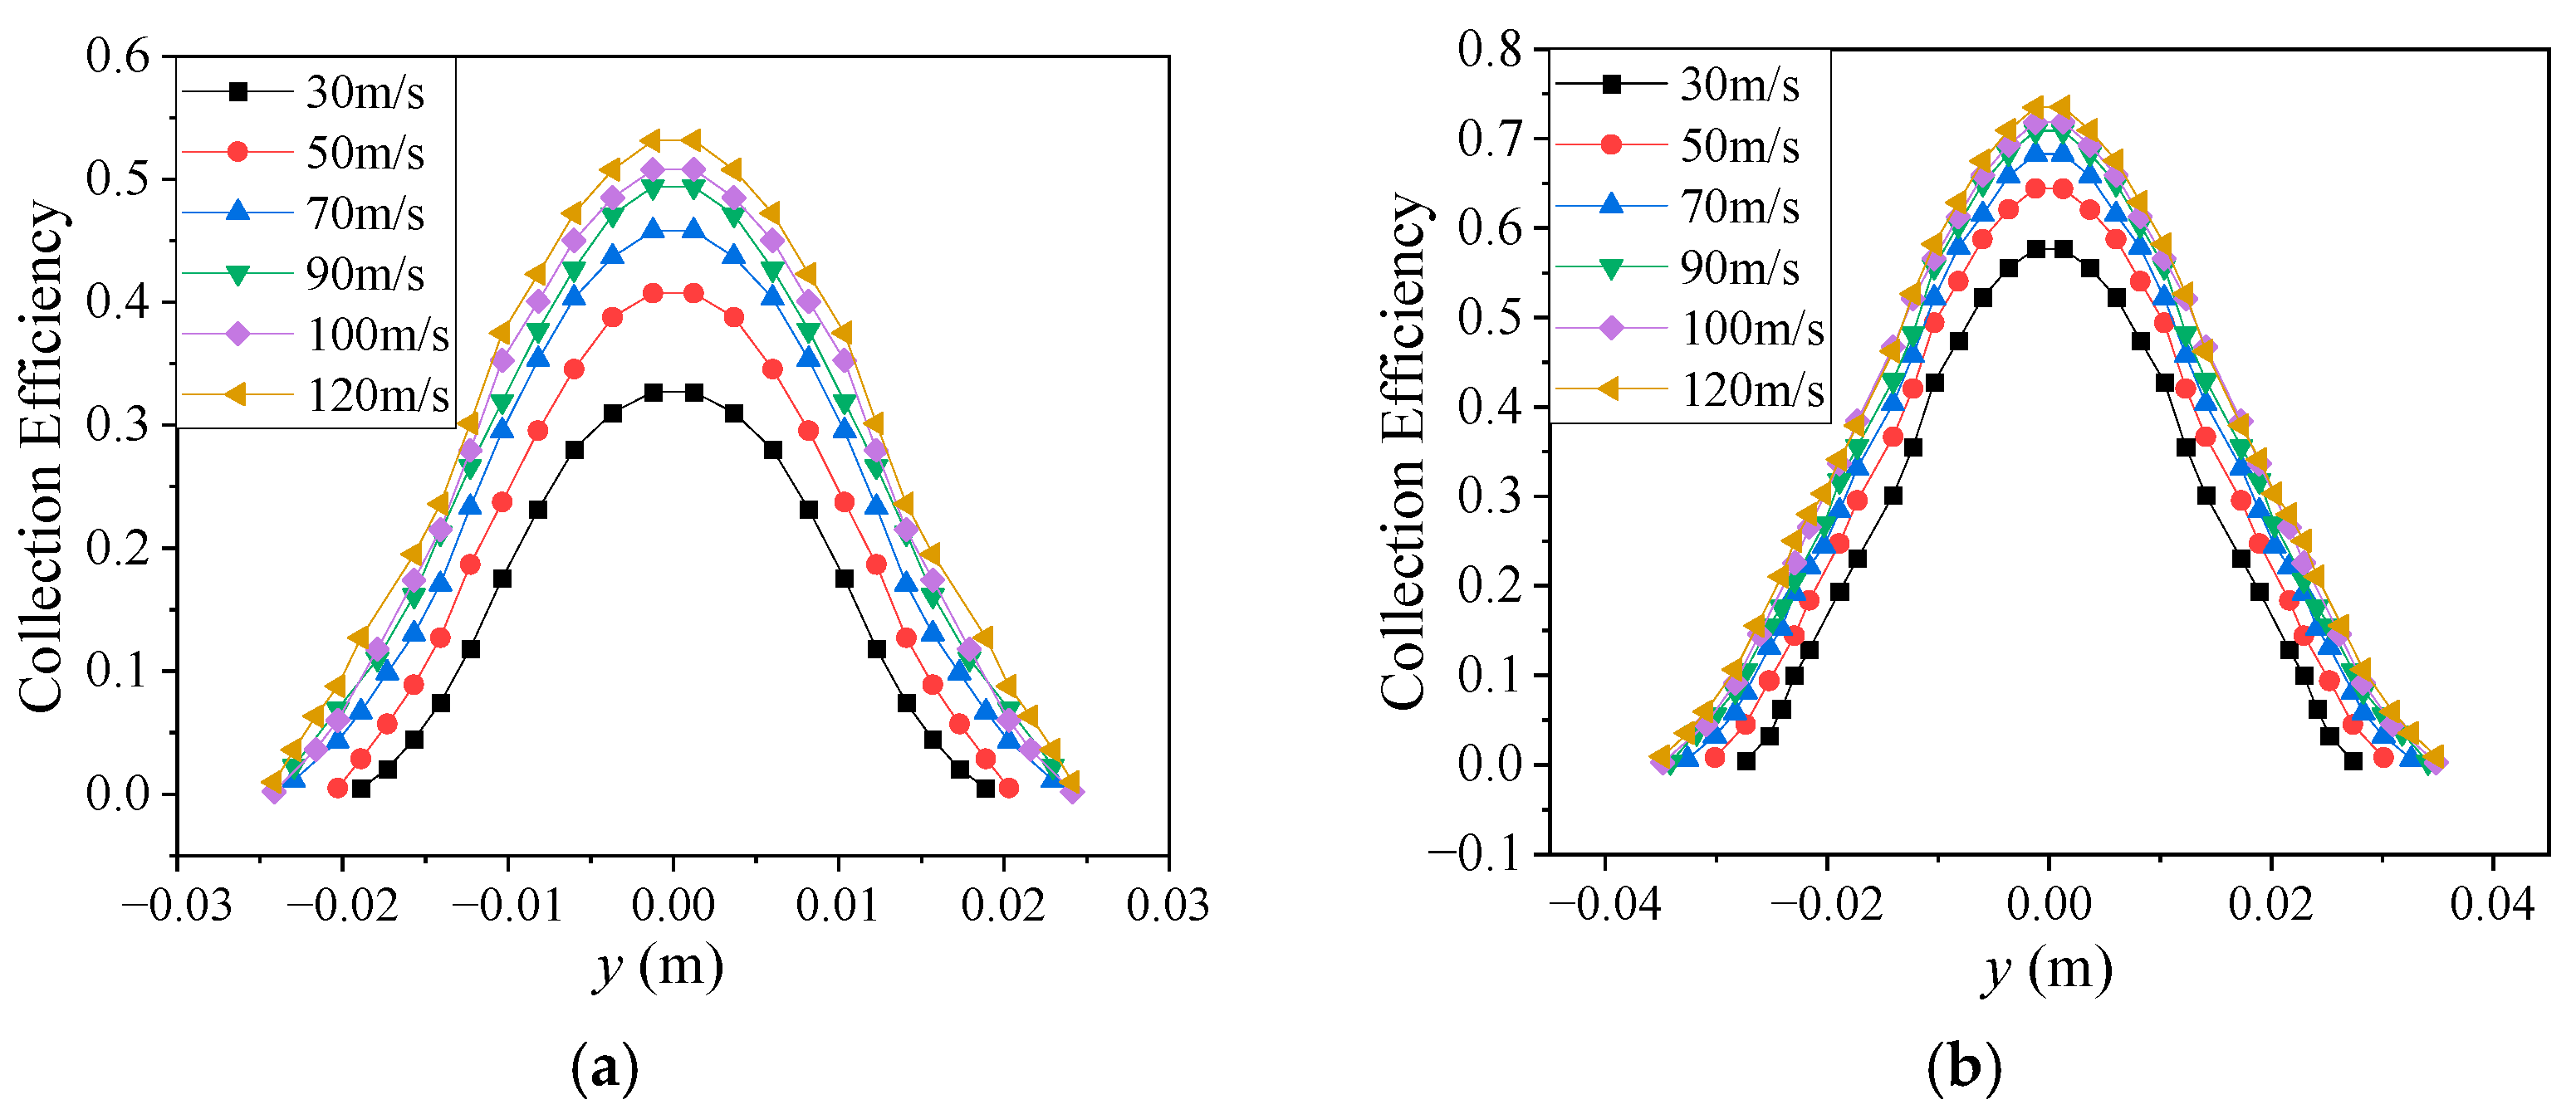
Since DCE does not change with temperature or LWC, they are not considered here, and the droplet diameters are fixed at 15 and 30 μm. On this basis, the speed is changed from 30 to 120 m/s in turn. The DCE and maximum position increase with speed (see Figure 12). Specifically, when the droplet diameter is 15 μm, the peak efficiency increases from 0.327 to 0.532, and the maximum position increases from 0.019 to 0.024 m. The peak efficiency increases from 0.577 to 0.735, and the maximum position increases from 0.027 to 0.035 m at a droplet diameter of 30 μm. Therefore, the influence of velocity on DCE is greater when the droplet diameter is small, while the influence on the maximum collection position is more significant when the droplet size is large.
Figure 13 presents the droplet volume fraction in the flow field at three speeds. DCE represents the ratio of the actual collection amount to the ideal collection capacity. Equation (13) shows that the main influencing factor is the ratio of the normal velocity to the incoming velocity. If the airflow does not affect droplets, then the droplets will maintain a uniform linear motion. Thus, DCE at the nose cone can reach 1, and the maximum position is the widest place on both sides of the airfoil. However, the velocity of droplets decreases, and the direction deflects due to the force of airflow on droplets. The change in the droplet velocity and direction is the reason why the DCE and maximum position cannot reach the ideal value. The wake width also increases with the increased flow velocity, and the volume fraction of water droplets near the wall is larger. In addition, when the momentum of the droplet becomes larger, the influence of air resistance on the trajectory of the droplet is weakened, which increases DCE and the impact range.

4.1.3. Droplet Diameter

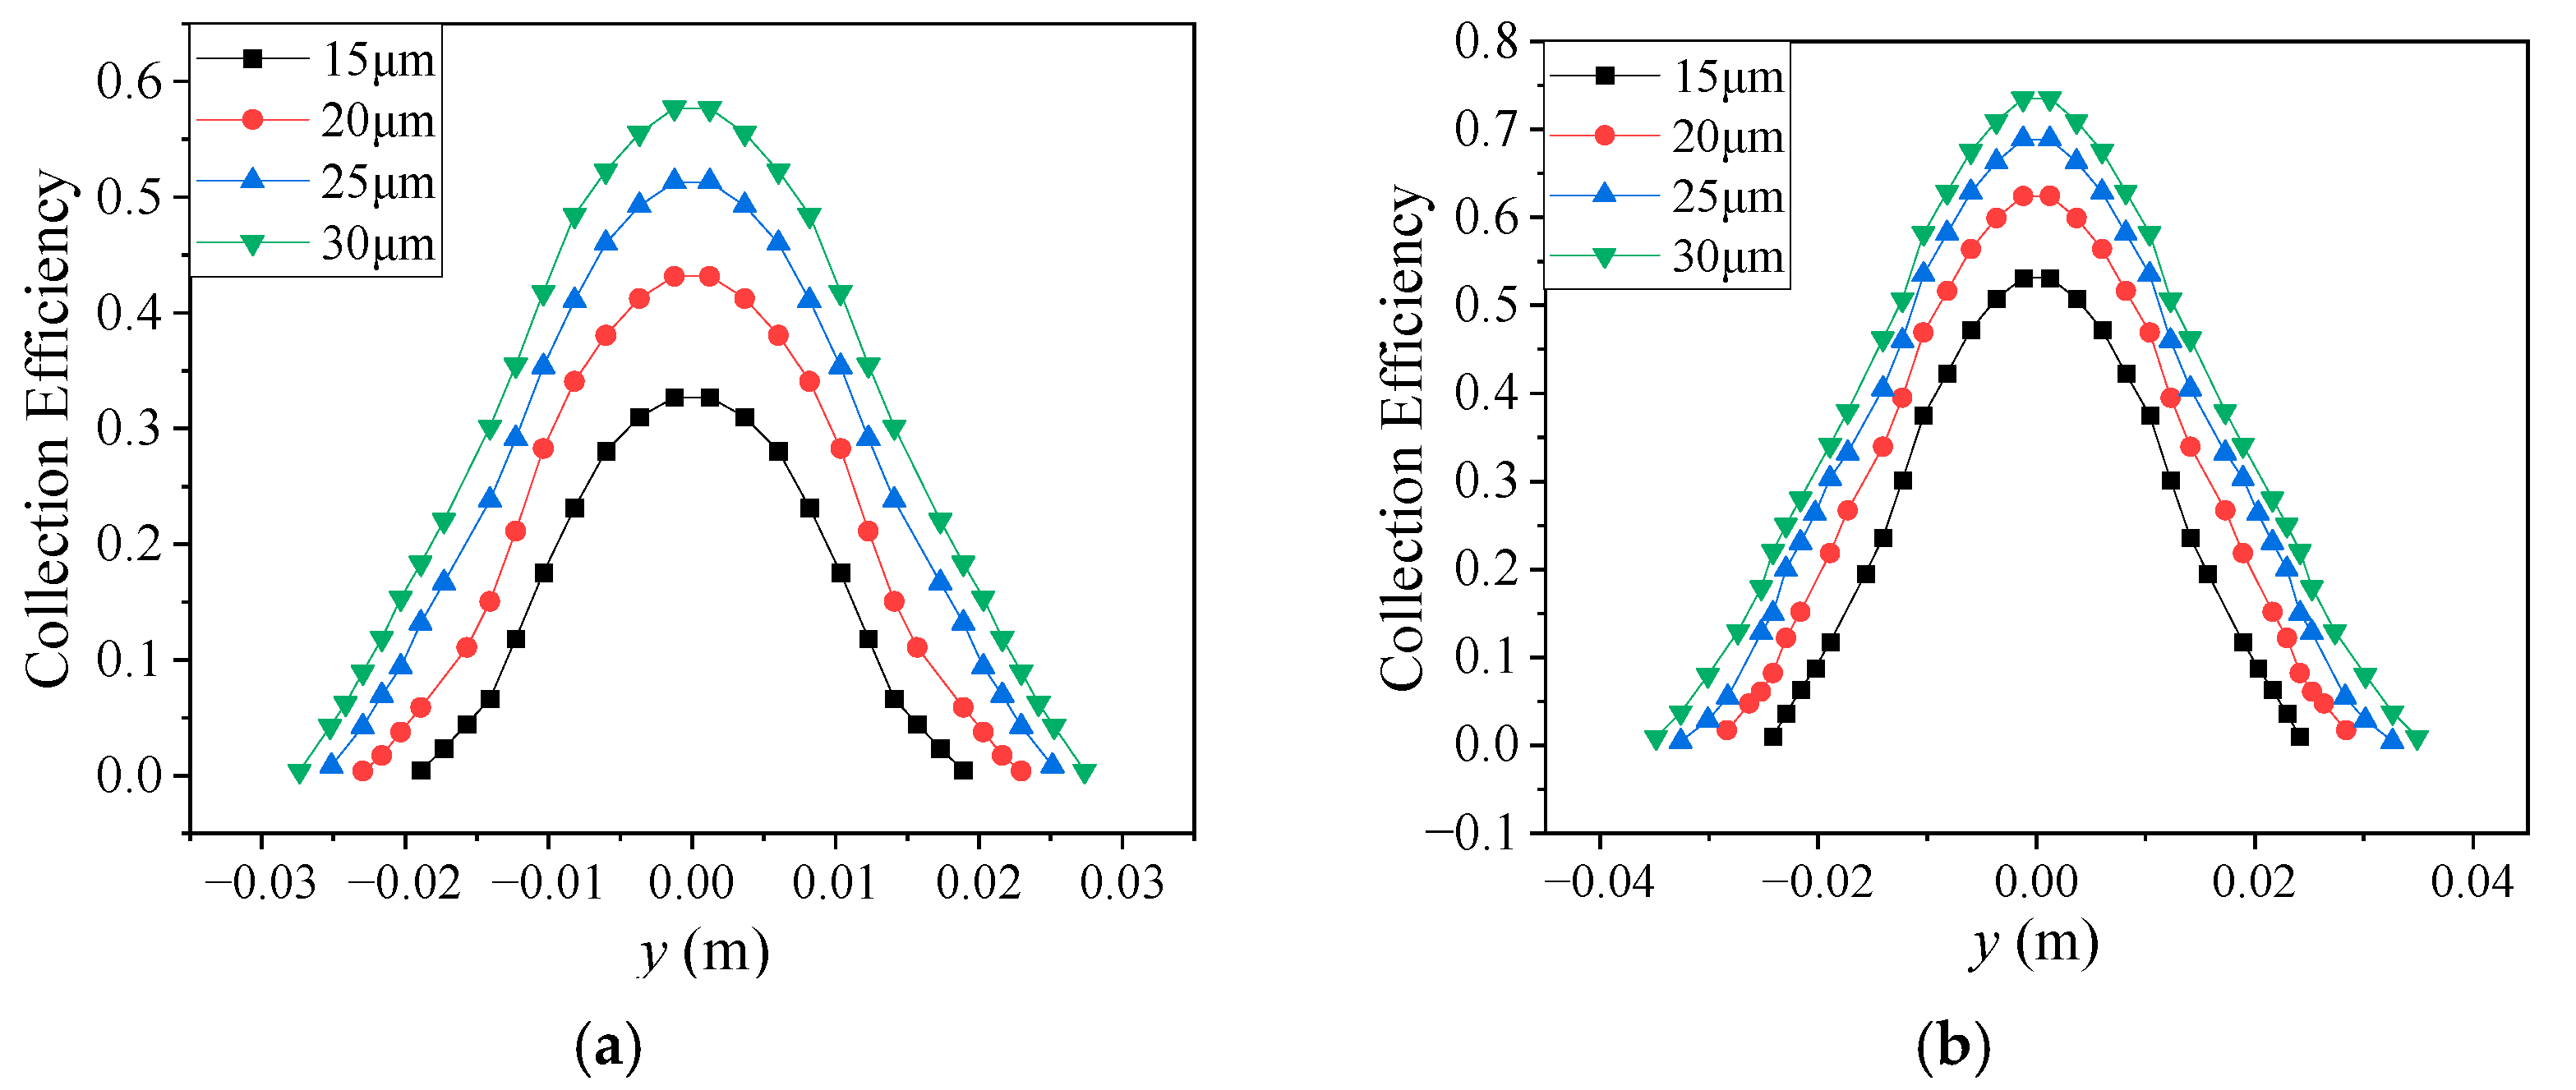
The incoming flow velocity is fixed at 30 and 120 m/s, respectively, and Figure 14 shows the influence of droplet diameter on DCE. When the droplet diameter increases from 15 to 30 μm, the DCE and maximum position also increase. Specifically, when the inflow velocity is 30 m/s, the peak efficiency increases from 0.327 to 0.577, and the maximum position increases from 0.019 to 0.027 m. When the inflow velocity reaches 120 m/s, the peak efficiency increases from 0.532 to 0.735, and the maximum collection position increases from 0.024 to 0.035. Therefore, when the velocity is small, the droplet size has a greater influence on DCE, while the influence of droplet size on the maximum position is almost the same at different velocities.
Figure 15 compares the droplet velocity distribution near the leading edge under three different droplet sizes. Combined with the previous analysis, its momentum and inertia increase with the increased droplet size, and the degree to which airflow changes the speed and direction decreases. Therefore, the droplet velocity at the leading edge is greater under a larger diameter, which improves the DCE and maximum position.

4.2. Regularity in the Collection Efficiency Distribution

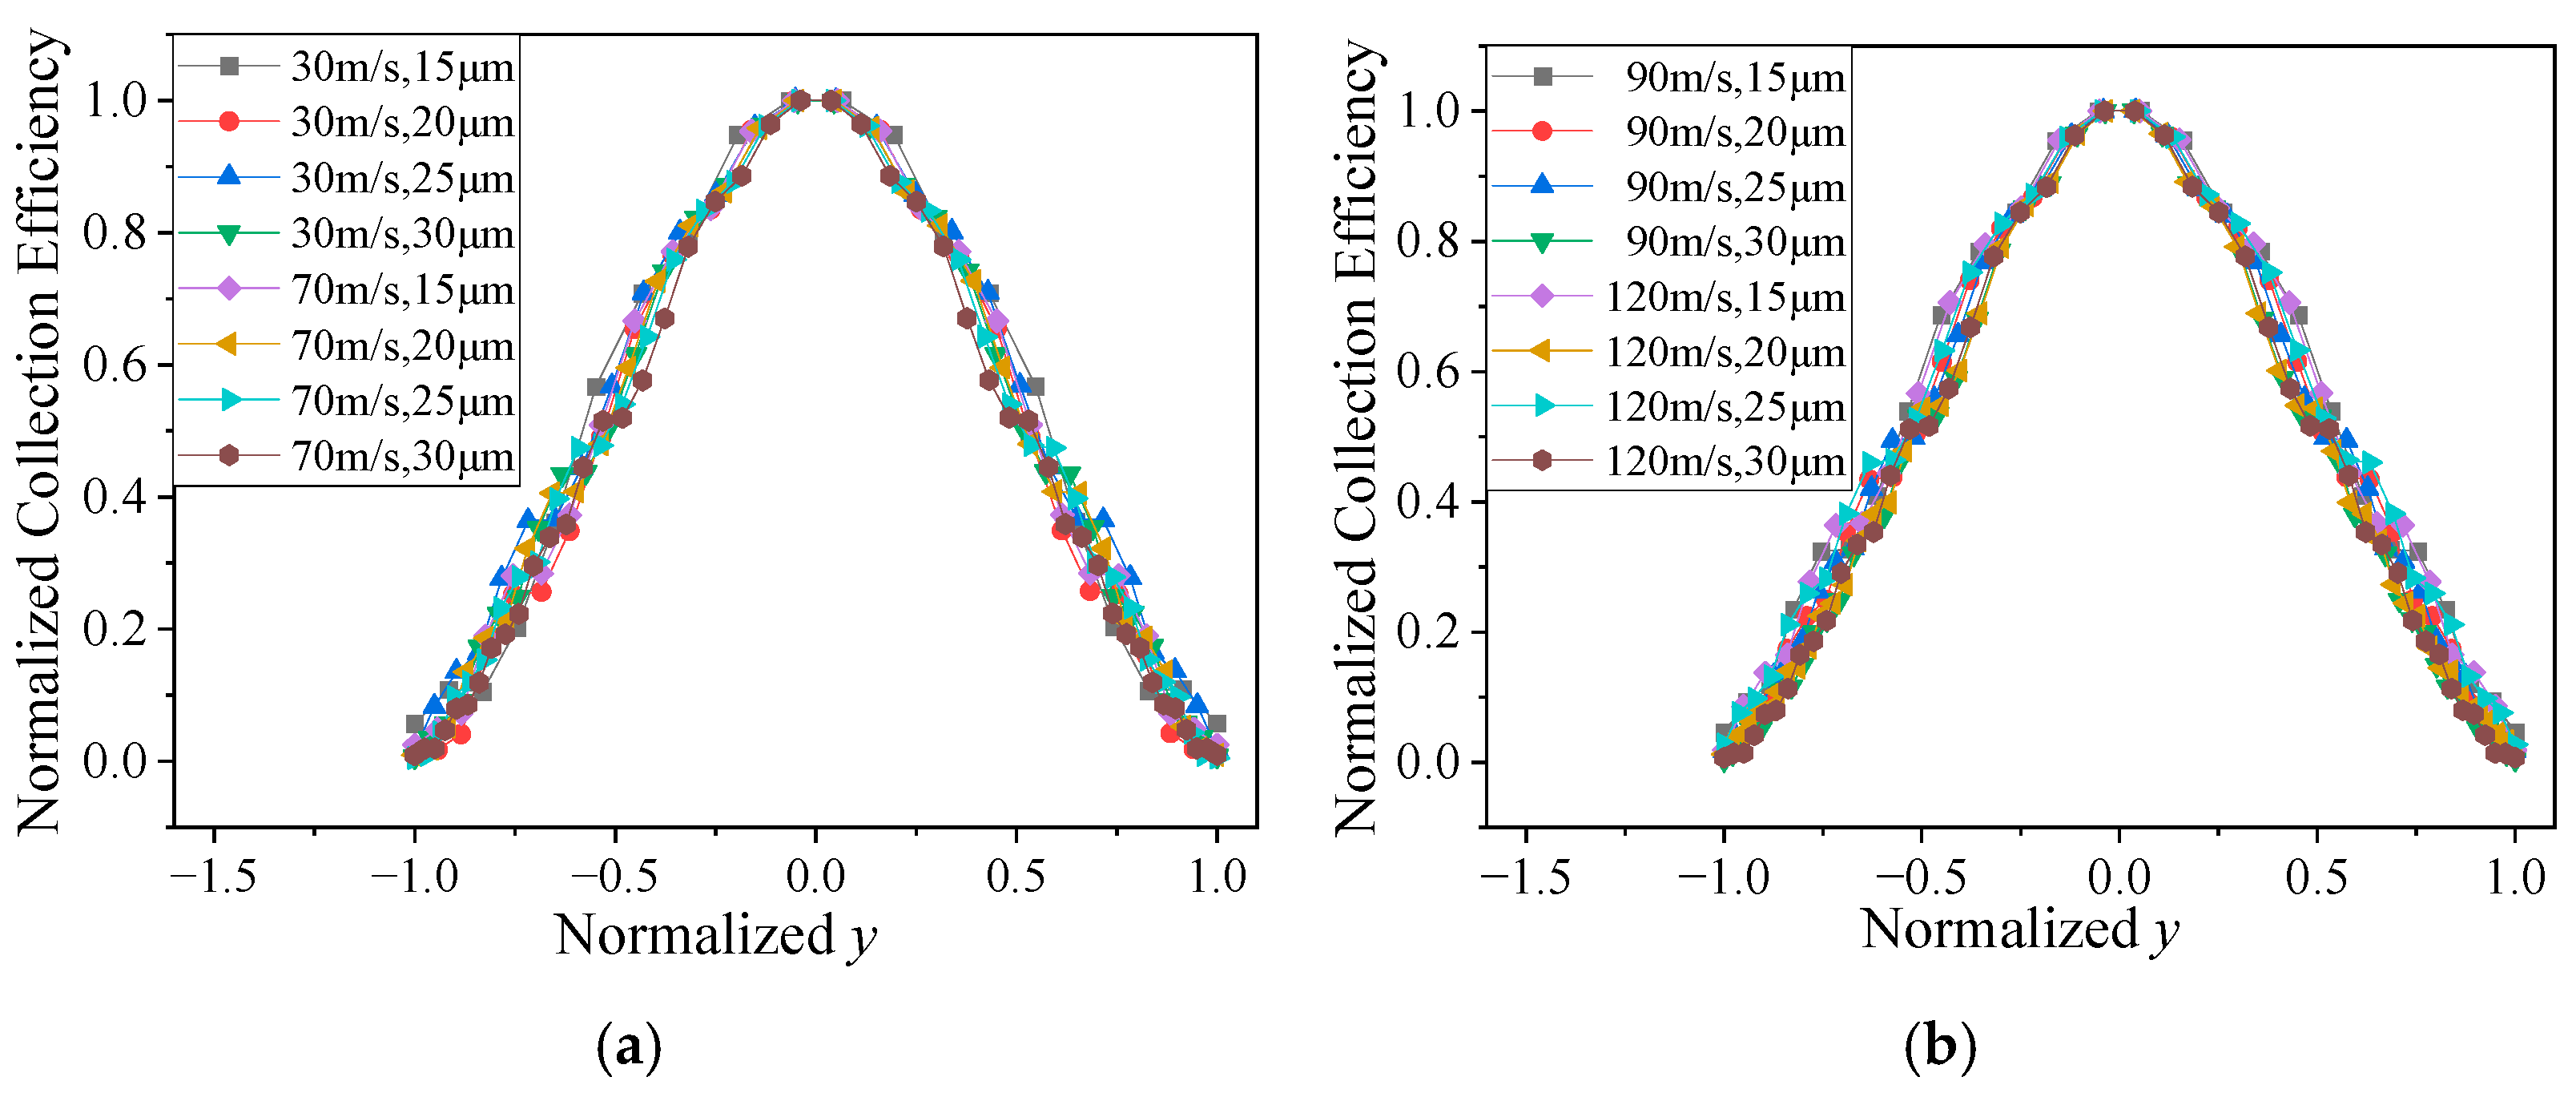
The distribution shape of DCE under different conditions is similar for the NACA0012 airfoil; thus, expression in a unified form should be considered. The above results show that the main evaluation parameters are the peak value of efficiency (βmax) and the maximum position of collection (ymax) for different DCE distributions. We try to normalize the DCE distribution using these two parameters, that is, the abscissa of all curves is divided by ymax and the ordinate is divided by βmax.
The following curves are obtained after normalization, and the results of 16 conditions are selected for display (see Figure 16). The normalized DCE distributions under different conditions are highly coincident, and deviations between the curves are below 10%. Therefore, the DCE distribution has the same regular form after normalization with βmax and ymax for the NACA0012 airfoil.
Then, there are two interesting questions. Firstly, which function law does the normalized distribution meet and what is the physical meaning behind it? The second is whether the relationship between incoming flow parameters (such as incoming flow velocity and droplet size) and βmax and ymax can be established. This study tries to use the Gaussian function for the first problem because the form of the Gaussian function represents a normal distribution. Specifically, the following forms are used for fitting:
β = β 0 A e [ ( y y c ) 2 2 w 2 ]
where yc is approximately equal to 0; β0 = −0.104; w = 0.469; A = 1.08; yc is the mean value of normal distribution; A is the amplitude; and w is the standard deviation of normal distribution. The A value is equal to 1 2 π w for the probability density distribution with the total probability integral of 1. However, the total integral represents the total collection capacity, which is different from the probability density and needs to be described using the independent parameter A. β0 represents the length of bottom truncation because the two sides of normal distribution extend far. Its value will not reach zero, so certain truncation is required for the distribution.
Figure 17 shows the final fitting result: the red curve is the fitting curve and the black data points are the original values. The fitting curve is consistent with the original data points, and the regression coefficient R2 value is 0.99648. The Gaussian function has an excellent ability for fitting the DCE distribution.
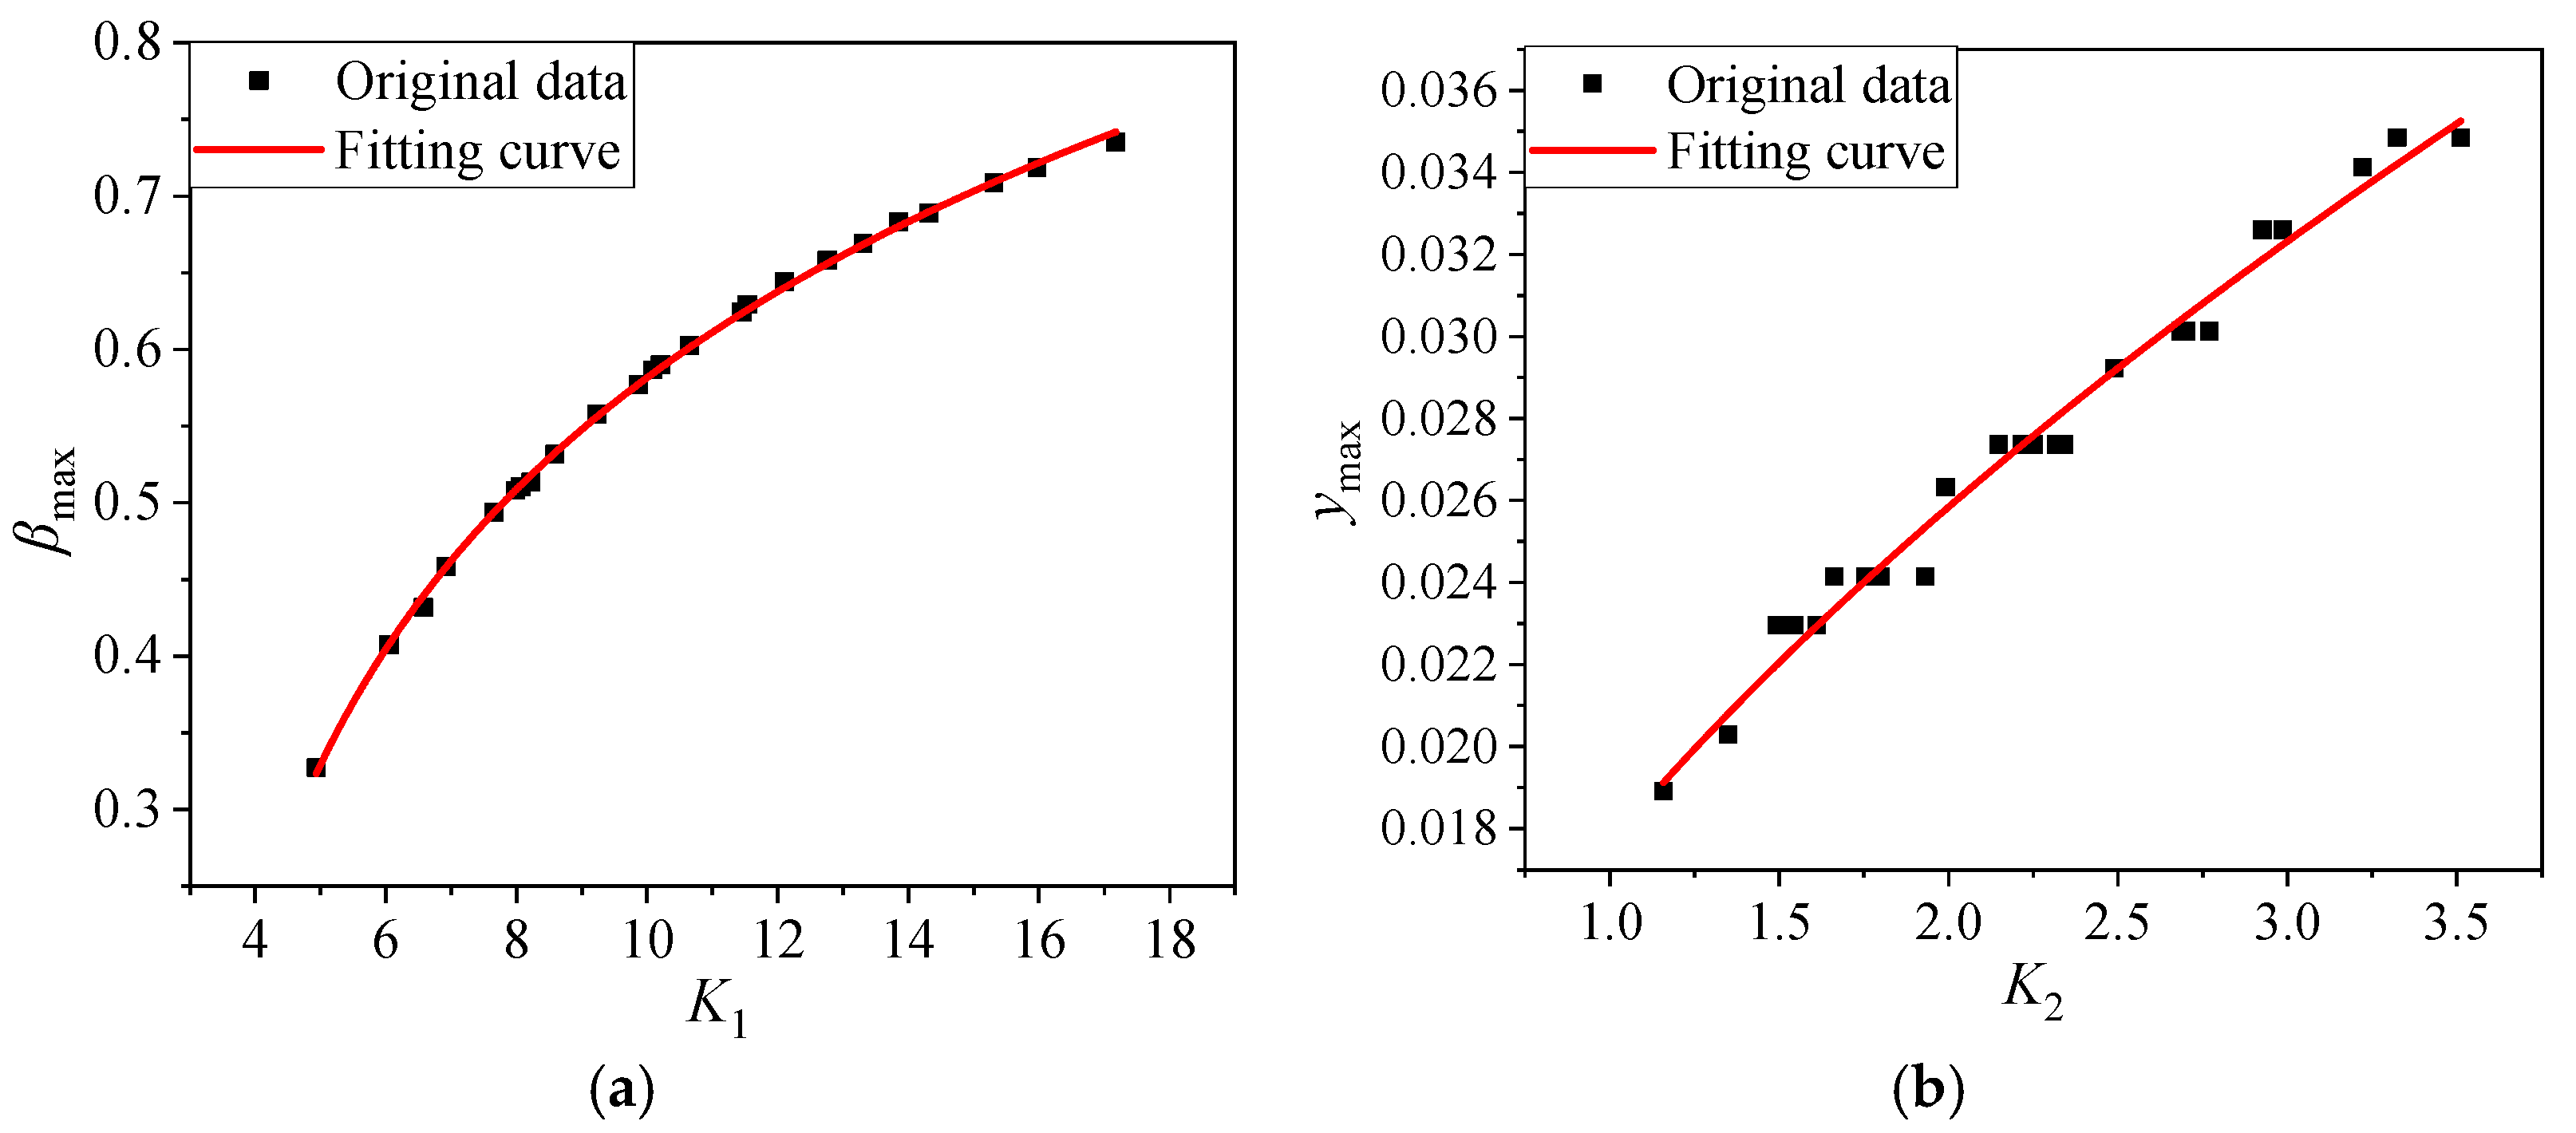
This study analyzes the evaluation parameters (peak efficiency βmax and maximum position ymax) of the normalization distribution to find the relationship between evaluation parameters and incoming flow parameters. A dimensionless treatment is carried out for the incoming flow with velocity u and droplet diameter D, and the established relationship is as follows:
β max = 0.078 + 0.245 ln ( K 1 2.219 )
y max = 0.017 K 2 0.55
where K1 and K2 are intermediate parameters, and their values are expressed as:
K 1 = 1000 ( d D ) Re 0.4
K 2 = 1000 ( d D ) Re 0.3
where D is the reference length, which means blade chord length here, and Re is the Reynolds number of the incoming flow.
The relationship with the target parameters (βmax and ymax) can be obtained using the intermediate parameters K1 and K2, and Figure 18 shows the final fitting results. The distribution curve of ymax and K2 is smoother, and the slope tends to be gradually flat. In contrast, the smoothness of ymax with K2 is poor but its change still has obvious regularity. The R2 values of βmax and ymax curves are 0.99921 and 0.98328, respectively, which have reached a high verification level.
The significance of the above parametric study is as follows. On the one hand, it unifies the DCE distribution under various conditions for the NACA0012 airfoil. Specifically, they are normalized to the same curve using the peak efficiency βmax and maximum position ymax, and this curve conforms to the regularity in the normal distribution. On the other hand, the relationship between incoming flow parameters (velocity u and droplet size dp) and the final distribution is established, which is of great significance for predicting DCE and grasping its regularity. For a situation with a different droplet diameter distribution, we only need to calculate the DCE for each droplet size using the regularity, and then use Equation (15) to obtain the final average DCE.
The physical reasons behind the law of DCE are curious. According to the definition of collection efficiency (see Equation (11)), we can consider it as the effects of different components.
β = α α u | u | n = α α | u | | u | cos ( u , n )
where α/α is the ratio of LWC in local to the incoming (constant value); |u|/|u| is the ratio of the droplet velocity in local to the incoming (constant value); n is the normal vector on the wall; and u·n is the velocity component perpendicular to the wall. Therefore, collection efficiency can be considered as the effects of LWC, droplet velocity, and the normal vector of the airfoil.
The distribution of these three factors was analyzed to assess their impact degrees. Using 120 and 50 m/s as examples, Figure 19 shows the distribution of |u|/|u| on the airfoil. Contrary to the distribution of DCE, the |u|/|u| curve is low in the middle and high at both ends, and the range in the change is relatively significant (ranging from 0.49 to 0.76 for 120 m/s).
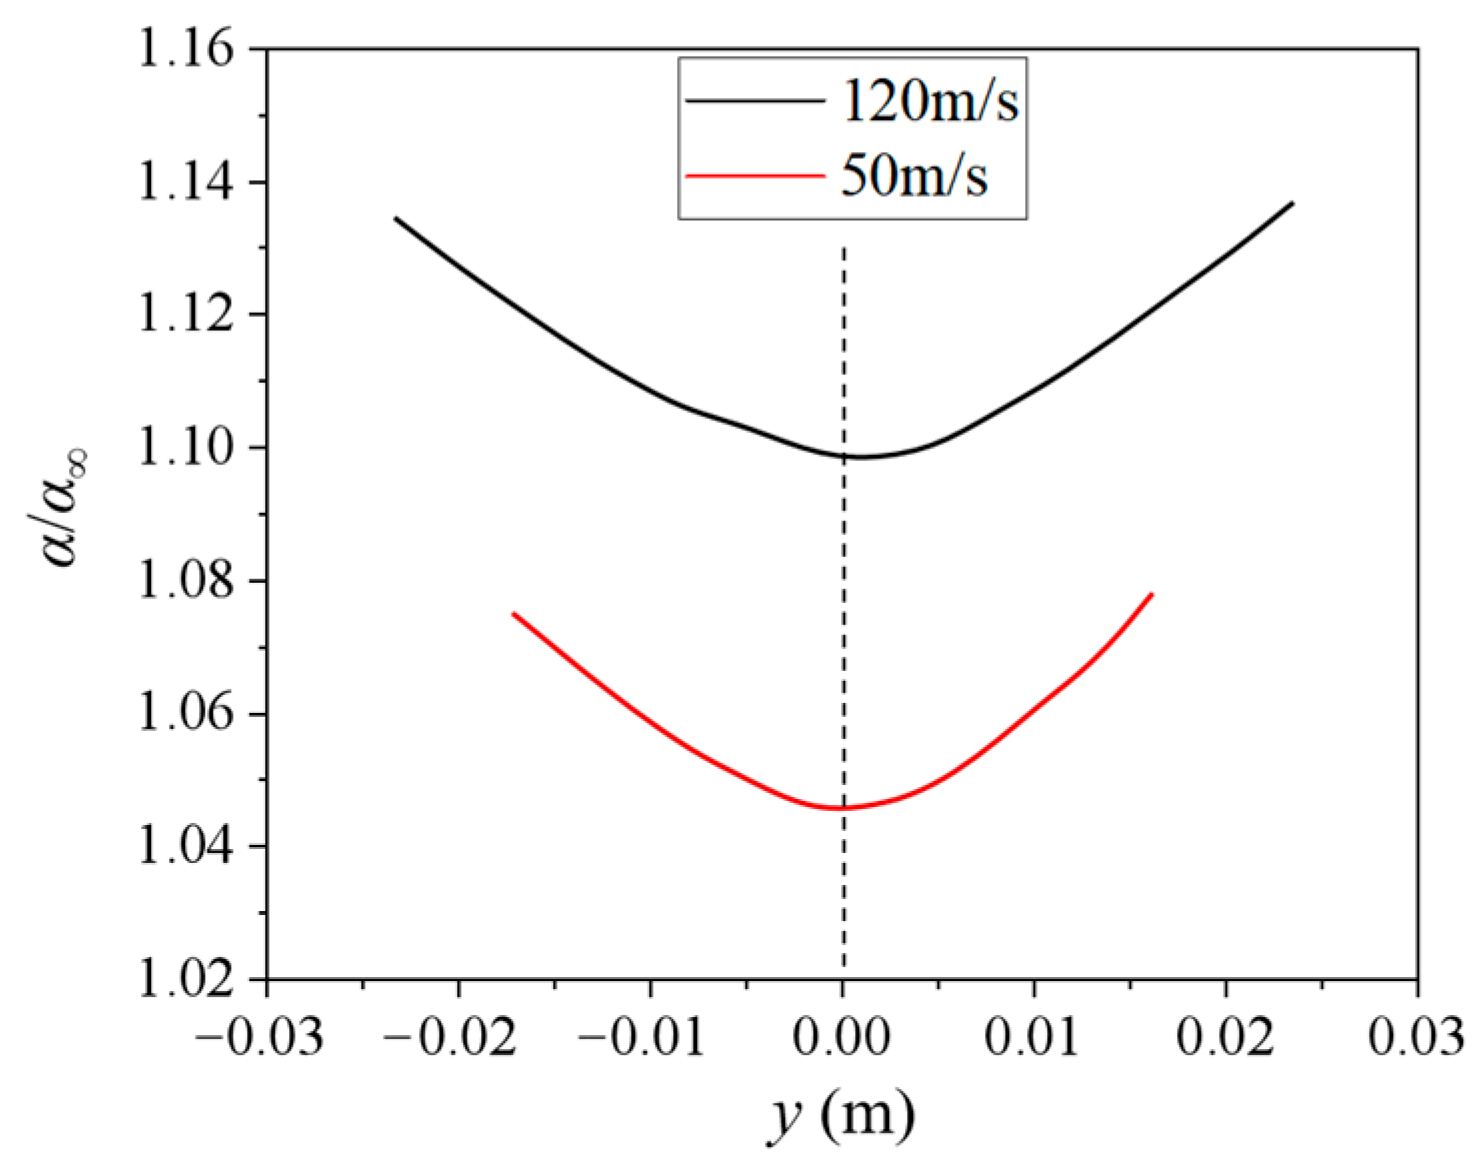
The influence of relative LWC can be analyzed using the results for 120 and 50 m/s in Figure 20. On the one hand, the α/α curve shows the characteristics of small variation in the middle, which is contrary to the distribution of the collection efficiency. On the other hand, the variation range in α/α is very small (ranging from 1 to 1.14), which has little impact on DCE.
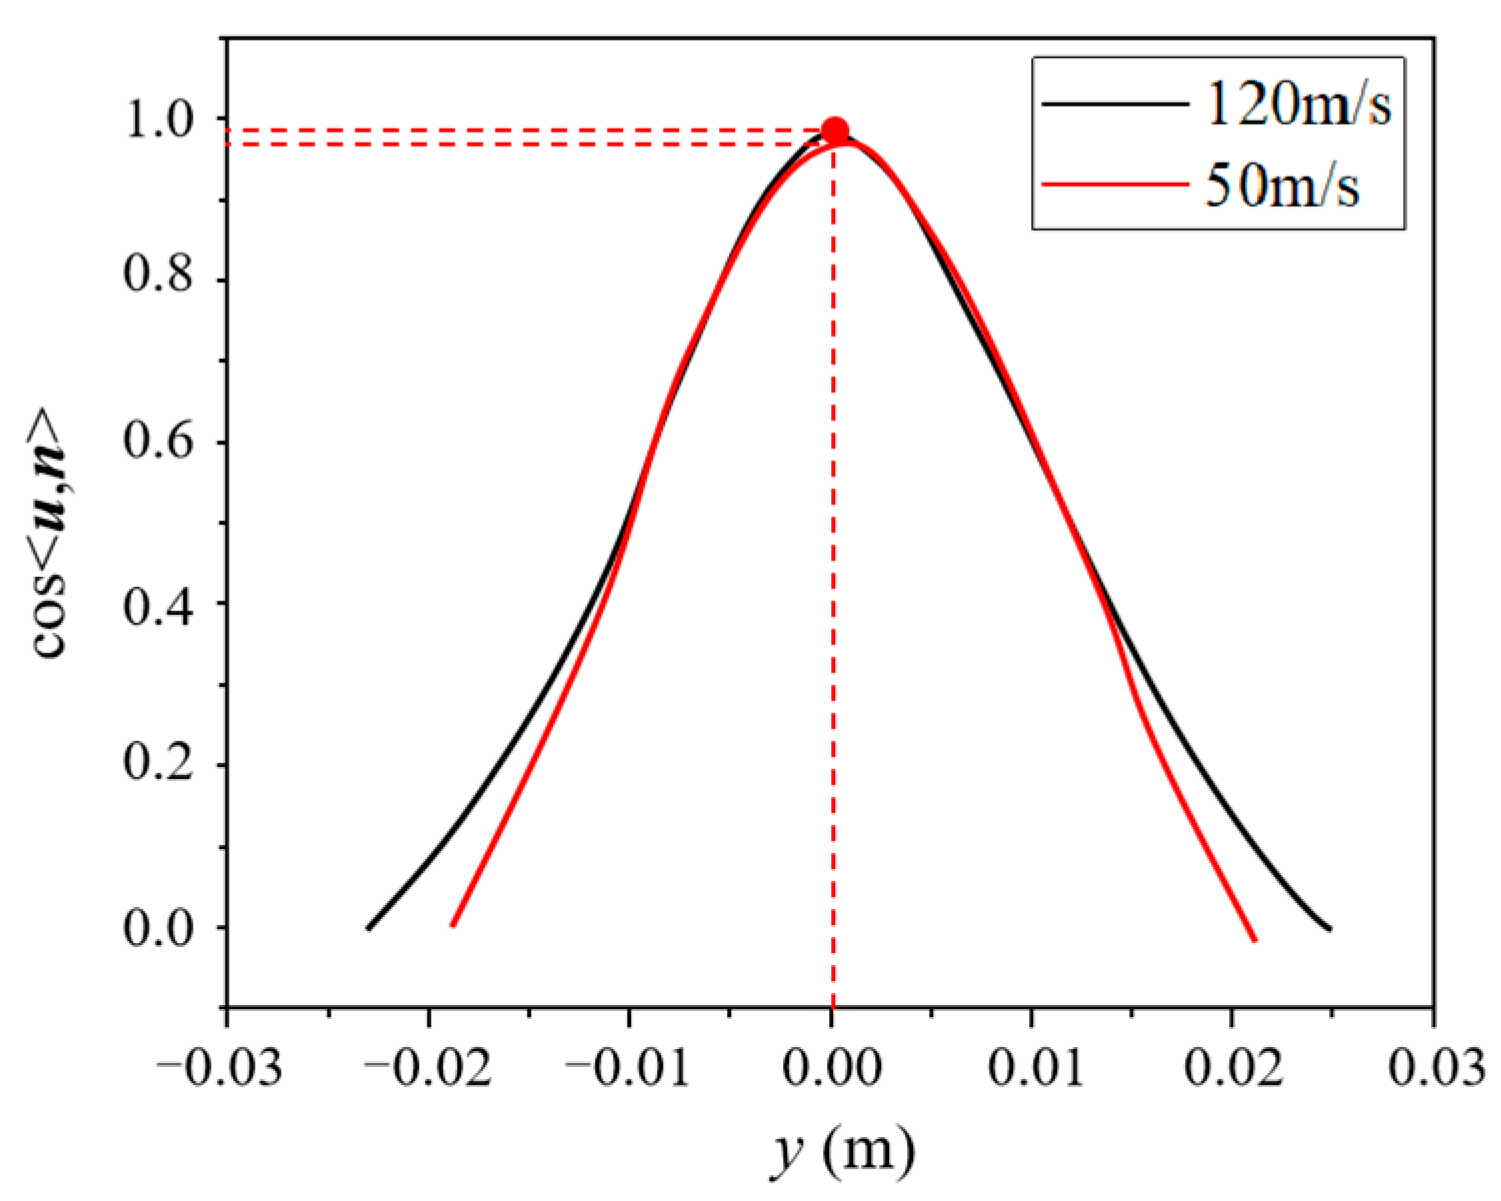
Finally, the angle between the velocity and normal vector was analyzed, and Figure 21 shows the distribution of cos(u·n). The curve shows the form of a normal distribution and covers a wide range (from 0 to 1), which plays a decisive role in the collection efficiency. In addition, the curves at different velocities are almost coincident in the middle region, except that there is a deviation near both sides. The droplet velocity and direction change little at different positions, and the most important factor in cos(u·n) is the shape of the airfoil.
The main factor affecting the DCE and normal distribution is the shape of the airfoil, and the relevant speed of droplets also has an obvious effect. Therefore, we should mainly focus on the normal vector on the wall of different airfoils and the speed loss of droplets by the flow resistance.

4.3. The Effect of Angle of Attack

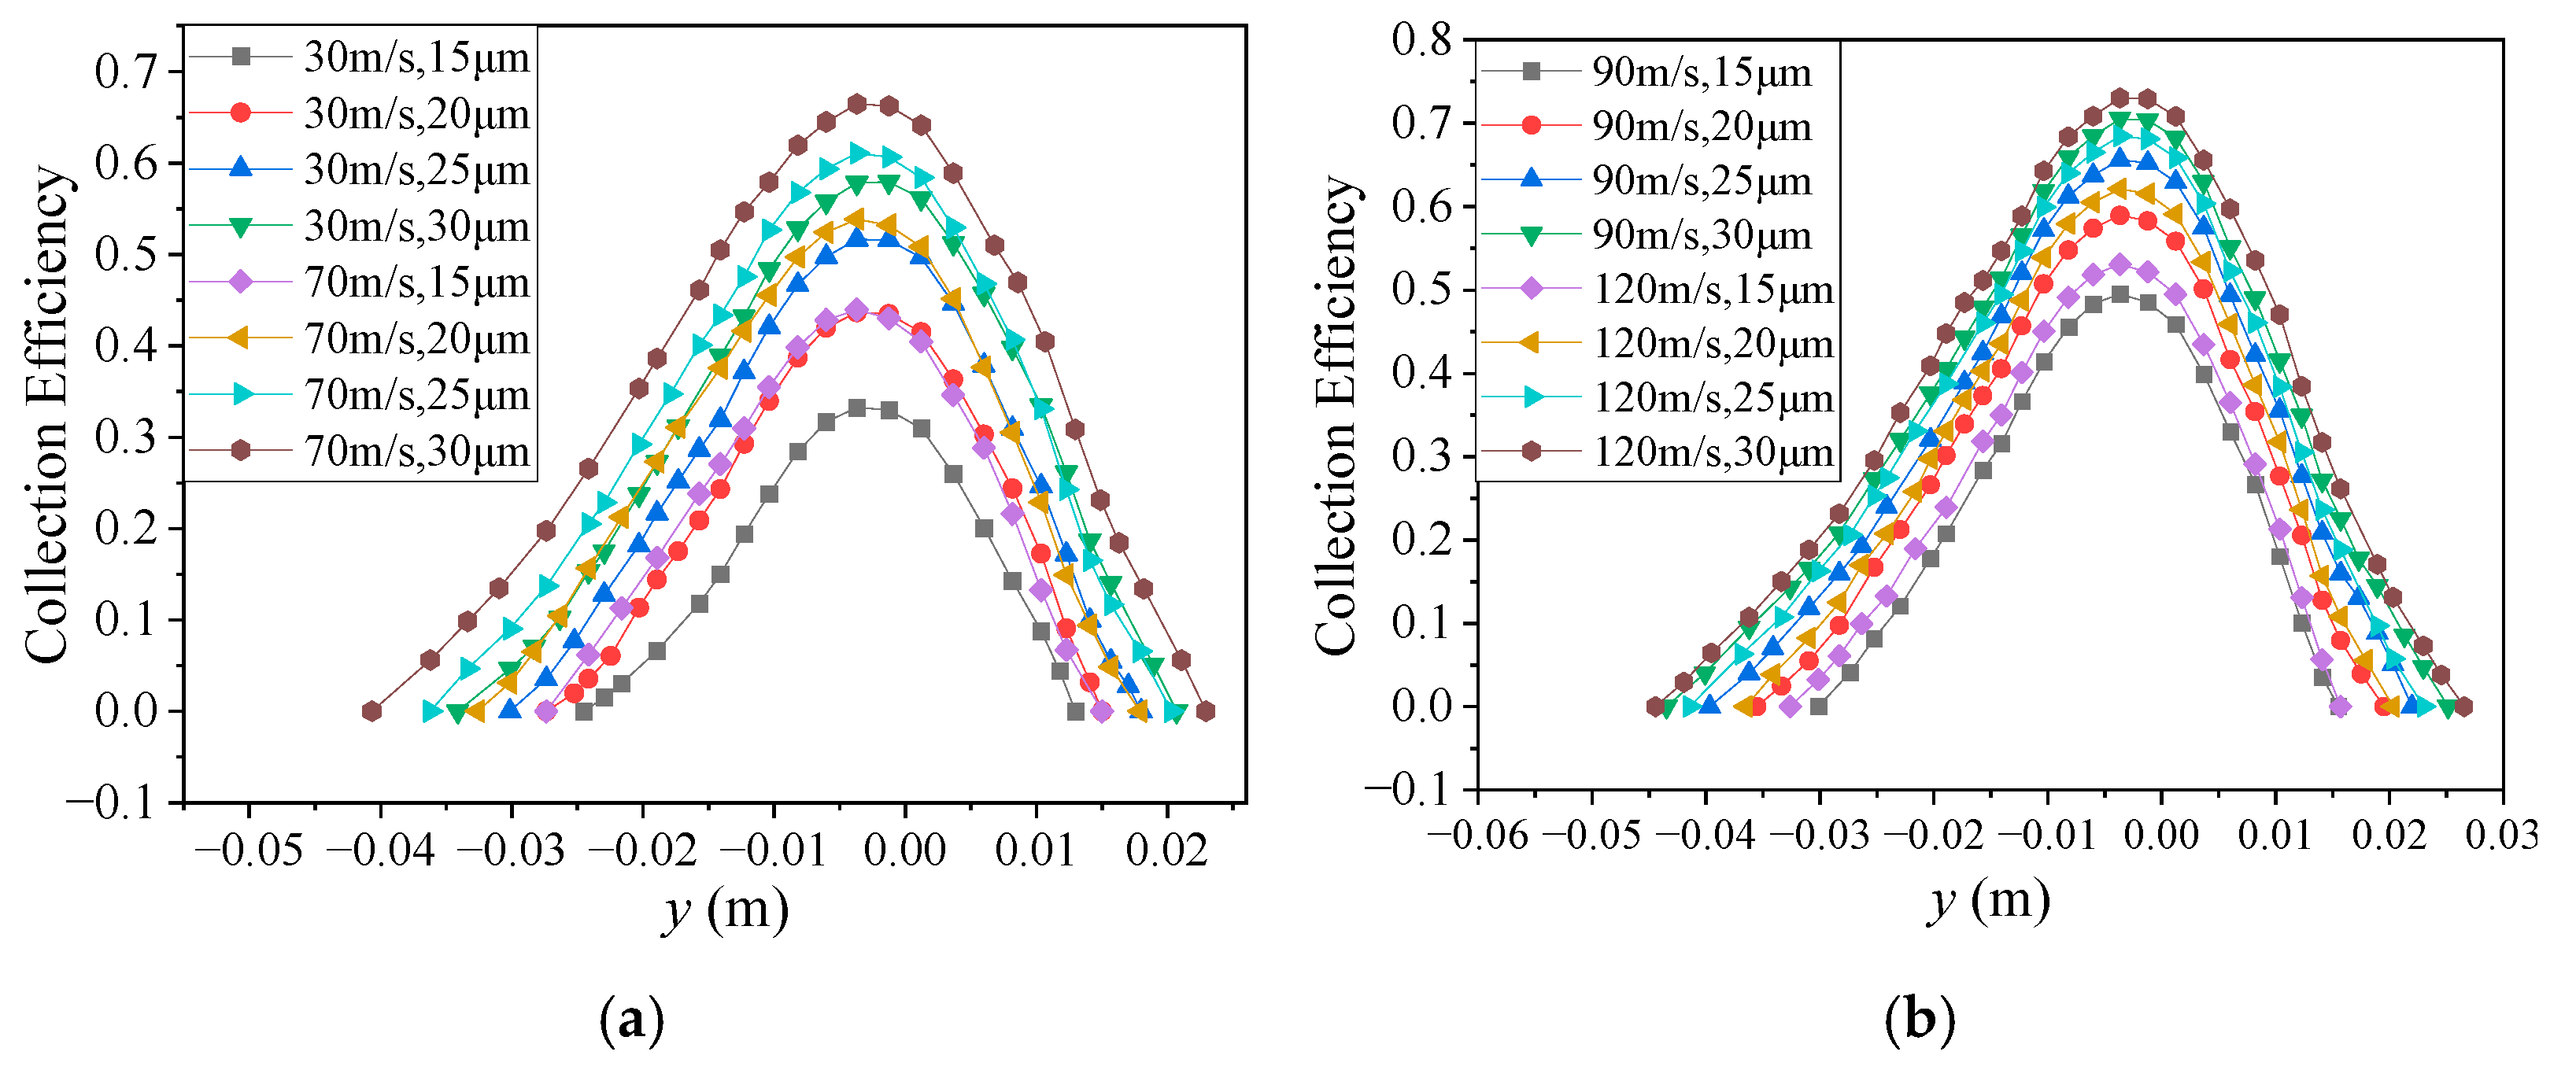
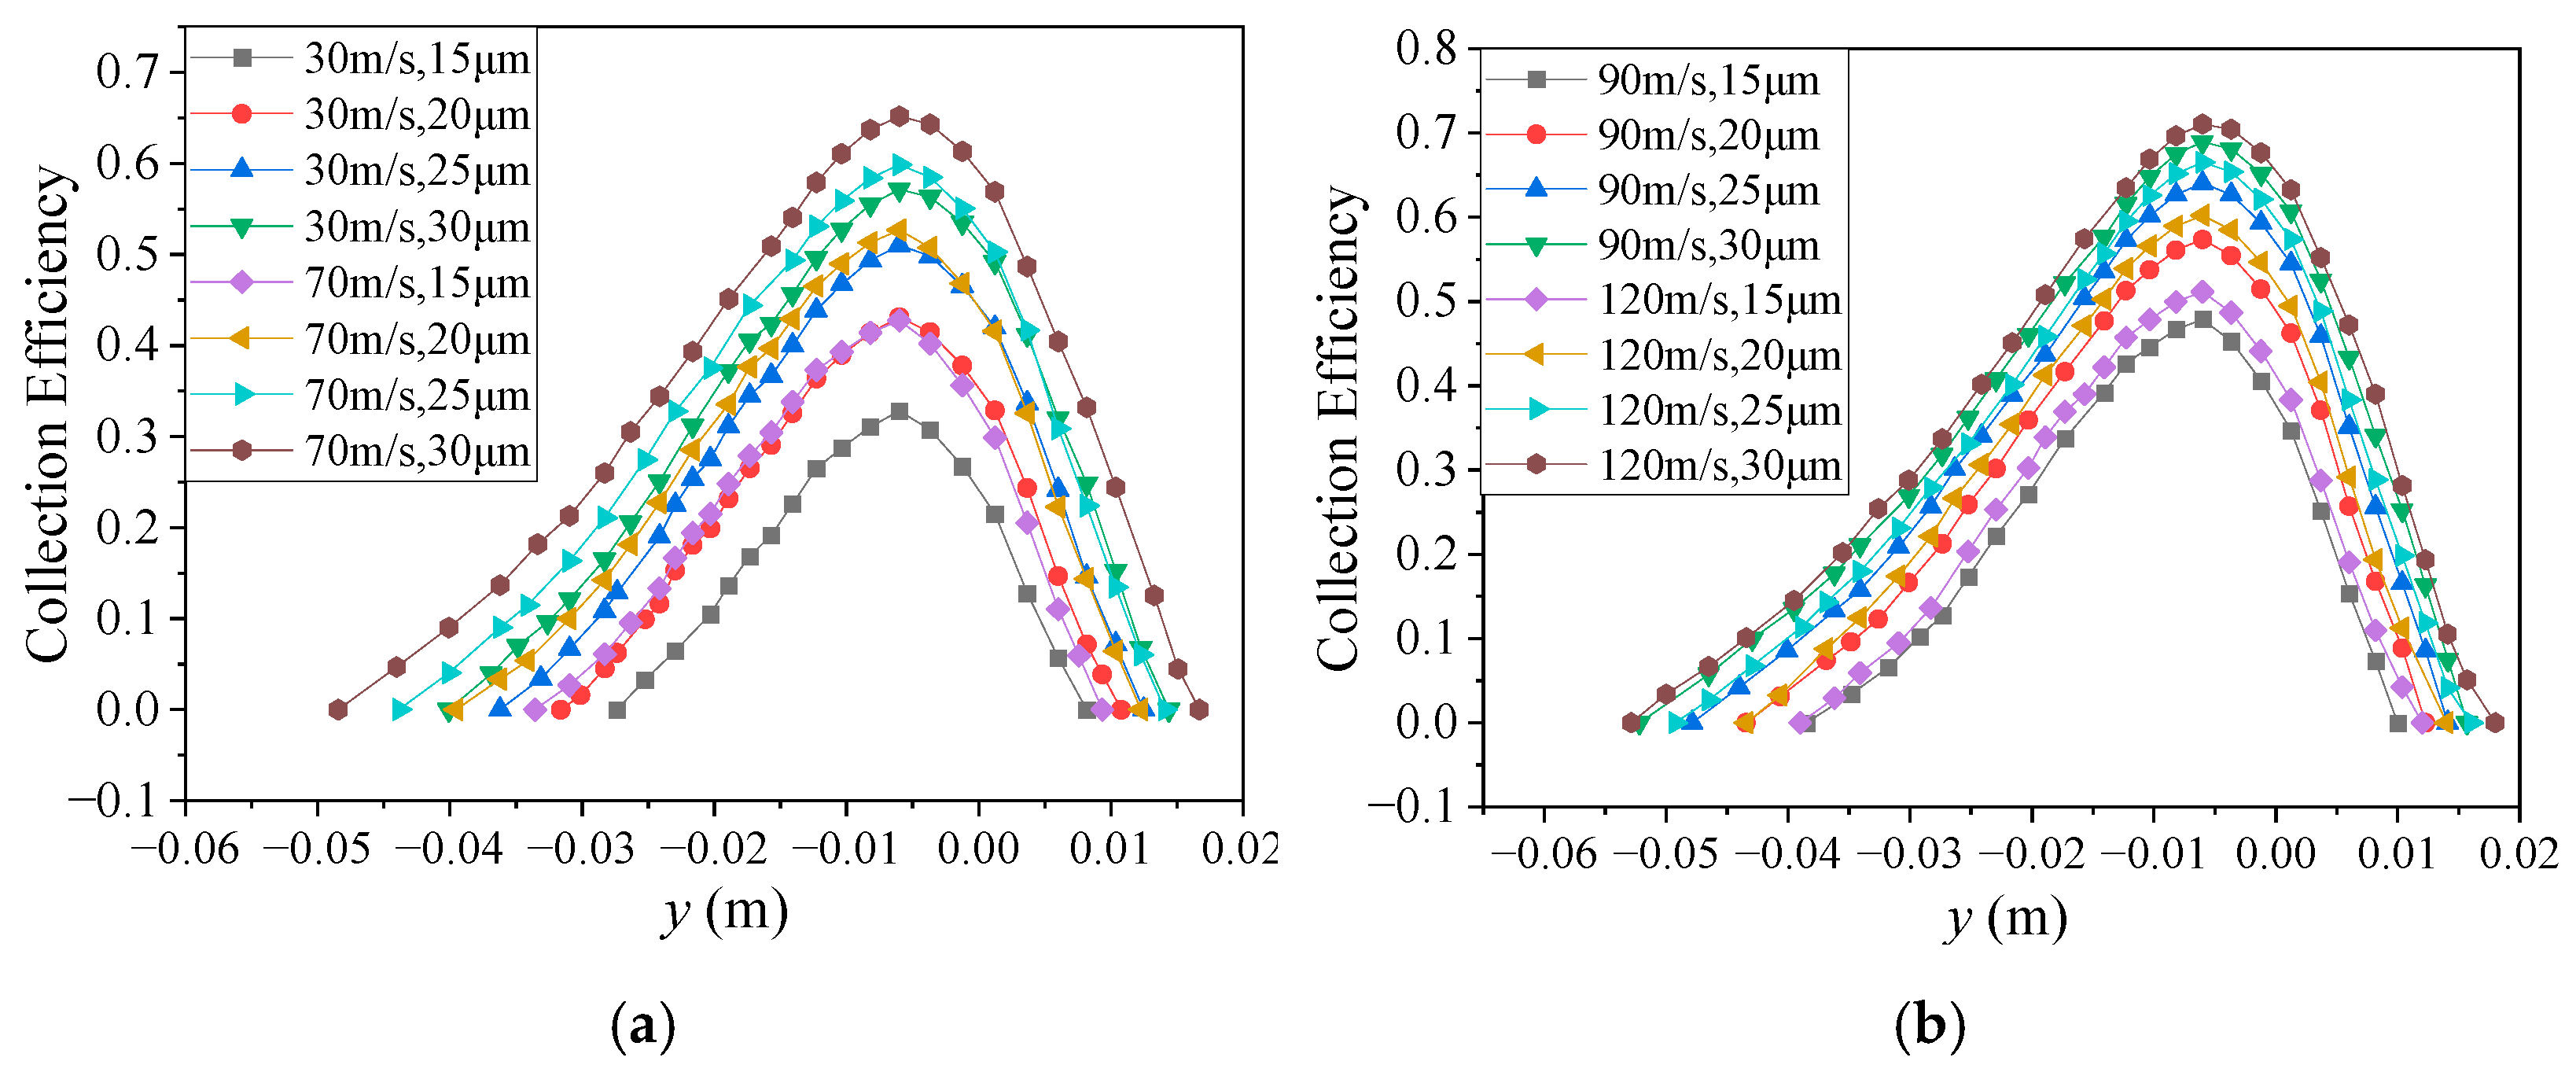
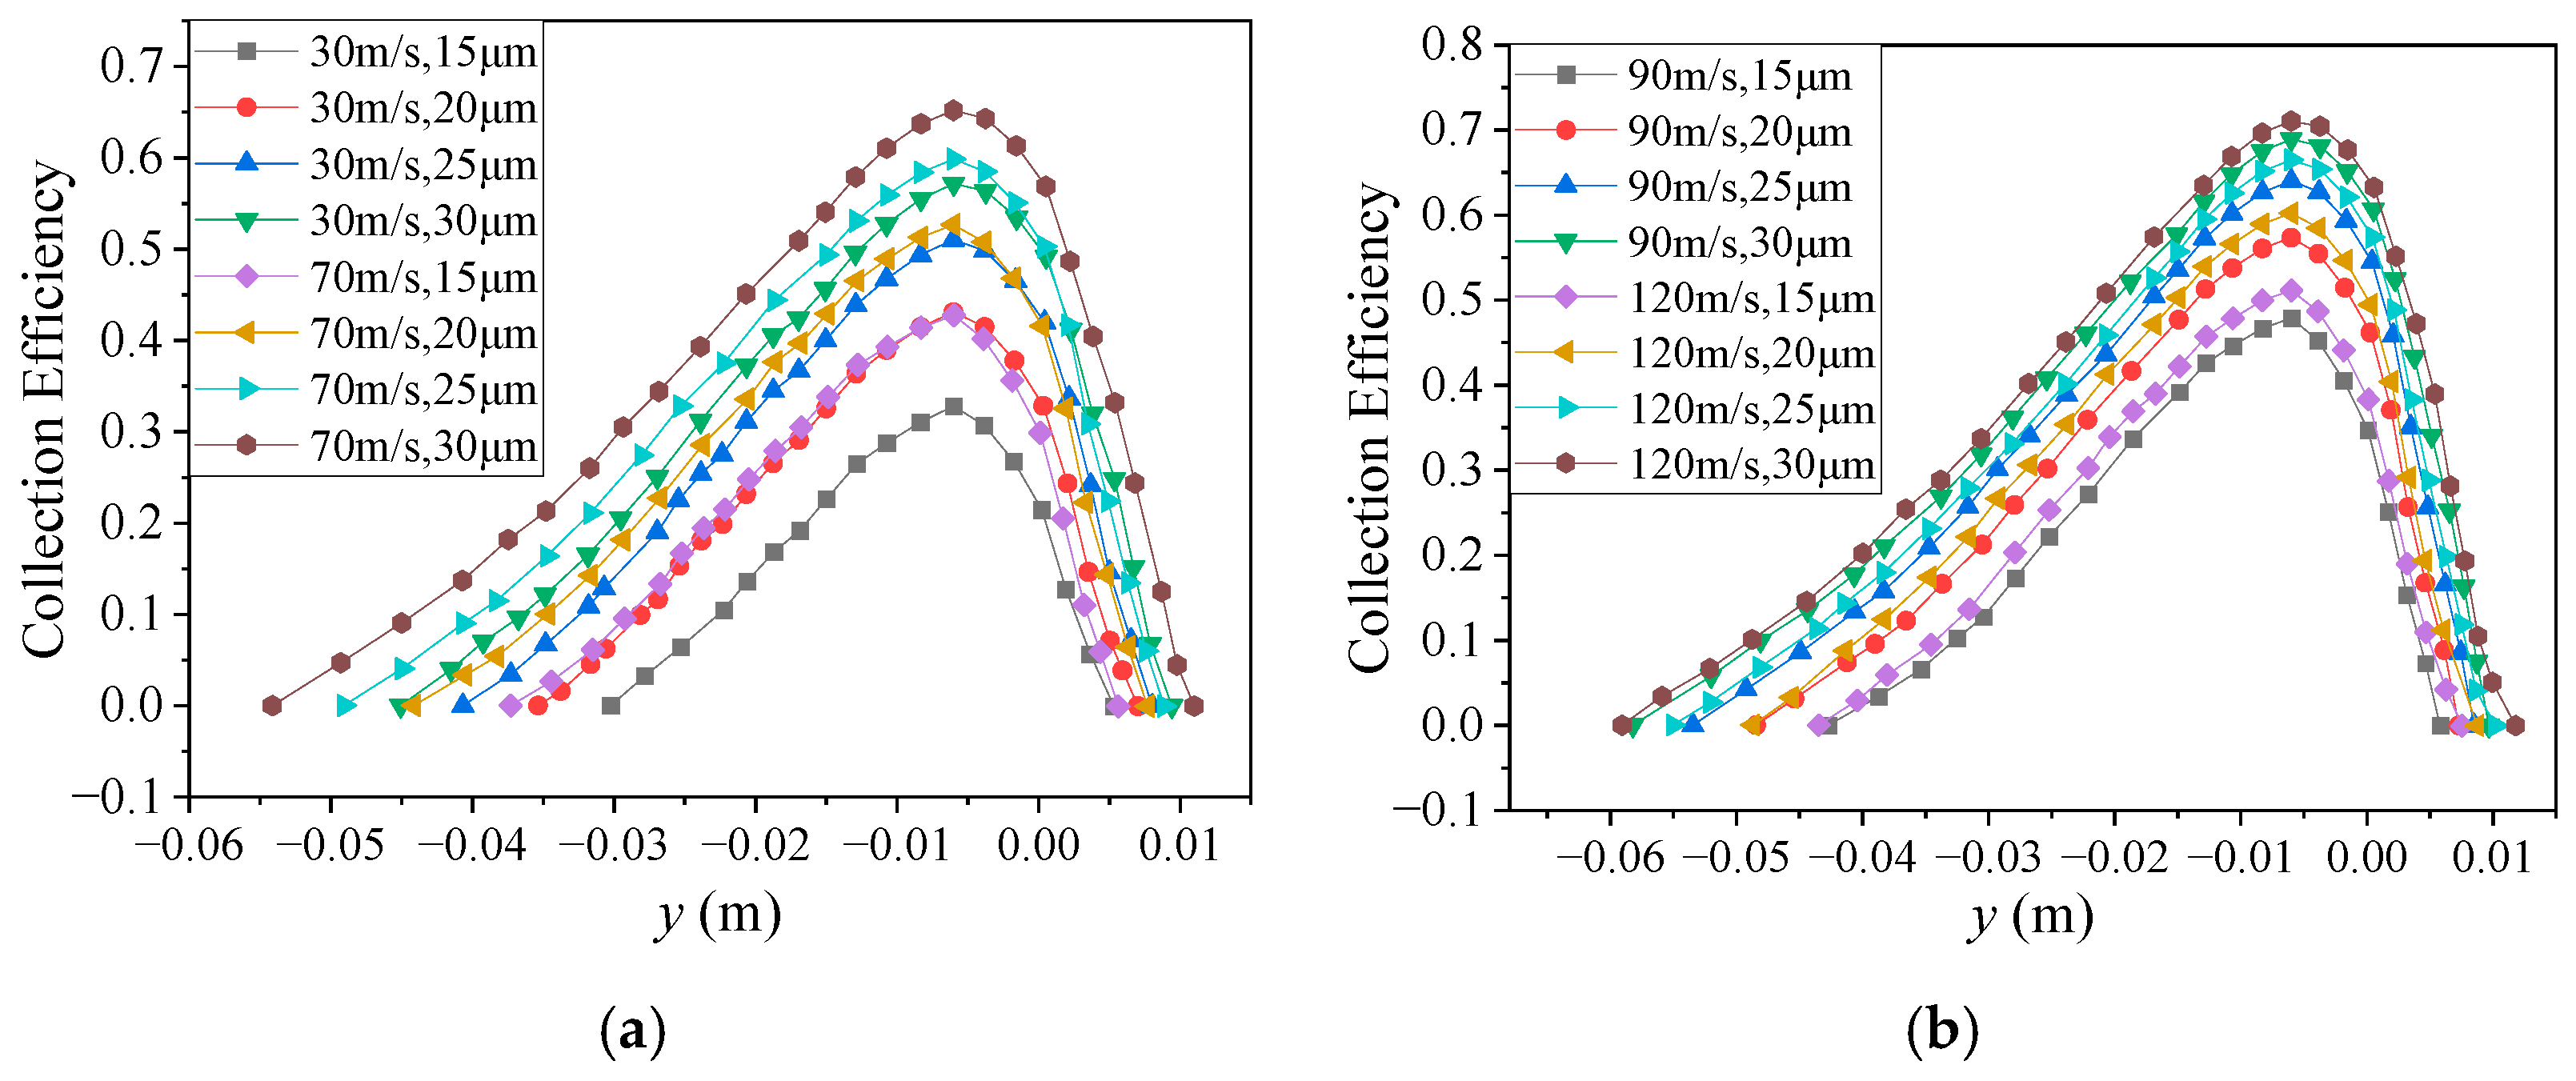
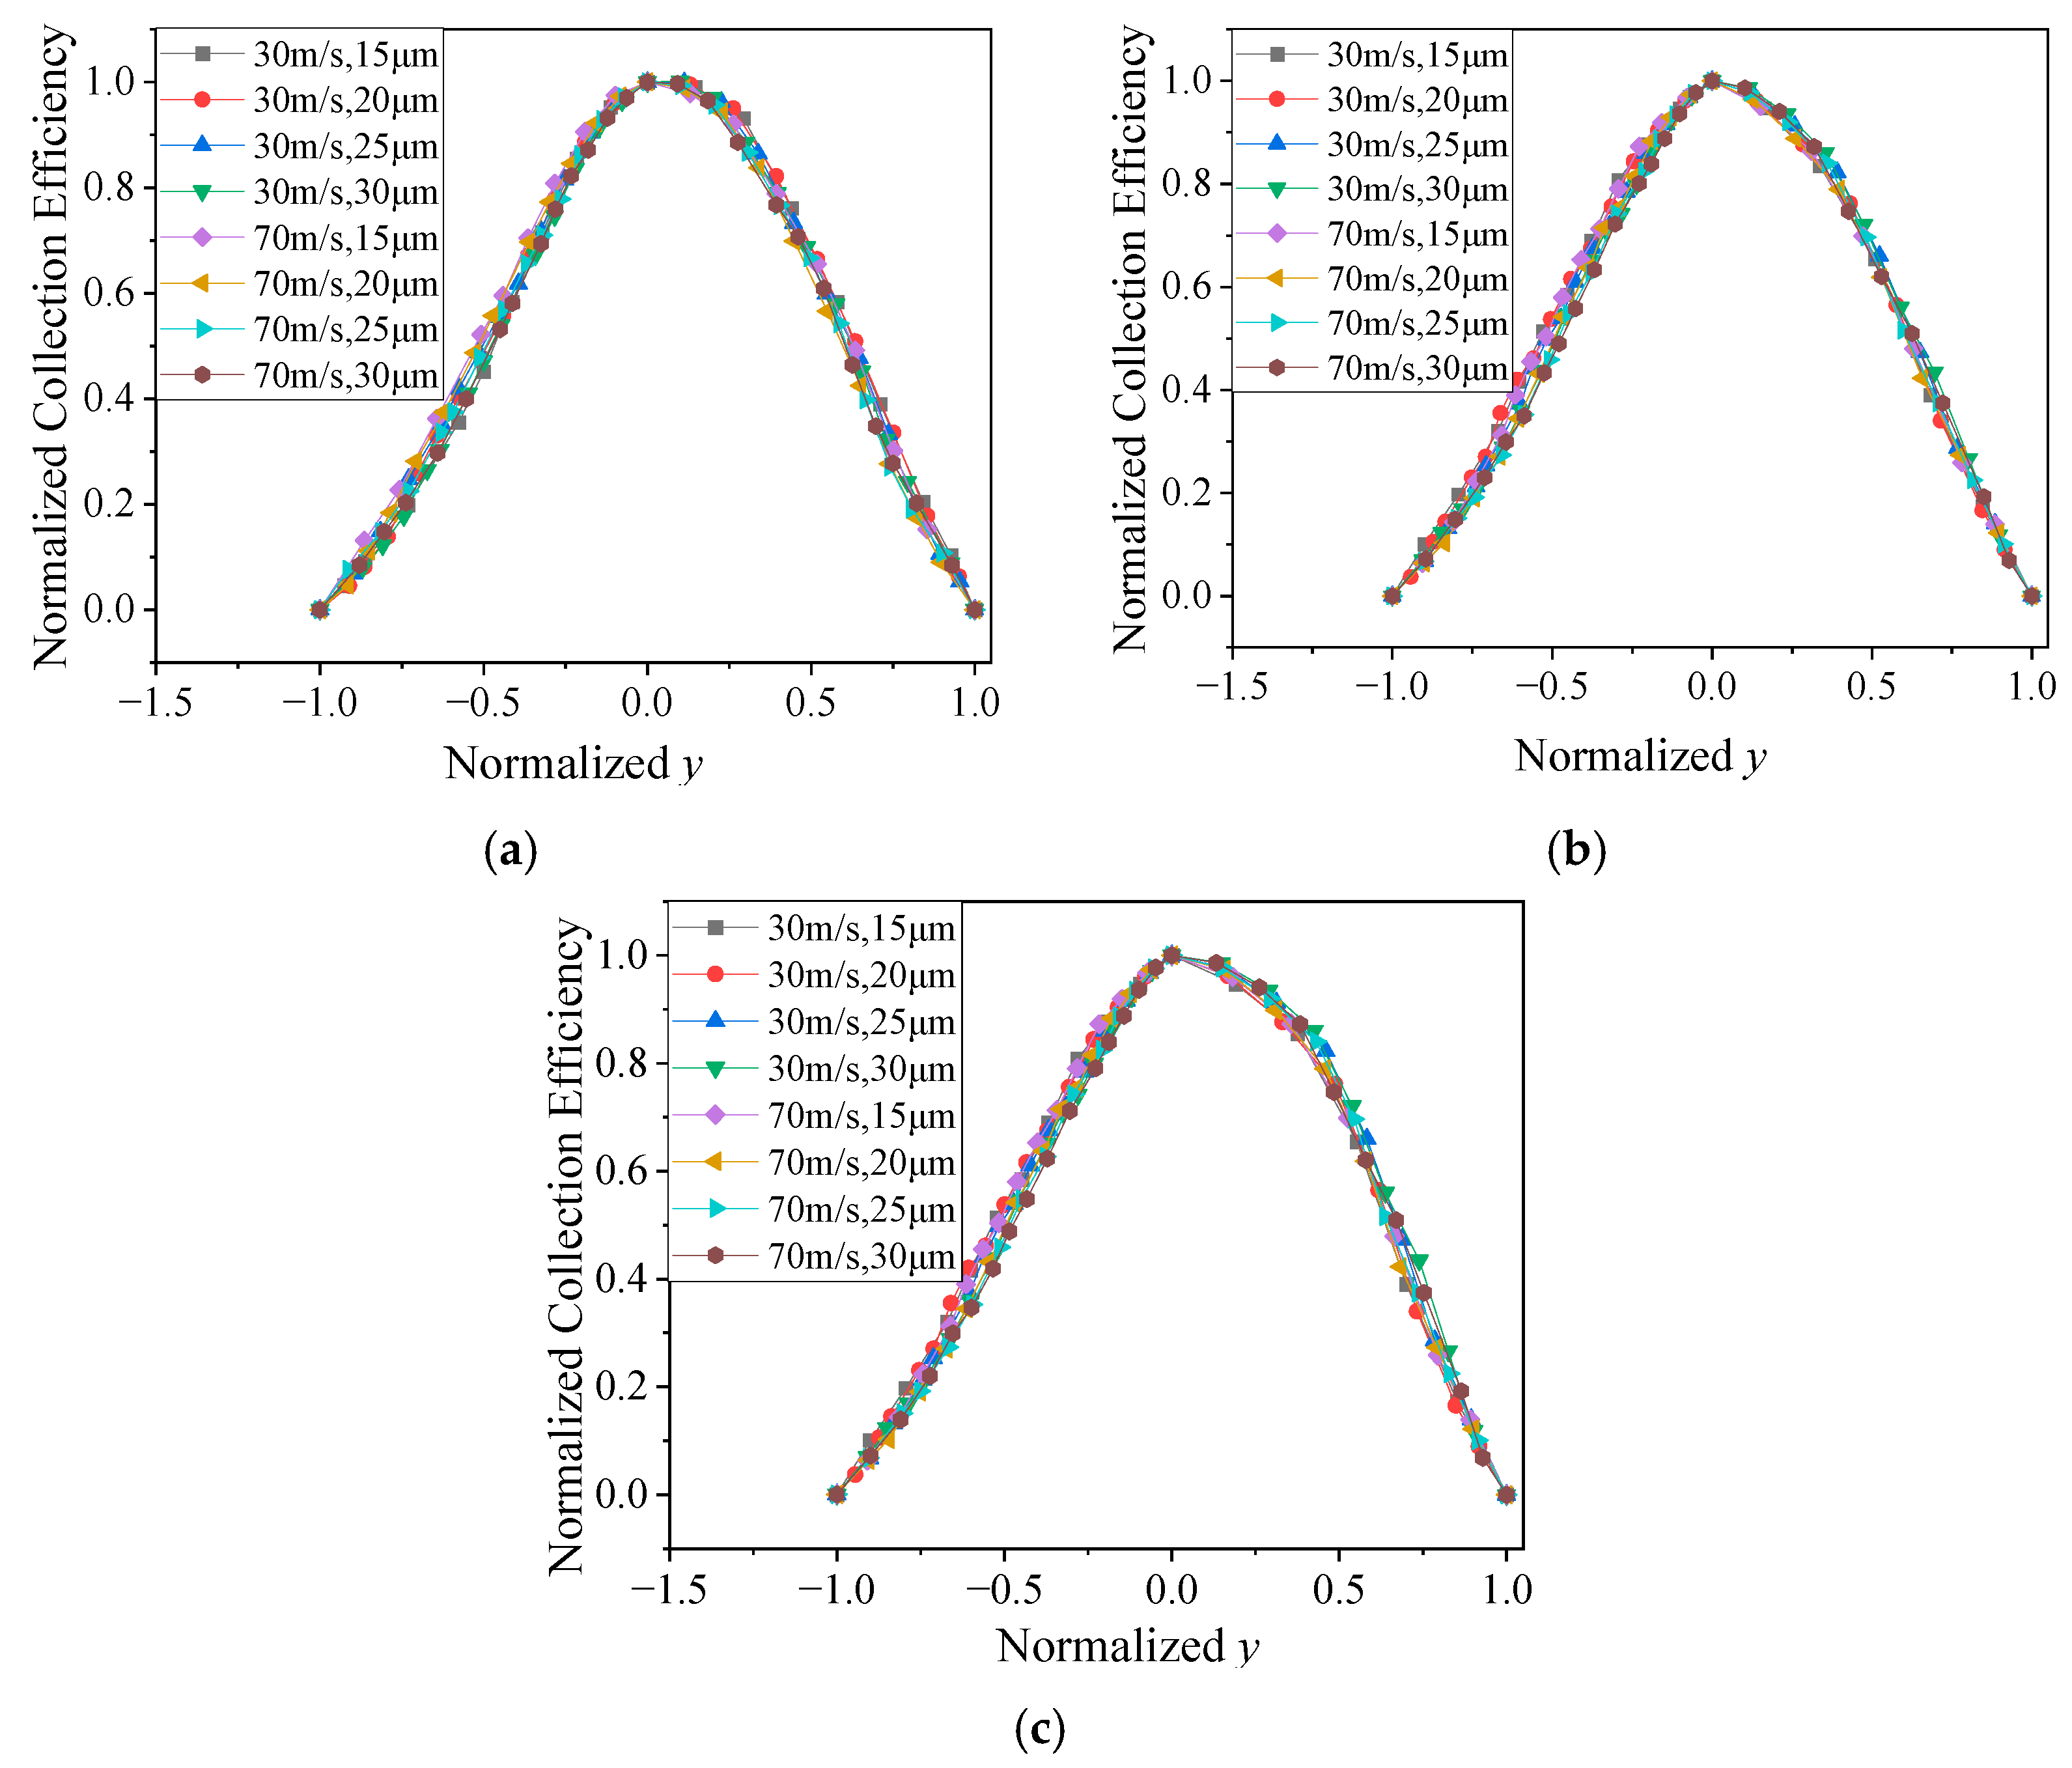
In order to explore the effect of the attack angle on DCE, we selected three angles of 2.5°, 5°, and 7.5° for calculation. Since the temperature and LWC have no effect on DCE, the velocity and droplet diameter are studied. Figure 22, Figure 23 and Figure 24 present the DCE curves under each angle of attack. It can be seen that the DCE curves at each attack angle have a highly similar regularity, and the regularity gradually transits from a normal distribution to skewed distribution with an increase in the attack angle.
For a skewed distribution, the skewness can be weakened or eliminated using certain coordinate transformations. Due to the similarity in the DCE curves for each attack angle, they can also be normalized. Firstly, we translate the coordinates of the stagnation point to the origin, then the abscissas on both sides of the origin are divided by the left or right maximum positions (left ymax or right ymax), and finally, the ordinate is divided by βmax. The normalized DCE curves are shown in Figure 25, in which the curves for each attack angle are also highly coincident. After normalization, the skewed distribution is gradually transformed into a normal distribution, similar to that at 0AOA (see Figure 17 and Equation (16)). When the angle of attack is large, the skewness on the right side of the curve is more significant compared to the normal distribution.
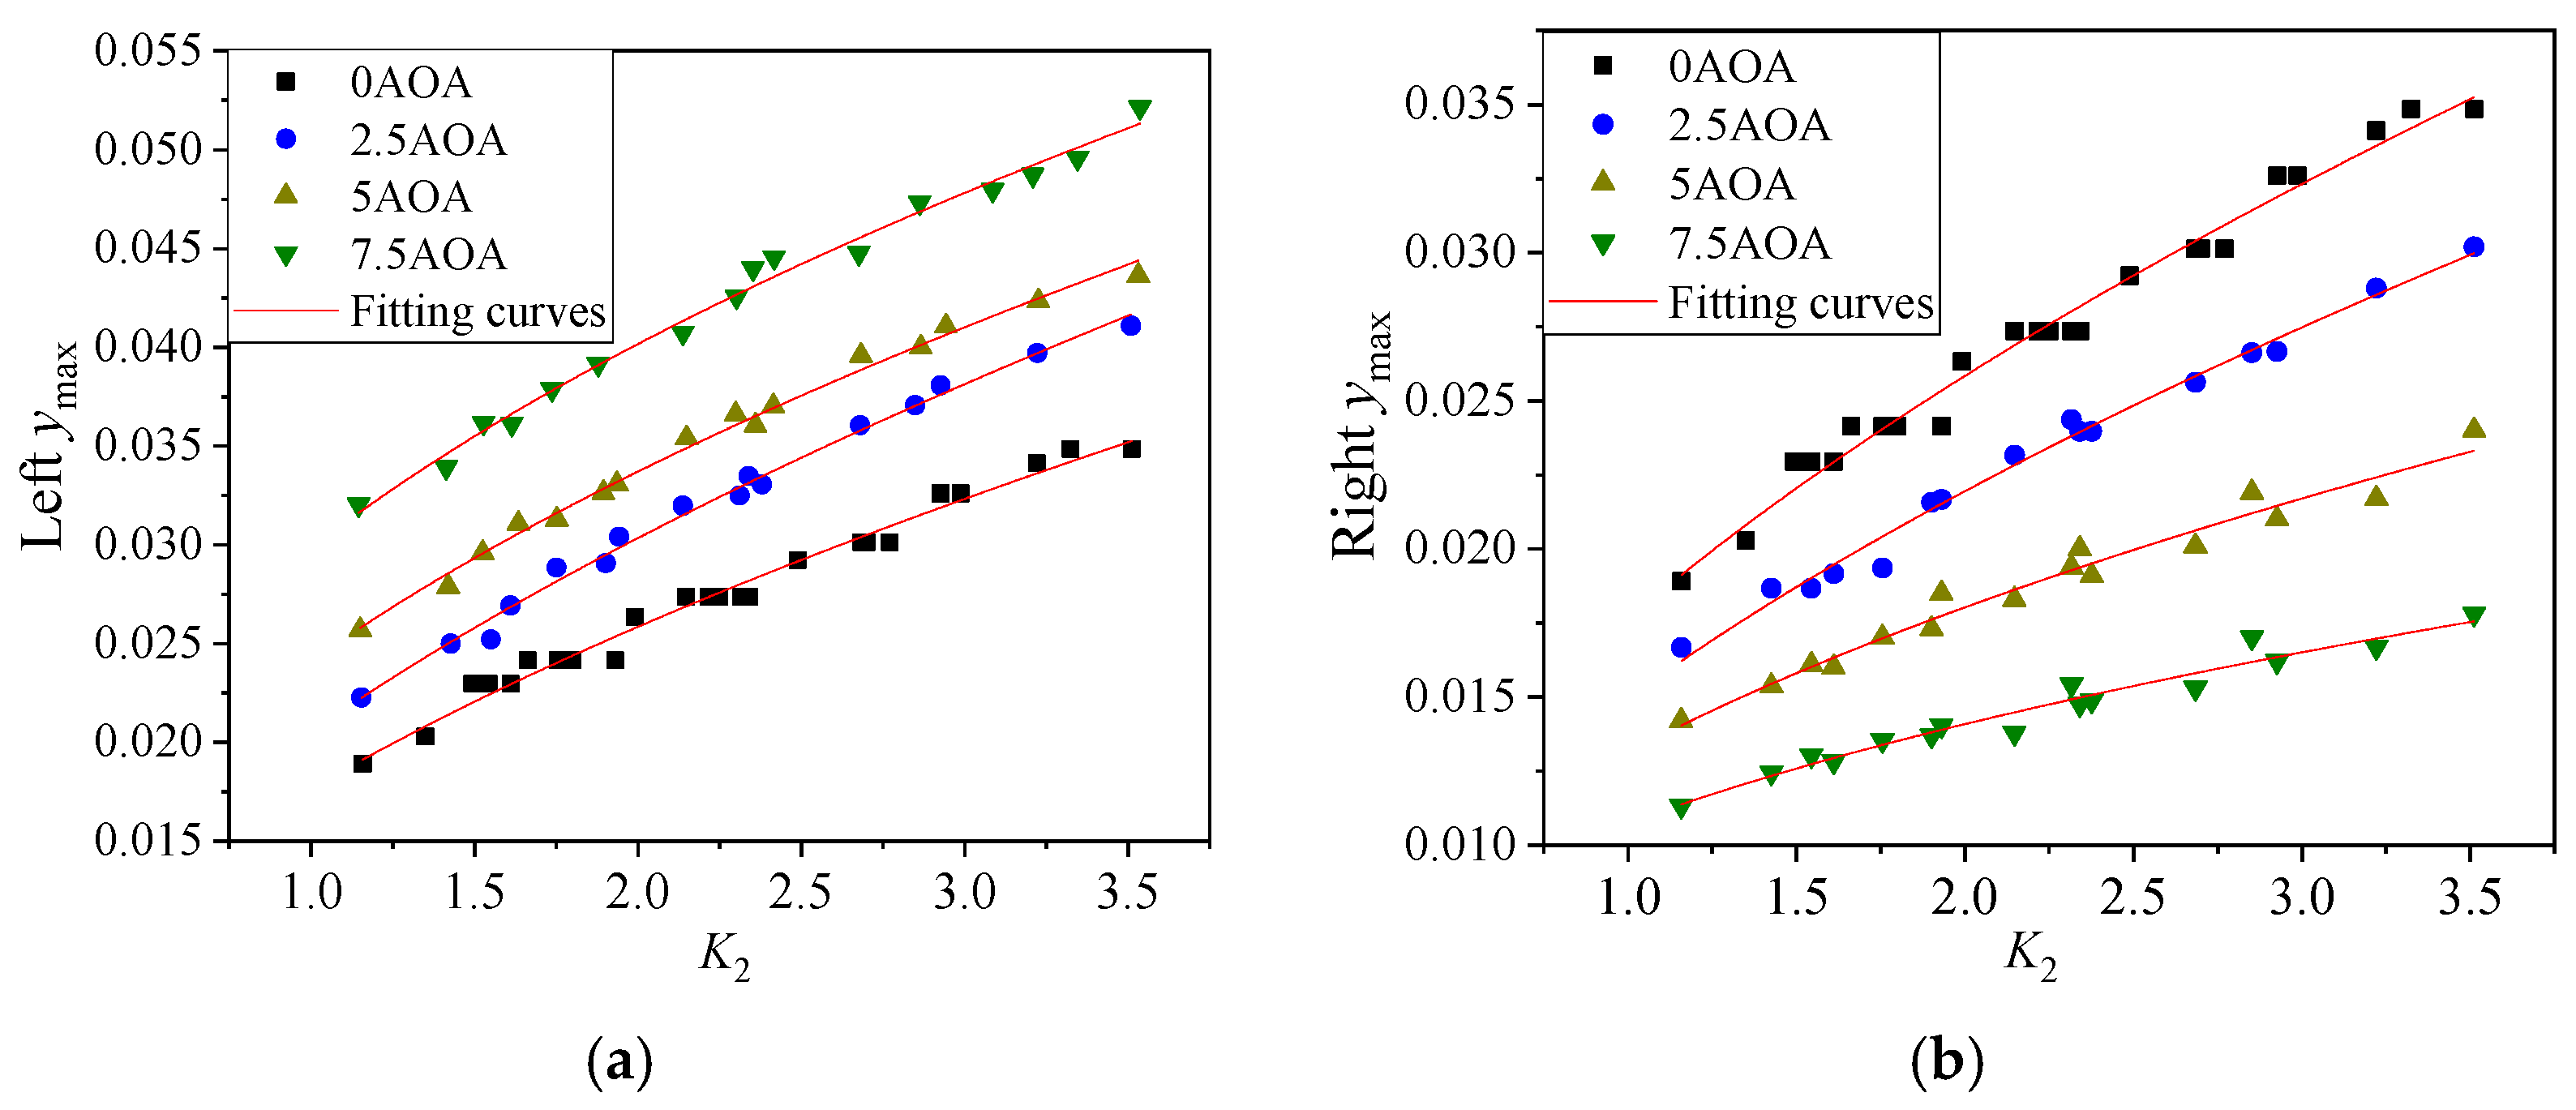
The relationship between inflow conditions and evaluation parameters was also studied. Using the intermediate parameter K2 (see Equation (20)), the left and right maximum positions can be identified, as shown in Figure 26, using Equations (22) and (23). For each angle of attack, there is a strong regularity in the relationship between the maximum position (ymax) and the dimensionless intermediate parameter (K2).
Left   y max = { 0.017 K 2 0.55 ,   for   0 AOA 0.021 K 2 0.56 ,   for   2.5 AOA 0.024 K 2 0.48 ,   for   5 AOA 0.029 K 2 0.43 ,   for   7.5 AOA
Right   y max = { 0.017 K 2 0.55 ,   for   0 AOA 0.015 K 2 0.55 ,   for   2.5 AOA 0.013 K 2 0.46 ,   for   5 AOA 0.011 K 2 0.39 ,   for   7.5 AOA
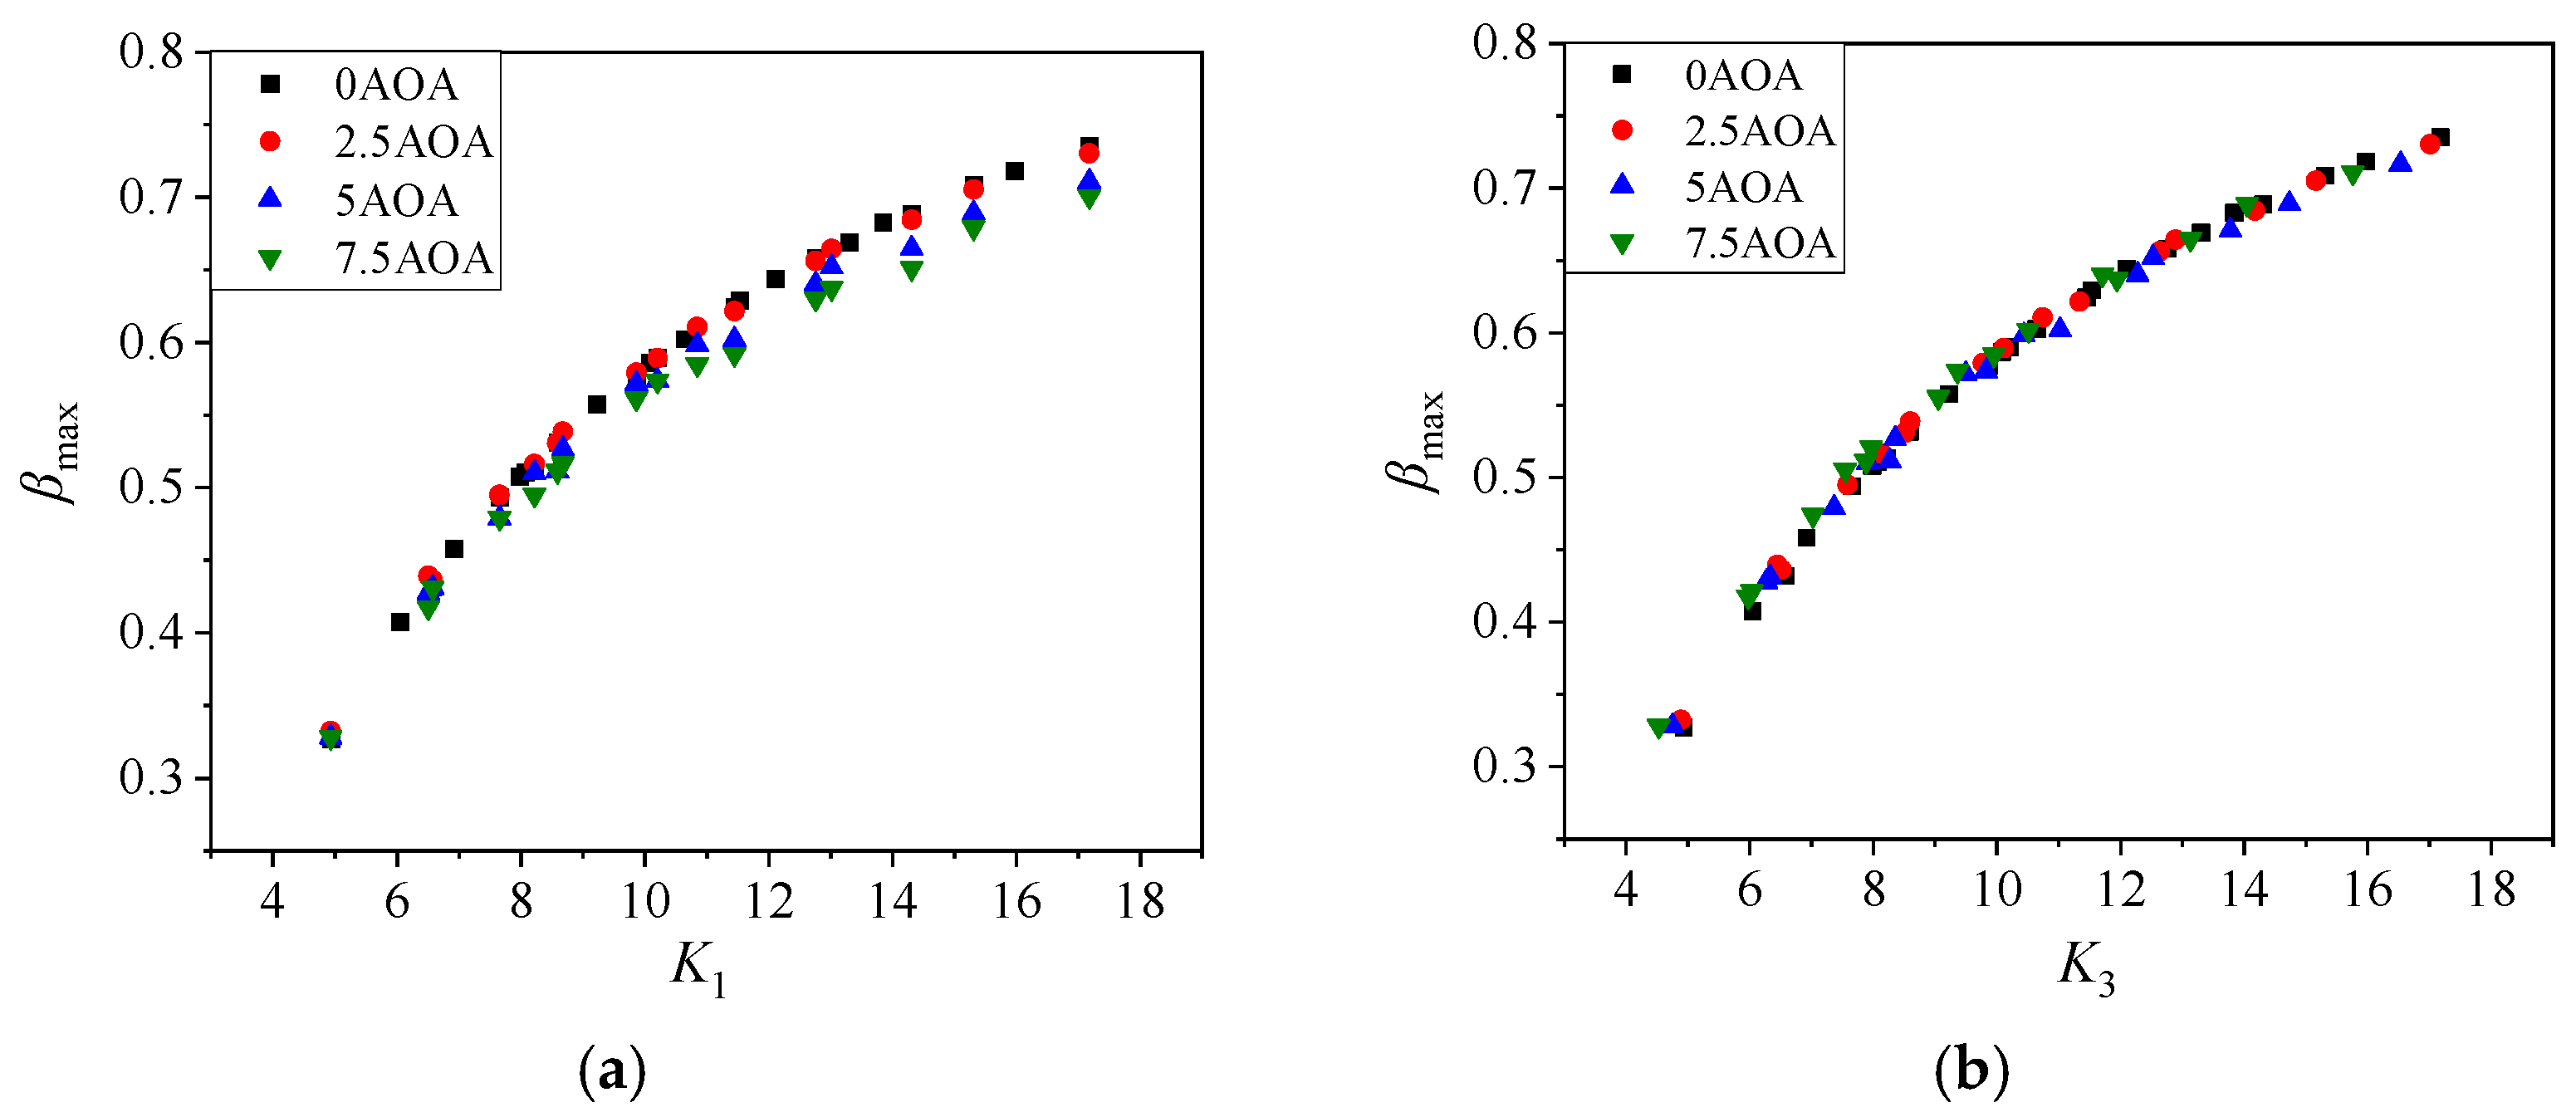
As for the peak efficiency βmax, when using the intermediate parameter K1 (see Equation (19)), the relationship can be drawn as in Figure 27a. Furthermore, we can take into account the attack angle and obtain a more unified image by introducing the K3 parameter (see Equation (24)), as shown in Figure 27b. Similar to the situation for 0AOA, the regularity of βmax is smoother than ymax.
K 3 = 1000 ( d D ) Re 0.4 ( cos α ) 2
Overall, when the angle of attack exists, the DCE curve remains highly similar. By normalizing the curves and establishing the relationship between incoming flow and normalized parameters, it is still possible to make the prediction of the collection efficiency.

5. Conclusions

This study presented a numerical model for DCE based on the Eulerian two-phase numerical method. The accuracy of the calculation model was verified with the NACA0012 airfoil and a two-dimensional cylinder model. The following conclusions can be obtained.
(1)
The LWC did not affect the DCE, while the incoming flow velocity and droplet size had remarkable effects on the DCE and the maximum position for the NACA0012 airfoil.
(2)
The DCE distribution under different conditions had a highly similar form, which could be normalized to the same distribution using the peak value βmax of DCE and maximum collection position ymax.
(3)
Intermediate parameters K1 and K2 were used to establish the relationship between incoming flow parameters and the DCE distribution. This regularity was well-fitted using a simple function, which predicted DCE from the droplet and incoming flow parameters.
(4)
The shape of an airfoil plays the most important role in the DCE distribution. So, the normal vector of the airfoil surface should be considered first when DCE characteristics are analyzed.
(5)
This study provides ideas for predicting the DCE for different models in engineering. Finding the unified normalized curve and establishing the relationship between incoming flow and normalized parameters are meaningful in practice.

Author Contributions

Conceptualization, Q.X. (Quanyong Xu) and F.W.; methodology, J.W.; software, J.W. and S.L.; validation, Q.X. (Quanzhong Xia) and Q.X. (Qiannan Xu); formal analysis, Q.X. (Quanyong Xu); investigation, S.L.; writing—original draft preparation, J.W. and Q.X. (Quanyong Xu); writing—review and editing, F.W., Q.X. (Quanzhong Xia), Q.X. (Qiannan Xu) and S.L.; supervision, Q.X. (Quanzhong Xia) and Q.X. (Qiannan Xu); funding acquisition, Q.X. (Quanyong Xu). All authors have read and agreed to the published version of the manuscript.

Funding

This study was supported by the National Science and Technology Major Project of China (J2019-V-0001-0092 and J2019-V-0013-0108).

Data Availability Statement

The numerical data used to support the findings of this study are included within the article.

Acknowledgments

Great thanks to Yang Chunxin, Han Yahui, and Liu Danyang of Beihang University for their discussion on this study.

Conflicts of Interest

The authors declare no conflict of interest.

References

  1. Morelli, M.; Zhou, B.Y.; Guardone, A. Simulation and analysis of oscillating airfoil ice shapes via a fully unsteady collection efficiency approach. In Proceedings of the 75th Annual Vertical Flight Society Forum and Technology Display (FORUM 75): The Future of Vertical Flight, Philadelphia, PA, USA, 13–16 May 2019. [Google Scholar]
  2. Cao, Y.; Huang, J.; Yin, J. Numerical simulation of three-dimensional ice accretion on an aircraft wing. Int. J. Heat Mass Transf. 2016, 92, 34–54. [Google Scholar] [CrossRef]
  3. You, T.; Sun, Y.; Zhang, Y.; Chen, J.; Zhang, P.; Yang, M. Accelerated frequent closed sequential pattern mining for uncertain data. Expert Syst. Appl. 2022, 204, 117254. [Google Scholar] [CrossRef]
  4. Liu, T.; Qu, K.; Cai, J.; Pan, S. A three-dimensional aircraft ice accretion model based on the numerical solution of the unsteady Stefan problem. Aerosp. Sci. Technol. 2019, 93, 105328. [Google Scholar] [CrossRef]
  5. McClain, S.T.; Vargas, M.M.; Tsao, J.C.; Broeren, A.P. Influence of airfoil angle of attack on ice accretion roughness. In Proceedings of the AIAA Aviation 2020 Forum, Virtual Event, 15–19 June 2020. [Google Scholar]
  6. Krishnakumar, M.; Lingadurai, K.; Mukesh, R.; Princeraj, L.; Naveen, V.; Kavya, M. Performance analysis of NACA2411 ice accreted original and optimized airfoils. In Proceedings of the International Conference on Material, Manufacturing and Machining, Tamilnadu, India, 8–9 March 2019. [Google Scholar]
  7. Bartkus, T.P.; Struk, P.M.; Tsao, J.C. Evaluation of a thermodynamic ice-crystal icing model using experimental ice accretion data. In Proceedings of the Atmospheric and Space Environments Conference, Atlanta, GA, USA, 25–29 June 2018. [Google Scholar]
  8. Li, S.; Paoli, R. Modeling of ice accretion over aircraft wings using a compressible OpenFOAM solver. Int. J. Aerospace. Eng. 2019, 2019, 4864927. [Google Scholar] [CrossRef]
  9. Nilamdeen, S.; Rao, V.S.; Switchenko, D.; Selvanayagam, J.; Ozcer, I.; Baruzzi, G.S. Numerical Simulation of Ice Crystal Accretion Inside an Engine Core Stator; SAE Technical Paper 2019-01-2017; SAE International: New York, NY, USA, 2019. [Google Scholar]
  10. Hamed, A.; Das, K.; Basu, D. Numerical simulations of ice droplet trajectories and collection efficiency on aero-engine rotating machinery. In Proceedings of the 43rd AIAA Aerospace Sciences Meeting and Exhibit, Reno, NV, USA, 10–13 January 2005. [Google Scholar]
  11. Hu, L.; Zhu, X.; Chen, J.; Shen, X.; Du, Z. Numerical simulation of rime ice on NREL Phase VI blade. J. Wind Eng. Ind. Aerod. 2018, 178, 57–68. [Google Scholar] [CrossRef]
  12. Ibrahim, G.M.; Pope, K.; Muzychka, Y.S. Effects of blade design on ice accretion for horizontal axis wind turbines. J. Wind Eng. Ind. Aerod. 2018, 173, 39–52. [Google Scholar] [CrossRef]
  13. Liu, Y.; Hu, H. An experimental investigation on the unsteady heat transfer process over an ice accreting airfoil surface. Int. J. Heat Mass Transfer 2018, 122, 707–718. [Google Scholar] [CrossRef]
  14. McClain, S.T.; Vargas, M.; Tsao, J.C.; Broeren, A. Influence of freestream temperature on ice accretion roughness. SAE Int. J. Adv. Curr. Prac. Mobility 2020, 2, 227–237. [Google Scholar]
  15. Shin, J.; Bond, T.H. Experimental and Computational Ice Shapes and Resulting Drag Increase for a NACA0012 Airfoil. In Proceedings of the Fifth Symposium on Numerical and Physical Aspects of Aerodynamic Flows, Long Beach, CA, USA, 13–16 January 1992. NASA-TM-105743. [Google Scholar]
  16. Ruff, G.A.; Berkowitz, B.M. Users Manual for the NASA Lewis Ice Accretion Prediction Code (LEWICE); NASA-CR-185129; NASA: Washington, DC, USA, 1990.
  17. Wright, W.B. Users Manual for the Improved NASA Lewis Ice Accretion Code LEWICE 1.6; NASA-CR-198355; NASA: Washington, DC, USA, 1995.
  18. Hedde, T.; Guffond, D. Improvement of the ONERA 3D icing code, comparison with 3D experimental shapes. In Proceedings of the 31st Aerospace Sciences Meeting, Reno, NV, USA, 11–14 January 1993. [Google Scholar]
  19. Bourgault, Y.; Habashi, W.G.; Dompierre, J.; Baruzzi, G.S. A finite element method study of Eulerian droplets impingement models. Int. J. Numer. Methods Fluids 1999, 29, 429–449. [Google Scholar] [CrossRef]
  20. Bourgault, Y.; Boutanios, Z.; Habashi, W.G. Three-dimensional Eulerian approach to droplet impingement simulation using FENSAP-ICE, Part 1: Model, algorithm, and validation. J. Aircr. 2000, 37, 95–103. [Google Scholar] [CrossRef]
  21. Wirogo, S.; Srirambhatla, S. An Eulerian method to calculate the collection efficiency on two and three dimensional bodies. In Proceedings of the 41st Aerospace Sciences Meeting and Exhibit, Reno, NV, USA, 6–9 January 2003. [Google Scholar]
  22. Tong, X.; Luke, E. Eulerian simulations of icing collection efficiency using a singularity diffusion model. In Proceedings of the 43rd AIAA Aerospace Sciences Meeting and Exhibit, Reno, NV, USA, 10–13 January 2005. [Google Scholar]
  23. Iuliano, E.; Brandi, V.; Mingione, G.; Nicola, C.; Tognaccini, R. Water impingement prediction on multi-element airfoils by means of Eulerian and Lagrangian approach with viscous and inviscid air flow. In Proceedings of the 44th AIAA Aerospace Sciences Meeting and Exhibit, Reno, NV, USA, 9–12 January 2006. [Google Scholar]
  24. Yoon, T.; Yee, K. Correction of local collection efficiency based on roughness element concept for glaze ice simulation. J. Mech. 2020, 36, 607–622. [Google Scholar] [CrossRef]
  25. Li, Z.; Tong, X.; Sun, J.; Jiang, F.; Yang, G.; Xiao, J. Methods and criterion for adaptive ICE accretion simulation: Mesh boundary merge and reconstruction. Int. J. Appl. Mech. 2020, 12, 2050105. [Google Scholar] [CrossRef]
  26. Takahashi, T.; Fukudome, K.; Mamori, H.; Fukushima, N.; Yamamoto, M. Effect of characteristic phenomena and temperature on super-cooled large droplet icing on NACA0012 airfoil and axial fan blade. Aerospace 2020, 7, 92. [Google Scholar] [CrossRef]
  27. Wen, C.Y. Mechanics of fluidization. Fluid Part. Technol. Chem. Eng. Prog. Symp. Ser. 1966, 62, 100–111. [Google Scholar]
  28. Gidaspow, D. Hydrodynamics of fiuidizatlon and heat transfer: Supercomputer modeling. Appl. Mech. Rev. 1986, 39, 1–23. [Google Scholar] [CrossRef]
  29. Papadakis, M.; Wong, S.C.; Rachman, A.; Huang, K.E.; Vu, G.T.; Bidwell, C.S. Large and Small Droplet Impingement Data on Airfoils and Two Simulated Ice Shapes; NASA/TM-2007-213959; NASA: Washington, DC, USA, 2007.
  30. Messinger, B.L. Equilibrium temperature of an unheated icing surface as a function of air speed. J. Aeronaut. Sci. 1953, 20, 29–42. [Google Scholar] [CrossRef]
  31. da Silva, G.A.L.; Arima, M.N.; Branco, N.N.; de Mattos, P.M. Proposed wall function models for heat transfer around a cylinder with rough surface in cross flow. In Proceedings of the SAE 2011 International Conference on Aircraft and Engine Icing and Ground Deicing, Chicago, IL, USA, 13–19 June 2011. [Google Scholar]
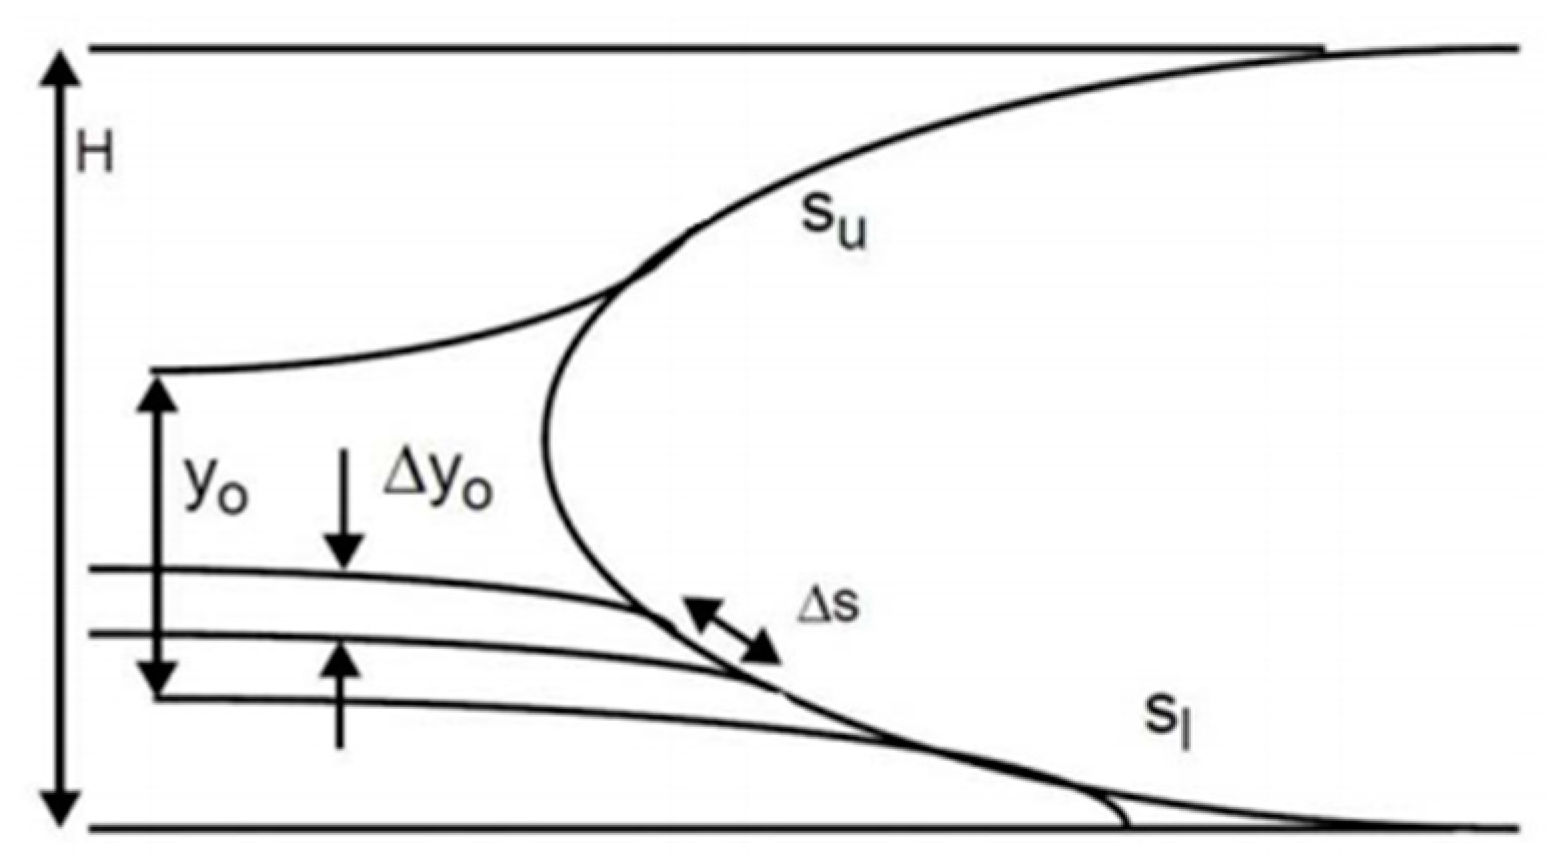
Figure 1. Definition for droplet impact parameters.
Aerospace 10 00412 g001
Figure 2. Mesh of NACA0012. (a) Overall mesh. (b) Mesh near the surface.
Aerospace 10 00412 g002
Figure 3. Grid independence verification for NACA0012. (a) Maximum collection efficiency. (b) Impact positions.
Aerospace 10 00412 g003
Figure 4. Collection efficiency verification for NACA0012 [21].
Aerospace 10 00412 g004
Figure 5. The flow of NACA0012. (a) Velocity. (b) LWC. (c) Collection efficiency.
Aerospace 10 00412 g005
Figure 6. Icing shape verification for NACA0012 (‘c’ represents chord length) [15].
Aerospace 10 00412 g006
Figure 7. Mesh in the two-dimensional cylinder. (a) Overall mesh. (b) Mesh near the surface.
Aerospace 10 00412 g007
Figure 8. Grid independence verification for the cylinder. (a) Maximum collection efficiency. (b) Impact position.
Aerospace 10 00412 g008
Figure 9. Collection efficiency verification for the two-dimensional cylinder [22].
Aerospace 10 00412 g009
Figure 10. Two-dimensional cylinder. (a) Velocity. (b) LWC. (c) Collection efficiency.
Aerospace 10 00412 g010
Figure 11. Collection efficiency curves at different LWC. (a) Fixing incoming flow velocity of 50 m/s and droplet diameter of 15 μm. (b) Fixing incoming flow velocity of 50 m/s and droplet diameter of 30 μm.
Aerospace 10 00412 g011
Figure 12. Collection efficiency curves at different velocities. (a) Droplet diameter of 15 μm. (b) Droplet diameter of 30 μm.
Aerospace 10 00412 g012
Figure 13. Droplet volume fraction at different velocities. (a) 30 m/s. (b) 70 m/s. (c) 120 m/s.
Aerospace 10 00412 g013
Figure 14. Collection efficiency curves under different droplet diameters. (a) Velocity of 30 m/s. (b) Velocity of 120 m/s.
Aerospace 10 00412 g014
Figure 15. Droplet velocity under different droplet diameters. (a) 20 μm. (b) 25 μm. (c) 30 μm.
Aerospace 10 00412 g015
Figure 16. Normalized distribution under different conditions. (a) Conditions 1–8. (b) Conditions 9–16.
Aerospace 10 00412 g016
Figure 17. Fitting results for the normalization distribution.
Aerospace 10 00412 g017
Figure 18. Curves for βmax and ymax. (a) βmax-K1 curve. (b) ymax-K2 curve.
Aerospace 10 00412 g018
Figure 19. |u|/|u∞| curve along the airfoil.
Aerospace 10 00412 g019
Figure 20. α/α curve along the airfoil.
Aerospace 10 00412 g020
Figure 21. cos(u·n) curve along the airfoil.
Aerospace 10 00412 g021
Figure 22. DCE curves under 2.5AOA. (a) Conditions 1–8. (b) Conditions 9–16.
Aerospace 10 00412 g022
Figure 23. DCE curves under 5AOA. (a) Conditions 1–8. (b) Conditions 9–16.
Aerospace 10 00412 g023
Figure 24. DCE curves under 7.5AOA. (a) Conditions 1–8. (b) Conditions 9–16.
Aerospace 10 00412 g024
Figure 25. Normalized DCE curves under each attack angle. (a) 2.5AOA. (b) 5AOA. (c) 7.5AOA.
Aerospace 10 00412 g025
Figure 26. Maximum position for the ymax curves. (a) Left ymax curve. (b) Right ymax curve.
Aerospace 10 00412 g026
Figure 27. Maximum collection efficiency βmax curves. (a) βmax-K1 curve. (b) βmax-K3 curve.
Aerospace 10 00412 g027
Disclaimer/Publisher’s Note: The statements, opinions and data contained in all publications are solely those of the individual author(s) and contributor(s) and not of MDPI and/or the editor(s). MDPI and/or the editor(s) disclaim responsibility for any injury to people or property resulting from any ideas, methods, instructions or products referred to in the content.