Abstract
Small satellite constellations in multiple-inclination, low-circular orbits around Mars and Venus have the potential to perform a range of high-value science investigations within cost-constrained missions. A major challenge for small satellites is that they require large to enter low-circular orbits, which can drive up both spacecraft mass and cost. Compared to chemical propulsion, which requires large amounts of propellant, and electric propulsion, which requires large solar arrays and comes with long flight times, aerocapture enables direct access to low-circular orbits at Mars and Venus with minimal . The study shows how drag-modulation aerocapture, when combined with small B-plane targeting maneuvers, allows the delivery of multiple small satellites to various-inclination, low-circular orbits to establish a constellation. Preliminary cost estimates indicate that by reducing the required for orbit insertion, aerocapture can potentially reduce the cost of a small satellite going to a low-circular Mars orbit compared to propulsive insertion. The ability of low-cost spacecraft to enter planetary orbits will enable a new paradigm of interplanetary missions using small dedicated launch vehicles and planetary constellations at Mars and Venus.
1. Introduction
Small satellites come at a fraction of the cost of large interplanetary orbiter missions and could enable a new revolution in our exploration of the Solar System, as with small satellites in Low Earth Orbit (LEO) [1]. Traditionally, planetary exploration has been performed through large programs such as the $500M Discovery-class [2], the $1B New Frontiers-class [3], and the $2–4B large Flagship-class missions [4]. NASA’s Planetary Science Division (PSD) has recognized the value and impact of SmallSats, from CubeSats to ESPA-class satellites, for high-value science missions to support exploration in addition to large missions [5]. In 2017, PSD solicited concepts using small spacecraft under the Small Innovative Missions for Planetary Exploration (SIMPLEx) program, within a cost cap of USD 55 million [6].
Compared to small satellites in LEO, which have very limited or no need for propulsion, interplanetary small satellites require propulsion systems that can deliver substantial capability for two maneuvers. The first is to escape the Earth’s sphere of influence if the spacecraft is only delivered to LEO or GTO and is not launched as a secondary payload on a planetary mission or a dedicated small-launch vehicle. The second is to achieve orbit insertion, which can be several hundred m/s to a few km/s of depending on the science orbit. Figure 1 shows the required impulsive orbit insertion at Mars and Venus as a function of the orbit apoapsis altitude. The required increases sharply, with a decrease in apoapsis altitude, as one moves towards low-circular orbits. For example, the required to achieve a 200 × 300 km orbit at Mars and Venus is approximately 2000 and 3500 m/s, respectively. This presents a significant challenge for small spacecraft, as large requirements can drive up both spacecraft mass and cost. A recent NASA study showed that the required is the largest cost driver for small missions, and minimizing the required can allow for smaller and cheaper spacecraft and lower total mission costs [7].
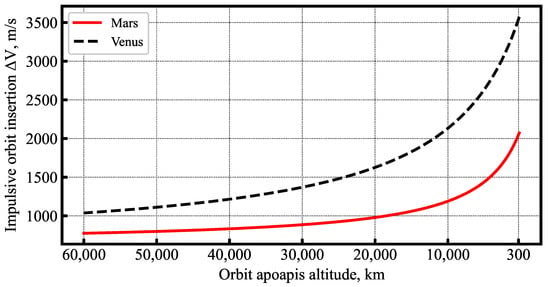
Figure 1.
Orbit insertion as a function of the apoapsis altitude at Mars and Venus from trajectories with = 2.5 and 3.5 km/s, respectively, periapsis altitude = 200 km.
There are three methods to achieve orbit insertion—(1) chemical propulsion; (2) electric propulsion; and (3) aerocapture. Figure 2 shows the dry-to-wet mass ratio as a function of for various propulsion systems computed using the rocket equation. With chemical bi-propellant systems, the maximum achievable is about 2600 m/s, beyond which the required propellant mass exceeds 60%. Electric propulsion provides a high specific impulse and keeps the propellant mass fraction small, but its low thrust level implies orbit transfers are slow. While a typical Earth–Mars transfer with chemical propulsion takes 12–15 months, an SEP trajectory takes approximately 24–28 months before entering operational orbit [8]. The long flight times can increase operational costs for small spacecraft. In addition, SEP requires large solar arrays, which can drive up the dry mass and cost [7].
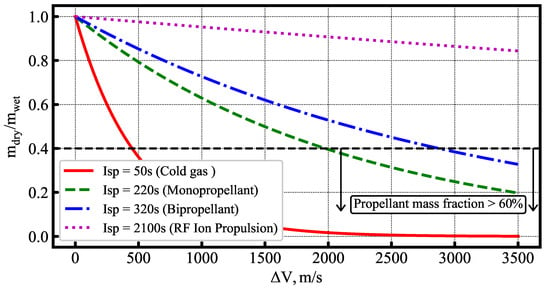
Figure 2.
Dry-to-wet mass ratio as a function of from the rocket equation. The dotted horizontal line demarcates the region below which the propellant mass fraction exceeds 60%.
The third option is aerocapture, which allows orbit insertion with a very small , enabling small spacecraft direct access into a low-circular orbit immediately upon arrival. The reduction in required minimizes spacecraft mass and can potentially reduce costs and thus enable constellations of multiple low-cost small spacecraft at Mars and Venus.
Drag-modulation aerocapture, a technique that uses atmospheric drag to decelerate spacecraft, has been proposed as a solution to enable small, low-cost satellites to achieve orbit insertion without a large propulsion system [9,10,11,12]. Figure 3 shows a schematic of the drag-modulation aerocapture concept. In simple discrete event drag modulation, the ballistic coefficient is allowed to take two values, a low-value with the drag skirt on and a high-value after the drag skirt is jettisoned [13]. The only control variable is the time at which the drag skirt is jettisoned. Over the past several years, drag modulation has emerged as the preferred control technique over lift modulation for low-cost mission concepts due to its simplicity. Several recent studies have investigated the feasibility and guidance performance for drag-modulation aerocapture at Mars and Venus [14,15,16,17,18].
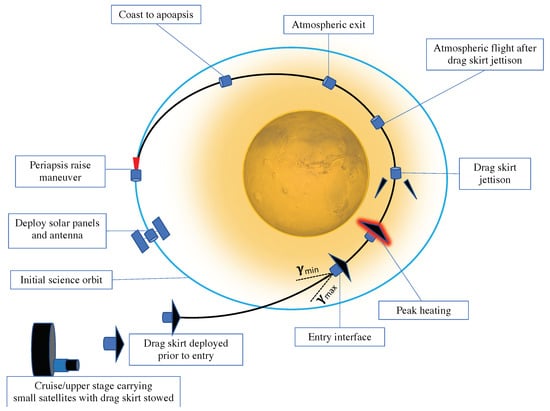
Figure 3.
Schematic showing the key events in drag-modulation aerocapture for small satellite orbit insertion. Distances are not to scale, and atmospheric extent is greatly exaggerated for clarity.
Several studies have proposed the use of small satellite constellations in low-circular orbits for future missions, but there are no studies investigating the use of aerocapture for planetary constellations. Some examples include: (1) a six-satellite constellation at Mars, which performs radio occultations using satellite cross-links to obtain hundreds of atmospheric profiles every day [19]; (2) a ten-satellite constellation at Mars to study the Martian climate system and volatile transport processes on a global scale [20]. The ability to establish constellations using small, low-cost satellites will enable a new paradigm in planetary exploration with global imaging and radar constellations that can image large portions of the planet in high cadence and detect surface changes, simultaneous multi-point observations of the magnetosphere, telecom relay networks, and satellite positioning systems [21]. The present study is the first to show how drag-modulation aerocapture when combined with very small B-plane targeting maneuvers allows the delivery of multiple small satellites to various inclination orbits from a single host spacecraft or a dedicated cruise stage and thus enable low-cost planetary constellations at Mars and Venus.
The present work aims to provide the planetary science community with a detailed mission analysis of using a drag modulation system to insert multiple small satellites into low-circular orbits at Mars and Venus. A host spacecraft or dedicated cruise stage is assumed to carry the small satellite(s) and provide power and propulsion during the interplanetary cruise. A few days prior to reaching the planet, the carrier spacecraft releases the small satellite(s) for aerocapture and then performs a deflection maneuver to target its own approach trajectory to perform propulsive orbit insertion at periapsis. The small satellite deploys its drag skirt prior to entry and performs aerocapture. A small propulsive Periapsis Raise Maneuver (PRM) at the first apoapsis is performed to raise the periapsis outside the atmosphere and complete its orbit insertion. The study is organized as follows. Detailed mission design and analysis are presented for a set of four small satellite concepts using aerocapture for orbit insertion to low-circular orbits:
- A mission concept to deliver a single 25 kg small satellite to a 200 × 2000 km near-equatorial Mars orbit as a secondary payload on a large orbiter mission.
- A mission concept to deliver a single 25 kg small satellite to a 200 × 2000 km polar Venus orbit as a secondary payload on a Venus orbiter mission.
- A mission concept to deliver a constellation of five small satellites to various inclinations (equatorial to polar), 200 × 2000 km Mars orbits as secondary payloads.
- A mission concept to deliver a constellation of five small satellites, all to near-polar inclination, 200 × 2000 km Venus orbits as secondary payloads on a Venus orbiter.
Combining the reduction from mission analysis and cost data published by Edwards et al. [7] for small spacecraft, a preliminary estimate of the cost savings offered by aerocapture for small satellites is presented. The results of the mission analysis can be extended to other related small satellite concepts at Mars and Venus, which are briefly discussed. These include standalone SmallSat missions using a dedicated low-cost launch vehicle [22], relay orbiter for lander/balloon missions [23], a global small lander network [24], and global imaging and radar constellations for future planetary missions [25].
2. Mathematical Models
2.1. Atmospheric Flight Mechanics
The general kinematic and dynamic equations of motion for atmospheric flight over a spherical planet in a planet-fixed reference frame are summarized below [26].
where r is the radial distance from the center of the planet, is the longitude, is the latitude, V is the velocity, is the flight-path angle, and is the heading angle [26].
The lift force L and drag force D are given by
where q = is the dynamic pressure, A is the vehicle aerodynamic reference area, m is the vehicle mass, is the lift coefficient, and is the drag coefficient. indicates the bank angle, g is the local gravitational acceleration, and is the planet rotation rate.
Thus the aerocapture vehicle state during atmospheric flight is defined by the vector [r, , , V, , ]. As shown in Figure 3, the entry flight path angle should be within the aerocapture corridor bounded by [, ]. The width of the corridor is the Theoretical Corridor Width (TCW) defined as . Given an entry state with all parameters except , a bisection algorithm implemented in the Aerocapture Mission Analysis Tool (AMAT) is used to successively propagate entry trajectories for an upper and lower bound guess for to compute and for a drag modulation vehicle design [27]. Once the corridor is computed, aerocapture trajectories can be propagated using the entry state [, , , , , ] till atmospheric exit with a guidance scheme used to determine the drag skirt jettison time in order to achieve the desired apoapsis. The convective heating rate is estimated using the Sutton–Graves empirical relation [28]:
where is the stagnation-point convective heating rate in W/cm2, K = for both Mars and Venus, is the freestream air density, and is the vehicle nose radius [29]. The radiative heating for Mars is assumed negligible for the low-ballistic coefficient entry system. This is a limitation of the current study because no empirical relations are readily available, and future studies are recommended to quantify the radiative heating contribution for low-ballistic coefficient entry at Mars. The radiative heating rate for Venus is given by [30,31]:
where is the stagnation point radiative heat flux in W/cm2, , and . The heating correlations are implemented in AMAT and can be used to compute the heating profiles once the entry trajectory is propagated.
2.2. Approach Trajectory, Entry State, and Deflection Maneuvers
Given an interplanetary arrival , the approach trajectory is completely defined by two parameters: (1) the trajectory periapsis magnitude , and (2) the angular position of the aim point on the B-plane measured clockwise from the +ve B.R axis. By choosing various values of from to , it becomes possible target inclinations ranging from the arrival declination up to polar orbits. The hyperbolic approach trajectory of the aerocapture vehicle until the entry interface and the entry state vector [, , , , , ] is computed using the analytic method developed by Hughes [32]. Once an entry state is obtained, the aerocapture corridor can be computed, and the approach trajectory can be recomputed iteratively by adjusting to obtain an approach trajectory that delivers the vehicle at the desired within the aerocapture corridor defined by [, ].
Given two approach trajectories defined by (, ) and (, ), which correspond to two aim points on the B-plane, and the distance from the planet at which the maneuver is performed, the analytic solution developed by Hughes [32] is used to compute the magnitude of the deflection maneuver required to change the approach trajectory. The calculation of approach trajectory and entry state vector from an arrival using a given (, ) and the deflection maneuvers is implemented in AMAT.
3. Aerocapture Vehicle Design
The aerocapture vehicle design used in the study is a scaled-up version of the Adaptable, Deployable Entry and Placement Technology (ADEPT) Sounding Rocket 1 (SR-1) flight test article [33,34]. ADEPT is particularly well suited for small satellites as secondary payloads because the stowed configuration minimizes the volume footprint on a host orbiter. The SR-1 test article shown in Figure 4 has an entry mass m = 11 kg, stowed diameter of 0.235 m, and a deployed diameter of 0.688 m. The current best estimate of the payload mass fraction (ratio of useful spacecraft mass to total entry mass) is 0.60. The drag coefficient for the configuration is 1.50, resulting in a ballistic coefficient = ≃ 20 kg/m2. The scaled-up version of the SR-1 article used in this study has a stowed diameter of 0.5 m and a deployed diameter of 1.5 m. The vehicle design uses the same = 20 kg/m2 to maintain comparable aerodynamic performance as the test article. This constrains the maximum entry mass m = to 53 kg. Assuming a payload mass fraction of 0.60 and allocating an additional 3 kg for the separation mechanism, the vehicle mass after the ADEPT jettison is 29 kg. The vehicle post-jettison of the drag skirt has the same diameter as the stowed configuration (D = 0.5 m), resulting in = 150 kg/m2 assuming = 1.0 for the spherical nose cap. This gives a ballistic coefficient ratio = 7.5 before and after jettison, which will be shown later to provide sufficient control authority and keep the peak heat rate within the tested limit of the carbon-cloth TPS at both Mars and Venus [35].
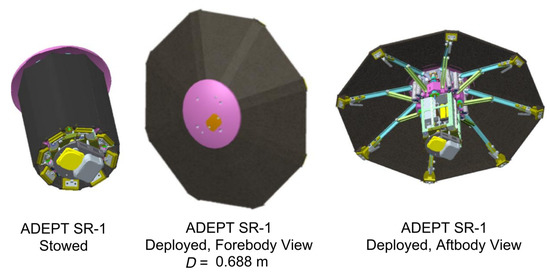
Figure 4.
Stowed and deployed configurations of the ADEPT SR-1 flight test article. Reproduced from the work by Dutta et al./NASA [34]. The scaled-up version of the SR-1 article used in this study has a stowed diameter of 0.5 m and a deployed diameter of 1.5 m.
4. Single Small Satellite to Mars Orbit as Secondary Payload
To illustrate the use of B-plane targeting to insert satellites into multiple orbits from a single interplanetary trajectory, delivery of a single small satellite as a secondary payload is first presented. This section provides a detailed mission analysis of the aerocapture trajectory of a single satellite and the deflection maneuver to target a different approach trajectory, which will later be extended to targeting multiple satellites at different orbits. The high-level mission objective is to deliver a small satellite to a near-equatorial Mars orbit as a secondary payload on a Mars polar orbiter mission. A few days prior to arrival at Mars, the host orbiter releases the small spacecraft on its approach trajectory for aerocapture. The host then performs a small deflection maneuver to target its approach trajectory for propulsive orbit insertion at periapsis. The mission requirements defined for this concept are arbitrarily selected for the study but illustrate how B-plane targeting maneuvers and aerocapture enable a small spacecraft to be inserted to a different inclination, low-circular orbit compared to that of the host, which goes into a highly-elliptical capture orbit.
4.1. Mission Requirements
The study requirements are as follows:
- The mission should deliver a 25 kg small satellite as a secondary payload on a Mars orbiter mission to a 200 × 2000 km near-equatorial Mars orbit.
- The concept must allow for at least 1.0 deg. of Theoretical Corridor Width (TCW) and accommodate a +/−0.2 deg. EFPA error at the entry interface.
- The maximum peak deceleration during aerocapture is not to exceed 5 g.
- The maximum peak stagnation-point heat rate is not to exceed 40 W/cm2, which is well within the 240 W/cm2 tested limit of the carbon cloth TPS.
- The stagnation-point total heat load is not to exceed 5 kJ/cm2.
- The periapsis raise maneuver propulsive to be performed by the small spacecraft after orbit insertion is not to exceed 40 m/s.
- The deflection maneuver to be performed by the orbiter to target its insertion into a 200 × 70,000 km orbit must not exceed 30 m/s.
- The deflection maneuver must be performed no earlier than 4 days prior to entry (to keep the small satellite EFPA error low) and no later than 2 days to allow the primary spacecraft to prepare for its orbit insertion maneuver.
4.2. Tradespace Exploration and Baseline Mission Concept
The study uses the framework and the Aerocapture Mission Analysis Tool (AMAT) developed at Purdue University for a rapid conceptual design of aerocapture missions [27,36]. The aerocapture feasibility chart is a graphical method for initial tradespace exploration and selecting a baseline interplanetary arrival and ballistic coefficient ratio for further analysis. The aerocapture feasibility chart has contours of theoretical corridor width (TCW), g-load, peak heat rate , and total heat load Q as a function of arrival and [37]. Figure 5 shows the drag-modulation aerocapture feasibility chart for Mars using a vehicle with = 20 kg/m2, = 0.235 m, and target apoapsis = 2000 km. The drag modulation vehicle design presented in Section 3 with = 7.5 is seen to provide the required TCW of 1 deg. across the typical range of arrival at Mars (2 to 4 km/s), and thus offers sufficient control authority for aerocapture and keeps the peak heat rate under 40 W/cm2.
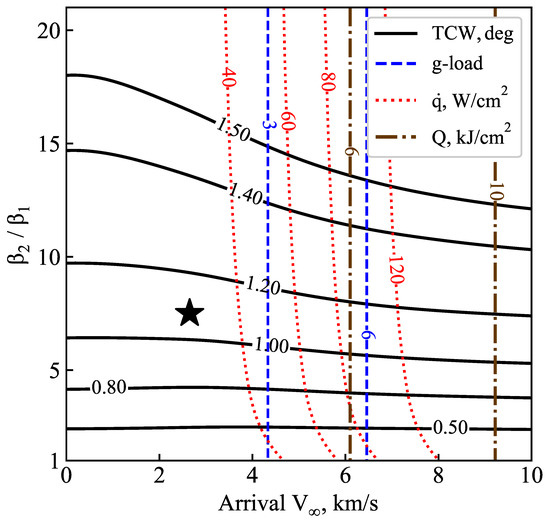
Figure 5.
Mars drag-modulation aerocapture feasibility chart with = 20 kg/m2, = 0.235 m, target apoapsis = 2000 km. The star indicates the selected baseline = 7.5 and = 2.65 km/s.
For the purpose of this study, the transfer trajectory used by the Mars 2020 mission with a launch date of 30 July 2020 and Mars arrival date of 18 February 2021 is used as a representative trajectory [38]. The arrival vector in the International Celestial Reference Frame (ICRF) is [2.239, 1.200, −0.7368] km/s, and the magnitude is 2.65 km/s. The arrival declination is 1.65 deg. The selected baseline and is indicated by the black star in Figure 5, which offers TCW > 1 deg., keeps the g-load below 3g, and keeps the heat rate below 40 W/cm2.
4.3. Small Satellite Approach Trajectory and Atmospheric Entry State
The hyperbolic approach trajectory of the aerocapture vehicle until the atmospheric entry interface is computed using the analytic method developed by Hughes [32]. To target a near-equatorial orbit, the angle is chosen to be , which results in a 1.65 deg. inclination orbit. The choice of determines the entry flight-path angle (EFPA) and must be selected so that the EFPA falls within the aerocapture entry corridor. An approach trajectory must be first computed to obtain the atmospheric entry state vector, which is then used to compute the aerocapture entry corridor. This iterative process is repeated until an acceptable approach trajectory that delivers the vehicle to the entry interface within the aerocapture corridor is found. An approach trajectory with km results in a planet-relative EFPA = −9.25 deg. at the atmospheric interface (h = 120 km) and will be shown to fall within the aerocapture entry corridor in Section 4.5. Figure 6 shows the approach trajectory of the vehicle until the atmospheric entry interface. Table 1 lists the nominal atmospheric entry conditions for the aerocapture vehicle at Mars.
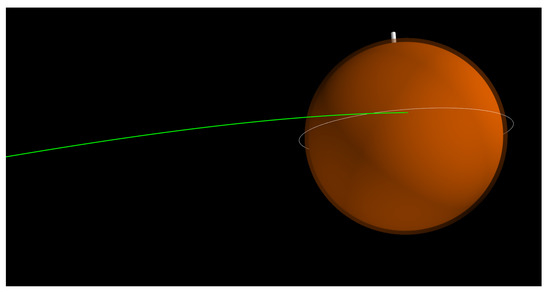
Figure 6.
Approach trajectory of the Mars small satellite aerocapture vehicle. The white ring and the solid line indicate the equatorial plane and the direction of the north pole, respectively.

Table 1.
Mars aerocapture vehicle atmospheric entry state.
4.4. Aerocapture Entry Corridor and Nominal Vehicle Trajectory
The aerocapture entry corridor is the range of EFPA within which the drag modulation vehicle can enter and achieve the target apoapsis altitude at the atmospheric exit by jettisoning the drag skirt at the appropriate time. The overshoot limit is the shallowest the vehicle can enter, and keeping the low-ballistic configuration (i.e., with the drag skirt on) for the entire duration of the flight, is able to achieve the target apoapsis altitude post aerocapture. The undershoot limit is the steepest the vehicle can enter, and keeping the high-ballistic configuration (i.e., the drag skirt jettisoned) for the entire duration of the flight, is able to achieve the target apoapsis altitude post aerocapture. The drag-modulation aerocapture entry corridor is thus bounded by the undershoot (steep) and overshoot (shallow) EFPA limits and the width of the corridor is the TCW. Table 2 shows the overshoot and undershoot EFPA limits for the Mars aerocapture vehicle computed using the entry state in Table 1.

Table 2.
Mars SmallSat aerocapture entry corridor.
Figure 7 shows the evolution of altitude, vehicle speed, deceleration, and stagnation-point heat rate for the Mars aerocapture vehicle with = 20 kg/m2, = 7.5, = 0.235 m entering at atmosphere-relative EFPA = −9.25 deg. The sharp change in the deceleration at 2.5 min after entry indicates the drag skirt jettison event. The peak deceleration is about 2.4 g, and the peak stagnation-point heat rate is 20 W/cm2. The timing of the jettison event is critical, as keeping the drag skirt on for just a few more seconds can result in the vehicle bleeding too much speed and not being able to exit the atmosphere.
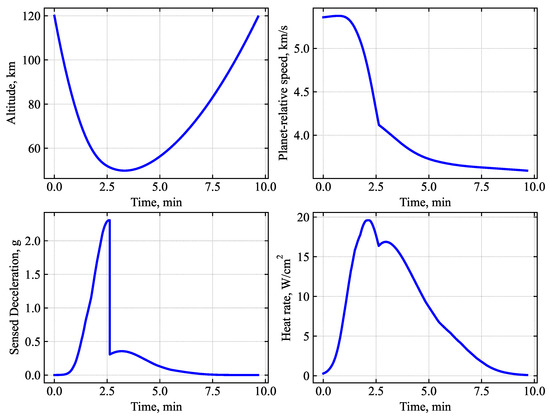
Figure 7.
Nominal Mars small satellite aerocapture trajectory for a vehicle with = 20 kg/m2, = 7.5, = 0.235 m entering at atm. relative EFPA = −9.25 deg. Target apoapsis = 2000 km.
4.5. Effect of Atmospheric Uncertainties and Target EFPA Selection
In addition to ensuring the target EFPA falls within the aerocapture corridor for a nominal Mars atmospheric profile found in Section 4.4, mission analysis must also account for the effect of atmospheric uncertainties on the aerocapture corridor. MarsGRAM provides the minimum (−3), average, and maximum (+3) density values for the atmospheric profile. The effect of these density variations on the aerocapture corridor must be accounted for when selecting the approach trajectory and the nominal target EFPA for the aerocapture entry system. Table 3 shows the effect of mean density variation on the corridor bounds. As the atmosphere density increases from minimum to maximum, both the overshoot and undershoot limits become shallower. The target EFPA must be selected such that when delivery errors are considered, the vehicle enters the aerocapture corridor both in the case of minimum- and maximum-density atmosphere.

Table 3.
Effect of density variations on Mars aerocapture corridor.
Figure 8 shows the effect of atmospheric density variations on the Mars aerocapture entry corridor. The blue, green, and red rectangles indicate the aerocapture corridor for the minimum, average, and maximum density atmospheric profiles. The solid blue line indicates the overshoot limit for the minimum density atmosphere. If the atmosphere density is minimum and the vehicle enters any shallower than this EFPA, there is not enough aerodynamic drag and the vehicle will overshoot its target orbit or may fail to be captured. The solid red line indicates the undershoot limit for the maximum density atmosphere. If the density is at a maximum and the vehicle enters any steeper, it will undershoot the apoapsis even with the high ballistic configuration throughout the flight. However, jettisoning the drag skirt immediately after entry will subject the vehicle to a substantially higher peak heat rate and must be avoided. Thus, the target EFPA is selected to be the mid-point of the shallow half of the available corridor across the three rectangles, which ensures the vehicle enters the corridor both in the case of minimum and maximum density atmosphere. The selected target EFPA = −9.25 deg. is indicated by the black dash-dot line, along with the assumed ±0.2 deg. delivery uncertainty indicated by the dotted lines.
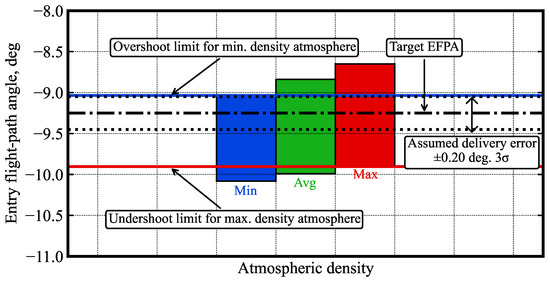
Figure 8.
Effect of density variation on Mars aerocapture corridor bounds. The black dash-dot line indicates the selected EFPA, and the black dotted lines indicate the assumed delivery error.
4.6. Guidance Scheme
Various guidance schemes for drag-modulation aerocapture have been studied in the existing literature [13,39,40]. Roelke et al. showed that using accelerometer measurements to create a density interpolator as the vehicle descends into the atmosphere performs consistently better than the density scale factor approaches used in earlier studies [41]. Using the measured density profile enables the guidance algorithm not to be reliant on any on-board density profiles. A simple guidance scheme using on-board density interpolation is used in this work to evaluate the preliminary design. For simplicity, the study assumes that there is no error in the density from accelerometer measurements and perfect knowledge of vehicle’s navigated state during entry. Once a pre-defined altitude rate threshold is exceeded, the vehicle starts predicting its apoapsis altitude at exit if the drag skirt is jettisoned in the next guidance cycle loop. Figure 9 shows the evolution of altitude rate and altitude for a guided Mars drag-modulation aerocapture trajectory. On-board density begins at entry and continues until a preset altitude rate of −200 m/s is exceeded at approximately 120 s after entry. At this point, apoapsis prediction is initiated in a 2 Hz guidance loop using the measured density model. For altitudes below the range for which measurements were available, a simple exponential scale height-based extrapolation is used. At approximately 188 s after entry, the drag-skirt jettison event is commanded.
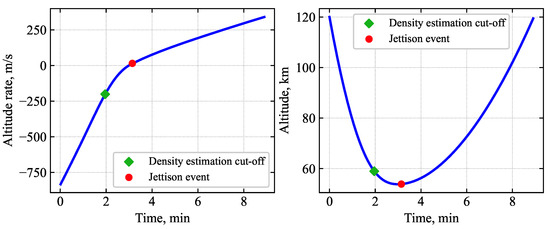
Figure 9.
Evolution of altitude rate and altitude during Mars aerocapture. The green diamond indicates the time when a preset altitude rate threshold (−200 m/s) is exceeded, at which point density estimation is cut off and apoapsis prediction is initiated. The red circle indicates the jettison event.
4.7. Performance Analysis
Nominal values of the parameters used in the Monte Carlo simulations and the uncertainties are listed in Table 4. For the navigation delivery uncertainty, only the uncertainty in the EFPA is considered, as this is the most important parameter of interest for aerocapture. The assumed ±3 uncertainty of 0.20 deg. is based on data available in the literature for a small satellite released by the host spacecraft 4 days prior to entry at Venus [42]. The atmospheric mean density uncertainty (±3) and random high-frequency perturbations are supplied by Mars-GRAM [43]. The minimum, average, and maximum mean density profiles are computed at the entry location (latitude, longitude) and a single local solar time. For the aerodynamic uncertainty, a nominal ±3 of 10% is assumed for the vehicle .

Table 4.
Mars aerocapture Monte Carlo uncertainties.
The entry state used for the Monte Carlo simulations is defined in Table 1 with the EFPA distribution from Table 4. The target apoapsis altitude is 2000 km. If the guidance algorithm detects the predicted apoapsis altitude at atmospheric exit is within the prescribed tolerance or below the target value, drag skirt jettison is commanded. A total of 1000 entry trajectories were propagated, all of which achieved successful orbit insertion. No trajectories resulted in the vehicle escaping the planet or crashing into the surface. Figure 10 shows the distribution of the apoapsis and periapsis altitude at atmospheric exit. Figure 11 shows the distribution of the peak g-load, stagnation-point heat rate, and the total heat load.
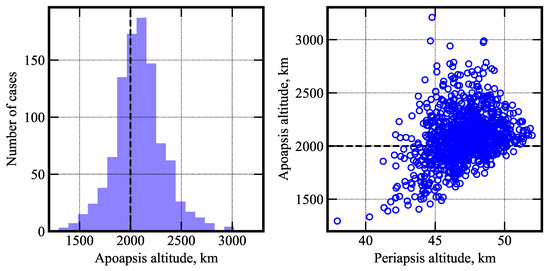
Figure 10.
Histogram of the apoapsis altitude (left) and the apoapsis altitude and periapsis altitude (right) for aerocapture at Mars. The dashed line indicates the target apoapsis altitude of 2000 km.
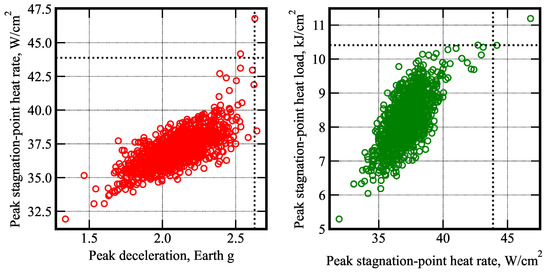
Figure 11.
Scatter plots of the peak deceleration, peak stagnation-point heat rate and the total heat load for aerocapture at Mars. The dotted lines indicate the 99.87 percentile values.
The achieved orbit apoapsis distribution is shown in Table 5. In total, 88.1% of the cases achieved apoapsis within ±400 km of the target, and 99.5% achieved apoapsis within ±800 km of the target. Table 6 shows the statistics from the Monte Carlo simulations. The 95 percentile peak deceleration and peak heat rate are 2.41 g and 39 W/cm2. The 95 percentile periapsis raise is 34 m/s. The apoapsis correction maneuver (ACM) is the magnitude of the maneuver performed at the periapsis to correct the apoapsis error after aerocapture.

Table 5.
Statistics for Mars aerocapture orbit apoapsis altitude.

Table 6.
Statistics from Mars aerocapture Monte Carlo simulations.
The ACM in Table 6 is reported as negative if the achieved orbit is larger than the target value and positive otherwise. The 95 percentile ACM is slightly higher than what may be acceptable for science missions. This is attributed to the simple guidance scheme used, which is sufficient for preliminary design but is not fully optimized. More advanced schemes, such as the ensemble correlation filter developed by Roelke et al., can significantly improve performance and reduce the required for apoapsis correction [41].
4.8. Orbiter Deflection Maneuver
The B-plane aim point during the interplanetary hyperbolic approach will be that of the SmallSat, indicated by the green circle in Figure 12. For the small satellite targeting a near-equatorial orbit, the trajectory is defined by km, and = 3/2. The orbiter’s approach trajectory for insertion into a 250 × 70,000 km polar orbit is defined by km, and = is indicated by the magenta star in Figure 12.
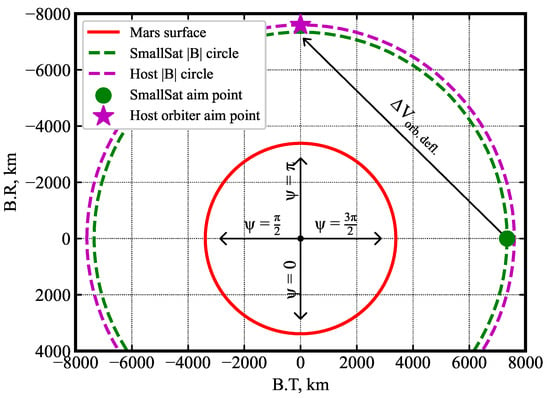
Figure 12.
Small satellite and host orbiter aim points on the Mars B-plane. After releasing the SmallSat, the host orbiter performs a deflection maneuver to target its aim point.
Figure 13 shows the magnitude of the deflection maneuver as a function of time from SmallSat release until entry and the angular position on the host aim-point circle shown in Figure 12. The farther out from the planet the maneuver is performed and the smaller the length of the vector connecting the two aim points on the B-plane, the smaller the magnitude of the deflection maneuver . Note that the SmallSat aim point was at = 3/2; hence, the deflection is the smallest if the target aim point is also at = 3/2, and largest when = /2 (diametrically opposite to the initial aim point). However, the farther out the SmallSat is released, the higher the EFPA error at the entry interface will be. The decision on when the SmallSat can be released is thus a compromise between orbiter deflection and EFPA error for the small satellite at entry. Based on navigation studies for aerocapture at Venus by Austin et al. [42], the SmallSat is released 4 days prior to entry to keep the 3 EFPA error below ±0.2 deg. The magnitude of the deflection maneuver to target is 29.5 m/s, within the 30 m/s limit set forth in the mission requirements.
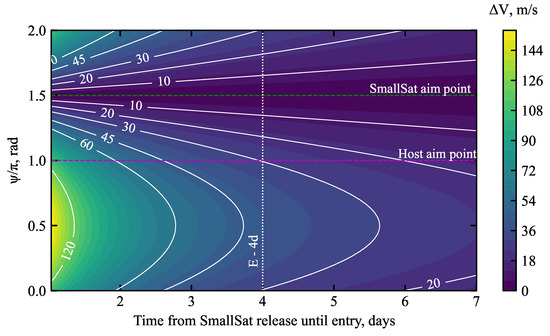
Figure 13.
Orbiter deflection maneuver as a function of time from SmallSat release until entry, and the angular position on the host aim-point circle shown in Figure 12.
Figure 14 shows the near-equatorial approach directory of the small satellite until entry and the approach trajectory of the host orbiter over the north pole.
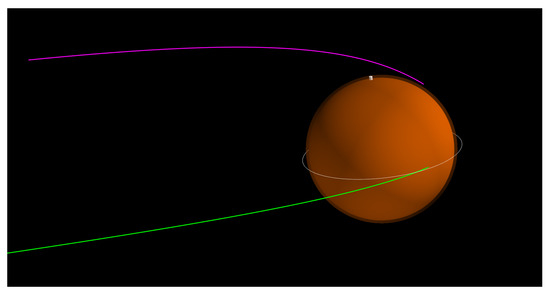
Figure 14.
Hyperbolic near-equatorial approach trajectory of the Mars SmallSat (green), and the polar approach trajectory of the host orbiter spacecraft (magenta) until periapsis.
The host orbiter performs a 790 m/s propulsive burn into its 250 × 70,000 km polar orbit. Figure 15 shows the two spacecraft in their capture orbits.
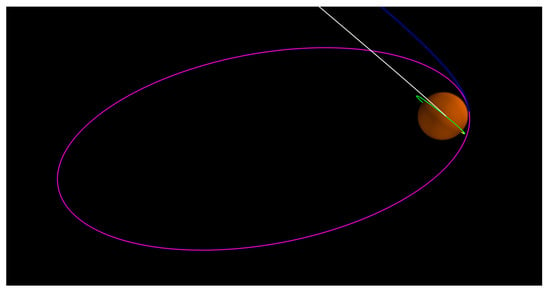
Figure 15.
Mars small satellite in 200 × 2000 km near-equatorial orbit post aerocapture (green), and the host orbiter in 250 × 70,000 km polar orbit after propulsive orbit insertion.
5. Single Small Satellite to Venus Orbit as Secondary Payload
The high-level mission objective is to insert a small satellite into a low-circular polar orbit at Venus as a secondary payload on an orbiter mission. Venus has a much higher gravity well than Mars but a similar atmospheric extent, resulting in a much smaller aerocapture entry corridor compared to Mars. This imposes more stringent constraints on the allowable EFPA error for the small satellite at the entry interface than at Mars. Due to its bigger gravity well and thicker atmosphere, both entry speed and aerothermal heating are considerably higher at Venus compared to Mars. The more demanding entry conditions require increasing the allowable deceleration to 10g and the peak heat rate to 240 W/cm2.
5.1. Mission Requirements
The study requirements are as follows:
- The mission should deliver a 25 kg small satellite as a secondary payload on a Venus orbiter mission to a 200 × 2000 km near-polar Venus orbit.
- The concept must allow for at least 0.4 deg. of Theoretical Corridor Width and accommodate a +/−0.1 deg. EFPA error at entry interface.
- The maximum peak deceleration during aerocapture is not to exceed 10 g.
- The maximum peak stagnation-point heat rate is not to exceed 240 W/cm2
- The stagnation-point total heat load is not to exceed 25 kJ/cm2.
- The orbiter deflection maneuver must not exceed 10 m/s.
- The deflection maneuver must be performed no earlier than 2 days before entry.
5.2. Tradespace Exploration and Baseline Mission Concept
Figure 16 shows the drag-modulation aerocapture feasibility chart for Venus using a vehicle with = 20 kg/m2, = 0.235 m, and target apoapsis = 2000 km. The drag modulation vehicle design presented in Section 3 with = 7.5 is shown to provide the required TCW of 0.4 deg. for arrival in the range of 3 to 5 km/s. The interplanetary trajectory used by the Akatsuki mission, with a launch date of 10 May 2010 and Venus arrival date of 6 December 2010, is used as a representative Earth–Venus trajectory [44]. The vector in the ICRF is [−3.269, 0.676, −1.069] km/s, and the magnitude is 3.51 km/s. The selected vehicle and arrival is indicated by the black star in Figure 16, which offers TCW > 0.4 deg. and keeps the peak heat rate at approximately 200 W/cm2.
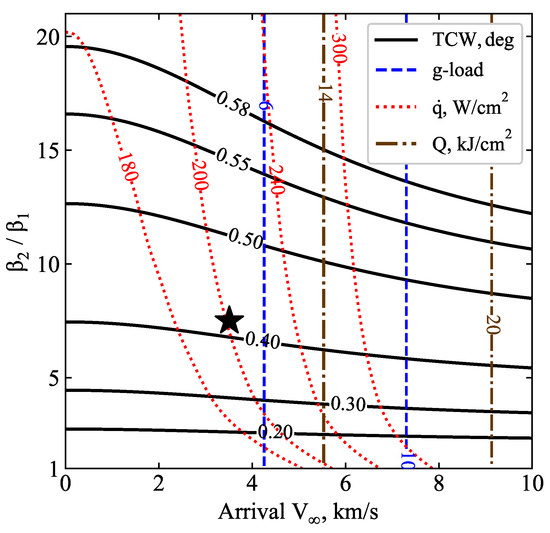
Figure 16.
Venus drag-modulation aerocapture feasibility chart with = 20 kg/m2, = 0.235 m, target apoapsis = 2000 km. The star indicates the selected baseline = 7.5 and = 3.51 km/s.
5.3. Small Satellite Approach Trajectory and Atmospheric Entry State
An approach trajectory with km, = is selected to achieve a 90 deg. inclination orbit. This results in a planet-relative EFPA = −5.20 deg. at the atmospheric interface (h = 150 km) and will be shown to fall within the aerocapture entry corridor in Section 5.5. Table 7 lists the nominal atmospheric entry conditions for the aerocapture vehicle. Figure 17 shows the approach trajectory of the vehicle until the atmospheric entry interface.

Table 7.
Venus aerocapture vehicle atmospheric entry state.
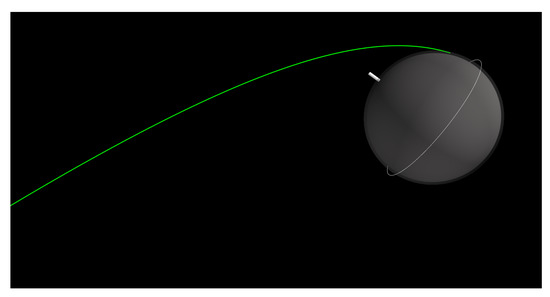
Figure 17.
Approach trajectory of the Venus small satellite aerocapture vehicle. The white ring and the solid line indicate the equatorial plane and the direction of the north pole, respectively.
5.4. Aerocapture Entry Corridor and Nominal Vehicle Trajectory
Table 8 shows the overshoot and undershoot EFPA limits for the Venus aerocapture vehicle computed using the entry state in Table 7.

Table 8.
Venus SmallSat aerocapture entry corridor.
Figure 18 shows a nominal trajectory of the Venus aerocapture vehicle entering at EFPA = −5.2 deg. The peak deceleration is about 7 g, and the peak stagnation-point heat rate is 155 W/cm2, considerably higher than that at Mars with the same aerocapture vehicle.
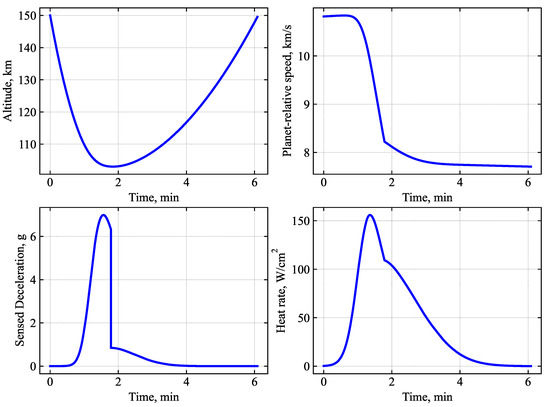
Figure 18.
Nominal Venus small satellite aerocapture trajectory for a vehicle with = 20 kg/m2, = 7.5, = 0.235 m entering at atm. relative to EFPA = −5.20 deg. Target apoapsis = 2000 km.
5.5. Effect of Atmospheric Uncertainties and Target EFPA Selection
As discussed in Section 4.5, the effect of atmospheric mean density uncertainties must be considered when selecting the target EFPA. Table 9 shows the corridor bounds using a representative minimum, average, and maximum mean density profile from VenusGRAM.

Table 9.
Effect of density variations on Venus aerocapture corridor.
Figure 19 shows the effect of atmospheric density variations on the Venus aerocapture entry corridor. The blue, green, and red rectangles indicate the aerocapture corridor for the minimum, average, and maximum density atmospheric profiles, respectively. Initially, a target EFPA = −5.3 deg. was selected, but it was found that the mean density of the atmospheric profiles used for the Monte Carlo simulation was slightly higher than those used to compute the corridor bounds in Figure 19. This required adjusting the nominal target EFPA to −5.2 deg. (slightly more shallow), which is used for the Monte Carlo simulations.
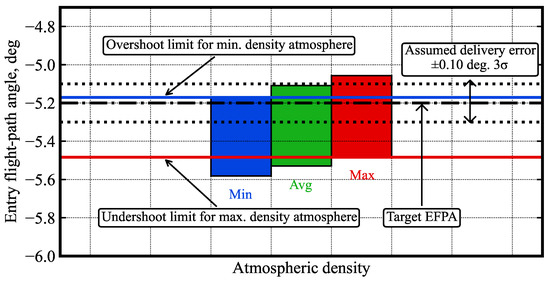
Figure 19.
Effect of density variation on Venus aerocapture corridor. The black dash-dot line indicates the selected EFPA, and the black dotted lines indicate the assumed error.
5.6. Guidance Scheme
Figure 20 shows the evolution of altitude rate and altitude for a guided Venus drag-modulation aerocapture trajectory entering at EFPA = −5.2 deg. The altitude rate threshold is adjusted to −150 m/s to allow the vehicle to descend sufficiently into the atmosphere and obtain a reasonable density model before beginning apoapsis prediction. More negative values of the altitude rate threshold caused the density estimation to cut off too early, resulting in an inaccurate density model, which caused several trajectories to overshoot the target apoapsis. On-board density estimation begins at entry and continues until an altitude rate of −150 m/s is exceeded at approximately 80 s after entry. At 107 s after entry, the drag-skirt jettison is commanded to achieve the desired apoapsis.
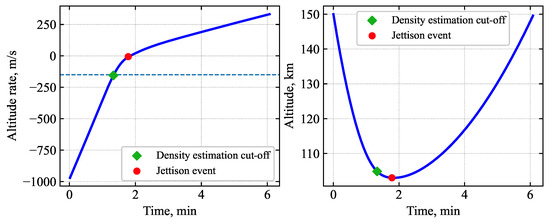
Figure 20.
Evolution of altitude rate and altitude during Venus aerocapture. The red circle indicates the time at which drag skirt jettison is commanded.
5.7. Performance Analysis
Nominal values of the parameters and associated uncertainties used for the Monte Carlo simulations are listed in Table 10. The atmospheric mean density uncertainty (±3) and high-frequency perturbations are used from Venus-GRAM [45]. All 1000 entry trajectories propagated achieved successful orbit insertion. Figure 21 shows the distribution of the achieved apoapsis and periapsis altitude at atmospheric exit. Figure 22 shows the distribution of the peak g-load, peak stagnation-point heat rate, and the total heat load.

Table 10.
Venus aerocapture Monte Carlo uncertainties.
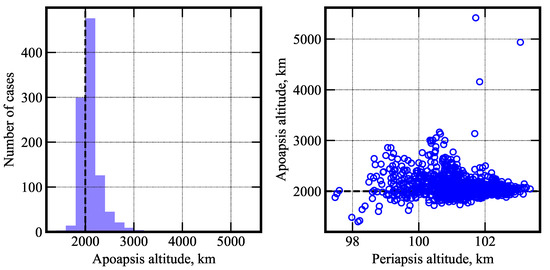
Figure 21.
Histogram of the apoapsis altitude (left) and the apoapsis altitude and periapsis altitude (right) for Venus aerocapture. The black dashed line indicates the target apoapsis altitude of 2000 km.
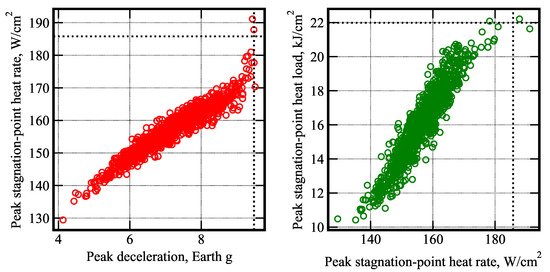
Figure 22.
Scatter plots of the peak deceleration, peak stagnation-point heat rate and the total heat load for Venus aerocapture. The black dotted line indicates the 99.87 percentile values.
Table 11 shows the distribution of the achieved apoapsis altitude. In total, 91.4% of the cases achieved apoapsis within ±400 km of the target, and 98.4% achieved apoapsis within ±800 km of the target. Any apoapsis error after aerocapture would need to be corrected by propulsive burns at the periapsis to raise or lower the apoapsis. Table 12 shows the statistics from the Monte Carlo simulations. The 95 percentile peak deceleration and peak heat rate are 8.8g and 168 W/cm2. The 95 percentile periapsis increase in is 27 m/s.

Table 11.
Statistics for Venus aerocapture orbit apoapsis altitude.

Table 12.
Statistics from Venus aerocapture Monte Carlo simulations.
5.8. Orbiter Deflection Maneuver
The small satellite approach is defined by km and = . The orbiter’s trajectory for insertion into a 400 × 150,000 km polar orbit is defined by km, = . The aim points on the Venus B-plane are shown in Figure 23. After SmallSat release, the host performs a deflection maneuver to target its aim point.
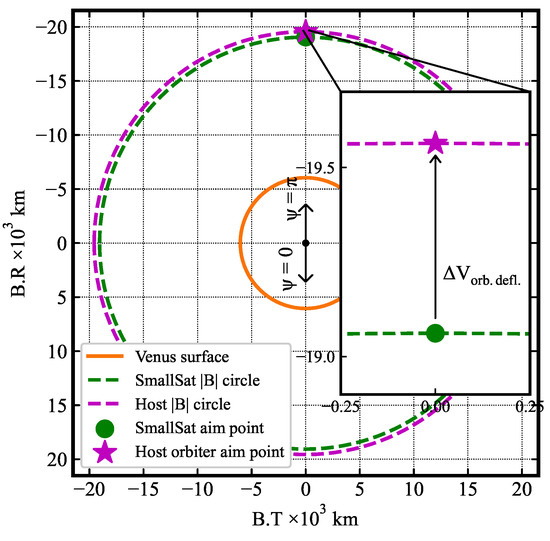
Figure 23.
Small satellite and host orbiter aim points on the Venus B-plane. The inset shows a magnified view of the two aim points, both of which have = .
Based on navigation studies for aerocapture at Venus [42], the SmallSat is released 2 days prior to entry to keep the 3 EFPA error below ±0.1 deg. The deflection maneuver is 1.28 m/s. Note that the magnitude of the deflection maneuver is much less than that for Mars (see Section 5.8) because the host is also targeting a polar orbit. Figure 24 shows the approach directory of the small satellite until the entry interface and the approach trajectory of the host spacecraft until periapsis, where it performs propulsive orbit insertion.
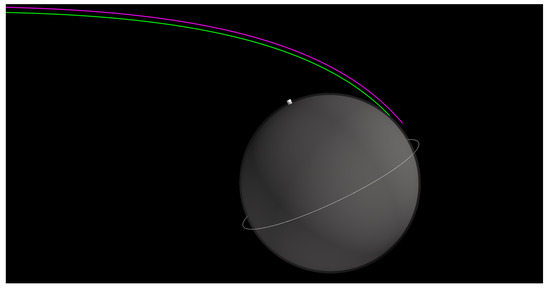
Figure 24.
Hyperbolic approach trajectory of the Venus SmallSat (green) until entry interface and the approach trajectory of the host orbiter spacecraft (magenta) until periapsis.
The SmallSat performs aerocapture and executes a 28 m/s periapsis raise maneuver to complete its orbit insertion to a 200 × 2000 km polar orbit. The host orbiter performs a 784 m/s burn to capture into its 250 × 150,000 km polar orbit. These results illustrate how a very small deflection maneuver can be used to send a small satellite into a low-circular orbit as a secondary payload on a Venus orbiter mission. Such an orbit configuration, for example, offers the possibility of collecting simultaneous multi-point measurements of the magnetosphere. Figure 25 shows the two spacecraft in their captured orbits.
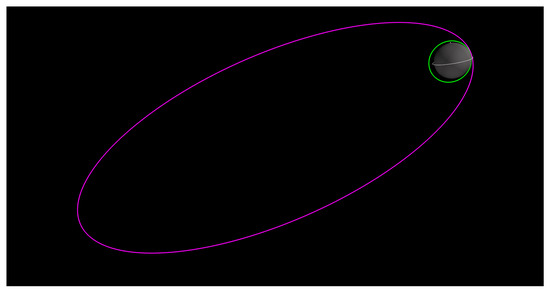
Figure 25.
Venus small satellite in 200 × 2000 km polar orbit post aerocapture (green), and the host orbiter in a 400 × 150,000 km polar orbit after propulsive orbit insertion (magenta).
6. Mars Small Satellite Constellation
In this section, the results for the single small satellite at Mars are extended to multiple small satellites delivered to various inclination orbits. The high-level mission objective is to deliver a constellation of five small satellites to Mars orbit as a secondary payload. The host orbiter releases each small satellite on its approach trajectory and then performs a targeting maneuver to target the next one. Once the last small satellite is released, the host performs a deflection maneuver to target its approach trajectory for propulsive insertion.
6.1. Mission Requirements
The inclinations of the various satellites are arbitrarily selected for this study to illustrate targeting multiple orbits for a constellation but can easily be adapted to other orbits.
- The mission should insert a set of five 25 kg SmallSats to 200 × 2000 km orbits with inclinations of 1.65 deg., 22.5 deg., 45 deg., 67.5 deg., 90 deg. as secondary payloads.
- The total available for the deflection maneuvers for small satellite targeting, and the final orbiter deflection maneuver is 25 m/s.
6.2. B-Plane Targeting and Approach Trajectories
The approach trajectories for the five small satellites are defined by = (3389.5 + 52) km and = [3/2, 11/8, 5/4, 9/8, ], whose aim points on the Mars B-plane are shown in Figure 26. These approach trajectories target orbits with inclinations of 1.65 deg., 22.5 deg., 45 deg., 67.5 deg., and 90 deg. for the small satellites. Since all the small satellite trajectories have the same , the aim points have the same |B| and lie on the SmallSat circle. Hence, all the five SmallSat approach trajectories result in the same EFPA = −9.25 deg. (effect of planet rotation causes the atm. relative EFPA to be slightly different and must be accounted for). Hence, the aerocapture trajectory results for the single satellite from Section 4 are valid for each of the five SmallSats. The approach trajectory of the host orbiter is the same as that defined in Section 4.8, km, and = .
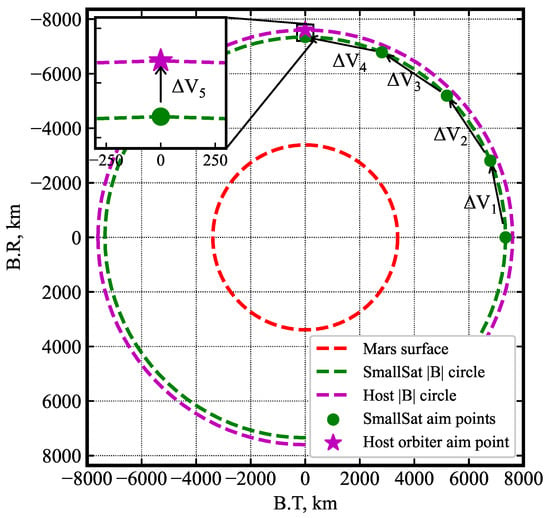
Figure 26.
SmallSat and host orbiter aim points on the Mars B-plane. After releasing each SmallSat, the host orbiter performs a small maneuver to target the aim point for the next one.
6.3. SmallSat Targeting and Orbiter Deflection Maneuvers
Table 13 shows the maneuver plan to accomplish the B-plane targeting shown in Figure 26. Here, indicates the targeting maneuver performed immediately after the first small satellite is released to target the aim point for the second satellite. To avoid performing maneuvers too close to the planet, which can drive up , it is assumed that the satellites can be released as early as 7 days prior to entry and can execute very small TCMs to correct navigation errors after release. is performed 7 days prior to entry (E-7 days). is the orbiter deflection maneuver performed 3 days prior to entry. The maneuver schedule is chosen so as to keep the total targeting and deflection maneuver within the 25 m/s. Figure 27 shows the approach directory of the five small satellites until the entry interface and the approach trajectory of the host orbiter spacecraft arriving over the north pole.

Table 13.
Mars small satellite constellation targeting and orbiter deflection maneuvers.
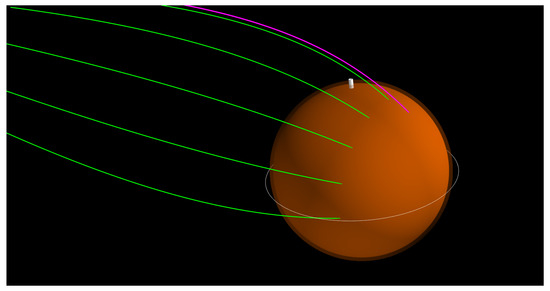
Figure 27.
Approach trajectory of the five Mars small satellites with various inclinations (green) until atmospheric entry and the host orbiter (magenta) until periapsis.
Figure 28 shows the orbits of the five small satellites and the host orbiter. These results demonstrate how it is possible to target different aim points on the SmallSat B-plane circle with different values of with very small targeting maneuvers (<8 m/s), corresponding to different inclinations. Since the mission designer is free to choose any angular position on the B-plane circle for targeting, it becomes possible to insert these satellites into any inclination ranging from arrival declination to polar, and even retrograde orbits. Furthermore, the orbit size (apoapsis altitude) for each aerocapture vehicle can be chosen independently to range from low-circular to moderately elliptical orbits (the aerocapture corridor becomes too small for highly elliptic orbits). Thus, the combination of B-plane targeting and independent apoapsis targeting allows for a wide range of inclination and orbit sizes for small satellite constellations depending on the mission requirements. For example, it is possible to target two satellites toward low circular near-polar orbits and two satellites toward elliptical near-equatorial orbits to sample the Martian magnetosphere.
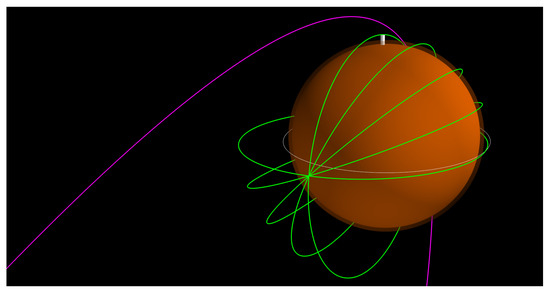
Figure 28.
Mars small satellite constellation in 200 × 2000 km orbits with various inclinations from equatorial to polar (green), and the host orbiter in 250 × 70,000 km polar orbit.
7. Venus Small Satellite Constellation
In this section, the results for the single small satellite at Venus are extended to include multiple small satellites to the Venus orbit as a secondary payload.
7.1. Mission Requirements
- The mission should insert a set of five 25 kg SmallSats to 200 × 2000 km near-polar orbits with inclinations of 80 deg., 85 deg., 90 deg., 95 deg., and 100 deg.
- The total available for targeting and orbiter deflection maneuver is 45 m/s.
7.2. B-Plane Targeting and Approach Trajectories
The trajectories of the SmallSats are defined by = (6051.8 + 103.8) km and = [1.06, 1.03, , 0.97, 0.94], whose aim-points on the Venus B-plane are shown in Figure 29.
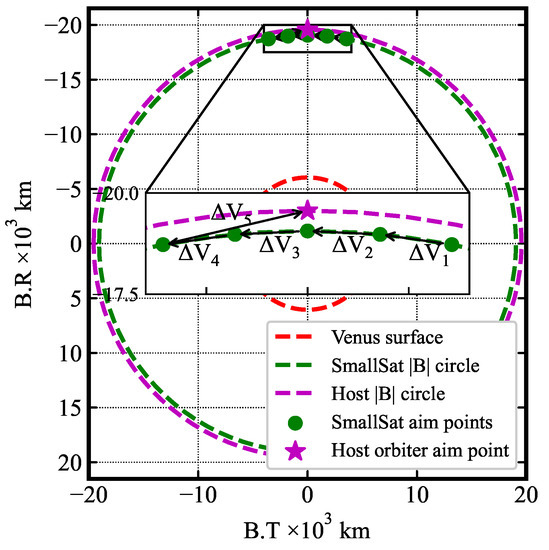
Figure 29.
SmallSat and host orbiter aim points on the Venus B-plane. After releasing each SmallSat, the host orbiter performs a maneuver to target the aim point for the next one.
Since these aim points lie on the circle, all trajectories result in approximately the same EFPA = −5.2, and the aerocapture trajectory results for the single satellite from Section 5 also hold here. The approach trajectory of the host is km, and = .
7.3. SmallSat Targeting and Orbiter Deflection Maneuvers
Table 14 shows the maneuver plan to accomplish the B-plane targeting shown in Figure 29. is performed four days prior to entry (E-4 days), followed by subsequent maneuvers every 12 h. is the orbiter deflection maneuver performed after the final small satellite is released. The maneuver schedule is chosen so as to keep the total targeting and deflection maneuver within the 45 m/s set in the mission requirements.

Table 14.
Venus small satellite constellation targeting and orbiter deflection maneuvers.
Figure 30 shows the approach directory of the five small satellites until entry and the approach trajectory of the host orbiter.
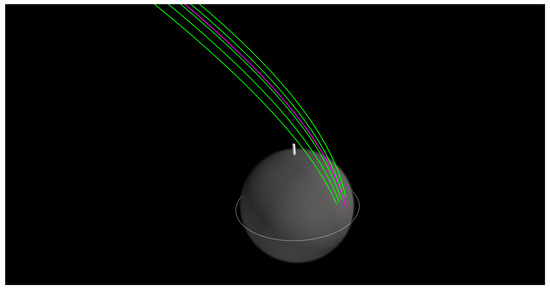
Figure 30.
Approach trajectory of the five Venus small satellites with various inclinations (green) until atmospheric entry and the host orbiter (magenta) until periapsis.
Though the analysis presented in Section 6 and Section 7 is for the small satellites as secondary payloads on a host orbiter, it is also applicable to a standalone mission using a dedicated cruise stage delivering the small satellites instead of an orbiter. The cruise stage can be a Rocket Lab Photon upper stage, which will be launched to LEO or GTO as a secondary payload, with just enough propellant to perform a propulsive burn to escape the Earth’s vicinity and perform the targeting and deflection maneuvers on arrival. This opens up the possibility of dedicated standalone small satellite constellation missions to Mars and Venus. On approach, the spacecraft will perform small maneuvers to release the small satellites on their approach trajectories for aerocapture, after which the cruise stage can be targeted to fly by the planet, or enter the atmosphere and burn up. Figure 31 shows the orbits of the constellation of five near-polar small satellites and the host orbiter.
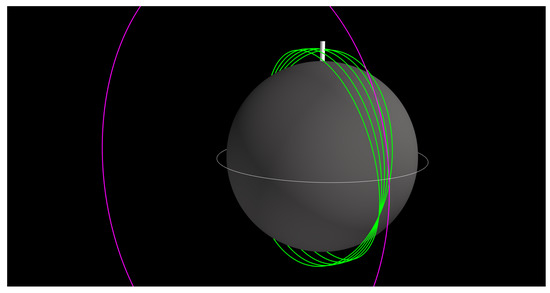
Figure 31.
Venus small satellite constellation in 200 × 2000 km near-polar inclination orbits (green), and the host orbiter in a 250 × 150,000 km polar orbit (magenta).
The orbits in Figure 31 intersect because all orbits have the same apogee and perigee, and only the inclination is different. In practice, each satellite can be allowed to have a slightly different apogee and perigee to avoid the risk of collisions between satellites.
8. Mission Cost
Edwards et al. performed a preliminary study assessing the cost drivers for small missions and concluded that is the largest driver of mission cost [7]. Figure 32 shows the estimated mission cost as a function of for a chemical propulsion system and payload mass. The 25 kg spacecraft design considered in this study could potentially carry about 5 kg of scientific payload (based on the study by Austin et al. [42]).
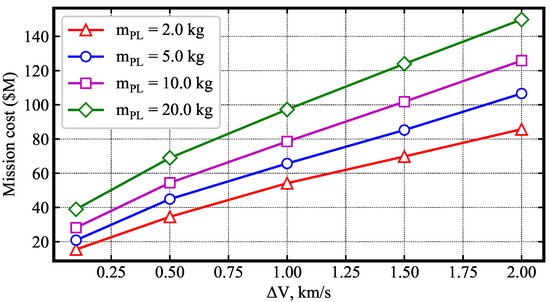
Figure 32.
Mission cost as a function of for a chemical propulsion system. refers to the science payload (instrument mass). Derived using data from Edwards et al. [7].
Compared to the 1770 m/s required for propulsive insertion to a 200 × 2000 km orbit at Mars, aerocapture accomplishes orbit insertion with less than 100 m/s (combining PRM and ACM ; cf. Section 4.7). This translates to a cost reduction from over USD 100 million to USD 20 million, nearly a factor of five. At Venus, compared to the 3130 m/s required for propulsive insertion, aerocapture requires less than 60 m/s (cf. Section 5.7), thus potentially providing even more cost savings. A caveat of this estimate is that the cost of the aerocapture system is not considered, as no such estimate is available in the literature. The realization of a drag-modulation aerocapture flight system will involve hardware and software development and testing, validation, and integration costs, which cannot be estimated at this stage. Once a viable design is realized and flight tested, the recurring cost of realizing additional flight units and integrating them with small satellites is expected to be much lower than the initial development costs. Hence, the significant saving offered by aerocapture will potentially lead to cost savings for small missions, and additional studies are recommended to quantify the cost for small satellite aerocapture mission architectures.
Another method of comparing aerocapture to propulsive insertion is to compare the orbit insertion fuel mass to the aerocapture system mass, as the required fuel and aerocapture system mass can be an indicator of the cost. For propulsive insertion, using the rocket equation, given a spacecraft dry mass , the required fuel mass is
For insertion to a 200 × 2000 km orbit at Mars, the required is 1770 m/s. Assuming = 320 s for a bi-propellant system, an impulsive burn and no finite burn losses, the required to insert a 25 kg dry mass spacecraft into orbit is 19 kg. For a 200 × 300 km orbit, the is 2100 m/s, and the required fuel mass is 23 kg. The aerocapture system mass is approximately 25 kg, irrespective of the orbit size. Hence, the aerocapture does not lead to mass savings over propulsive capture for orbit insertion at Mars for typical Earth–Mars trajectories. Once a drag modulation flight system has been realized through technology development, integrating a 25 kg compactly stowable aerocapture system may be more cost-effective than a 25 kg propulsion system for a small spacecraft with volume constraints.
For insertion to a 200 × 2000 km orbit at Venus, the required is 3130 m/s. The required to insert a 25 kg spacecraft into orbit is 43 kg, which is 72% higher than the aerocapture system, which is 25 kg. For a 200 × 300 km orbit, the is 3500 m/s and the required fuel mass is 51 kg, which is over 100% more than the aerocapture system mass. Hence, the aerocapture offers significant mass savings over the propulsive capture at Venus, particularly to low-circular orbits, which will potentially also lead to cost savings.
9. Additional Mission Concepts
The results presented so far to insert multiple small satellites into orbit as secondary payloads can be extended to several related mission concepts of interest. A brief discussion of a set of mission concepts, which are also enabled by the ADEPT entry system and small B-plane targeting maneuvers analyzed in this study, is presented.
9.1. Standalone SmallSat Orbiter Missions Using Small Launch Vehicle
The study results have so far assumed the small satellite(s) are secondary payloads on a host mission. However, large missions still do not launch frequently and may not be willing to accommodate the demands of small spacecraft. Low-cost launch vehicles, such as the Electron with the Photon upper stage, are capable of launching about 30 kg on Earth escape trajectories [46]. With aerocapture, a 15 kg spacecraft can be inserted into low-circular orbit with such a launch vehicle. The 320 kg wet mass Photon can also be launched as an ESPA secondary payload to GTO [47]. Following orbit raising and an Earth escape maneuver, it can serve as a cruise stage, which can carry four 50 kg ADEPT aerocapture vehicles, each of which can deliver a 25 kg spacecraft to a different orbit at Mars or Venus.
9.2. SmallSat Relay Orbiter for Mars Lander and Venus Balloon Missions
A small satellite can be inserted into orbit as part of a large Mars lander mission following the same technique described in Section 4. After releasing the small satellite on its aerocapture trajectory, the lander spacecraft would perform a deflection maneuver to target its aim point for atmospheric entry rather than propulsive orbit insertion. The small satellite can serve as a dedicated telecommunications relay for the lander mission, freeing up bandwidth on other large orbiters. Small satellites can also be used as relay orbiters for Venus balloon or lander missions. Unlike Mars, where there exists a network of orbiters that could be used as data relays, Venus missions are constrained by low direct-to-Earth data rates (<100 bps) through its thick absorbing atmosphere [48]. A small relay orbiter with a deployable high-gain antenna could increase the data rate to several kbps.
9.3. Mars Global Small Lander Network
The method described in Section 6.2 for delivering multiple SmallSats to various inclination orbits can also be extended to multiple small Mars landers as secondary payloads on a large mission [49]. Instead of performing aerocapture, the ADEPT spacecraft will perform direct entry and deliver landers across the surface. The lander network can spread across various latitudes to provide global coverage (ranging from near-polar to equatorial landing sites) and could be used for coordinated seismic, meteorological, and other investigations.
9.4. Mars Global Imaging Constellation
Small satellites such as Planet’s Dove 3U CubeSats, which weigh less than 5 kg (and come at a fraction of the cost of large imaging satellites), have enabled a revolution in Earth observation [50]. A future Discovery-class mission may extend such a capability to Mars, enabling scientists to image the entire surface repeatedly. Assuming each satellite is about 25 kg and the ADEPT entry system is 50 kg, a single InSight-like cruise stage can carry about 10 of these small satellites in a single launch. On approaching Mars, the cruise stage will perform the B-plane targeting maneuvers before releasing each small satellite, which will then aerocapture into low-circular orbits and establish a global imaging constellation.
9.5. Venus Radar Mapping Constellation
As with imaging satellites, small, low-cost Synthetic Aperture Radar (SAR) satellites such as that operated by ICEYE (≃100 kg) offer unprecedented radar imagery of the Earth’s surface [51]. Such a radar constellation can greatly enhance our understanding of the Venusian surface and interior. While there are challenges, e.g., the download of large volume SAR data from Venus, on-board data processing techniques, such as those used by VERITAS [52] and deployable high-gain antennae, may be able to solve these problems [53]. An ADEPT entry system weighing approximately 300 kg can deliver a 150 kg small radar satellite to Venus orbit. The proposed VERITAS mission has a launch mass of 1500 kg. Such a future Discovery-class mission can deliver about five of these small satellites to low-circular orbits in a single launch and establish an SAR constellation at Venus.
10. Technology Development and Mission Infusion
Several key technologies enabling ADEPT drag-modulation aerocapture have already been tested in flight and ground facilities. The SR-1 sounding rocket flight test demonstrated successful exo-atmospheric deployment of ADEPT from its stowed configuration and aerodynamic stability without active control through Mach 0.8 [34]. The 3D-woven carbon fabric, which serves as the ADEPT thermal protection system, and the structural surface have been tested in arc-jet facilities at over 200 W/cm2 and 8 kPa [54]. The dynamics of the drag skirt separation event have been studied using both CFD simulations and experimental tests [55]. The experimental ballistic range tests demonstrated clean separation of the drag skirt from the center body for a scaled solid flight model in hypersonic free flight [56]. A future sounding rocket experiment similar to the SR-1 test can potentially demonstrate the ADEPT drag skirt separation in flight at supersonic speed. An end-to-end low-cost technology demonstration of the ADEPT drag-modulation aerocapture system can be performed at Earth using a Geostationary Transfer Orbit (GTO) rideshare mission [39]. The next step would be to add a single satellite as a secondary payload to a Mars/Venus mission and demonstrate aerocapture at a planetary target. The successful demonstration of SmallSat aerocapture at Mars/Venus will establish it as a proven technology and eventually pave the way for large Flagship-class aerocapture missions to Uranus and Neptune [57,58,59,60].
11. Conclusions
Small, low-cost satellites have the potential to perform targeted high-value science investigations, both as secondary payloads on traditional large planetary missions and individually using dedicated low-cost small launch vehicles. One of the major technical hurdles for interplanetary small satellites is that on arrival, they require large , several km/s particularly, to enter low-circular orbits. The study presented a detailed mission analysis for an ADEPT drag modulation concept to insert a single small satellite into a low-circular orbit around Mars and Venus as a secondary payload on a larger orbiter mission. Compared to the 1770 and 3130 m/s required for propulsive orbit insertion into a 200 × 2000 km orbit at Mars and Venus, aerocapture enables small satellites to perform orbit insertion with less than 35 m/s of propulsive . Additional propulsive burns may be required to correct apoapsis errors, which will require propellant and reduce mission life, but can be minimized using more advanced guidance schemes that provide better apoapsis targeting than the simple guidance scheme used in the study. The study then showed how drag-modulation aerocapture, when combined with very small B-plane targeting maneuvers, allows the delivery of multiple small satellites to various inclination orbits from a single host spacecraft or a dedicated cruise stage to form a constellation. Preliminary cost estimates indicate that by reducing the required orbit insertion to under 50 m/s, aerocapture can potentially reduce the total mission cost of a 25 kg small satellite going to a low-circular Mars orbit from over USD 100 million to USD 20 million, nearly a factor of five. The substantial reduction in required propulsive to enter low-circular orbit and the potential reduction in mission cost offered by aerocapture compared to propulsive insertion will enable a new paradigm of small satellite constellation concepts at Mars and Venus.
Author Contributions
Conceptualization, A.P.G.; Methodology, A.P.G., J.M.L. and S.J.S.; Software, A.P.G.; Writing—original draft, A.P.G.; Writing—review & editing, J.M.L. and S.J.S.; Visualization, A.P.G. All authors have read and agreed to the published version of the manuscript.
Funding
This research received no external funding.
Data Availability Statement
The results in this study can be reproduced using Jupyter Notebooks available at https://amat.readthedocs.io/en/master/mdpi-aerospace.html#adept-smallsat-aerocapture (accessed on 7 March 2023). An archived PDF version of the Jupyter Notebooks is available at https://doi.org/10.13140/RG.2.2.29043.81441 (accessed on 7 March 2023). The study results were made with https://github.com/athulpg007/AMAT/tree/v2.2.22 (accessed on 7 March 2023). A copy of the AMAT v2.2.22 source code is available at the Zenodo archive https://doi.org/10.5281/zenodo.7542714 (accessed on 7 March 2023).
Conflicts of Interest
The authors declare no conflict of interest.
References
- Freeman, A. Exploring our solar system with CubeSats and SmallSats: The dawn of a new era. CEAS Space J. 2020, 12, 491–502. [Google Scholar] [CrossRef]
- Frazier, W.; Bearden, D.; Mitchell, K.L.; Lam, T.; Prockter, L.; Dissly, R. Trident: The Path to Triton on a Discovery Budget. In Proceedings of the 2020 IEEE Aerospace Conference, Big Sky, MT, USA, 7–14 March 2020; pp. 1–12. [Google Scholar] [CrossRef]
- Jarmak, S.; Leonard, E.; Akins, A.; Dahl, E.; Cremons, D.; Cofield, S.; Curtis, A.; Dong, C.; Dunham, E.T.; Journaux, B.; et al. QUEST: A New Frontiers Uranus Orbiter Mission Concept Study. Acta Astronaut. 2020, 170, 6–26. [Google Scholar] [CrossRef]
- Rymer, A.M.; Runyon, K.D.; Clyde, B.; Núñez, J.I.; Nikoukar, R.; Soderlund, K.M.; Sayanagi, K.; Hofstadter, M.; Quick, L.C.; Stern, S.A.; et al. Neptune Odyssey: A Flagship Concept for the Exploration of the Neptune–Triton System. Planet. Sci. J. 2021, 2, 184. [Google Scholar] [CrossRef]
- Mercer, C.R. Small Satellite Missions for Planetary Science. In Proceedings of the 33rd Annual Small Satellite Conference, Logan, UT, USA, 3–8 August 2019. [Google Scholar]
- Tan, F.; Khalil, N. State of NASA Science with SmallSats. In Proceedings of the 35th Annual Small Satellite Conference, Logan, UT, USA, 7–12 August 2021. [Google Scholar]
- Edwards, C.D.; Fleischer, S.R.; Austin, A.; Barba, N.J.; Bjornstad, P.; Woolley, R.C.; Hihn, J.M.; Kolanjian, A.; Saing, M.; Lock, R.; et al. Assessing Cost Drivers for Mars Small Spacecraft Missions. In Proceedings of the 2022 IEEE Aerospace Conference, Big Sky, MT, USA, 5–12 March 2022; pp. 1–12. [Google Scholar] [CrossRef]
- Price, M.; Wells, N.; Ball, A.; Zarnecki, J.; Taylor, F. Small Satellite Mars Missions using Electric Propulsion. In Proceedings of the 18th Annual Small Satellite Conference, Logan, UT, USA, 4–8 August 2004. [Google Scholar]
- Austin, A.; Afonso, G. Enabling and Enhancing Science Exploration Across the Solar System: Aerocapture Technology for SmallSat to Flagship Missions. Bull. Am. Astron. Soc. 2021, 53, 57. [Google Scholar] [CrossRef]
- Austin, A.; Lobbia, M.; Strauss, B.; Ravich, J.; Luthman, L.; Venkatapathy, E.; Wercinski, P. Drag Modulation Aerocapture Technology to Enable SmallSat Mars Orbiters. In Proceedings of the Low-Cost Science Mission Concepts for Mars Exploration, Pasadena, CA, USA, 29–31 March 2022; p. 5021. [Google Scholar]
- Wercinski, P.; Venkatapathy, E. Enabling New and Innovative Low Cost Mars Science Missions with the Adaptable, Deployable, Entry and Placement Technology (ADEPT). In Proceedings of the Low-Cost Science Mission Concepts for Mars Exploration, Pasadena, CA, USA, 29–31 March 2022; p. 5022. [Google Scholar]
- Putnam, Z.; Fawley, D. Drag Modulation Trajectory Control for Delivery of Low-Cost Mars Orbiters and Landers. In Proceedings of the Low-Cost Science Mission Concepts for Mars Exploration, Pasadena, CA, USA, 29–31 March 2022; p. 5060. [Google Scholar]
- Putnam, Z.R.; Braun, R.D. Drag-Modulation Flight-Control System Options for Planetary Aerocapture. J. Spacecr. Rocket. 2013, 51, 139–150. [Google Scholar] [CrossRef]
- Peng, Y.m.; Xu, B.; Fang, B.D.; Lei, H.L. Analytical Predictor-Corrector Guidance Algorithm Based on Drag Modulation Flight Control System for Mars Aerocapture. Int. J. Aerosp. Eng. 2018, 2018, 5907981. [Google Scholar] [CrossRef]
- Roelke, E.; Braun, R. Discrete-Event Drag-Modulated Guidance Performance for Venus Aerocapture. J. Spacecr. Rocket. 2021, 58, 190–199. [Google Scholar] [CrossRef]
- Deshmukh, R.; Cabrera, J.V.; Spencer, D. SmallSat Aerocapture using a Generalized Numerical Predictor Corrector Guidance Architecture. In Proceedings of the AIAA Scitech 2021 Forum, Virtual Event, 11–15 January 2021; p. 1066. [Google Scholar] [CrossRef]
- Roelke, E.; McMahon, J.W.; Braun, R.D.; Hattis, P.D. Multi-Event Jettison Guidance Approaches for Drag-Modulation Aerocapture. J. Spacecr. Rocket. 2021, 59, 190–202. [Google Scholar] [CrossRef]
- Cihan, I.H.; Kluever, C.A. Analytical Guidance for Mars Aerocapture via Drag Modulation. J. Astronaut. Sci. 2022, 69, 857–878. [Google Scholar] [CrossRef]
- Sweeney, D.; Ao, C.; Vergados, P.; Rennó, N.; Kass, D.; Martínez, G. Enabling Mars Radio Occultation by Smallsats. In Proceedings of the 2021 IEEE Aerospace Conference, Big Sky, MT, USA, 6–13 March 2021; pp. 1–12. [Google Scholar] [CrossRef]
- Lillis, R.J.; Mitchell, D.; Montabone, L.; Heavens, N.; Harrison, T.; Stuurman, C.; Guzewich, S.; England, S.; Withers, P.; Chaffin, M.; et al. MOSAIC: A Satellite Constellation to Enable Groundbreaking Mars Climate System Science and Prepare for Human Exploration. Planet. Sci. J. 2021, 2, 211. [Google Scholar] [CrossRef]
- Molli, S.; Durante, D.; Boscagli, G.; Cascioli, G.; Racioppa, P.; Alessi, E.; Simonetti, S.; Vigna, L.; Iess, L. Design and performance of a Martian autonomous navigation system based on a smallsat constellation. Acta Astronaut. 2023, 203, 112–124. [Google Scholar] [CrossRef]
- French, R.; Mandy, C.; Hunter, R.; Mosleh, E.; Sinclair, D.; Beck, P.; Seager, S.; Petkowski, J.J.; Carr, C.E.; Grinspoon, D.H.; et al. Rocket Lab Mission to Venus. Aerospace 2022, 9, 445. [Google Scholar] [CrossRef]
- Limaye, S.; Abedin, N.M.; Ao, C.O.; Bocanegra, T.; Bullock, M.A.; Carrico, J.P.; Valeria, C.; Shannon, M.C.; William, E.; Jack, S.E.; et al. Venus Observing System. Bull. Am. Astron. Soc. 2021, 53, 370. [Google Scholar] [CrossRef]
- Barba, N.; Austin, A.; Banfield, D.; Chmielewski, A.B.; Clark, P.; Coogan, W.; Conversano, R.; Cormarkovic, V.; Diniega, S.; Edwards, C.; et al. High Science Value Return of Small Spacecraft at Mars. Bull. Am. Astron. Soc. 2021, 53, 324. [Google Scholar] [CrossRef]
- Kleinboehl, A.; Kass, D.; Piqueux, S.; Greybush, S.; Kenyon, M. Mars Climate CubeSat Constellation (MC3)—A Low-Cost Orbital Constellation for Atmospheric Profiling, Polar Science and Surface Thermophysics. In Proceedings of the Low-Cost Science Mission Concepts for Mars Exploration, Pasadena, CA, USA, 29–31 March 2022; p. 5037. [Google Scholar]
- Vinh, N.X.; Busemann, A.; Culp, R.D. Hypersonic and Planetary Entry Flight Mechanics; University of Michigan Press: Ann Arbor, MI, USA, 1980; Chapter 2; p. 22. [Google Scholar]
- Girija, A.P.; Saikia, S.J.; Longuski, J.M.; Cutts, J.A. AMAT: A Python package for rapid conceptual design of aerocapture and atmospheric Entry, Descent, and Landing (EDL) missions in a Jupyter environment. J. Open Source Software 2021, 6, 3710. [Google Scholar] [CrossRef]
- Sutton, K.; Graves, R.A., Jr. A General Stagnation-Point Convective Heating Equation for Arbitrary Gas Mixtures; Technical Report NASA-TR-R-376; NASA: Washington, DC, USA, 1971.
- Girija, A.P.; Lu, Y.; Saikia, S.J. Feasibility and Mass-Benefit Analysis of Aerocapture for Missions to Venus. J. Spacecr. Rocket. 2020, 57, 58–73. [Google Scholar] [CrossRef]
- Craig, S.; Lyne, J.E. Parametric Study of Aerocapture for Missions to Venus. J. Spacecr. Rocket. 2005, 42, 1035–1038. [Google Scholar] [CrossRef]
- Page, W.; Woodward, H. Radiative and Convective Heating during Venus Entry. AIAA J. 1972, 10, 1379–1381. [Google Scholar] [CrossRef]
- Hughes, K.M. Gravity-Assist Trajectories to Venus, Mars, and the Ice Giants: Mission Design with Human and Robotic Applications. Ph.D. Thesis, Purdue University, West Lafayette, IN, USA, 2016. [Google Scholar]
- Austin, A.; Nelessen, A.; Strauss, B.; Ravich, J.; Lobbia, M.; Venkatapathy, E.; Wercinski, P.; Yount, B.; Wilder, M.; Cassell, A.; et al. SmallSat Aerocapture Breaking the Rocket Equation to Enable a New Class of Planetary Missions. In Proceedings of the 70th International Astronautical Congress (IAC), Washington, DC, USA, 21–25 October 2019. [Google Scholar]
- Dutta, S.; Karlgaard, C.D.; Korzun, A.M.; Green, J.S.; Tynis, J.A.; Williams, J.D.; Yount, B.; Cassell, A.M.; Wercinski, P.F. Adaptable Deployable Entry and Placement Technology Sounding Rocket One Modeling and Reconstruction. J. Spacecr. Rocket. 2022, 59, 236–259. [Google Scholar] [CrossRef]
- Arnold, J.O.; Laub, B.; Chen, Y.K.; Prabhu, D.K.; Bittner, M.; Venkatapathy, E. Arcjet Testing of Woven Carbon Cloth for Use on Adaptive Deployable Entry Placement Technology; Technical Report ARC-E-DAA-TN6341; NASA Ames Research Center: Moffett Field, CA, USA, 2013.
- Girija, A.P. A Systems Framework and Analysis Tool for Rapid Conceptual Design of Aerocapture Missions. Ph.D. Thesis, Purdue University, West Lafayette, IN, USA, 2021. [Google Scholar] [CrossRef]
- Girija, A.P.; Saikia, S.J.; Longuski, J.M.; Lu, Y.; Cutts, J.A. Quantitative Assessment of Aerocapture and Applications to Future Solar System Exploration. J. Spacecr. Rocket. 2022, 59, 1074–1095. [Google Scholar] [CrossRef]
- Nelessen, A.; Sackier, C.; Clark, I.; Brugarolas, P.; Villar, G.; Chen, A.; Stehura, A.; Otero, R.; Stilley, E.; Way, D.; et al. Mars 2020 Entry, Descent, and Landing System Overview. In Proceedings of the 2019 IEEE Aerospace Conference, Big Sky, MT, USA, 2–9 March 2019; pp. 1–20. [Google Scholar] [CrossRef]
- Werner, M.S.; Braun, R.D. Mission Design and Performance Analysis of a Smallsat Aerocapture Flight Test. J. Spacecr. Rocket. 2019, 56, 1704–1713. [Google Scholar] [CrossRef]
- Roelke, E.; Hattis, P.D.; Braun, R. Improved Atmospheric Estimation for Aerocapture Guidance. In Proceedings of the 2019 AAS/AIAA Astrodynamics Specialist Conference, Portland, ME, USA, 11–15 August 2019. Number AAS 19-725. [Google Scholar]
- Roelke, E.; McMahon, J.W.; Braun, R.D.; Hattis, P.D. Atmospheric Density Estimation Techniques for Aerocapture. J. Spacecr. Rocket. 2023, 1–15. [Google Scholar] [CrossRef]
- Austin, A.; Nelessen, A.; Strauss, B.; Ravich, J.; Jesick, M.; Venkatapathy, E.; Beck, R.; Wercinski, P.; Aftosmis, M.; Wilder, M.; et al. SmallSat Aerocapture to Enable a New Paradigm of Planetary Missions. In Proceedings of the 2019 IEEE Aerospace Conference, Big Sky, MT, USA, 2–9 March 2019; pp. 1–20. [Google Scholar] [CrossRef]
- Justh, H.L.; Dwyer Cianciolo, A.M.; Hoffman, J.; Allen, G.A., Jr. Mars Global Reference Atmospheric Model (Mars-GRAM): User Guide; Technical Report NASA/TM-20210023957; Marshall Space Flight Center: Huntsville, AL, USA, 2021.
- Nakamura, M.; Imamura, T.; Ishii, N.; Abe, T.; Kawakatsu, Y.; Hirose, C.; Satoh, T.; Suzuki, M.; Ueno, M.; Yamazaki, A.; et al. AKATSUKI Returns to Venus. Earth Planets Space 2016, 68, 1–10. [Google Scholar] [CrossRef]
- Justh, H.L.; Dwyer Cianciolo, A.M.; Hoffman, J.; Allen, G.A., Jr. Venus Global Reference Atmospheric Model (Venus-GRAM): User Guide; Technical Report NASA/TM-20210022168; Marshall Space Flight Center: Huntsville, AL, USA, 2021.
- French, R.; Hunter, R.; Loucks, M.; Currie, J.; Sinclair, D.; Mosleh, E.; Beck, P. Photon-enabled Planetary Small Spacecraft Missions for Planetary Science. Bull. Am. Astron. Soc. 2021, 53, 366. [Google Scholar] [CrossRef]
- French, R.; Mosleh, E.; Mandy, C.; Hunter, R.; Currie, J.; Sinclair, D.; Beck, P. Bringing Deep Space Missions within Reach for Small Spacecraft. In Proceedings of the 35th Annual Small Satellite Conference, Logan, UT, USA, 7–12 August 2021. [Google Scholar]
- Agrawal, R.; Buchanan, W.P.; Arora, A.; Girija, A.P.; De Jong, M.; Seager, S.; Petkowski, J.J.; Saikia, S.J.; Carr, C.E.; Grinspoon, D.H.; et al. Mission Architecture to Characterize Habitability of Venus Cloud Layers via an Aerial platform. Aerospace 2022, 9, 359. [Google Scholar] [CrossRef]
- Albert, S.W.; Schaub, H. Co-Delivery of Multiple Small Probes to the Martian Surface. In Proceedings of the AIAA SCITECH 2022 Forum, San Diego, CA, USA, 3–7 January 2022; p. 1653. [Google Scholar] [CrossRef]
- Safyan, M. Planet’s Dove Satellite Constellation. In Handbook of Small Satellites: Technology, Design, Manufacture, Applications, Economics and Regulation; Springer International Publishing: Berlin/Heidelberg, Germany, 2020; pp. 1–17. [Google Scholar] [CrossRef]
- Ignatenko, V.; Laurila, P.; Radius, A.; Lamentowski, L.; Antropov, O.; Muff, D. ICEYE Microsatellite SAR Constellation Status Update: Evaluation of First Commercial Imaging Modes. In Proceedings of the IGARSS 2020-2020 IEEE International Geoscience and Remote Sensing Symposium, Waikoloa, HI, USA, 26 September–2 October 2020; pp. 3581–3584. [Google Scholar] [CrossRef]
- Smrekar, S.; Hensley, S.; Nybakken, R.; Wallace, M.S.; Perkovic-Martin, D.; You, T.H.; Nunes, D.; Brophy, J.; Ely, T.; Burt, E.; et al. VERITAS (Venus Emissivity, Radio Science, InSAR, Topography, and Spectroscopy): A Discovery Mission. In Proceedings of the 2022 IEEE Aerospace Conference, Big Sky, MT, USA, 2–9 March 2022; pp. 1–20. [Google Scholar] [CrossRef]
- Mistry, K.K.; Kushwaha, M.; Fellows, D.; Huang, T.; Reveles, J.; Hamer, S.; Greenway, P.; Polegre, A.M. A dual-band deployable Cassegrain reflector antenna for Space applications. In Proceedings of the 2021 15th European Conference on Antennas and Propagation (EuCAP), Dusseldorf, Germany, 22–26 March 2021; pp. 1–5. [Google Scholar] [CrossRef]
- Morgan, J.; Gokcen, T.; Wercinski, P. Arc-jet Testing of Continuously Woven Aeroshells–Spiderweave–for Adaptable Deployable Entry Placement Technology. In Proceedings of the AIAA AVIATION 2022 Forum, Chicago, IL, USA, 27 June–1 July 2022; p. 3503. [Google Scholar] [CrossRef]
- Rollock, A.E.; Braun, R.D. Analysis of Hypersonic Tip-Off Rates for Venus Aerocapture. In Proceedings of the AIAA Scitech 2020 Forum, Orlando, FL, USA, 6–10 January 2020; p. 1739. [Google Scholar] [CrossRef]
- Wilder, M.C.; Lobbia, M.A.; Nelessen, A.P.; Austin, A.; Ravich, J.A.; Bogdanoff, D.W.; Wercinski, P.F.; Venkatapathy, E. Experimental Investigation of Drag Modulation Aerocapture: Drag-Skirt Separation in Hypersonic Free Flight; Technical Report NASA/TM-20205002936; NASA Ames Research Center: Moffett Field, CA, USA, 2020.
- Girija, A.P.; Saikia, S.J.; Longuski, J.M.; Bhaskaran, S.; Smith, M.S.; Cutts, J.A. Feasibility and Performance Analysis of Neptune Aerocapture Using Heritage Blunt-Body Aeroshells. J. Spacecr. Rocket. 2020, 57, 1186–1203. [Google Scholar] [CrossRef]
- Dutta, S.; Perez-Ayucar, M.; Fedele, A.; Gardi, R.; Calabuig, G.D.; Schuster, S.; Lebreton, J.P.; Ali, H.K.; Sayanagi, K.; Sakraker Ozmen, I.; et al. Aerocapture as an Enhancing Option for Ice Giants Missions. Bull. Am. Astron. Soc. 2021, 53, 046. [Google Scholar] [CrossRef]
- Girija, A.P. A Flagship-class Uranus Orbiter and Probe mission concept using aerocapture. Acta Astronaut. 2023, 202, 104–118. [Google Scholar] [CrossRef]
- Cohen, I.; Beddingfield, C.; Chancia, R.; DiBraccio, G.; Hedman, M.; MacKenzie, S.; Mauk, B.; Sayanagi, K.; Soderlund, K.; Turtle, E.; et al. New Frontiers-class Uranus Orbiter: Exploring the feasibility of achieving multidisciplinary science with a mid-scale mission. Bull. Am. Astron. Soc. 2021, 53, 323. [Google Scholar] [CrossRef]
Disclaimer/Publisher’s Note: The statements, opinions and data contained in all publications are solely those of the individual author(s) and contributor(s) and not of MDPI and/or the editor(s). MDPI and/or the editor(s) disclaim responsibility for any injury to people or property resulting from any ideas, methods, instructions or products referred to in the content. |
© 2023 by the authors. Licensee MDPI, Basel, Switzerland. This article is an open access article distributed under the terms and conditions of the Creative Commons Attribution (CC BY) license (https://creativecommons.org/licenses/by/4.0/).