Abstract
Honeycomb cores are widely used in the aerospace and automotive fields as a part of protective structures. Unfortunately, standard prismatic honeycomb cores offer a limited amount of energy absorption under lateral loads and suffer from degradation of their impact-deadening properties when their dimensional scale is increased. In this work, a multiscale study on energy absorption under quasi-static load is carried out on 3D-printed honeycomb core samples constituted by a variable section and compared to the cases of standard hexagonal honeycomb samples having the same mass and external dimensions. When doubling the dimensional scale in the case of lateral loads, the novel core geometry showed a substantial absence of specific energy absorption degradation, whereas the hexagonal core suffered from a 12.2%-degradation. Furthermore, by increasing the dimensional scale, the novel core geometry shows a delay in the densification onset. The variable-core geometry showed an average increase, in terms of energy absorption under lateral loads, of 46.8% for the regular scale and 71.4% for the double scale. Under axial loads, a 12.4%-decrease in energy absorption was observed for the samples with novel geometry, which, nevertheless, showed a relatively constant profile of reaction force under compression: this property could potentially allow it to avoid pre-crushing.
1. Introduction
1.1. Lattice Structures
Lattice structures have been implemented in a variety of industrial applications for the benefits which they provide. These cellular components ideally possess a more topologically optimized morphology with respect to the intended application. The physical benefits which result from this kind of structure include reductions in weight and material cost. Additionally, these lattices provide acoustic insulation and vibrational damping, heat dissipation, and improvements in specific strength, specific stiffness, and specific energy absorption [1,2,3,4,5,6,7]. These lattices can be classified as either 2D or 3D structures. A popular example of the former are honeycomb lattices. The specific definition of honeycomb lattice can be vague and differ across studies. Many uses of the term assume the use of a hexagonal unit cell while others are more ambiguous and allow for more geometric variations. For the purposes of the present study, honeycomb lattices will include any lattice which presents distinct in-plane and out-of-plane failure modes, and is composed of solid wall segments, in contrast to strut-based lattices. This definition being employed allows for further geometric optimization to produce more advanced failure modes and improved energy absorption capabilities.
1.2. Honeycomb Lattices
Hexagonal honeycomb structures–with the popular example being beehives–have been widely used in a variety of industrial applications. The hexagonal unit cell allows for the surface area to be maximized, and conversely, minimizing the material required [8,9]. Honeycomb lattices have been very effective in energy absorption applications [10,11]. The impact to the lattice can be in-plane or out-plane, depending on the desired behavior. In-plane impacts produce a more constant plateau stress, but with reduced load bearing capability compared to out-of-plane impacts [12,13,14]. The core of the hexagonal honeycomb–like most honeycomb lattices–is composed of periodic prismatic unit cells with no variation throughout in the lattice’s thickness [15]. The constant 2D profile of the hexagonal honeycomb lattice has made it comparably easier to manufacture via traditional non-additive methods than many other lattices (e.g., strut-based lattices), contributing to the widespread use of this type of honeycomb. Prismatic geometries are relied on due to their ease of manufacturing and predictable failure modes, which have been heavily researched. The development and investigation of non-prismatic honeycombs, however, is a growing area of interest. The ability to explore these non-prismatic unit cell geometries allows for a greater degree of mechanical optimization in tailoring the desired failure mode and improving the energy absorption capabilities of the lattice [16]. Additionally, these non-prismatic lattices can be designed to reduce the considerable anisotropy of the traditional prismatic alternatives [17]. Many of these non-prismatic designs were not possible to manufacture prior to the emergence of additive manufacturing (AM) technologies, which has enabled and bolstered this topic of research.
1.3. Additive Manufacturing of Lattices
The manufacturing of these lattices can pose unique challenges, however, the emergence of AM technologies has enabled the fabrication of lattice structures which could not be viably be manufactured via traditional non-additive methods. The ability to produce cellular structures with high levels of geometric complexity allows for a high level of manufacturing precision. This control over the fabrication process enables the possibility of tailoring the lattice structure to yield the desired failure mode and provide either increased load bearing potential or increased energy absorption capabilities. In the approximately 40 years since the formal invention of 3D printing, significant advancements have been made in a range of AM methods, and in their utilization to produce highly optimized lattice structures [12,13,18,19]. The period with the most exponential growth with this field of additive technologies, however, only began following both the expiration of the original patent held by Stratasys on the fused deposition modeling (FDM) process, and the success of the RepRap project [14,20,21]. The result of these two factors was the introduction of this technology on a consumer level by reducing the prohibitive cost of commercially available 3D printers. In fact, 3D printers became more affordable after the expiry of the aforementioned patent in 2009 [20,22,23]. While there has been a significant body of research conducted up to this point, there remains no shortage of applications which can be further studied to produce highly engineered structures via advanced material selection, manufacturing and post processing methods, and the design and functional grading of the lattice.
1.4. Scale Effect of 3D-Printed Lattices
To be practically implemented in the desired application, it is important to consider the proportional scale effect of any 3D-printed lattice–FDM printing for the present study. This includes both the size of the lattice’s features (e.g., overall size, wall thickness, etc.) and the processing parameters (e.g., layer height, wall and infill line width, etc.). The structural integrity of any FDM-printed components is comprised of both interlayer and intralayer adhesion forces between extruded filament [24]. If a larger-scale lattice is printed while the processing parameters are maintained, both the wall thickness and the vertical height will include more individual adhesion interfaces. If the proportionality is maintained in all these factors, the thermal, rheological, and crystallization properties, together with any other relevant factors of the polymer, should be considered to eliminate any potential source of variation.
There have been previous studies which investigated this scaling effect on the mechanical properties of FDM-printed lattices [25,26,27,28]. These studies generally concluded that increasing the scale of these lattices improves the strength of the printed component. This is attributed to the reduced impact of individual defects or delaminations relative to the size of the beam or wall thickness. While the referenced studies provide useful insight into the scaling effect, no study could be found comparing different size scales of any FDM-printed honeycombs (i.e., wall-based lattices), as described in the cited articles. In the absence of any previous work for direct comparison, it is assumed that the honeycomb would show a similar trend. Additionally, it was concluded in Nazir et al. (2022) that surface-based lattices outperformed strut-based lattices, due to an increased surface-area-to-volume ratio and improved load transfer [29]. Consequently, it is likely such a study would show a similar outperformance of honeycomb lattices.
2. Materials and Methods
2.1. Cell Geometry Design
The innovative geometry, which had previously been tested for the case of one single cell only and with a different polymer [17], has shown promising results under both axial and lateral loads; in particular, the presence of internal diagonal walls allows the creation of additional load paths that result in a 15%-increase in energy absorption under lateral loads. It is worth noting that each cell with the novel geometry is actually constituted by four sub-cells, as depicted in Figure 1.
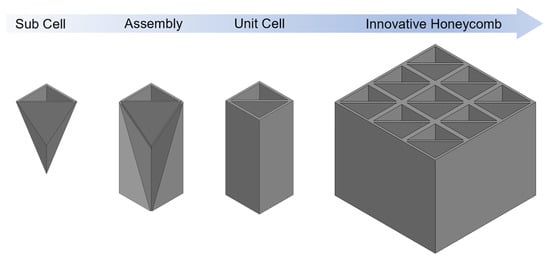
Figure 1.
The novel honeycomb assembly process begins with four sub-cells assembled to form a unit cell. Then, nine unit cells are assembled together to form a novel honeycomb sample.
In this work, the comparison between the innovative cell geometry and the standard hexagonal geometry is extended to the multicell case, and is carried out by using samples constituted by the innovative geometry and samples with the standard hexagonal honeycomb pattern: these samples, although internally different, have the same external size, height, and overall mass (Figure 2).
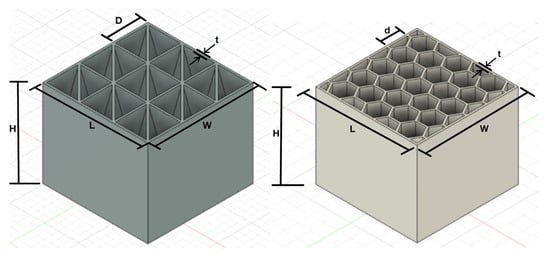
Figure 2.
Two samples, one made with cells with the novel cell geometry with variable section, and the other with a standard hexagonal geometry, having the same external dimensions (and mass). The dimensions, here indicated by letters, varied between the two different scales considered, but the number of cells was kept constant for each of the two honeycomb geometries.
The scale effect is studied as well, in the case of compression under lateral load. The criteria that dictated the number of cells for each geometry were the following ones:
- For the novel geometry, it was important to have at least one cell surrounded by the other cells on all sides, to appreciate the effect of the interaction between different cells. The cell number chosen was 9 (3 × 3), which corresponds to the minimum number of cells that satisfies the condition mentioned above.
- For the standard geometry, the total number of cells is equivalent to 30, i.e., the number of cells arranged within a square that most closely approximates the number of sub-cells of the novel geometry sample (i.e., 9 × 4 = 36).
- The numerical values of the dimensional parameters of the two different samples, in both regular scale and large (double) scale, are detailed below and in Table 1.
 Table 1. Dimensions and mass of the four combinations of sample geometry and dimensional scale. The parameters L, W, H, t, D, and d are indicated in Figure 2.
 - In the regular scale, the external longitudinal dimensions were 38.1 mm × 38.1 mm × 31.8 mm, with wall thicknesses of 0.75 mm for the novel honeycomb and 0.72 mm for the standard honeycomb. The cell walls were manufactured with two filament layers and 100% infill.
- The larger scale (“double scale”) had the external longitudinal dimensions scaled up by 200%, i.e., 76.2 mm × 76.2 mm × 63.5 mm with wall thickness of 1.50 mm for the novel honeycomb and 1.44 mm for the standard honeycomb. The cell walls were manufactured with four filament layers and 100%-infill.
Even though the innovative sandwich core is not an arrangement of prismatic cells, for convenience we refer to it as honeycomb.
2.2. Materials and Fabrication
The test specimens shown in Figure 3 were manufactured in Polylactic Acid (PLA) thermoplastic polymer manufactures by Overture (Overture 3D Technologies LLC, Missouri City, TX, USA) [30] using a INTAMSYS FUNMAT HT filament deposition 3D printer (Intamsys Technology Co. Ltd., Shanghai, China) having nozzle diameter of 0.4 mm. The bulk material properties were: density = 1205 ± 45 kg/m3, Young’s Modulus = 2.636 ± 0.33 GPa, tensile strength = 46.6 ± 0.9 MPa in the printing planes (x-y plane) and 43.5 ± 3.1 MPa across the printing planes (z-axis) [31], and Poisson’s ratio = 0.3. Both the standard and novel honeycomb specimens were 3D-printed in the two aforementioned scales.
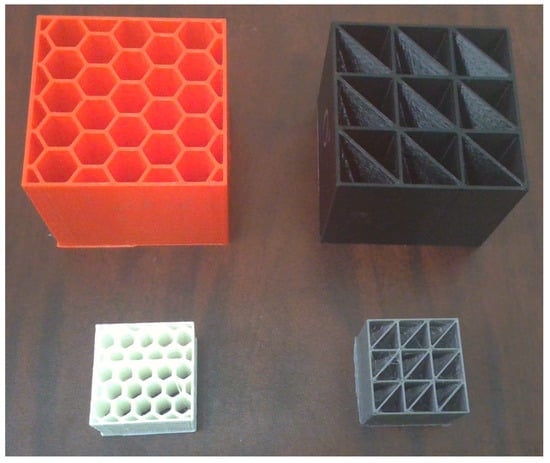
Figure 3.
3D-printed PLA test specimens in regular scale and double scale: standard geometry (left) and innovative geometry (right).
The printing orientation was set such that each of the printing layers was perpendicular to the cell height. Such orientation was selected after having previously evaluated different printing orientations in the case of double-scale novel samples, with the printing layers parallel to the cell height and with a 45° inclination with respect to the cell height; the two latter printing configurations had given rise to delamination at an early stage of the axial compression process, with a lower overall energy absorption. The AM process was carried out by selecting the following printing parameters: PLA filament diameter = 1.75 mm, infill density = 100%, layer thickness = 0.4 mm, printing speed = 80 mm/s, extruder temperature = 215–220 °C, and bed temperature = 80 °C. The above-mentioned printing parameters were used for both the regular scale and the larger scale. The wall thicknesses were adjusted when scaling the model to maintain proportionality. The speed of printing was kept constant in both cases, which could technically result in reduced cooling time, and improved interlayer adhesion as a result, but this effect was assumed to be negligible for the current study.
2.3. Experimental Setup
To carry out the quasi-static compression tests, an experimental Test Resources 313 Family Universal Test Machine (Figure 4) with load capacity of 50 kN, available at the Fibers and Composites Manufacturing Facility (FCMF) of the University of Tennessee, Knoxville (UTK), was used. The maximum displacement was 63.5 mm in the axial direction and 76.2 mm in the lateral direction. The specimens were placed between the steel plate compression fixture, with the compression rate set to 3 mm/min. The tests were allowed to continue until the compression distance reached 75% of the specimen height. This corresponded to 57.2 mm for the large scale specimens under lateral compression, 23.9 mm for the regular scale specimens under axial compression, and 28.6 mm for the regular scale specimens under lateral compression. The axial compression of the large-scale specimens was not performed, since, in these cases, the reaction force would reach values higher than the 50 kN-load capacity of the compression test machine.
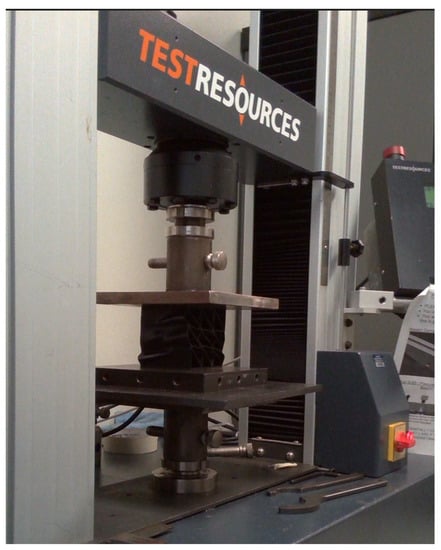
Figure 4.
Test Resources Series 313 Universal Test Machine. All quasi-static compression trials were performed on this machine located at the Fibers and Composites Manufacturing Facility (FCMF) of the University of Tennessee (UT).
The compression tests were recorded using a GoPro camera, and the experimentally measured force-displacement data were recorded by a computer connected to the compression test machine. To ensure the reliability of the results, five experimental tests were carried out for each combination of geometry and load case for the regular scale, and four experimental tests were carried out for each of the two geometries for the large scale.
2.4. Finite Element Modeling
3D-explicit nonlinear finite element analyses of the novel honeycomb under axial and lateral quasi-static compression loads were conducted using the commercial software ANSYS Workbench. The FE models replicate the dimensions and loading conditions as the experimental setup, as shown in Figure 5. The honeycomb was numerically modeled using two solid elements: across the wall thickness and multilinear isotropic hardening material (see Figure 6) with an elastic modulus of 1.25 GPa and a density of 1190 kg/m3. The yield strength of the 3D-printed PLA in the axial direction (perpendicular to the printing plane) and lateral direction (in the printing plane) were experimentally determined (46 MPa and 60 MPa, respectively). The honeycomb specimens were placed between two rigid plates and subjected to a controlled vertical deformation rate. The crushing of the honeycomb cell was accomplished by fixing the lower plate in all directions, while the upper plate moved downward with linear velocity varying from an initial value of zero to a final maximum value. In all cases, the crushing distance was set to be approximately 80% of the original length. To balance computational time and solution accuracy, the kinetic energy of the upper plate was maintained below 10% of the internal energy during the simulations, so that dynamic effects were assumed to be negligible. The interaction between the specimens and the rigid plates was modeled using frictional contacts with equal static and dynamic friction coefficients of 0.05 or bonded contacts (see Table 2). Body self-contact based on the penalty formulation was defined for the honeycomb elements. Hourglass energy was controlled using the Flanagan-Belytschko algorithm, with a stiffness coefficient of 0.08 and a viscous coefficient of 0.1. From this analysis, reaction force vs. displacement curves and absorbed energy were obtained and compared with the corresponding experimental results.
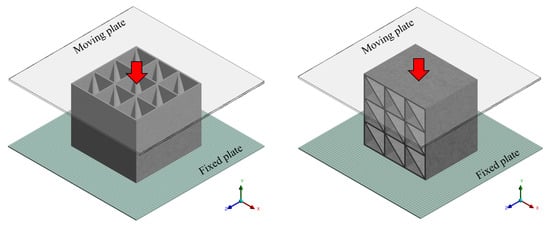
Figure 5.
FE model of novel honeycomb under axial (left) and lateral (right) loading conditions.
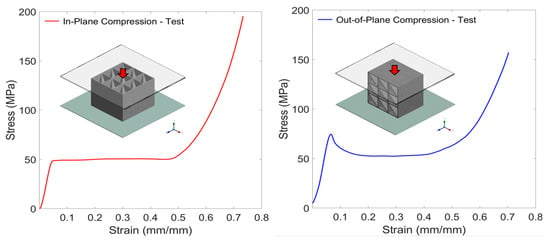
Figure 6.
Experimentally determined stress-strain curves under axial (left) and lateral (right) loading conditions.

Table 2.
FE analysis settings.
3. Results
Five specimens were tested, under quasi-static compressive load, for each of the following combinations of cell geometry, load direction, and dimensional scale:
- Hexagonal, regular scale, under axial load;
- Novel, regular scale, under axial load;
- Hexagonal, regular scale, under lateral load;
- Novel, regular scale, under lateral load;
- Hexagonal, large scale, under lateral load;
- Novel, large scale, under lateral load.
For the regular scale, novel model under both lateral and axial loading, a numerical model using Finite Element Analysis (FEA) was tested and validated in the light of the experimental results. For each of the aforementioned combinations of sample geometry, dimensional scale and load case, the force-displacement curves were plotted. In each of the cases, the energy absorption (EA) was calculated by integrating the area under the force-displacement curve using Equation (1) [17] until a crushing length corresponding to two thirds (⅔) of the initial length:
where F is the reaction force and l is the displacement of the compression plate with respect to the initial position corresponding to the undeformed sample shape. For the regular scale models under axial load, the crushing length was equal to 21.2 mm, for the regular scale models under lateral load was 25.4 mm, and for the large scale models under lateral load, was 50.8 mm. For each combination of geometry, scale, and load case, the maximum reaction force was noted.
3.1. Regular-Scale Specimens with Novel Geometry
3.1.1. Under Axial Load
The experimental force-displacement curves of the regular scale specimens constituted by the novel cell geometry and undergoing axial load are plotted in Figure 7. Under axial load, the regular scale specimens with novel geometry in experiment three collapse. The first one, starting at a compressive displacement of about 2 mm, was related to the collapse of the top end of the sample. The second one, beginning at a compressive displacement of 7 mm, was related to the collapse of the bottom end of the sample. The third one starts at a displacement of 15 mm, and was associated with the collapse of the central portion of the sample. The densification eventually begins at a displacement of approximately 20 mm. The average absorbed energy from the experimental tests results was equal to 227.93 J. The average reaction force at the initial peak after the elastic phase was equal to 14.31 KN. The specific energy absorption corresponding to a crushing length of 21.2 mm was equal to 17.14 kJ/kg.
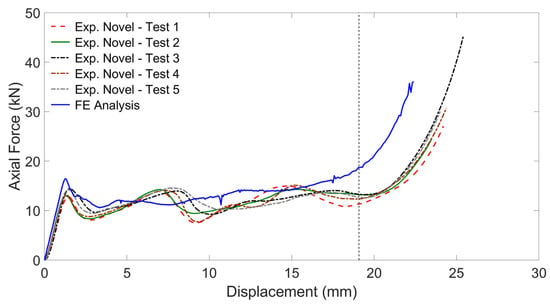
Figure 7.
Reaction force versus displacement of the novel cell geometry with regular dimensions under axial loading: experimental and FE curves.
The experimentally-observed three collapses and final densification are captured in Figure 8a–d, respectively. The corresponding phases were reproduced numerically as part of the FEA analysis, and are depicted in Figure 9a–d.
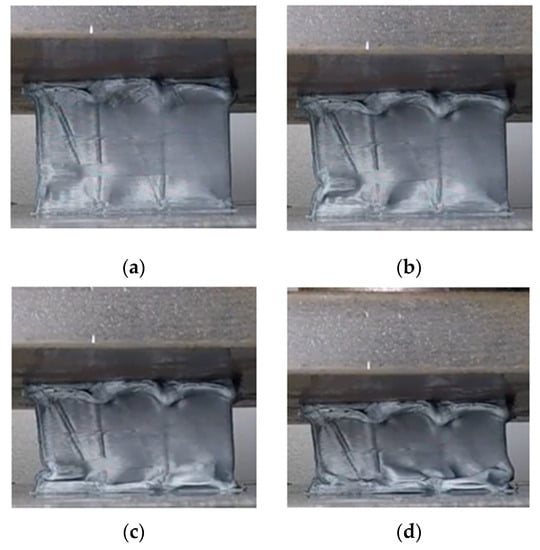
Figure 8.
Different stages of compression of the regular scale novel honeycomb sample under axial load during an experimental test: (a) collapse of the top end; (b) collapse of the bottom end; (c) collapse of the central part; and (d) densification.

Figure 9.
Deformation stages of compression of the regular scale novel honeycomb sample under axial load, reproduced using FEA: (a) collapse of the top end; (b) collapse of the bottom end; (c) collapse of the central part; and (d) densification.
3.1.2. Under Lateral Load
The experimental and numerical force-displacement curves of the regular-scale specimens constituted by the novel cell geometry undergoing lateral load are plotted in Figure 10. The average absorbed energy from the experimental tests results was equal to 75.08 J. The specific energy absorption corresponding to a crushing length of 25.4 mm was equal to 5.65 kJ/kg. The averaged maximum reaction force before densification was equal to 5.78 kN, and is found at the end of the initial elastic phase. Such an initial peak was followed by a substantially regular plateau corresponding to the plastic buckling and having an average reaction force of 3 kN that lasts until a deformation of 20 mm; at this point, the densification starts.
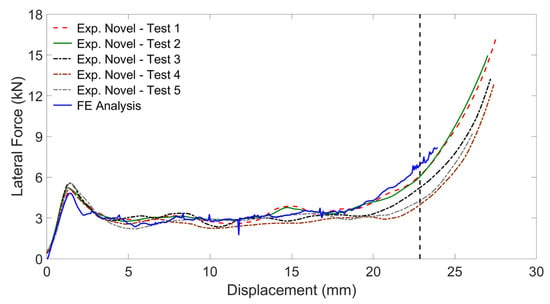
Figure 10.
Reaction force versus displacement of the novel cell geometry with regular scale and under lateral loading: experimental and FE curves.
As regards the observed deformation mode, the following deformation mechanism has been experimentally observed: plastic buckling first appeared on the principal diagonal of the sample that is oriented along the direction of the diagonal walls (Figure 11). The corresponding deformation sequence was reproduced numerically as part of the FEA analysis, and is depicted in Figure 12a–d.

Figure 11.
(a–d) Experimentally-observed deformation sequence of the 50%-scale novel honeycomb sample under lateral load: plastic buckling first appears on the principal diagonal of the sample that is oriented along the direction of the diagonal walls.

Figure 12.
(a–d) Deformation stages of compression of the regular-scale, novel honeycomb sample under lateral load, reproduced via FE Analysis by observing the deformation mechanism of the experimental tests (Figure 11).
Figure 10 presents a comparison between the experimental and FEA force-displacement curves, and evidences a substantial agreement between the experimental and numerical results.
3.2. Regular-Scale Specimens with Hexagonal Geometry
3.2.1. Under Axial Load
The experimental force-displacement curves of the regular-scale specimens constituted by the hexagonal cell geometry and undergoing axial load are plotted in Figure 13 and Figure 14. Since the beginning of the densification is gradual, its onset was set at a displacement of approximately 20 mm, which corresponds to the point where the reaction force exceeds the value reached at the initial peak at the end of the elastic region. The average absorbed energy from the experimental tests results was equal to 260.20 J. The average maximum reaction force before densification is found at the initial peak after the elastic phase, and was equal to 17.99 KN. The specific energy absorption corresponding to a crushing length of 21.2 mm results was equal to 19.56 kJ/kg.
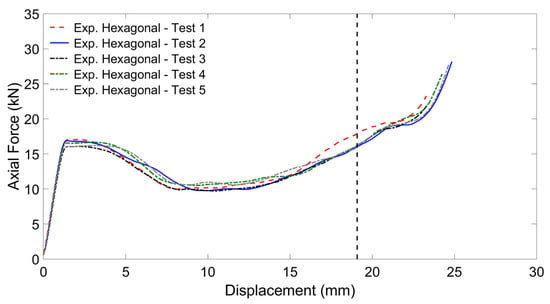
Figure 13.
Force-displacement experimental curves of the regular-scale specimens constituted by the hexagonal cell geometry and undergoing axial load.

Figure 14.
Experimentally-observed deformation sequence of one representative sample of regular-scale hexagonal honeycomb undergoing axial load.
3.2.2. Under Lateral Load
The experimental force-displacement curves of the regular-scale specimens constituted by the hexagonal cell geometry and undergoing lateral load are plotted in Figure 15. The experimentally observed deformation sequence is depicted in Figure 16. The force-displacement curves of the various experiments show a general agreement in terms of displacement and reaction force at which the initial peak occurs, although a significant level of variation between trials can be observed in the plastic deformation region prior to densification: the latter occurs at a displacement that varies between 22 mm and 23 mm, depending on the particular sample. The average absorbed energy from the experimental tests results was equal to 51.13 J. The average maximum reaction force before densification is found at the initial peak after the elastic phase, and was equal to 4.29 KN. The specific energy absorption corresponding to a crushing length of 25.4 mm was equal to 3.84 kJ/kg.
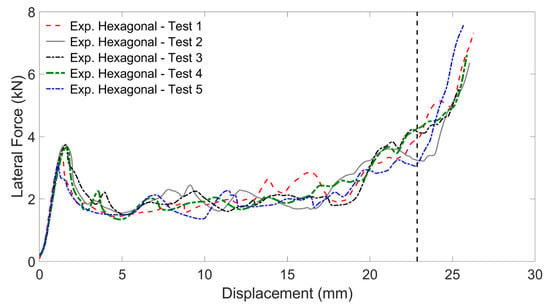
Figure 15.
Experimental force-displacement curves of the regular-scale specimens constituted by the hexagonal cell geometry and undergoing lateral load.

Figure 16.
Experimentally-observed deformation sequence of the regular-scale hexagonal honeycomb sample under lateral load.
3.3. Overview of the Sample Geometry Comparison at Regular Scale
A summary table of the average values for the experimentally measured energy absorption, maximum reaction force at the initial elastic peak, and energy absorption per unit mass for the novel and hexagonal geometries in the regular scale under axial and lateral loads is given in Table 3.

Table 3.
Average values and standard deviations of the for energy absorption, maximum reaction force at the initial elastic peak, and energy absorption per unit mass, for the novel and hexagonal geometries in the regular scale under axial and lateral loads (from experimental tests).
A graphical representation of the energy absorbed for the regular-scale samples is given in Figure 17, where the energy absorption of the novel geometry (for both the average experimental and numerical results) and hexagonal geometry (for the average experimental results) are compared. The results from the finite element analysis (FEA) of the novel sample are in good agreement with the experimental data.
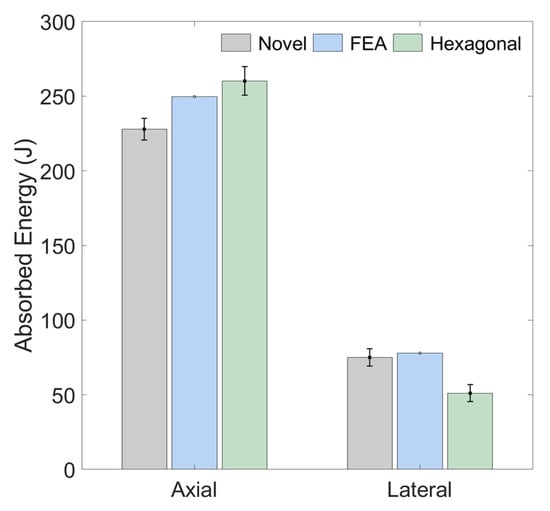
Figure 17.
Comparison of energy absorption between the novel and hexagonal honeycomb (left) in the original scale. The blue column (FEA) represents the numerical results for the novel geometry, whereas the gray (novel geometry) and green (hexagonal geometry) columns represent the average experimental results for these forms.
3.4. Large-Scale Specimens under Lateral Load
3.4.1. Large-Scale, Novel Geometry under Lateral Load
The experimental force-displacement curves of the large-scale specimens constituted by the novel cell geometry and undergoing lateral load are plotted in Figure 18.
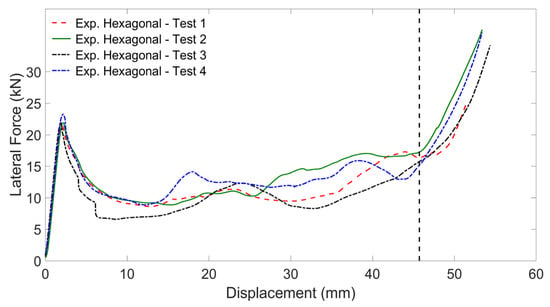
Figure 18.
Experimental force-displacement curve of the large-scale specimens constituted by the novel cell geometry and undergoing lateral load.
The average absorbed energy from the experimental tests results was equal to 613.85 J. The specific energy absorption corresponding to a crushing length of 50.8 mm was equal to 5.77 kJ/kg. The average maximum reaction force was equal to 22.74 kN, and is found at the end of the initial elastic phase. Such initial peak, is followed by an irregular plateau corresponding to the plastic buckling, which shows the reaction force oscillating within a range between 10 KN and 15 KN, and which lasts until a deformation of 47 mm: at this point, the densification starts.
As regards the experimentally observed deformation mode, the plastic buckling tended to follow a diagonal pattern along the sample section’s principal diagonal that was oriented along the direction of the internal walls (Figure 19), similar to what was observed in the corresponding case at regular scale.

Figure 19.
Experimentally-observed deformation sequence of one representative large-scale novel honeycomb sample under lateral load.
3.4.2. Large-Scale, Hexagonal Geometry under Lateral Load
The experimental force-displacement curves of the large-scale specimens constituted by the hexagonal cell geometry and undergoing lateral load are plotted in Figure 20. The experimentally observed deformation sequence is depicted in Figure 21.
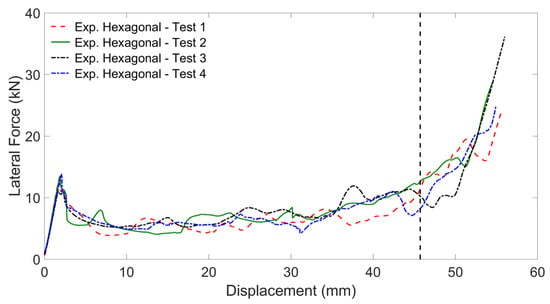
Figure 20.
Experimental force-displacement curves of the large-scale specimens constituted by the hexagonal cell geometry and undergoing lateral load.

Figure 21.
Experimentally-observed deformation sequence of one representative large-scale hexagonal honeycomb sample under lateral load.
The force-displacement curves of the various experiments show a general agreement in terms of displacement and reaction force at which the initial peak occurs, whereas a significant level of dispersion can be observed in the crushing region, until densification; however, the irregularity of the crushing plateau appears more contained if compared to the analogous loading case for the regular-scale hexagonal model. Densification began at an average displacement of 45 mm. The average absorbed energy from the experimental tests results was equal to 358.08 J. The averaged maximum reaction force before densification is found at the initial peak after the elastic phase, and was equal to 14.90 KN. The specific energy absorption corresponding to a crushing length of 50.8 mm was equal to 3.37 kJ/kg.
3.5. Scale Effect
A summary table of the average values for the experimentally measured energy absorption, maximum reaction force at the initial elastic peak, and energy absorption per unit mass for the novel and hexagonal geometries under lateral loads is given in Table 4 for both dimensional scales.

Table 4.
Average values and standard deviations for the experimentally measured energy absorption, maximum reaction force at the initial elastic peak, and energy absorption per unit mass, for the novel and hexagonal geometries under lateral loads and for both dimensional scales.
The histograms in Figure 22 compare the average, experimentally measured specific energy absorption under lateral load for the two different core geometries (novel and hexagonal) at both the original and larger (scaled) dimensional scales.
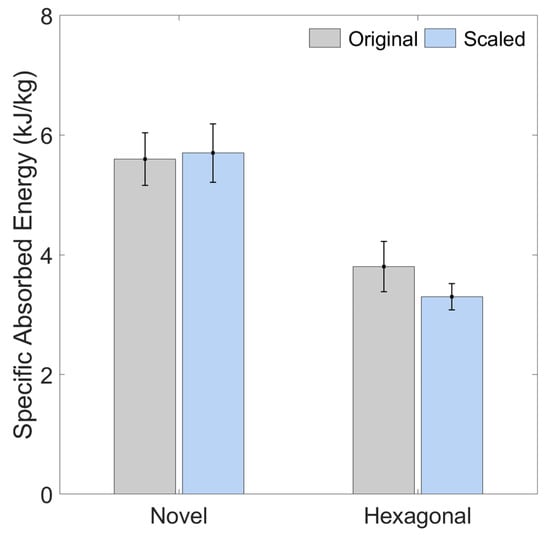
Figure 22.
Average values (with standard deviations) of the experimentally measured energy absorption per unit mass, as a function of displacement under lateral load: comparison in terms of geometry and scale. The Scaled geometry is the larger one (having double dimensions compared to the original one).
4. Discussion
A summary table of the experimentally measured behavior of the novel geometry and hexagonal geometry, under both axial and lateral load for the regular scale and under lateral load for the large scale, is presented in Table 5.

Table 5.
Average values and standard deviations of the experimentally measured energy absorption, maximum reaction force at the initial elastic peak, and energy absorption per unit mass for the novel geometry and hexagonal geometry, under both axial and lateral load for the regular scale and under lateral load for the large scale.
Geometry Comparison under Axial Loads at Regular Scale
The novel geometry presents 12.4% less energy absorption under axial loads. However, examining the force-displacement curve, the novel geometry exhibits a quasi-absence of an initial peak, as indicated in Figure 7 for both the numerical case and the experimental case. This means that the passengers of a vehicle or a payload would experience a smoother variation in acceleration in cases which the novel geometry was used. For this reason, in the design of sandwich panels intended to protect passengers or payload from low-velocity impacts, the pre-crushing of the novel honeycomb would potentially not be needed. This fact would allow the large-scale manufacturing of more repeatable and reliable honeycomb cores, since the honeycomb pre-crushing is subject to a potentially substantial amount of uncertainty. Furthermore, once the standard hexagonal honeycomb is pre-crushed, its energy absorption under axial load would reduce to smaller values.
Geometry Comparison under Lateral Loads at Regular Scale
The novel geometry exhibits an increase in terms of energy absorption, equal to 46.8% for the regular scale and 71.4% for the large scale, as shown in Table 5. The presence of the initial peak (Figure 10) under lateral compression would not necessarily require pre-crushing, since the average maximum reaction force under lateral load before is approximately one-half of the average reaction force under axial load experienced by the same sample geometry with regular scale and under axial loading. Furthermore, the novel geometry presents a comparatively smaller standard deviation (compared to the average) in the experimental force-displacement curves when undergoing lateral load, as can be observed by comparing Figure 10 to Figure 15.
Discussion of the Scale Effect
From the values of energy absorption presented in paragraph 3 in the case of lateral load, it can be seen how the increase in dimensional scale produces a different effect in the two geometries when they experience a lateral, quasi-static load:
- The hexagonal geometry experiences a reduction, in terms of specific energy absorption per unit mass, equal to 12.24%.
- The novel geometry experiences an increase, in terms of specific energy absorption per unit mass, equal to 2.12%.
For the hexagonal sample geometry, the reduction in terms of specific energy absorption can be explained by the fact that the probability of flaws and defects constituting weak points for cracks activation is directly proportional to the parts’ dimensions. In addition, the experimentally observed local collapses (identified by sudden decreases of the reaction force in the force-displacement diagrams) have longer-lasting effects, in terms of reaction force reduction, in the case of the larger scale (Figure 20) compared to the case of the regular scale (Figure 15). On the other hand, the results observed in the case of the novel geometry indicate that the increased probability of cracks at larger scales is balanced by the tolerance challenges encountered when 3D printing non-prismatic geometries having smaller dimensions; in this specific case, one of the causes for the increased specific energy absorption witnessed by scaling up the novel model is associated with the fact that, at the regular scale, the 3D printer was working close to its lower operational limit in terms of thickness (using two filaments for the wall thickness for both the hexagonal and novel geometries), and this added to the fact that, in the case of the novel geometry, diagonal walls with sharp and concave corners between the different planes needed to be manufactured; therefore, due to its geometric features, the novel geometry was exposed to a higher probability of premature crack onset. On the other hand, the moderate increase in specific energy absorption by increasing the dimensions also indicates that the novel geometry is more suitable to be manufactured at larger scales, without experiencing the level of degradation, in terms of specific energy absorption shown by the hexagonal geometry. Another reason for the better behavior shown by the novel geometry in terms of specific energy absorption at a larger scale is due to a considerable shear stress concentration that occurs at the midplane of the novel cells under lateral quasi-static load (Figure 23), which acts as an additional energy storage mechanism that is absent in the case of prismatic cells such as the hexagonal ones; this phenomenon, which is related to the anti-symmetry of the novel cells with respect to their midplane and had first been observed in the case of a single cell with dimensions of 25.4 mm × 25.4 mm × 63.5 mm [17], is present also in the multicell samples constituted by the novel geometry; however, the stress concentration and energy storage are more pronounced in the samples with larger scale, as is witnessed by the presence of a fully deployed, transversal crack that typically appears in the large-scale samples upon lateral compression (Figure 23a,b), whereas it is more contained in the analogous case of samples with regular dimensions (Figure 23c).
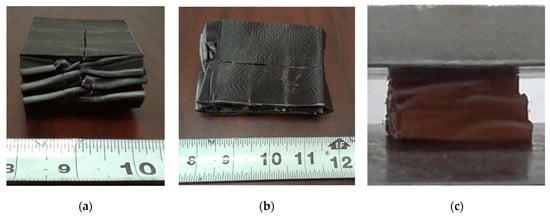
Figure 23.
(a,b) Transversal crack on the whole width of a large-scale novel experimental sample after lateral compression; and (c) regular scale, experimental sample at densification during lateral compression, with absence of the transversal crack.
Other phenomena that were observed by considering the scale effect of the two core geometries under lateral load include the following aspects:
In the case of the novel geometry, the experimental force-reaction curves of the samples with the regular scale (Figure 10) exhibit a remarkable reduction, in terms of data dispersion, compared to the experimental data from samples with larger scale (Figure 18). One of the main reasons for this phenomenon is that, for the novel core geometry at regular scale, the risk of data dispersion due to the lower manufacturing accuracy is compensated for by the presence of the internal diagonal walls, which help to prevent some of the sudden collapses that are observed in the larger scale, which determine a more irregular crushing plateau in the larger novel samples under lateral load (Figure 18). Conversely, in the case of the hexagonal core geometry, a significant dispersion was observed in the experimental data of both dimensional scales (Figure 15 and Figure 20).
A later densification onset is observed in the large-scale novel samples under lateral load (with densification beginning at 47 mm of deformation, compared to the average deformation onset in the regular scale-samples, which occurred at 20 mm on average), whereas it is perfectly proportional in the case of the hexagonal samples with regular dimensions (with densification starting between 22 mm and 23 mm) as compared to the hexagonal samples with large–double–dimensions (with densification starting when the deformation is, on average, 45 mm). This indicates the potential of having a larger deformation plateau available when scaling up the novel geometry.
5. Conclusions
3D-printed PLA samples constituted by multiple cells with variable sections proved to absorb an increased amount of energy, under lateral compression, compared to samples with same material, mass and external dimensions; this increase was equal to 46.8% for samples with a smaller (regular) dimension, whereas it reached 71.4% for samples with larger (double) dimensional lengths. In terms of axial energy absorption in the regular scale, the samples with novel geometry showed a decrease, in terms of energy absorption, equal to 12.4% as compared to the samples constituted by cells with standard hexagonal geometry; nevertheless, the innovative honeycomb geometry, under axial load, exhibited a substantial absence of an initial elastic peak of reaction force; this suggests that, for impact-deadening applications, the novel honeycomb geometry would not require a pre-crushing. In terms of a comparison between the regular scale and the larger scale under lateral load, an absence of degradation in terms of specific energy absorption was observed in the case of the samples with novel cell geometry when the dimensional scale was increased. This is different from what was observed in the analogous experiment carried out with the standard hexagonal honeycomb, where a degradation of 12.24% in terms of energy absorption per unit mass was witnessed: such an advantage exhibited by the novel core geometry constitutes a potential for scalability of the novel honeycomb core geometry to large dimensions, without compromising the passengers or payload safety.
6. Patents
A US Provisional patent Application (No.: 63/299,675 Title: SCUTOIDAL SUB-CELL AND CELL ARRANGEMENTS. Application Date: 14 January 2022. Inventors: MENEGOZZO, Marco; CECCHINI BRIGI, Andres; JUST AGOSTO, Frederick A.; SERRANO ACEVEDO, David. Applicant: UNIVERSITY OF PUERTO RICO) and an International Patent Application (No.: PCT/US22/54068 Title: SCUTOIDAL SUB-CELL AND CELL ARRANGEMENTS Application Date: December 27, 2022 Inventors: MENEGOZZO, Marco; CECCHINI BRIGI, Andres; JUST AGOSTO, Frederick A.; SERRANO ACEVEDO, David Applicant: UNIVERSITY OF PUERTO RICO) have been submitted for the innovative geometry mentioned in this paper.
Author Contributions
Conceptualization, M.M., A.C., U.K.V. and R.C.O.; methodology, M.M., A.C., U.K.V., R.C.O., I.A.-F. and J.A.T.-H.; software, A.C., I.A.-F., J.A.T.-H., M.M., R.C.O. and U.K.V.; validation, A.C., I.A.-F., J.A.T.-H., M.M., R.C.O. and U.K.V.; formal analysis, M.M., A.C., R.C.O., U.K.V., I.A.-F. and J.A.T.-H.; investigation, M.M., A.C., R.C.O., U.K.V., I.A.-F. and J.A.T.-H.; resources, U.K.V., M.M., A.C. and R.C.O.; data curation, M.M., A.C., J.A.T.-H., I.A.-F., R.C.O. and U.K.V.; writing—original draft preparation, M.M., A.C., R.C.O., J.A.T.-H., I.A.-F. and U.K.V.; writing—review and editing, M.M., A.C., R.C.O., I.A.-F., J.A.T.-H. and U.K.V.; visualization, M.M., A.C., I.A.-F., J.A.T.-H., U.K.V. and R.C.O.; supervision, M.M., A.C., U.K.V. and R.C.O.; project administration, M.M., U.K.V. and A.C.; funding acquisition, M.M. and U.K.V. All authors have read and agreed to the published version of the manuscript.
Funding
This research was funded by the US Department of Energy (DoE) through the Summer 2022 Visiting Faculty Program that Dr. Marco Menegozzo spent at the Oak Ridge National Laboratory (ORNL). Preliminary data had previously been obtained thanks to funds from the Puerto Rico Science, Technology and Research Trust (PRSTRT), grant agreement number 2020-00135.
Data Availability Statement
Not applicable.
Acknowledgments
Romeo Sephyrin Fono-Tamo (UT-ORNL) gave us logistical support and helped in the organization of the experimental tests. The UPRM undergraduate students Dylan G. Batyk-Rivera, Jonathan Santiago Figueroa, and David O. Rivera Gonzalez executed some of the FEA simulations and selected some of the figures. The UPRM undergraduate student Jancary De Jesus-Ruiz contributed to the FEA simulations. The Mechanical Engineering Department of the University of Puerto Rico at Mayaguez supported us with computational resources. The staff of the Manufacturing Demonstration Facility (MDF) at ORNL and the staff of the Fibers and Composites Manufacturing Facility (FCMF) at UT provided us with scientific and logistic support.
Conflicts of Interest
The authors declare no conflict of interest.
References
- Seilsepour, H.; Zarastvand, M.; Talebitooti, R. Acoustic insulation characteristics of sandwich composite shell systems with double curvature: The effect of nature of viscoelastic core. J. Vib. Control 2022, 29, 1076–1090. [Google Scholar] [CrossRef]
- Zarastvand, M.; Asadijafari, M.; Talebitooti, R. Acoustic wave transmission characteristics of stiffened composite shell systems with double curvature. Compos. Struct. 2022, 292, 115688. [Google Scholar] [CrossRef]
- Pan, C.; Han, Y.; Lu, J. Design and Optimization of Lattice Structures: A Review. Appl. Sci. 2020, 10, 6374. [Google Scholar] [CrossRef]
- Guide to Lattice Structures in Additive Manufacturing. nTopology, 28 April 2022. Available online: https://ntopology.com/blog/guide-to-lattice-structures-in-additive-manufacturing/ (accessed on 6 June 2022).
- Maskery, I.; Sturm, L.; Aremu, A.O.; Panesar, A.; Williams, C.B.; Tuck, C.J.; Wildman, R.D.; Ashcroft, I.; Hague, R.J.M. Insights into the mechanical properties of several triply periodic minimal surface lattice structures made by polymer additive manufacturing. Polymer 2018, 152, 62–71. [Google Scholar] [CrossRef]
- Qi, C.; Jiang, F.; Yang, S. Advanced honeycomb designs for improving mechanical properties: A review. Compos. Part B Eng. 2021, 227, 109393. [Google Scholar] [CrossRef]
- Compton, B.G.; Lewis, J.A. 3D-Printing of Lightweight Cellular Composites. Adv. Mater. 2014, 26, 5930–5935. [Google Scholar] [CrossRef] [PubMed]
- Hales, T.C. The Honeycomb Conjecture. Discret. Comput. Geom. 2001, 25, 1–22. [Google Scholar] [CrossRef]
- Bhate, D.; Penick, C.A.; Ferry, L.A.; Lee, C. Classification and Selection of Cellular Materials in Mechanical Design: Engineering and Biomimetic Approaches. Designs 2019, 3, 19. [Google Scholar] [CrossRef]
- Yin, H.; Zhang, W.; Zhu, L.; Meng, F.; Liu, J.; Wen, G. Review on lattice structures for energy absorption properties. Compos. Struct. 2023, 304, 116397. [Google Scholar] [CrossRef]
- Zeng, C.; Liu, L.; Bian, W.; Leng, J.; Liu, Y. Compression behavior and energy absorption of 3D printed continuous fiber reinforced composite honeycomb structures with shape memory effects. Addit. Manuf. 2021, 38, 101842. [Google Scholar] [CrossRef]
- Wickramasinghe, S.; Do, T.; Tran, P. FDM-Based 3D Printing of Polymer and Associated Composite: A Review on Mechanical Properties, Defects and Treatments. Polymers 2020, 12, 1529. [Google Scholar] [CrossRef] [PubMed]
- Hull, C.W.; Gabriel, S. Apparatus for Production of Three-Dimensional Objects by Stereolithography. U.S. Patent 4,575,330, 11 March 1986. [Google Scholar]
- Gwamuri, J.; Poliskey, J.E.; Pearce, J.M. Open Source 3-D Printers: An Appropriate Technology for Developing Communities. In Proceedings of the 7th International Conference on Appropriate Technology, Victoria Falls, Zimbabwe, 23–26 November 2016; Available online: https://hal.archives-ouvertes.fr/hal-02113460 (accessed on 17 July 2022).
- Flora, F.; Pinto, F.; Meo, M. Manufacturing and characterisation of a new thermal pre-stressed carbon fibre-reinforced lattice core for sandwich panels. J. Compos. Mater. 2022, 56, 1233–1254. [Google Scholar] [CrossRef]
- Liu, S. Harnessing Elastic Instabilities for Energy Transduction. Ph.D. Thesis, Michigan State University, East Lansing, MI, USA, 2019. [Google Scholar]
- Menegozzo, M.; Cecchini, A.; Just-Agosto, F.A.; Acevedo, D.S.; Velez, O.J.F.; Acevedo-Figueroa, I.; Ruiz, J.D.J. A 3D-Printed Honeycomb Cell Geometry Design with Enhanced Energy Absorption under Axial and Lateral Quasi-Static Compression Loads. Appl. Mech. 2022, 3, 296–312. [Google Scholar] [CrossRef]
- Savini, A.; Savini, G.G. A short history of 3D printing, a technological revolution just started. In Proceedings of the 2015 ICOHTEC/IEEE International History of High-Technologies and their Socio-Cultural Contexts Conference (HISTELCON), Tel Aviv, Israel, 18–19 August 2015; pp. 1–8. [Google Scholar] [CrossRef]
- Horvath, J. Mastering 3D Printing; Apress: Berkeley, CA, USA, 2014. [Google Scholar] [CrossRef]
- Winick, E. 3D Printing’s 30 Year History and Why It’s Popular Now. Medium, 26 January 2017. Available online: https://medium.com/@erinwinick/3d-printings-30-year-history-and-why-it-is-popular-now-5200ab21a7ed (accessed on 1 July 2022).
- All3DP. The Official History of the RepRap Project. All3DP, 8 April 2016. Available online: https://all3dp.com/history-of-the-reprap-project/ (accessed on 1 July 2022).
- DE Editors. Sub-$10,000 3D Printers Near Market. Digital Engineering, 27 September 2007. Available online: https://www.digitalengineering247.com/article/sub-10-000-3d-printers-near-market (accessed on 1 July 2022).
- Timeline of the 3D Printing History—ASME. Available online: https://www.asme.org/topics-resources/content/infographic-the-history-of-3d-printing (accessed on 1 July 2022).
- Kuncius, T.; Rimašauskas, M.; Rimašauskienė, R. Interlayer Adhesion Analysis of 3D-Printed Continuous Carbon Fibre-Reinforced Composites. Polymers 2021, 13, 1653. [Google Scholar] [CrossRef] [PubMed]
- Xu, Z.; Medori, E.; Sarasini, F.; Razavi, S.M.J. Quasi-static behavior of 3D printed lattice structures of various scales. Procedia Struct. Integr. 2021, 33, 578–585. [Google Scholar] [CrossRef]
- Aziz, A.R.; Zhou, J.; Thorne, D.; Cantwell, W.J. Geometrical Scaling Effects in the Mechanical Properties of 3D-Printed Body-Centered Cubic (BCC) Lattice Structures. Polymers 2021, 13, 3967. [Google Scholar] [CrossRef] [PubMed]
- Mueller, J.; Shea, K. Buckling, build orientation, and scaling effects in 3D printed lattices. Mater. Today Commun. 2018, 17, 69–75. [Google Scholar] [CrossRef]
- Andrew, J.J.; Ubaid, J.; Hafeez, F.; Schiffer, A.; Kumar, S. Impact performance enhancement of honeycombs through additive manufacturing-enabled geometrical tailoring. Int. J. Impact Eng. 2019, 134, 103360. [Google Scholar] [CrossRef]
- Nazir, A.; Gohar, A.; Lin, S.-C.; Jeng, J.-Y. Flexural Properties of Periodic Lattice Structured Lightweight Cantilever Beams Fabricated Using Additive Manufacturing: Experimental and Finite Element Methods. 3D Print. Addit. Manuf. 2022, 3dp.2022.0017. [Google Scholar] [CrossRef]
- Overture 3D. Available online: https://overture3d.com/ (accessed on 21 December 2022).
- Overture PLA 3D Printing Filament 1.75mm. Overture 3D. Available online: https://overture3d.com/products/overturepla (accessed on 21 December 2022).
Disclaimer/Publisher’s Note: The statements, opinions and data contained in all publications are solely those of the individual author(s) and contributor(s) and not of MDPI and/or the editor(s). MDPI and/or the editor(s) disclaim responsibility for any injury to people or property resulting from any ideas, methods, instructions or products referred to in the content. |
© 2023 by the authors. Licensee MDPI, Basel, Switzerland. This article is an open access article distributed under the terms and conditions of the Creative Commons Attribution (CC BY) license (https://creativecommons.org/licenses/by/4.0/).