Abstract
Aiming at the problem that thermocouples used in different parts of aeroengines need a lot of repeated design work in application and the high precision requirements as special test sensors, a parameterized optimization method for a thermocouple shape combined with a numerical simulation method is proposed. The performance of a dual-screen thermocouple (DST), single-screen thermocouple (SST), and no-screen thermocouple (NST) is tested by a numerical simulation method, and is represented by the velocity error and the restitution coefficient r. The dual-screen thermocouple (DST) is the best one, and it is selected as the object to parametric optimization, and the parametric optimization methods based on it, geometrically modeled parametrically, adaptive mesh generation and parametric numerical simulation, are proposed. For a dual-screen thermocouple (DST), eight design structural parameters and four environment parameters are suggested for geometrically modeled parametrically and parametric numerical simulation, respectively. The dichotomy method is used to find the optimal length of the screen L, which is considered the most relevant parameter for thermocouple performance. It can be found that the length of the screen L corresponding to the optimal restitution coefficient r ranges from 56.25 to 62.5 mm.
1. Introduction
A thermocouple working in an aircraft engine is one of the airflow thermocouples, whose working principle is to obtain the total temperature with minimal deviation so that the temperature measured by the thermocouple is as close to the total airflow temperature as possible by designing a special head structure. Through the distribution of the temperature field, the working state and performance of the engine can be known to determine whether it meets the requirements of flight control, which will be carried out by a special temperature test sensor, that is, the thermocouples distributed throughout the engine [1,2,3]. The error from the test results of the thermocouple would directly determine the measured temperature field distribution inside the engine and the accuracy of the engine efficiency and performance calculated from the measured temperature field [4]. These will directly affect the thrust control of the engine, and then affect the closed loop of the flight control of the aircraft, as shown in Figure 1. Therefore, a lot of research has been carried out to calibrate the measurement accuracy of thermocouples used in a flight engine [4,5,6,7].
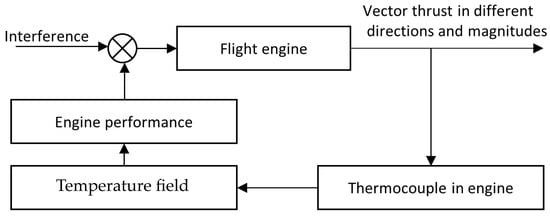
Figure 1.
Thermocouple in aeroengines’ thrust control loop.
However, it is worth noting that the error cannot be completely eliminated by designing a special head structure due to the radiation heat dissipation and the limited installation space of the thermocouple as a dedicated temperature sensor. Therefore, it is necessary to optimize the shape of the thermocouple as much as possible during design to improve its accuracy and to calibrate the measurement accuracy of the thermocouple before use. A common method used in the past was to use standard thermocouples for calibration in a thermal calibration wind tunnel [4,5,7,8,9,10]. Different from the thermocouple, a standard thermocouple is less constrained by the measurement installation environment so that its structural size can be relatively complex and can better reduce the measurement error by designing the structure. The calibration process of the thermocouple needs to install it and the standard thermocouple on the upper and lower mounting seats in the test section of the thermal calibration wind tunnel. The upper and lower mounting seats are in a plane perpendicular to the flow direction of the wind tunnel. In order to ensure that the flow conditions around the two thermocouples are the same, their positions from the wall surface should be kept the same so that the temperature difference measured by them can be directly used on the thermocouple. Of course, the inherent error of the standard thermocouple used as the reference and the uneven distribution of the flow on the thermal calibration wind tunnel section would greatly affect the calibration work [11]. However, the above-mentioned problems will be avoided when the accuracy of the thermocouple is verified in a numerical simulation [2,3,4,5]. In the numerical simulation, the temperature of the flow field no longer needs to be measured by an additional standard thermocouple, which means that the total temperature of the flow field near the thermocouple to be tested is known. In addition, numerical simulations are faster than experimental calibration methods [1]. This facilitates the optimization of the shape of the thermocouple, which needs to quickly obtain the accuracy corresponding to the thermocouple of a certain shape.
In addition, the acquisition of the temperature field in the aircraft engine usually requires the installation of thermocouples in different positions of the engine. Different positions have different flow conditions and temperature ranges, so a common thermocouple will not work with high precision. The thermocouple needs to be individually designed for the specific working conditions faced in actual work in order to improve the performance of the flight control closed-loop loop, which includes a lot of repetitive work, especially the calibration experiment of the thermocouple. However, numerical simulation methods and parametric design schemes suggest a new solution to the above problems [12]. A parametric design often only needs to change the geometric dimensions of the thermocouple, and the topology relationship between geometric elements will not be modified a lot. However, this requires a good topology relationship between geometric elements and a method that can quickly test the design results [13], so numerical simulation methods will be used. The shape of the thermocouples is then independently optimized based on the flow conditions at each position to improve their accuracy.
In this study, three different configurations of thermocouples will be studied via a numerical method first. On the one hand, the method of determining the accuracy of a thermocouple in a numerical simulation would be shown. On the other hand, the best configuration will be selected, and a shape parameterization optimization method will be established with this configuration. The description of the numerical method will be given in Section 2, and the obtained results will be presented in Section 3. Based on the numerical simulation method and simulation results, the shape parameterization optimization method will be established in Section 4. Finally, a short summary of the present work will be given in Section 5.
2. Materials and Methods
Three different configurations of thermocouples will be investigated, that is, dual-screen thermocouple (DST), single-screen thermocouple (SST), and no-screen thermocouple (NST). Their structures are shown in Figure 2. The difference between the above three structures is whether there is a screen on the outside of the thermocouple and the number of screens. Other than that, all the structures are exactly the same. The most basic thermocouple does not have a screen, that is, NST; it just uses a solder ball to connect the two thermocouple wires at the end of the signal wire, as shown in Figure 2a. Based on a thermocouple used in an aeroengine designed by our research group in the past, the dimension parameters of a thermocouple selected in the present work are as follows: The diameter of the thermocouple wire is d = 0.5 mm; the diameter of the solder ball is D = 1.3 mm. The diameter of the thermocouple wire is L1 = 12 mm. SST and DST can be formed by adding one or two screens with a thickness of H = 1.6 mm on the outside of NST, respectively (see Figure 2b,c), where the length of the screen is L = 50 mm. The inner diameters of the two screens are Din1 = 12 mm and Din2 = 24 mm, respectively. The inner screen and the signal wire are sealed with a metal sheet to stagnate the flow, which is located at the axial center of the screen. The solder ball is 8 mm from the right-end face of the screen.
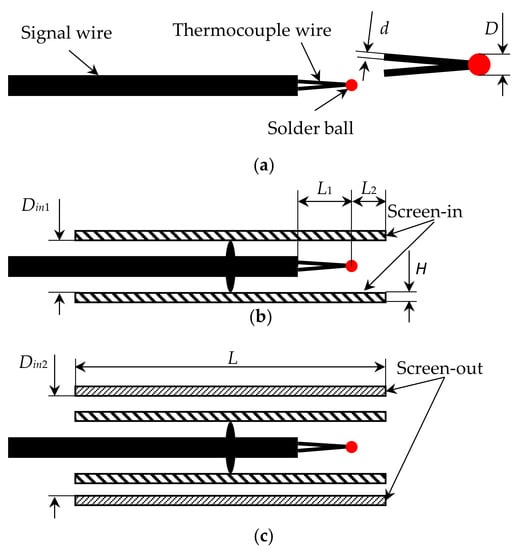
Figure 2.
Three types of thermocouples with different configurations: (a) no-screen thermocouple (NST), (b) single-screen thermocouple (SST), (c) dual-screen thermocouple (DST).
The cylindrical computational domain is used for the numerical simulation of thermocouples, as shown in Figure 3. The radius of the computational domain is R = 200 mm. The distances from the installation position of the thermocouples to the upstream boundary and the downstream boundary are X1 = 300 mm and X2 = 500 mm, respectively. The size of the computational domain is doubled, and the maximum temperature on the surface of the solder ball is monitored under the same flow conditions, which is consistent with the results obtained by the present size of the computational domain. Therefore, the above dimensions, that is, X1 = 300 mm and X2 = 500 mm, are verified to be large enough that the outer boundary conditions have no influence on the numerical simulation results. The upstream boundary uses the pressure inlet boundary condition, which gives the total temperature and total pressure of the incoming flow. In our research, the static pressure is 2.0 MPa, and the static temperature is 870 K at the pressure inlet boundary. From the relationship between total pressure and static pressure, the incoming Mach number was determined to be 0.4, that is, a subsonic flow. Additionally, the pressure outlet boundary condition is applied to the downstream boundary. A slip wall condition is applied to the circumferential face of the computational domain and given a constant temperature, T = 500 K. The thermocouple will be simulated using the no-slip wall boundary condition. All wall boundary conditions consider the effect of radiative heat transfer, and the emissivity used is 0.5.
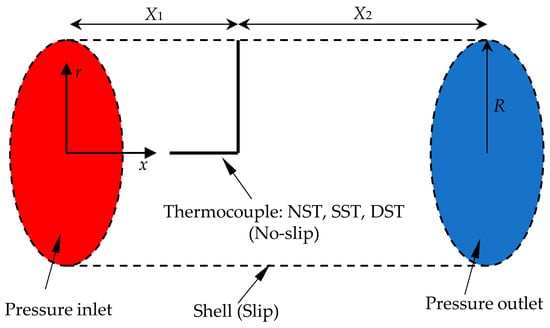
Figure 3.
Schematic of the computation domain and boundary conditions. The thermocouple was replaced by an L-shaped structure with the three structures shown in Figure 2 at the end.
The computational fluid dynamics package ANSYS Fluent is used for the numerical solution. Two characteristics can be obtained from the analysis of the flow situation. One is that the flow is a compressible flow, in which there is a high degree of coupling between velocity, density, pressure, and energy, and the coupling will lead to instability of the solution. The other is that due to a Mach number of 0.4, the use of compressible flow will produce a large truncation error in the case of a low Mach number. Considering the above flow characteristics, the numerical method used is as follows: The realizable k-epsilon model is used to solve the N–S equation, which has better calculation accuracy for problems such as strong pressure gradient and flow around a cylinder. The least squares cell-based method is used for the gradient difference, which has comparable accuracy to the Green–Gauss node-based method. The pressure, density, momentum, turbulent kinetic energy, turbulent dissipation rate, and energy are discretized using the second-order upwind style, which can alleviate the problem of large errors in the solution stage of low Mach compressible flows. The simple method for steady-state solutions is used to deal with the pressure–velocity coupling of the flow field. The presence of radiative heat transfer is also considered. The discrete ordinates model is used as the radiation model, which solves a set of radiation transport equations in discrete directions covering the entire 4π space angle by discretizing the directional variation of the radiation intensity. The discrete ordinates model is suitable for radiation problems in all optical depth ranges, and it can solve not only closed region problems without media, but also radiation problems involving media, which is consistent with the characteristics of the flow field concerned in this study. The convergence criterion for solving the steady-state N–S equation is set as the residual of energy less than 10−6 and the residuals of other items less than 10−4. This is mainly due to the fact that the temperature field distribution is the focus of the present work.
The flow medium is set as that used in the actual work of the flight engine. Due to the subsonic compressible flow, it should be considered that the physical parameters of the air will change during the flow. Changes in the density of air due to high pressure will be approximated using an ideal gas. The variation of constant pressure specific heat capacity and thermal conductivity with temperature will be approximated using a kinematic theory. The Sutherland equation will be used to describe the change in viscosity.
Polyhedral meshes are used to discretize the computational domain. The number of mesh nodes used by the polyhedral mesh is only about 30% of that of the tetrahedral mesh or hybrid mesh when the same computational accuracy is achieved. The mesh will be refined on the wall of the thermocouple and the surrounding area, and the minimum mesh size is 40 μm. Meshing schemes with minimum mesh sizes of 20 and 80 μm were used for a mesh independence test. The objective of this test is to compare the wall temperatures of the tip of the thermocouple solder ball. The difference between the results obtained by the two finest meshing schemes is less than 1%, which is enough to consider the mesh to be reliable.
In order to verify the effectiveness of the numerical method used in the present work, it is compared with the previous experimental results. In the case of an incoming flow with 0.4 Ma, the radial velocity distribution at a position, which is 0.5D away from the stagnation point on the solder ball in the no-screen thermocouple (NST), was measured and compared in Figure 4. It can be seen from the figure that the numerical results are in good agreement with the experimental results with error 5%.
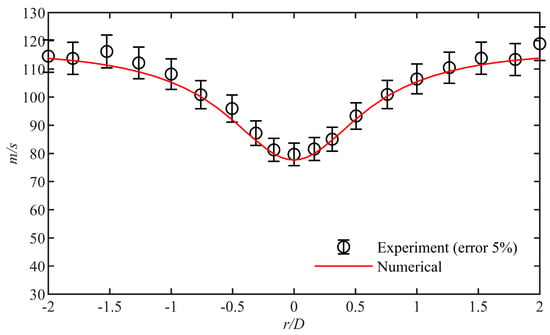
Figure 4.
Comparison of experimental (with 5% error) and numerical simulation results for the radial velocity distribution at 0.5D from stagnation point on a no-screen thermocouple (NST).
The purpose of the thermocouple is to create a thermal equilibrium between the fluid and the solid by slowing down the flow near its solder ball to measure the total temperature of the flow field here [9]. Additionally, the measured distribution of the total temperature in the engine will be directly used in the control closed-loop loop of the engine. However, due to the existence of problems such as thermal radiation, thermal conduction of the thermocouple itself, and the inability to completely stagnate the flow field, the measured results of the thermocouple will be lower than the actual situation. The purpose of calibrating a thermocouple is to give the deviation of the test result from the actual situation. Therefore, two parameters are proposed to represent the error. One is the velocity error due to the presence of flow, that is,
where is the total temperature (equal to 870 K) and is the average temperature of the thermocouple solder ball surface. In addition, the restitution coefficient can also be defined as
where is the static temperature of the flow field away from the thermocouple, that is, the position where there is no interference from the thermocouple. The coefficient of restitution can reflect the ability of the thermocouple to restore the static temperature of the flow field to the total temperature.
3. Results
3.1. No-Screen Thermocouple (NST)
The numerical simulation results of the no-screen thermocouple (NST) are shown in Figure 5 in the form of contours on the longitudinal section where the thermocouple is located. The incoming flow will directly impact the surface of the thermocouple opposite the incoming flow direction so that the temperature of the flow field in this area increases to be close to the total temperature, and the pressure also increases to be close to the total pressure (see Figure 5a,b). In order to better reflect the stagnation process of flow, the velocity contour near the thermocouple is shown in Figure 5c. On the upstream side of the solder ball, the flow velocity decreases under stagnation, which can be used to explain the aforementioned rise in static temperature and pressure. However, on the side of the solder ball, the transition region from upstream to downstream, the flow will accelerate due to the change in flow cross section. This can explain why the static temperature and static pressure in this region are close to those of the incoming flow. This process is similar to flow through a cylindrical (spherical) wall. In addition, at the connection between the thermocouple wire and the signal wire, the flow velocity in this area is also reduced due to the strong stagnation effect of the signal wire on the flow. Therefore, the static temperature and static pressure at this region are also higher.
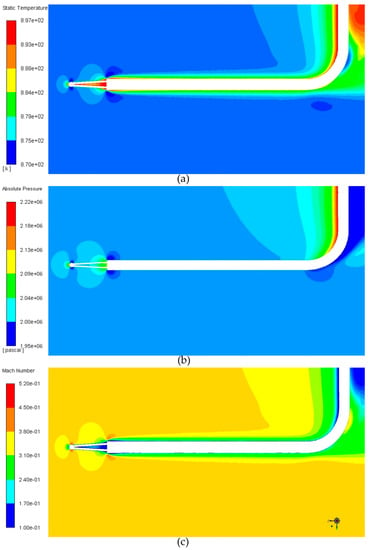
Figure 5.
Contour plots of (a) static temperature, (b) pressure, and (c) velocity distributions for the no-screen thermocouple (NST).
The static temperature distribution of a thermocouple solder ball and wires is shown especially in Figure 6, which is consistent with the flow state of the flow field. The wall temperature of the thermocouple wire changes in a steplike manner from the signal wire to the solder ball. This phenomenon is mainly caused by the stagnation of the flow at the end of the signal wire, resulting in the change of the flow velocity along the cross section of the wire. The slight increase in temperature at the contact region of the thermocouple wire with the solder ball is due to the low velocity zone created by the flow behind the solder ball. In addition, the large velocity changes in the flow around the solder ball cause uneven temperature distribution on the surface of the solder ball. The highest temperature occurred on the windward side of the solder ball at 897.2 K, while the lowest temperature occurred at the upstream and downstream transition regions, which is 891.2 K, and the difference reached 6 K. This may be one of the measurement errors of thermocouples. The average temperature of the thermocouple solder ball surface was calculated as . Submitting this result and the total temperature and static temperature of the incoming flow into Equations (1) and (2), the velocity error and restitution coefficient of the no-screen thermocouple can be obtained as 3.66 K and 84.88%, respectively.
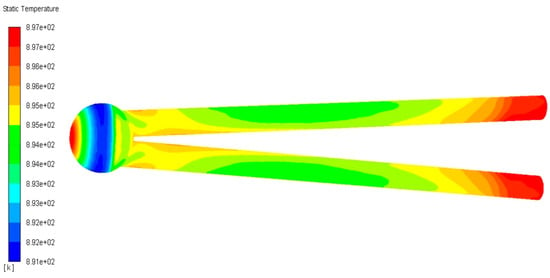
Figure 6.
Static temperature distribution of thermocouple solder ball and wires.
3.2. Single-Screen Thermocouple (SST)
The numerical simulation results are shown in Figure 7 and Figure 8. Compared with Figure 5 and Figure 6, it can be found that the flow field near the thermocouple wire and the solder ball changes greatly when a layer of screen is added outside the thermocouple. Due to the existence of a single screen outside the thermocouple, the flow velocity is significantly reduced after the air enters the thermocouple screen, and the pressure and the temperature in the screen increase, as shown in Figure 7a,b. At this time, the flow velocity at the entrance of the screen is about 70 m/s. It can also be seen that the temperature distribution of the thermocouple wire and solder ball is also more uniform (see Figure 8a,b). This is mainly due to the stagnation of flow in the screen. The temperature distribution on the surface of the solder ball is qualitatively consistent with that in the no-screen thermocouple (NST), that is, decreasing first and then increasing from upstream to downstream. However, the temperature difference on the surface of the solder ball is reduced, and the maximum temperature difference is about 1 K. Average the temperature of the solder ball surface to obtain that, . Introducing this result and the total temperature and static temperature of the incoming flow into Equations (1) and (2), the velocity error and restitution coefficient of the single-screen thermocouple can be obtained as 0.82 K and 96.63%, respectively.
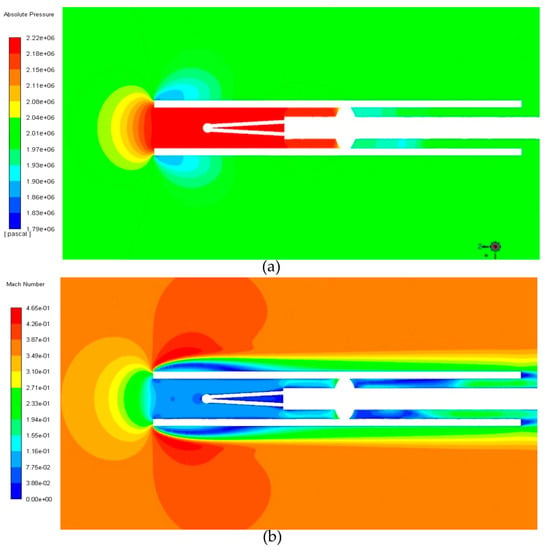
Figure 7.
Contour plots of (a) pressure and (b) velocity distributions for the single-screen thermocouple (SST).
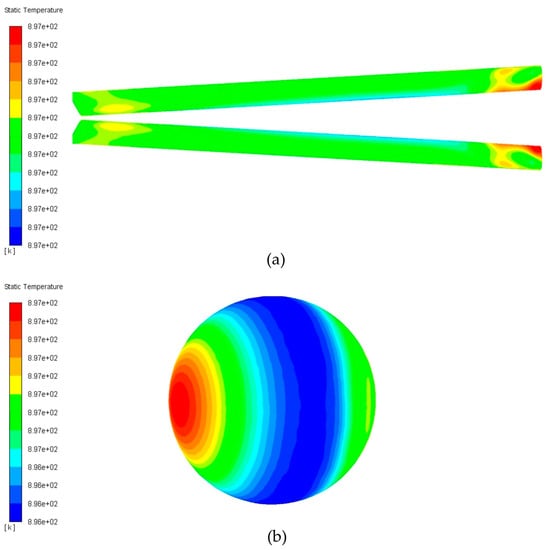
Figure 8.
The temperature distributions of the (a) thermocouple wire and (b) solder ball are given separately.
Compared with a no-screen thermocouple (NST), the temperature difference over the solder ball of a single-screen thermocouple (SST) becomes smaller, while the temperature peak at the front end does not decrease. This can be explained by the fact that the airflow near the solder ball is stagnated to a low velocity due to the presence of the screen. The velocity change caused by the low-speed airflow passing through the change of the cross section of the flow channel is smaller so that the temperature difference on the solder ball of a single-screen thermocouple (SST) is smaller. This can be obtained by comparing the velocity field distribution near a no-screen thermocouple (NST) and a single-screen thermocouple (SST), as shown in Figure 5c and Figure 7b. Another interesting thing is that the temperature distribution on the thermocouple wire in a single-screen thermocouple (SST) is almost negligible compared with that in a no-screen thermocouple (NST). This is consistent with the reason for the reduced temperature difference on the solder balls.
From the perspective of radiative heat transfer, the improved performance of the single-screen thermocouple (SST) (smaller and larger ) can also be considered as the presence of the screen reduces the radiative heat transfer of the thermocouple. The circumferential face of the computational domain is a constant temperature wall, which is 500 K and lower than the temperature of the thermocouple surface. In the no-screen thermocouple (NST), the thermocouple exchanges heat directly with the circumferential face of the computational domain by radiation, which will reduce the temperature of the thermocouple and affect its performance. However, the screen in the single-screen thermocouple (SST) interrupts this heat transfer channel, effectively improving the performance of the thermocouple.
3.3. Dual-Screen Thermocouple (DST)
Numerical simulation results for the dual-screen thermocouple (DST) are shown in Figure 9. The thermocouple has a stronger stagnation effect on the flow due to the presence of the double screen. Compared with the single-screen thermocouple (SST), the flow velocity in the inner screen of the dual-screen thermocouple (DST) is lower, only 12 m/s, as shown in Figure 9a,b. The use of double screens is equivalent to increasing the area of the screen in front of the thermocouple facing the incoming flow; that is, it has a greater impact on the flow field. The lower flow velocity in the inner screen also results in a more uniform temperature distribution on the dual-screen thermocouple (DST) wire and solder ball. The temperature distribution on the surface of the solder ball remains the same as that in the no-screen thermocouple (NST) and single-screen thermocouple (SST), as shown in Figure 9c. However, the maximum temperature difference on the surface of the solder ball has been reduced to 0.3 K, and the average surface temperature is . Therefore, we can conclude that the velocity error and restitution coefficient of the dual-screen thermocouple can be obtained as 0.18 K and 99.25%, respectively.
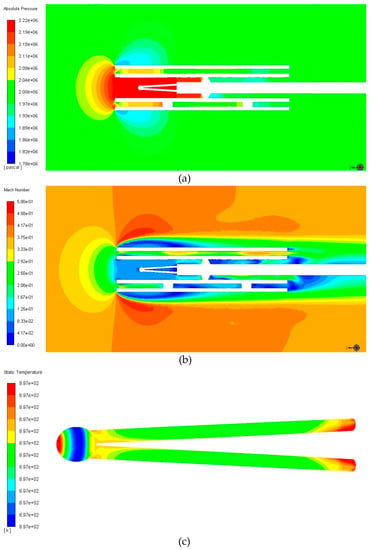
Figure 9.
Contour plots of (a) pressure and (b) velocity distributions for the dual-screen thermocouple (DST); (c) the temperature distributions of the thermocouple wire and solder ball.
Compared with a no-screen thermocouple (NST) and a single-screen thermocouple (SST), the temperature difference over the solder ball of a dual-screen thermocouple (DST) becomes smaller further, while the temperature peak at the front end does not decrease still. This can be attributed to the fact that the presence of the double screen has a stronger stagnation effect on the airflow than the single screen. Therefore, the airflow velocity inside the screen of the thermocouple is reduced even more, as shown in Figure 7b and Figure 8b. Since the temperature difference on the surface of the solder ball decreases while the temperature peak remains the same, the average temperature across the solder ball would increase. This can explain why the performance of a dual-screen thermocouple (DST) is better than that of a no-screen thermocouple (NST) and single-screen thermocouple (SST).
In addition, the existence of dual screens will further reduce the influence of radiation heat transfer. In a single-screen thermocouple (SST), the screen does reduce the radiative heat transfer between the thermocouple and the circumferential face of the computational domain. However, there is still radiative heat exchange between the screen and the cold outer surface, which would reduce the temperature of the screen. Further, the radiation heat exchange path formed between the screen and the thermocouple would reduce the temperature of the thermocouple. However, the outer screen in the dual-screen thermocouple (DST) would hinder the radiative heat transfer between the inner screen and the circumferential face of the computational domain. This will help the temperature of the thermocouple to be close to the total temperature of the flow and improve the performance of the thermocouple.
4. Discussion
4.1. Parametric Thermocouple Shape
Thermocouples with three configurations have been investigated using numerical simulation methods, and the velocity error and restitution coefficient , which was used to characterize the performance of the thermocouple, were obtained and summarized in Table 1. Compared with the other two structures (NST and SST), the velocity error of the dual-screen thermocouple (DST) is relatively small, and the restitution coefficient is closest to 100%. Therefore, it can be considered that the measurement error of DST on the total temperature of the flow field is less than 1%, which is enough to be used as a sensor for feedback in the aircraft engine vector thrust control loop. Therefore, this type of thermocouple as the best configuration will be selected, and a shape parameterization optimization method will be established with it. Before establishing the shape optimization method, the shape of a dual-screen thermocouple (DST) needs to be parametrically designed.

Table 1.
The velocity error and restitution coefficient r of three types of thermocouple, NST, SST, and DST.
The process of parametric design is mainly to obtain design results by modifying key structural parameters for specific purposes while keeping the topology of the design target unchanged [14]. In addition, the performance parameters of the design results can be directly obtained by the numerical simulation method [12,15], such as the velocity error and restitution coefficient of the thermocouple. A lot of repetitive work is ignored in the parametric design process, which makes it have high design efficiency. For the thermocouple, it has been obtained that the dual-screen thermocouple (DST) is the best-performing one of the three typical configurations according to the above simulation results. Therefore, the topology of the dual-screen thermocouple (DST) will be used as an example for parametric design. The framework of a parametric design and the parameter types and classification in the parametric design process of a dual-screen thermocouple (DST) are shown in Figure 10.
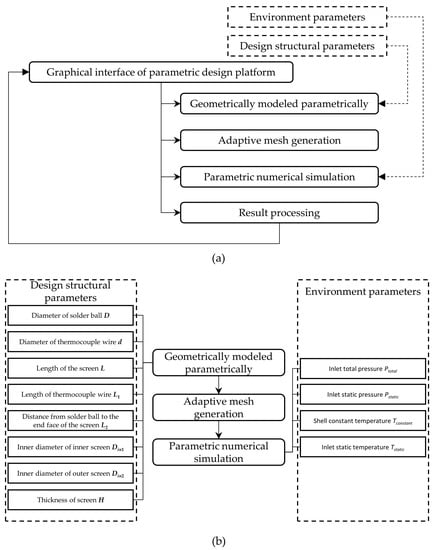
Figure 10.
(a) Process framework for parametric design; (b) parameter types and classification in the parametric design process of dual-screen thermocouple (DST).
A parametric design first needs to select independent variables for the selected structure of the design object, such as its radius (diameter) when designing a sphere. Based on previous studies, a dual-screen thermocouple (DST) has several relational structure parameters that affect its performance, that is, the diameter of the solder ball D, the diameter d and length L1 of the thermocouple wire, the distance from the solder ball to the end face of the screen L2, the length of the screen L, the inner diameter of the inner screen Din1, the inner diameter of the outer screen Din2, and the thickness of the screen H, a total of eight independent parameters, as shown in Figure 10b [5,6,7]. The dual-screen thermocouple (DST) will then be geometrically modeled parametrically based on the eight independent parameters chosen. Then, the adaptive mesh generation method will be used, such as the Mesh module in the Ansys Workbench 19.0 software package, and the current meshing technology is sufficient to complete the meshing of similar flow field structures. The dual-screen thermocouple (DST) flow field obtained by a parametric geometric design was meshed using an adaptive mesh generation method. Therefore, the mesh input for the numerical simulation was obtained. The numerical simulation work that needs to be carried out will also be carried out parametrically. The UDF (user-defined function) technology of the flow field simulation software Ansys Fluent 19.0 used in the previous section can perform parametric numerical simulation based on TUI (text user interface) [16]. For numerical simulation, since the flow field structure, that is, the calibration method for the thermocouple, remains unchanged, only the relevant boundary conditions need to be changed. It is therefore necessary to specify the parameters of those boundary conditions, denoted as environment parameters. Returning to the description of boundary conditions in Section 2, four environmental parameters are summarized and shown in Figure 10b, inlet total pressure , inlet static pressure , shell constant temperature , and inlet static temperature . These four environmental parameters would be set according to the environmental conditions in which the thermocouple would be used. Ultimately, the results from the parametric numerical simulation would be used to calculate the performance parameters that characterize the thermocouple, that is, the velocity error and restitution coefficient .
4.2. Shape Optimization Method and Results
By parametrically designing the shape of the dual-screen thermocouple (DST), it is obtained that its shape has eight independent variables, that is, the diameter of the solder ball D, the diameter d and length L1 of the thermocouple wire, the distance from the solder ball to the end face of the screen L2, the length of the screen L, the inner diameter of the inner screen Din1, the inner diameter of the outer screen Din2, and the thickness of the screen H. Since the thermocouples would be installed in multiple locations in an aeroengine, multiple thermocouples need to be designed and their shape optimized according to the flow conditions at their locations. The simultaneous optimization of eight shape parameters is difficult due to the high-dimensional problem. Therefore, one of the most critical parameters will be selected for shape optimization. The key to improving the accuracy of the thermocouple in measuring the total temperature of the flow field is to stagnate the flow field. The screen outside the thermocouple has this function, and it becomes more effective as the length of the screen L increases [1,3,4,5,6]. In addition, the radiative heat exchange between the environment and the solder ball of a thermocouple would also cause the total temperature measured by it to be low. Compared with NST and SST, the dual-screen thermocouple (DST) has higher accuracy also due to the above-mentioned radiation heat transfer process obstructed by the screen. Screens with different lengths L obstruct the radiation heat transfer process in different degrees due to the existence of the open end of the thermocouple. Therefore, the length of the screen L would be optimized in the present work.
The dichotomy method would be used to find the optimal length of the screen L, whose principle is shown in Figure 11. This method has the advantage of quickly finding the maximum or minimum value of the objective function in the case where the second-order derivative sign does not change in the solution space. The objective function values at the boundary of the solution space and at the center point of the solution space need to be obtained, that is, F(x1), F(x2), and F((x1 + x2)/2). If F(x2) > F(x1), then the maximum value of the objective function in the solution space is located at (x1 + x2)/2 < x < x2 for F′′(x) < 0 and vice versa. In this way, the solution space is halved to (x1 + x2)/2 < x < x2. Repeating the above process, the final solution space would be very close to the optimal solution of the objective function. This is also reflected in the fact that the objective function values corresponding to the boundaries on both sides of the final solution space are approximately equal.
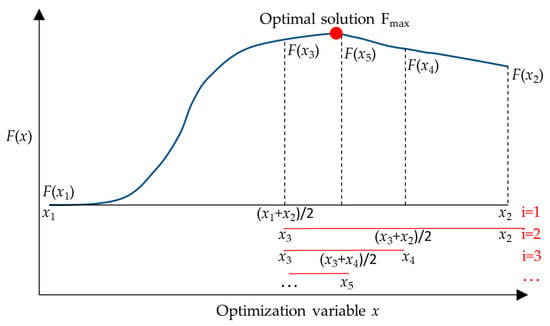
Figure 11.
Schematic of the dichotomous search method, where F(x) is the objective function.
For the shape optimization of a thermocouple, the objective function can be the thermocouple accuracy corresponding to the length of the screen L, that is, velocity error σV and restitution coefficient r. Since thermocouples with a larger restitution coefficient are more accurate, this parameter will be used as the objective function. The numerical method used in the present work is also consistent with the theoretical results, which indirectly proves the correctness of the numerical method. Therefore, the numerical simulation method used in the present work can be directly used to obtain the restitution coefficient. In addition, it is necessary to give the solution space for finding the optimal restitution coefficient r, that is, the maximum and minimum values of the length of the screen L. The minimum length of the screen L can be 0, which is equivalent to the case where the thermocouple does not have a screen. For the maximum length of the screen L, it depends on the space where it is installed. The presence of thermocouples cannot affect the normal operation of the aeroengine. Here, it is assumed to be 100 mm.
The iterative process of finding the optimal length of the screen L corresponding to the optimal restitution coefficient r in the solution space, that is, 0 mm < Lcenter < 100 mm, is shown in Table 2. It can be found that the length of the screen L corresponding to the optimal restitution coefficient r ranges from 56.25 to 62.5 mm. The difference between the restitution coefficients corresponding to the boundary of this range is less than 0.02%. In addition, it can also be found that with the increase in the length of the screen L, the corresponding restitution coefficient r of the thermocouple increases to the maximum value initially, and then decreases slowly. As L increases, the mechanism of the increase in r of the thermocouple can be summarized as that as the length of the screen increases, it would have a more effective stagnation effect on the flow field near the thermocouple and inhibit the radiation heat transfer between the thermocouple and the environment. However, it should also be noted that before the ambient flow reaches the solder ball of the thermocouple, the screen conducts heat from the internal high-temperature stagnant flow to the high-velocity and low-temperature ambient flow by heat conduction. The above phenomenon will intensify as the length of the screen L increases. This can explain that the restitution coefficient r of the thermocouple decreases with the increase in L when L is greater than 62.5 mm.

Table 2.
The iterative process to find the length of the screen L corresponding to the optimal restitution coefficient r.
5. Conclusions
The shape parametric optimization of thermocouples used in aeroengines was carried out in the present work. Based on the method of using the thermal calibration wind tunnel to calibrate the thermocouple in the experiment, a flow field simulation method is suggested to obtain the accuracy of the thermocouple through numerical calculation. Two parameters, that is, the velocity error σV and the restitution coefficient r, are used to represent the accuracy of the thermocouple. This numerical method is used to calibrate the accuracy of thermocouples, dual-screen thermocouple (DST), single-screen thermocouple (SST), and no-screen thermocouple (NST). Consistent with previous theories, the performance of a dual-screen thermocouple (DST) is best. Therefore, the dual-screen thermocouple (DST) is selected as the object to shape parametric optimization.
Aiming at the structural characteristics of the dual-screen thermocouple (DST), the parametric design work was carried out on it. Based on previous studies, a dual-screen thermocouple (DST) has several relational structure parameters that affect its performance, that is, the diameter of the solder ball D, the diameter d and length L1 of the thermocouple wire, the distance from the solder ball to the end face of the screen L2, the length of the screen L, the inner diameter of the inner screen Din1, the inner diameter of the outer screen Din2, and the thickness of the screen H, a total of eight independent parameters. Combining, geometrically modeled parametrically, adaptive mesh generation and parametric numerical simulation, the accuracy corresponding to the dual-screen thermocouple (DST) under certain parameter conditions can be obtained in a numerical method. After analysis, the length of the screen L is considered to be the most critical parameter for the performance of a dual-screen thermocouple (DST). The dichotomy method is used to find the optimal length of the screen L. It can be found that the length of the screen L corresponding to the optimal restitution coefficient r ranges from 56.25 to 62.5 mm. The difference between the restitution coefficients corresponding to the boundary of this range is less than 0.2%.
Author Contributions
Conceptualization, Y.W. and J.Z.; methodology, Y.W.; software, J.Z.; validation, Y.W.; formal analysis, Y.W.; investigation, J.Z.; writing—original draft preparation, R.Z.; writing—review and editing, R.Z. All authors have read and agreed to the published version of the manuscript.
Funding
This research was funded by a Civil Aircraft Special Research Reload Letter, grant number 2021-345.
Data Availability Statement
The data presented in this study are available in article.
Conflicts of Interest
The authors declare no conflict of interest.
References
- Mohtar, H.; Chesse, P.; Chalet, D. Describing Uncertainties Encountered during Laboratory Turbocharger Compressor Tests. Exp. Tech. 2012, 36, 53–61. [Google Scholar] [CrossRef]
- Gannon, A.J.; Hobson, G.V. Performance Testing of Transonic Rotors. Mech. Eng. 2010, 132, 52–53. [Google Scholar] [CrossRef]
- Copenhaver, W.W.; Okiishi, T.H. Rotating Stall Performance and Recoverability of a High-speed 10-stage Axial-flow Compressor. J. Propuls. Power 1993, 9, 281–292. [Google Scholar] [CrossRef]
- Zhang, R.C.; Bai, N.J.; Fan, W.J.; Yan, W.H.; Hao, F.; Yin, C.M. Flow Field and Combustion Characteristics of Integrated Combustion Mode Using Cavity with Low Flow Resistance for Gas Turbine Engines. Energy 2018, 165, 979–996. [Google Scholar] [CrossRef]
- Yang, Z.; Gu, Z.; Zhang, W.; Zeng, X. The Error Compensation Method of The Low-speed Wind Tunnel Flow Temperature Based on The Thermocouple. Chin. J. Sci. Instrum. 2022, 43, 68–76. [Google Scholar]
- Yapa, S.D.; D’Atri, J.L.; Schoech, J.M.; Elkins, C.J.; Eaton, J.K. Comparison of Magnetic Resonance Concentration Measurements in Water to Temperature Measurements in Compressible Air Flows. Exp. Fluid 2014, 55, 1834. [Google Scholar] [CrossRef]
- Yang, Z.; Zeng, X.; Zhang, W. Dynamic Characteristics of Thermocouples in Gaseous Medium. J. Aerosp. Power 2020, 47, 5–7. [Google Scholar]
- Vian, J.G.; Astrain, D.; Rodriguez, A.; Martine, A. Computational Optimization of a Thermoelectric Ice-Maker as a Function of the Geometric Parameters of a Peltier Module. J. Electron. Mater. 2010, 39, 1786–1791. [Google Scholar] [CrossRef]
- Zhao, B.; Jia, X.H.; Zhang, Y.; Feng, J.M.; Peng, X.Y. Investigation on Transient Temperature of a Reciprocating Compressor Based on a Two-thermocouple Probe. Int. J. Therm. Sci. 2017, 122, 313–325. [Google Scholar] [CrossRef]
- Viskanta, R. Overview of Convection and Radiationin High Temperture Gas Flows. Int. J. Eng. Sci. 1998, 36, 1677–1699. [Google Scholar] [CrossRef]
- Ojanen, M.; Hahtela, O.; Heinonen, M. Validation of a Blackbody Comparator-Based System for Thermocouple Calibration. Int. J. Thermophys. 2014, 35, 526–534. [Google Scholar] [CrossRef]
- Wang, Y.; Zhao, J. Preliminary Study on Virtual Wind Tunnel for Numerical Calibration of Airflow Temperature Sensor Based on CFD Technology. Meas. Technol. 2021, 41, 91–94. [Google Scholar]
- Wang, Y.; Dong, S.; Jing, Z.; Zhao, J. Analysis and Research on Pneumatic Structure Selection of Ball and Socket Type Total Pressure Probe. China Meas. Test. Technol. 2022, 48, 6–13. [Google Scholar]
- Todorov, G.; Kamberov, K.; Ivanov, T. Parametric Optimisation of Resistance Temperature Detector Design Using Validated Virtual Prototyping Approach. Case Stud. Therm. Eng. 2021, 28, 101302. [Google Scholar] [CrossRef]
- Ng, F.C.; Abas, A.; Ramli, M.R.; Sharif, M.F.M.; Ani, F.C. Numerical Modelling of the Delamination in Multi-layered Ceramic Capacitor During the Thermal Reflow Process. Solder. Surf. Mt. Technol. 2022, 3, 0017. [Google Scholar] [CrossRef]
- Jiang, H.; Costello, J.H.; Colin, S.P. Fluid Dynamics and Efficiency of Colonial Swimming Via Multijet Propulsion at Intermediate Reynolds Numbers. Phys. Rev. Fluids 2021, 6, 013103. [Google Scholar] [CrossRef]
Disclaimer/Publisher’s Note: The statements, opinions and data contained in all publications are solely those of the individual author(s) and contributor(s) and not of MDPI and/or the editor(s). MDPI and/or the editor(s) disclaim responsibility for any injury to people or property resulting from any ideas, methods, instructions or products referred to in the content. |
© 2023 by the authors. Licensee MDPI, Basel, Switzerland. This article is an open access article distributed under the terms and conditions of the Creative Commons Attribution (CC BY) license (https://creativecommons.org/licenses/by/4.0/).