Abstract
Shock wave boundary layer interactions are common to both supersonic and hypersonic inlet flows. Wall-resolved implicit large-eddy simulations of a canonical Mach 2.5 axisymmetric shock wave boundary layer interaction experiment at Glenn Research Center were carried out. A conical shock wave was generated with axisymmetric centerbodies with 16 deg half-angle cone. The centerbody radii were 9.2% and 14.7% of the test section diameter. The conical shock wave interacted with the turbulent boundary layer on the inside of the cylindrical test section. The experimental Reynolds number based on diameter was six million. For the simulations, the Reynolds number was reduced by a factor of 10 to lower the computational expense. The turbulent boundary layer separates for both centerbody radii and the separation is stronger for the larger centerbody radius. Frequency spectra of the spanwise-averaged wall-pressure coefficient reveal low-frequency content at Strouhal numbers based on separation length between 0.02 and 0.05 in the vicinity of the separation shock and mid-frequency content between 0.1 and 0.2 downstream of separation. A proper orthogonal decomposition captures spanwise coherent structures with a Strouhal number of 0.03–0.04 over the interaction region and streamwise coherent structures inside and downstream of the interaction with a Strouhal number of 0.1–0.4.
1. Introduction
Shock wave boundary layer interactions (SBLIs) are common to supersonic and hypersonic internal and external flows. The physical understanding of SBLIs is critical for the design and safe operation of high-speed vehicles. Understanding, predicting, and controlling SBLI is of particular importance for inlet flows. For example, turbulent SBLIs in scramjet inlets increase the total pressure losses and flow distortion and potentially lead to unstart. The low-frequency unsteadiness inherent to turbulent SBLI [1,2] has implications for the structure and combustion, and knowledge of the critical parameters that lead to its occurrence is desirable. Reynolds-averaged Navier–Stokes (RANS) calculations have been the workhorse for the prediction of SBLI flows for many years. Well-instrumented canonical SBLI experiments and validated large-eddy simulations (LES) can serve as a basis for the development of novel and more accurate RANS models and hybrid models that blend between RANS and LES depending on the physical grid resolution. Canonical flow experiments and simulations also provide valuable insight into the unsteady flow physics.
Oblique shock wave and compression ramp SBLIs have been studied for several decades [3,4] and are notorious for their complexity and undesirable characteristics [5]. Some recent SBLI reviews have been provided by Babinsky and Harvey [2] and Smits and Dussauge [6]. When a sufficiently strong shock wave impinges on a turbulent boundary layer, flow separation occurs. Different scaling relationships for the separation length were provided by Souverein [7]. The shock-induced separation region can be subject to large-scale, low-frequency unsteadiness [8,9]. The typically observed range for the low-frequency unsteadiness in both experiments and numerical simulations is [10], where the Strouhal number is based on the separation length and the freestream velocity, . A schematic outline of some of the important features of turbulent SBLIs is provided in Figure 1. Although different explanations for the low-frequency unsteadiness have been proposed, no consensus with regard to its origin has been reached.
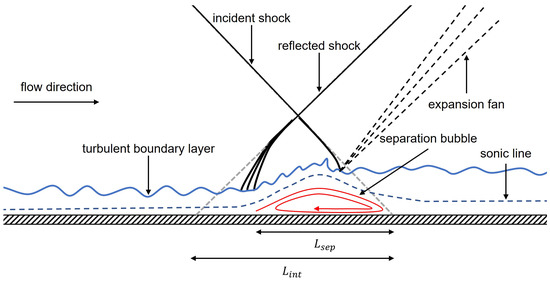
Figure 1.
Schematic of turbulent shock wave boundary layer interaction.
Some researchers have found evidence that the low-frequency unsteadiness originates from the upstream boundary layer [11,12,13]. An experiment performed by Beresh et al. [14] suggests a correlation between the velocity fluctuations in the upstream boundary layer and the separation shock foot motion. Ganapathisubramani et al. [15] performed wide-field particle image velocimetry (PIV) measurements of a Mach 2 compression ramp flow and found elongated regions of low- and high-velocity fluid with a streamwise extent larger than 8 in the upstream boundary layer, which correlated with the low-frequency unsteadiness. Vanstone and Clemens [16] performed a proper orthogonal decomposition (POD) for a swept-ramp SBLI and found that the boundary layer super-structures contribute to the mid-frequency (i.e., Strouhal numbers based on boundary layer thickness of ) unsteadiness of the separation line.
On the contrary, other research suggests that downstream mechanisms may be responsible for the low-frequency unsteadiness. Priebe and Martin [17] carried out direct numerical simulations (DNS) of a strong, fully separated, compression ramp interaction at Mach 2.9 and attributed a low-frequency shock motion to downstream mechanisms. Priebe et al. [18] performed a dynamic mode decomposition (DMD) of the DNS data and found streamwise-elongated low-frequency structures of low- and high-momentum fluid spanning the separation region. A statistical link between the low-frequency shock motion and the downstream flow was found experimentally by Dupont et al. [19]. Pirozzoli and Grasso [20] carried out DNS of an impinging SBLI at Mach 2.25 and suggested that the low-frequency unsteadiness originates from a self-sustaining acoustic resonance mechanism of the interaction region.
The effect of the incident shock strength on the low-frequency unsteadiness was investigated by, e.g., Souverein et al. [21], Agostini et al. [22], and Threadgill and Bruce [23]. Consensus begins to emerge that both upstream and downstream mechanisms play a role and that upstream mechanisms become more important for weaker interactions.
Unfortunately, inlet flows are often geometrically complex, which makes them challenging to simulate. Furthermore, geometrical complexity often counters efforts aimed at a detailed understanding of the underlying physical mechanisms. For that reason, most SBLI research thus far has focused on variations of canonical flow configurations such as blunt-fins [24,25], compression ramps and reflected shock interactions. The later two interactions are nominally two-dimensional (2D) and the blunt-fin interaction is three-dimensional (3D). Unfortunately, wind tunnel experiments of SBLIs are often tainted by sidewall effects leading to 3D flow features that frequently go unreported or are not well understood, especially for swept-interactions. For example, this problem is encountered in experiments of 2D SBLIs where the finite extent of the test section leads to corner effects [26,27]. In order to reduce or eliminate these corner effects, some SBLI work has considered further simplification to an axisymmetric canonical flow configuration.
To date, the majority of SBLI research has been concerned with planar or rectangular geometries. Despite their large range of practical applications, axisymmetric SBLI have yet to be studied as extensively as their planar/rectangular counterparts. More often than not, the flow physics of SBLIs for planar configurations are assumed to directly carry over to axisymmetric inlet flows, which typically feature multiple SBLIs. This is despite a dearth of data on axisymmetric configurations, which precludes investigations of the underlying flow physics for such configurations. Few researchers have directly considered axisymmetric SBLI (see, for example, Refs. [28,29,30,31]). Seebaugh and Childs et al. [28] were among the first to observe key differences between axisymmetric and planar SBLI. In particular, they found that the shock strength at which separation occurs is reduced for axisymmetric flows compared to their planar counterparts. More recently, Funderburk and Narayanaswamy [32] investigated an SBLI induced by an axisymmetric compression ramp and observed an increase in the separation size compared to an analogous planar configuration. Davis [30] and Sasson et al. [31] carried out measurements of an axisymmetric turbulent SBLI at Mach 2.5 with the purpose of providing validation data for CFD codes and turbulence model development. The experiments were performed in the axisymmetric supersonic circular wind tunnel (Axi-SWT) at the NASA Glenn Research Center (GRC). In the experiments, , and half-angle conical shock generators with cylindrical support were employed to generate conical shock waves and expansion fans that impinge on the turbulent boundary layer on the inside of a 17 cm diameter cylindrical test section. The radius of the cylindrical centerbody was either 1.57 cm (, based on test section diameter) or 2.5 cm (), where is the dimensionless radius of the shock generator. The Reynolds number based on test section diameter was .
Given the detrimental effects that SBLI can have on axisymmetric inlet flows, it is of great importance to extend the sparse existing database through new experiments and simulations and to investigate the unsteady flow physics which may differ from those of planar interactions. To the authors’ best knowledge, the unsteady flow physics of axisymmetric SBLI have not been investigated with modern modal decomposition techniques such as the POD or DMD. This is exactly where the present paper makes a contribution: Implicit large-eddy simulations (ILES) of the canonical Mach 2.5 turbulent axisymmetric SBLI experiment at GRC [30,31] were carried out and the 2D and 3D unsteady flow physics were investigated with Fourier transforms and POD. For similar interactions, Souverein et al. [21] investigated the effect of Reynolds number on the reverse flow intensity and found no dependence on Reynolds number. Similar observations were made by Morgan et al. [33] who performed LES for various Reynolds numbers and shock incidence angles. Therefore, to save computational resources, for the ILES the Reynolds number was lowered by factor ten compared to the experiment.
In the following, first the simulation strategy, computational grid, and boundary conditions are discussed. Then, results from precursor RANS calculations are compared to the experiment. The mean flow and turbulent statistics obtained from the ILES are discussed and the unsteady flow data are analyzed with Fourier transforms and POD [34]. Finally, a brief summary and conclusions are offered.
2. Methodology
The unsteady flow physics of two axisymmetric SBLI were investigated with Fourier transforms and POD. Time-resolved implicit large-eddy simulations (ILES) provided the flow data for the analysis. The boundary conditions for the ILES were obtained from precursor Reynolds-averaged Navier–Stokes (RANS) calculations of the NASA GRC experiment [30,31].
2.1. Governing Equations and Discretization
The precursor RANS calculations and the ILES were carried out with a compressible finite volume Navier–Stokes code by Gross and Fasel [35,36]. For the RANS calculations, both the Favre-averaged compressible Navier–Stokes equations and the k- turbulence model equations,
were solved. Here, k is the turbulence kinetic energy and is the specific dissipation rate. The model constants as well as the compressibility corrections can be found in Wilcox [37]. The k- model [38] was chosen for the precursor RANS calculations because it was demonstrated to predict shock-separated flows, ranging from transonic all the way up to hypersonic speeds, with adequate accuracy [37]. The eddy viscosity was computed as
The Boussinesq approximation was invoked for computing the Reynolds stresses. For ILES, no explicit LES subgrid stress model is employed. Instead, the numerical diffusion of the discretization removes energy at wavenumbers close to the grid wavenumber. The accuracy of the discretization determines the size of the smallest resolved scales. The viscosity was obtained from Sutherland’s law and the heat conduction coefficient was obtained from . The convective and viscous terms of the Navier–Stokes equations were discretized with ninth-order and fourth-order accuracy. The convective fluxes were computed with the Lax-Friedrichs method and interpolated onto the cell faces with a weighted essentially nonoscillatory (WENO) scheme [39]. A second-order-accurate discretization analogous to the symmetric total variation diminishing scheme by Yee [40] was employed for computing the convective fluxes of the RANS equations. The viscous terms of the RANS equations were discretized with second-order accuracy. The highly dissipative first-order-accurate Euler backward scheme was chosen for time integration of the RANS calculations, since steady state solutions were sought. For the ILES, the second-order-accurate trapezoidal rule was employed for time integration.
2.2. Non-Dimensionalization
Velocities and density were made dimensionless with the inflow freestream values, and , where the asterisks indicate dimensional quantities. Length scales were made dimensionless by the inner diameter of the test section, = 17 cm, and time was normalized by . The eddy-viscosity was made dimensionless by the freestream dynamic viscosity, . The turbulence kinetic energy was made dimensionless by and the dissipation rate was made dimensionless by . The laminar and turbulent Prandtl numbers were and and the freestream Mach number was 2.5. The experimental Reynolds number was . A ten times smaller Reynolds number of was chosen for the ILES. The dimensionless computational time-step for the precursor RANS calculations was . The time-step for the ILES was . This time-step corresponds to (in dimensional form), (in wall units based on approach boundary layer), and (based on boundary layer thickness). The time-step in wall units downstream of the interaction was for and for .
2.3. Computational Grids
An outline of the convergent-divergent nozzle and test section with 1.57 cm radius shock generator [30,31] is provided in Figure 2. Shown also are color contours of the Mach number obtained from the precursor RANS calculation. The computational domain for the RANS calculation starts at the end of the nozzle and includes the shock generator. The black outline indicates the streamwise and radial extent of the computational domain for the ILES.
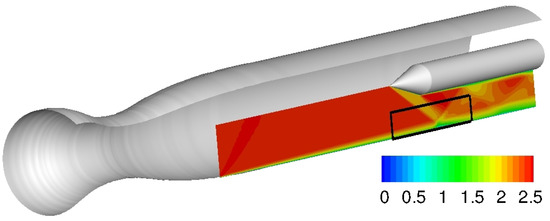
Figure 2.
Outline of convergent-divergent nozzle and test section with shock generator. Furthermore, included are Mach iso-contours from the precursor RANS calculation. The black outline indicates the computational domain for the ILES.
The 2D computational grids for the two axisymmetric precursor RANS calculations are shown in Figure 3. The red box in the figures outlines the computational domain for the ILES. The -coordinate for the RANS calculations was chosen such that corresponds to the centerline. The number of cells in the streamwise and wall-normal directions was 162 and 200 for and 190 and 200 for . Grid lines were clustered near the walls and the near-wall grid line spacing in wall units was one or lower.
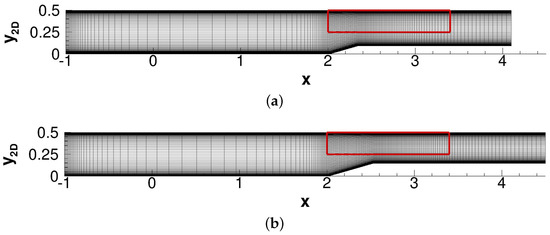
Figure 3.
Computational grids for axisymmetric RANS calculations with centerbody radius of (a) and (b) . For clarity, only every other grid line is shown in the y−direction. The red boxes outline the ILES domain.
Wall-resolved ILES require that the smallest flow structures near the wall are resolved. Computational grids with significantly increased streamwise grid resolution compared to the RANS grids were generated (Figure 4) for a sub-domain of the RANS domain with streamwise and wall-normal extent of and that includes only the primary SBLI. The approach chosen here, which focuses the computational resources on a single SBLI, is frequently employed by the scientific community for detailed investigations of the underlying flow physics (e.g., see Refs. [17,22,41]). The 2D grids were extruded in the azimuthal direction (Figure 5) using the relationships,
where is the azimuth angle. For the ILES grid, the line defined by and is located on the test section wall. The domain extent in the azimuthal (i.e., spanwise) direction was set to , such that the domain width arc length,
was greater than at least two boundary layer thicknesses, consistent with the minimum domain width found by Poggie et al. [42]. For narrower domains, azimuthal wavenumbers are suppressed and the turbulence dynamics are altered. SBLI can exhibit spanwise deformations of the separation line (e.g., Ref. [43]). Such deformations are also suppressed if the spanwise domain extent is too small. A side view and a front view of one of the ILES grids for a centerbody radius of and cone half-angle of is shown in Figure 4 and Figure 5. The near-wall grid resolution in wall units, , for the baseline grid was based on earlier ILES of an SBLI by Lee and Gross [44]. In addition to the baseline grid, three additional computational grids with approximately 1.5 times improved grid resolution in all three dimensions were generated for the larger centerbody case to investigate grid convergence of the solution. The domain extent, , number of cells, , and near-wall resolution (upstream of the interaction) for the different cases are compared in Table 1. The minimum and maximum spatial wavenumbers in the streamwise and azimuthal direction for the baseline grids are and , and (small centerbody), and and (large centerbody).

Figure 4.
Side view of computational grid for ILES with centerbody radius. For clarity, every other grid line is omitted in the wall-normal direction and every seventh grid line is shown in the streamwise direction.
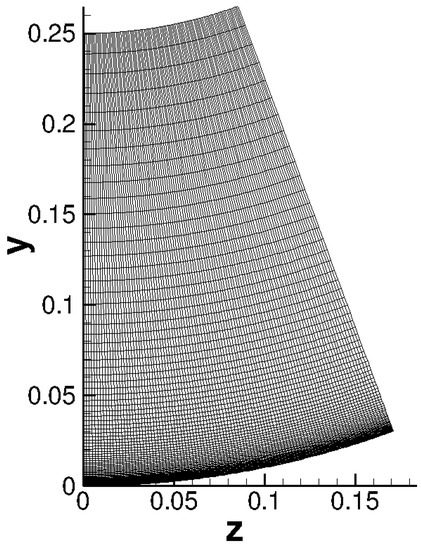
Figure 5.
Cross-sectional view of computational grid for ILES with centerbody radius. For clarity, every other grid line is omitted in the wall-normal and spanwise direction.

Table 1.
Computational grid parameters. Inner-scale variables calculated at .
Grid convergence of the ILES was investigated for the case (which has the larger separation) by comparing the results obtained with the baseline grid and the grids with refinement in the x, y, and z directions. Van Driest-transformed velocity profiles at and and skin-friction distributions are provided in Figure 6, where is the shock impingement location. For all three refined meshes, no significant change in the solution is observed compared to the baseline grid. To cut down on the computational expense, all following results are for the baseline grid.
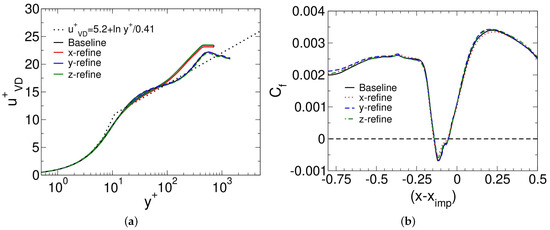
Figure 6.
(a) Van Driest-transformed velocity profiles at (solid lines) and (dashed lines) and (b) skin-friction coefficient.
The turbulence statistics were obtained in two steps. First, time averages were computed and averaged in the azimuthal direction. The turbulence statistics were then computed with respect to these averages. The time intervals over which the temporal averages and turbulence statistics were computed are provided in Table 2. Multiplication with 267 provides the time intervals in wall units. For example, the time interval corresponds to .

Table 2.
Time intervals for ILES of axisymmetric interactions.
2.4. Boundary Conditions
Dirichlet boundary conditions were enforced at the inflow and Neumann boundary conditions were invoked at the outflow boundary. The inflow freestream conditions were matched to the experiment at the NASA GRC facility [30,31]. For the RANS calculations, a laminar inflow was assumed and the inflow turbulence intensity and eddy viscosity ratio were set to and . All walls were considered to be adiabatic. For the axisymmetric ILES, flow periodicity was enforced in the circumferential direction.
For the ILES, the RANS solution was prescribed at the inflow and freestream boundary. The inflow momentum thickness Reynolds number was . The isotropic divergence free (for incompressible flow) synthetic eddy model (SEM) by Poletto [45] was employed to “seed” turbulent velocity fluctuations inside the boundary layer at the inflow boundary. Details on the implementation of the SEM can be found in Lee et al. [46]. The required profiles of the streamwise velocity, turbulence kinetic energy, and dissipation rate were obtained directly from the RANS solutions. The SEM provides velocity fluctuations. The temperature fluctuations were obtained from the strong Reynolds analogy,
with . Here, the overbar indicates mean values and the prime indicates fluctuations.
2.5. Proper Orthogonal Decomposition and Fourier Transforms
The proper orthogonal decomposition (POD) [34] was employed to extract the coherent flow structures (eigenfunctions, ), their energy content (eigenvalues, ), and dynamics (time coefficients, ). For the present POD analysis, the “snapshot” method by Sirovich [47] was employed, which is computationally more efficient than the original method. Mustafa et al. [48] employed POD to investigate data obtained from a compression corner SBLI experiment. They evaluated both an incompressible and a compressible POD kernel and found little to no difference in both the spectrum and structure of the POD modes. Similarly, Castillo et al. [49] employed both kernels to analyze a supersonic turbulent boundary layer and found little difference. Therefore, for the present POD analysis the POD kernel was based on twice the kinetic energy. The POD then provides an energy-optimal decomposition that captures the largest amount of kinetic energy with the least number of modes. The unsteady flow field can be reconstructed from the POD modes, , and time coefficients, , via,
The POD expresses traveling waves by mode pairs with similar eigenvalue magnitudes and a phase shift of for both the eigenfunctions and time coefficients.
3. Results
In the following, results for the two different centerbody radii, and , are discussed. The expansion fan originating from the rear end of the shock generator interacts with the shockwave before it impacts the turbulent boundary layer. This effect is more pronounced for the smaller center body radius. By comparing the results for the two center body radii, the effect of the shock strength on the boundary layer separation and unsteady flow physics is revealed.
3.1. Turbulent Approach Boundary Layer
The upstream boundary layer properties of the experiment [30,31] and the precursor RANS calculations (which provided the inflow and initial conditions for the ILES) are provided in Table 3. By varying the streamwise extent of the approach boundary layer in the precursor RANS calculations, the measured boundary layer thickness and shape factor at were matched approximately. For the chosen x-coordinate, the shock impingement location is at . Therefore, corresponds to .

Table 3.
Turbulent boundary layer properties at .
The boundary layer properties shortly upstream of the interaction at , obtained from both experiment and ILES, are in reasonable agreement (see Table 4). The difference between the boundary layer properties for the experiment and ILES is due to the fact that the RANS calculations were matched to the experiment further upstream.

Table 4.
Turbulent boundary layer properties at .
Because of the displacement effect of the boundary layer on the cylindrical test section wall, the freestream Mach number drops slightly ahead of the shock generator to about (see Figure 2). The conical shock generator in the experiment had a half-angle of . To obtain the before and after-shock conditions, the Taylor-Macoll Equation [50] for conical shock waves was solved numerically. In Table 5, “1” indicates the before-shock conditions and “2” indicates the after-shock conditions (right at the shock wave for the analytical solution). Furthermore, included in the same table are the before and after-shock conditions extracted from the mean ILES data slightly upstream and downstream of the shock wave. Compared to the analytical solution, the flow turning is a little larger and the after-shock temperature is minimally higher.

Table 5.
Before (1) and after (2) shock conditions for shock generator angle. Simulation data were extracted at and .
A direct comparison of the wall-pressure coefficient, , from the ILES and precursor RANS calculations with measurements for the 10 times larger Reynolds number of the experiment [30,31] is provided in Figure 7. The wall-pressure coefficient is defined as,
where p is the local dimensionless wall pressure. The maximum wall-pressure coefficient in the interaction region is in good agreement with the experiment. Compared to the experiment, the flow separates earlier in the simulations. This can be attributed to the reduced Reynolds number, which makes the boundary layer less resistant to separation [7]. The expansion fan emanating from the rear end of the conical shock generator causes a pressure recovery which is delayed for the larger shock generator. Very similar pressure coefficient recoveries are observed for the experiments and simulations.
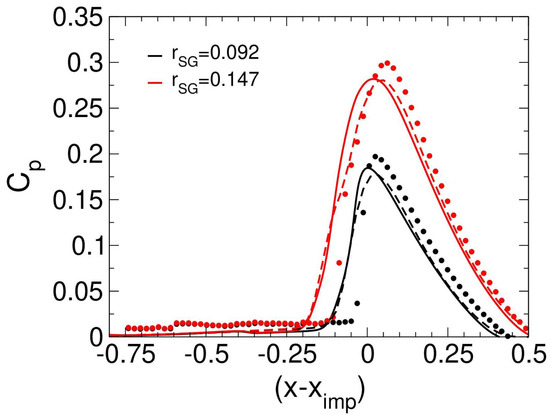
Figure 7.
Wall-pressure distributions obtained from temporal and azimuthal averages. Solid lines are for ILES, dashed lines are for precursor RANS calculations, and dotted lines are measurements by Davis et al. [30] for .
The inflow boundary layer thickness was . The inflow boundary for the ILES was placed more than 10 upstream of the shock impingement location. Agostini et al. [22] and Sun and Gross [44] employed the SEM for SBLI simulations and found that a development length of ≈10 was sufficient for the turbulent approach boundary layer to reach equilibrium.
Van Driest-transformed velocity profiles,
with and Reynolds stress profiles extracted from the ILES at (approximately 8 downstream of the inflow) are provided in Figure 8. The velocity profiles are plotted versus the wall-normal coordinate in wall units,
where is the friction velocity and the subscript “w” indicates wall conditions. The Reynolds stress profiles are plotted versus the wall-normal distance normalized by the boundary layer thickness. Furthermore, included are DNS results by Pirozzoli and Bernardini [51] for Mach 2.28 and and DNS results by Guarini et al. [52] for Mach 2.5 and . The van Driest-transformed velocity profiles (Figure 8a) are in good agreement with the DNS references and the relationships for the viscous sublayer, , and the log-layer, . The profiles have a pronounced defect layer, which can be attributed to the low-Reynolds number of the simulations [53]. The large defect layer also explains the relatively high incompressible shape factor of 1.4 (Table 4). Near the wall, the Reynolds stresses are in excellent agreement with the reference data (Figure 8b). At the boundary layer edge, the present results are in closer agreement with the reference data by Guarini et al. [52].
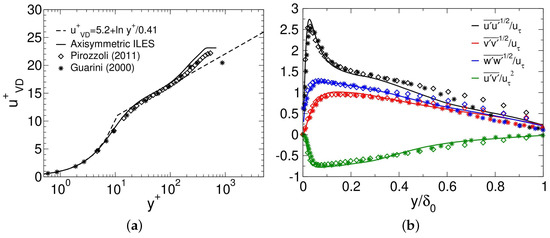
Figure 8.
(a) Van Driest-transformed velocity profiles and (b) Reynolds stress profiles at . For (b) solid lines are for the present ILES, diamond symbols (⋄) are for Pirozzoli et al. [51] and star symbols (*) are for Guarini et al. [52].
To further assess the efficacy of the SEM for generating turbulent boundary layers, in Figure 9 turbulence kinetic energy (TKE) and longitudinal one-dimensional spectra are shown for and wall-normal distances of , and . The spectra are plotted versus the wavenumber, . The spectra display a mild decrease in energy between the location closest to the wall () and the outermost location (), indicating the presence of near-wall turbulent structures. All spectra exhibit the correct power-law behavior of for the inertial subrange (dashed lines in Figure 9). No distinct frequency peaks are visible. This is an advantage of the SEM, which is based on random numbers, over rescaling and recycling methods which by nature introduce dominant frequencies related to the length of the recycling region. Included in Figure 9a are the grid wavenumber, , with grid line spacing , and the wavenumber associated with the Kolmogorov length scale, with . In agreement with the ILES philosophy, the TKE-spectrum drops off near the grid wavenumber without an accumulation of energy. The part of the spectrum between the grid wavenumber and Kolmogorov wavenumber is modeled.
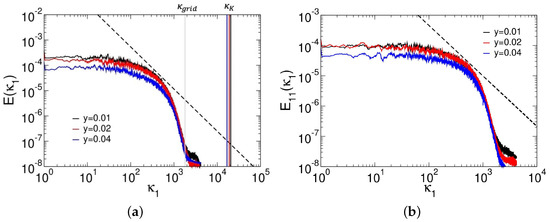
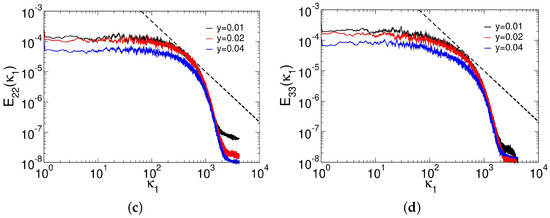
Figure 9.
Spectra of (a) TKE, (b) , (c) and (d) for .
In Figure 10, the skin-friction coefficient is plotted versus the momentum thickness Reynolds number. A semi-empirical relationship for the skin-friction coefficient [54] is included for comparison. Around , the boundary layer reaches equilibrium and begins to track the reference. The bump near results from a weak oblique shock wave. As the boundary layer approaches separation, the skin-friction coefficient begins to drop.
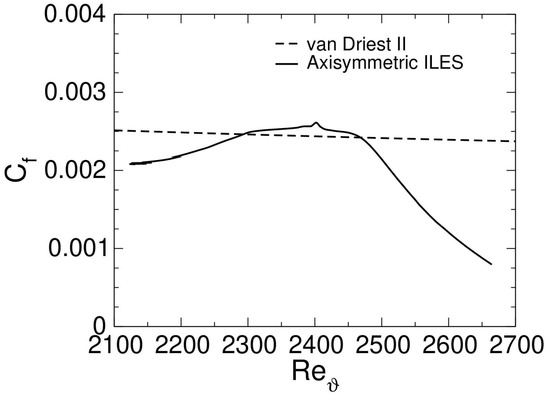
Figure 10.
Skin-friction coefficient versus momentum thickness Reynolds number.
In Figure 11, the maxima (across y) of the Reynolds stresses and turbulent kinetic energy for both centerbodies are plotted against the streamwise coordinate. Both approach boundary layers reach equilibrium around . The turbulence kinetic energy and Reynolds stresses increase significantly throughout the interaction. Downstream of the interaction, the reattached turbulent boundary layers slowly relax towards equilibrium.
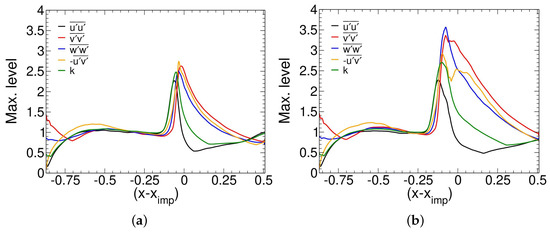
Figure 11.
Maximum Reynolds stresses and turbulence kinetic energy for (a) and (b) . Values are normalized by their corresponding upstream value at .
3.2. Instantaneous Flow Fields
In Figure 12, instantaneous iso-surfaces of the magnitude of the density gradient, , colored by the streamwise velocity are shown for both centerbody radii. In this and all following figures, the flow direction is left to right (the flow direction is indicated by an arrow). The iso-surfaces reveal strong density gradients inside the supersonic boundary layer and across the impinging and reflected shock waves.
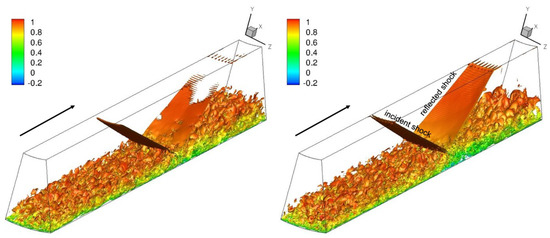
Figure 12.
Instantaneous iso-surfaces of colored by streamwise velocity for (left) and (right).
Numerical schlieren images (magnitude of density gradient) for both cases are plotted side-by-side in Figure 13. Different from experimental schlieren images, which are cumulative across the span, the density gradient magnitude was plotted for a single spanwise plane. The figures were annotated to show the instantaneous turbulent boundary layer thickness, mean sonic line, and mean separation bubble. For the larger centerbody, the reflected shock wave is stronger and the density gradients associated with the boundary layer downstream of the interaction are larger. The incident and reflected shock wave for the smaller centerbody in Figure 13 (top) appear to intersect very close to the bottom wall, indicating that the flow may not be separated at this time instance.
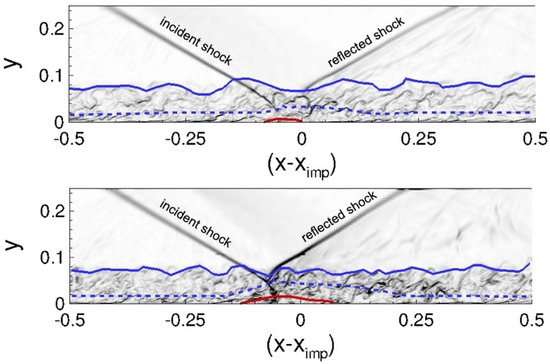
Figure 13.
Instantaneous numerical schlieren images for (top) and (bottom) taken in the plane. Instantaneous turbulent boundary layer thickness (solid blue line), mean sonic line (dashed blue line), and mean separation bubble (solid red line).
3.3. Mean Flow Analysis
The skin-friction and wall-pressure coefficient computed from the azimuthal and temporal averages are shown in Figure 14. The star symbols represent time averages computed over the first half of the total sampling time. For both cases, the averages computed over the entire and half of the sampling time are identical, proving that the averages are converged. For the larger centerbody, the flow separates sooner and reattaches slightly earlier and the pressure change across the interaction is larger than for the smaller centerbody (Figure 14a). The separation length is defined as the x-interval over which the skin-friction is negative. The approximate separation lengths are for and for . Closer scrutiny of both coefficients upstream of separation (Figure 14b) reveals a weak adverse pressure gradient at that goes hand-in-hand with a small skin-friction increase. This phenomenon is explained by a slight mismatch between the freestream boundary condition (obtained from the 2D RANS solution) and the one-dimensional SEM inflow profile (no wall normal velocity). As a result of the mismatch, a weak pressure wave is formed which impacts the lower wall near (Figure 15b). Compared to the pressure variation across the interaction (Figure 15a), the pressure gradient associated with the wave is marginal (Figure 15b). Given the small magnitude of the effect and the sufficient distance from the interaction (also see Figure 10), this phenomenon is of no consequence for the present investigations.
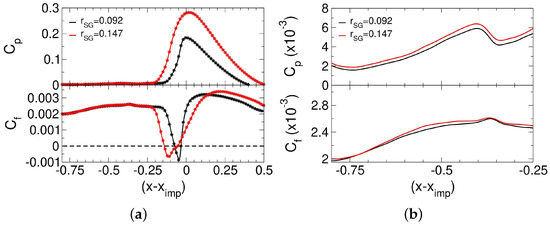
Figure 14.
Wall-pressure and skin-friction coefficient distributions. For (a): Star symbols (*) represent time averages computed over the first half of sampling time. (b): Coefficients upstream of separation.
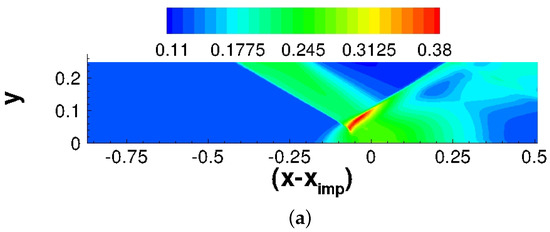
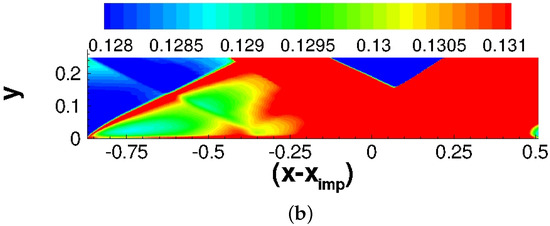
Figure 15.
Pressure iso-contours for . (a) Full range and (b) subset of pressure contours.
Numerical schlieren images obtained from the temporal and azimuthal averages are presented in Figure 16. Furthermore, included are the box locations for the later POD analysis in Section 3.4. For the larger centerbody, the reflected shock wave is stronger and the density gradients associated with the boundary layer downstream of the interaction are larger. The rarefaction fan originating from the rear end of the conical shock generator is visible as a slightly gray region above the interaction. The inviscid shock impingement location is at approximately for both and .
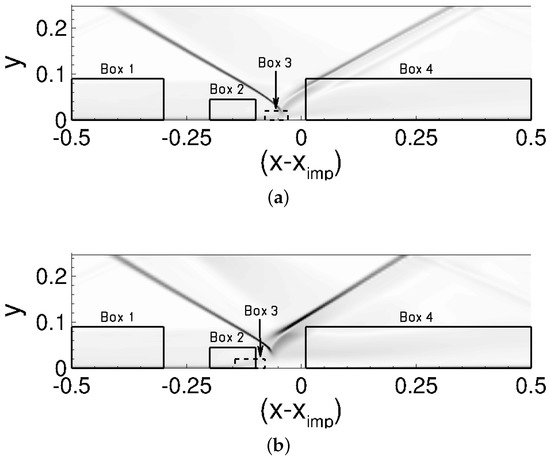
Figure 16.
Numerical schlieren images (temporal and azimuthal averages) for (a) and (b) . Boxes indicate sub-domains for POD analyses.
Iso-contours of the streamwise velocity, Reynolds stresses, and turbulence kinetic energy, k, obtained from the temporal and azimuthal averages of the data are displayed in Figure 17. For the smaller centerbody, the conical shock wave is significantly weakened by the expansion fan emanating from the rear end of the shock generator, resulting in a higher streamwise velocity downstream of the impinging shock wave. For the larger centerbody, the interaction region is not only significantly longer, but also noticeably taller than for the smaller centerbody.
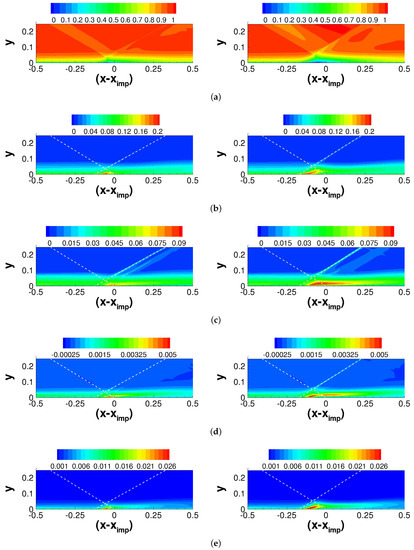
Figure 17.
Iso-contours of (a) u, (b) , (c) , (d) and (e) k (temporal and azimuthal averages) for (left) and (right). The dashed white lines indicate the impinging and reflected shock waves.
The larger streamwise Reynolds normal stress for suggests a stronger “back and forth” motion of the separation shock for the larger centerbody as seen in Figure 17b. The radial Reynolds normal stress (Figure 17c) is indicative of the “flapping” motion of the separation bubble and stronger for the larger centerbody. Finally, the Reynolds shear stress (Figure 17d), which can be associated with the shedding of large coherent structures (near the reflected shock foot and downstream of reattachment), is significantly higher for the larger centerbody. For both cases, the turbulence kinetic energy increases noticeably inside the interaction (Figure 17e). This increase is much more pronounced for the larger centerbody.
In Figure 18, mean flow streamlines are plotted together with the locations of the maxima (in y for each x) of the Reynolds stresses and turbulence kinetic energy. The mean reverse flow regions (i.e., separation bubbles) are highlighted in blue. A larger reverse flow region is obtained for the larger cone centerbody. Upstream of the interaction, the Reynolds stress maxima contours are approximately parallel to the streamlines suggesting that the turbulence is in equilibrium. Upon encountering the reflected shock foot, the maxima of the Reynolds stresses move closer to the wall and form a crest directly above the mean separation region. The crest scales with the separation length and interaction strength, as seen when comparing the crest sizes of the smaller and larger centerbodies. The detached free shear layer develops as the peaks begin to move away from the wall. This trend is more pronounced for the larger centerbody. Downstream of the impinging shock foot, the streamlines converge towards the wall while the locations of the maxima of the Reynolds stresses keep moving away from the wall. A similar behavior was observed by Sandham [55] and Fang [56].
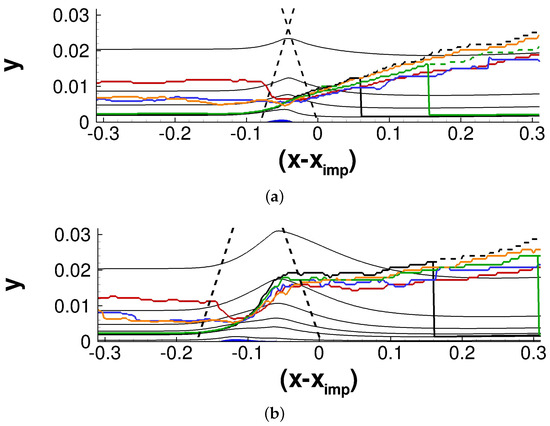
Figure 18.
Mean streamlines (thin black lines) and locations of maxima of Reynolds stresses obtained from temporal and azimuthal averages for (a) and (b) . The maxima locations for , , , and k are marked by the thick black, red, blue, orange and green lines, respectively. The dashed lines track the local maxima in the outer portion of the boundary layer.
Distributions of the maxima (in y) of the Reynolds stresses and turbulent kinetic energy were provided in Figure 11. For both cases, the Reynolds stresses and turbulence kinetic energy exhibit strong maxima in the interaction region. For the smaller centerbody, the Reynolds shear stress decreases monotonically from its maximum. For the larger centerbody, the Reynolds shear stress first decreases and then increases again inside the interaction, which suggests the shedding of spanwise coherent structures. The locations of the maxima of the Reynolds stresses and turbulence kinetic energy and their values and locations, , for both cone centerbodies are provided in Table 6. Consistent with the greater extent of the separated region for the larger centerbody, the maxima are located further upstream and the maxima are stronger. The maximum turbulence kinetic energy in the interaction region is (for ) and (for ) times above the maximum turbulence kinetic energy for the approach boundary layer. For comparison, the turbulent kinetic energy was 2.7 times above its upstream value in the simulation by Pirozzoli and Grasso [20].

Table 6.
Magnitude and location of maxima of Reynolds stresses and turbulence kinetic energy.
3.4. Unsteady Flow Analysis
3.4.1. Fourier-Transforms of Wall-Pressure Coefficient
To analyze the unsteady flow behavior, the instantaneous wall-pressure coefficient, , was recorded every 10 time-steps, () over a time-interval of ( 9190) and 48 (10,892) for the small and large centerbody, respectively. The wall-pressure coefficient data were Fourier-transformed in both the azimuthal direction and time. The corresponding maximum and minimum frequency are and (small centerbody) and 0.021 (large centerbody), respectively. The data were split up into five series starting at the first, second, third, fourth and fifth snapshot. For each series, a skip of five snapshots was used. The resulting five series were Fourier-transformed in time and averaged. This procedure improved the quality of the spectra, but lowered the maximum resolved frequency to . The Strouhal number,
is based on the separation length, , ( for and for ) and approach flow velocity, . Assuming a Strouhal number of for the low-frequency unsteadiness, approximately 27 periods (200 snapshots per period) were captured for the small centerbody and 15 periods (427 snapshots per period) were captured for the large centerbody. For comparison, Priebe et al. [18] analyzed between 7 and 17 periods of the low-frequency unsteadiness with DMD and Wu and Martin [57] captured two to three periods of the low-frequency unsteadiness in their LES.
Here, only the spectra of the azimuthal mode zero (the azimuthal average) are discussed. The space-time diagrams of the wall-pressure coefficient in Figure 19 reveal a stronger pressure increase for the large centerbody. For both cases, inclined streaks downstream of mean reattachment indicate the shedding of flow structures with azimuthal coherence (Figure 19a). The shedding is considerably stronger for the large centerbody, which is consistent with the Reynolds shear stress distributions (Figure 11).
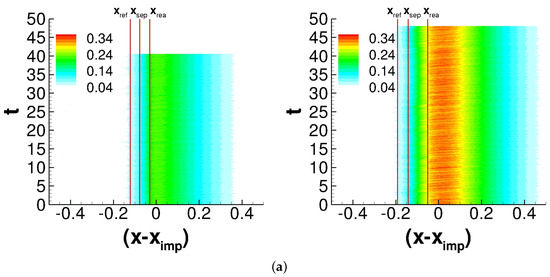
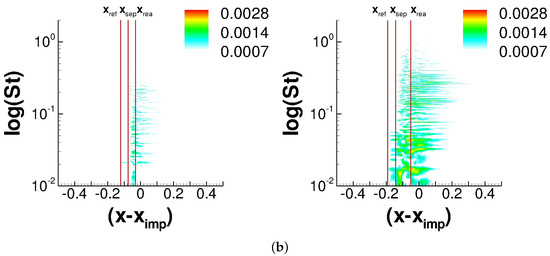
Figure 19.
Wall-pressure coefficient (azimuthal averages): (a) Time histories and (b) spectra for (left) and (right). The average reflected shock foot, separation and reattachment locations are indicated by , and , respectively.
The wall-pressure coefficient spectra (Figure 19) for both cases have peaks in the low-frequency band () at separation, . However, the amplitude of the low-frequency unsteadiness is higher for the larger centerbody. Similarly, Morgan et al. [33] found that the intensity of the low-frequency unsteadiness scales with the interaction strength. For the case, a notable peak in the spectrum is seen at (low-frequency unsteadiness) and . For the case, multiple low-frequency peaks can be observed near in the frequency range . Both spectra also have a broad frequency content between and downstream of reattachment, which can be associated with the shedding of azimuthal coherent structures. For , the amplitudes of the higher frequencies initially increase downstream of reattachment and display pronounced peaks at , , and .
To further asses the amount of time the flow is separated, the probability density function of separated flow (azimuthal average) is provided in Figure 20. Compared to the small centerbody, for the large centerbody the flow is more separated and the reattachment is more intermittent.
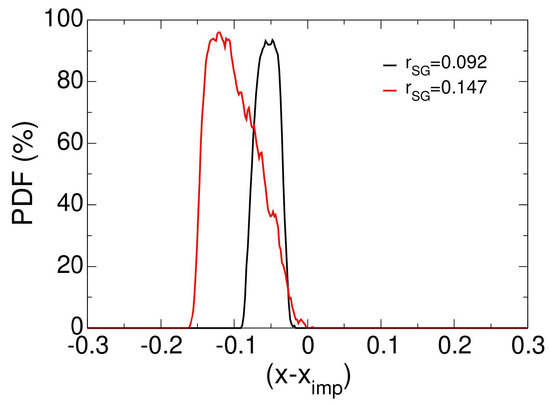
Figure 20.
Probability density function of separated flow.
3.4.2. Proper Orthogonal Decomposition of Azimuthal Average of Data
The unsteady flow data were also analyzed with the POD. Snapshots were recorded every 50 time-steps, () over time intervals of 40.5 (small centerbody, 40 snapshots per period of low-frequency unsteadiness) and 48 (large centerbody, 85 snapshots per period of low-frequency unsteadiness). Four different sub-domains were analyzed (see Figure 16). Box 1 was placed in the upstream boundary layer, box 2 was placed near the approximate reflected shock foot location to investigate the separation shock foot dynamics, box 3 captures the separated flow region and box 4 was placed slightly downstream of the interaction to investigate the shedding of coherent structures.
Both a 2D and a 3D POD were carried out. For the 2D analysis, the azimuthal averages of the data were analyzed and the focus was on the shedding of azimuthal coherent flow structures. For the 3D analysis, the full 3D data were analyzed and the focus was on longitudinal coherent flow structures. First, the results from the 2D POD analysis are discussed. For similar SBLIs, modal analyses (such as DMD) have been successfully applied to spanwise-averaged snapshots (see for example, Pasquariello et al. [58], Grilli et al. [59] and Nichols [60]). The azimuthal averaging removes the turbulent small-scale motion and thus provides more prominent mode shapes.
The 2D POD eigenvalues for the first 1000 modes are presented in Figure 21. At the upstream location (box 1), the drop-off in eigenvalue magnitude towards the higher mode numbers is very gradual, indicating that the boundary layer is fully turbulent and void of dominant coherent flow structures. For boxes 2–4, the eigenvalue magnitudes for are noticeably larger than for , which suggests that the flow is more unsteady. The drop-off in the eigenvalue magnitude for boxes 2–4 is less gradual than for box 1, suggesting that coherent flow structures are present. The eigenvalues for box 4 are noticeably larger as a result of vortex shedding.
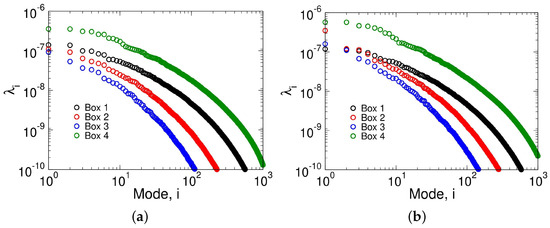
Figure 21.
POD eigenvalues for (a) and (b) .
The POD eigenvalues and cumulative energy,
which were computed excluding mode 0 (the time-average) are compared in Figure 22 for boxes 2 (reflected shock location) and 3 (separation bubble). For box 2 (and both centerbody radii), mode 1 accounts for ≈11–21% of the total energy () while the first 11–14 modes capture approximately of . For box 3, mode 1 captures ≈19–20% of the total energy and approximately of is captured by the first 7 modes. Similar contributions to the total energy were observed by Mustafa et al. [48] for compression corner flows.
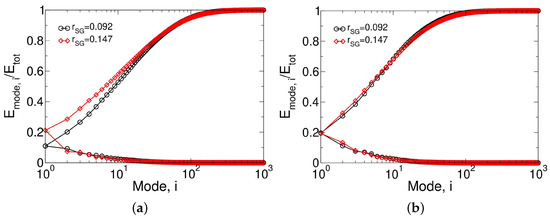
Figure 22.
Cumulative total energy (top) and mode energies (bottom) for (a) approximate shock foot location (box 2) and (b) mean separation region (box 3).
Fourier transforms computed from the time coefficients for the first four POD modes are shown in Figure 23 and Figure 24. The mode shapes are plotted in Figure 25 and Figure 26. For visualization purposes, the modes obtained for the different boxes are plotted together. This does however not imply that modes with identical mode numbers for different boxes are related. Similar to the POD for an impinging oblique SBLI by Piponniau et al. [61], various length scales are captured by just the first few modes. Upstream of the interaction (box 1), the POD picks up unsteadiness of the turbulent approach boundary layer. The spectra of the time coefficients are very broad, which is typical for turbulent boundary layers, and the drop-off in amplitude towards the higher frequencies is less pronounced than for boxes 2 and 3.
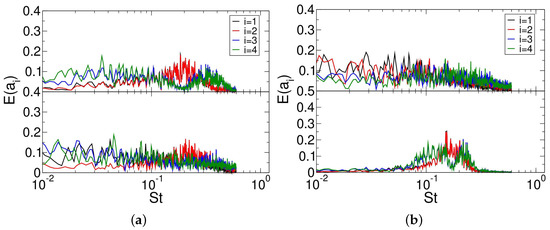
Figure 23.
Fourier transforms of 2D POD time coefficients for . (a) Box 1 (top) and box 2 (bottom) and (b) box 3 (top) and box 4 (bottom).
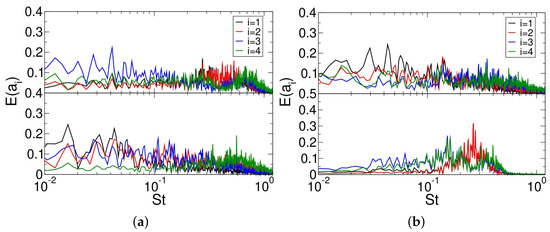
Figure 24.
Fourier transforms of 2D POD time coefficients for . (a) Box 1 (top) and box 2 (bottom) and (b) box 3 (top) and box 4 (bottom).
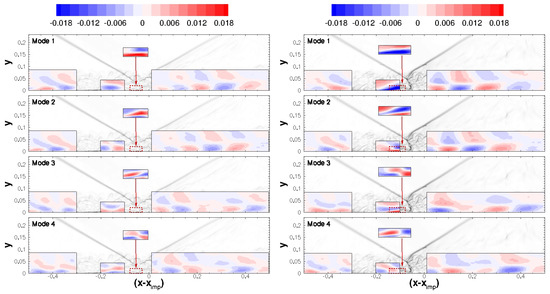
Figure 25.
Iso-contours of u-velocity for POD modes computed from azimuthal average for (left) and (right). For clarity, box 3 is magnified by factor two. The gray contours are instantaneous numerical schlieren images.
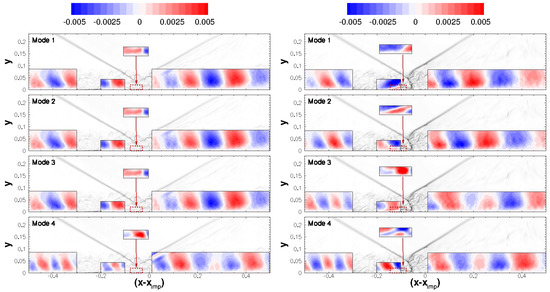
Figure 26.
Iso-contours of v-velocity for POD modes computed from azimuthal average for (left) and (right). For clarity, box 3 is magnified by factor two. The gray contours are instantaneous numerical schlieren images.
The POD for the approximate reflected shock foot location (i.e., separation shock) (box 2) captures two strong peaks at and for (mode 1). This frequency is also noticeable in the wall-pressure coefficient spectra in Figure 19b. Based on the u-velocity iso-contours in Figure 25, mode 1 captures the back and forth motion of the shock foot. This suggests that the separation shock motion is linked to the low-frequency unsteadiness.
For the sub-domain that encompasses the separated flow region (box 3), a pronounced peak is seen at for mode 1 for the larger centerbody. This peak is also captured by the wall-pressure coefficient spectra (see Figure 19b). For both centerbodies, the spectra for modes 1 and 2 exhibit low- and mid-frequency peaks (Figure 23b and Figure 24b) in the separated flow region. Based on the u-velocity visualizations (Figure 25 and Figure 26), modes 1 and 2 can be attributed to a breathing motion of the separation bubble (low-frequency) and modes 3 and 4 capture the shedding (mid-frequency). These findings are in agreement with the inviscid model by Agostini et al. [62] which suggests that both the low- and mid-frequency dynamics are present in the separated flow region. In agreement with the wall-pressure spectra, the low-frequency content for boxes 2 and 3 is overall less for the smaller centerbody.
Downstream of the interaction (box 4), significant peaks are present in the mid-frequency range (). For , modes 1 and 2 have pronounced peaks centered at and in general, all four modes exhibit a broadband mid-frequency content between . For , modes 1 and 2 have peaks in the range , while modes 3 and 4 have large amplitudes in the range and (half frequency). These frequency ranges are consistent with the frequency ranges obtained from the Fourier analysis of the wall-pressure data (Figure 19). Based on the mode visualizations (Figure 25 and Figure 26), modes 1 and 2 capture traveling coherent structures. The wavelength of the structures appears slightly larger for . However, when the wavelength is scaled by the interaction length ( for and for ), the wavelength is almost identical. The inviscid interaction length, , is taken as the difference between the extrapolated foot of the impinging and reflected shock waves.
3.4.3. Proper Orthogonal Decomposition of Three-Dimensional Data
The full 3D data was also analyzed with the POD. The POD eigenvalues computed from the 3D data for the first 1080 modes for and for the first 1280 modes for are presented in Figure 27. Compared to the 2D POD eigenvalues (Figure 21), the drop-off in eigenvalue magnitude towards the higher modes is considerably less for all sub-domains considered. The normalized cumulative POD eigenvalue energy, for the first 1000 modes (excluding mode 0, i.e., the time-average) are presented in Figure 28 for boxes 2 and 3. For both centerbody radii, mode 1 accounts for ≈2–3% of the total energy (), while 60% of is captured by the first 120–220 modes. This slow drop-off in eigenvalue magnitude towards the higher modes is typical for POD of 3D data of turbulent flows.
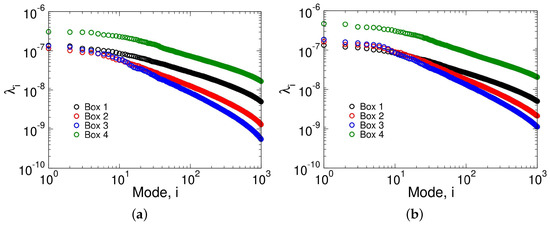
Figure 27.
POD eigenvalues for (a) and (b) .
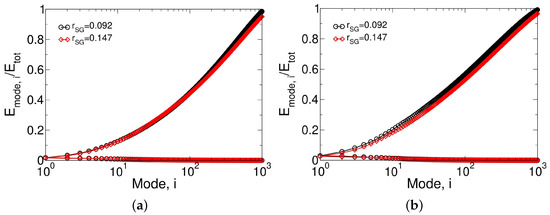
Figure 28.
Cumulative total energy (top) and mode energies (bottom) for (a) approximate shock foot location (box 2) and (b) mean separation region (box 3).
Fourier transforms computed from the time coefficients for the first four POD modes are shown in Figure 29 and Figure 30. Visualizations of the first four POD modes are provided in Figure 31, Figure 32, Figure 33 and Figure 34. For clarity, the mode shapes for boxes 1, 2 and 4 are provided in Figure 31 and Figure 33 and the mode shapes for box 3 are provided in Figure 32 and Figure 34 (where the dashed lines indicate the mean separation and reattachment). For both centerbodies, the spectra for box 1 are relatively broad and the drop-off in eigenvalue amplitude towards the higher frequencies is less pronounced than for boxes 2–4. Overall, the dominant flow structures for all four sub-domains have longitudinal coherence. For the attached turbulent boundary layers, the POD picks up the near-wall structures.
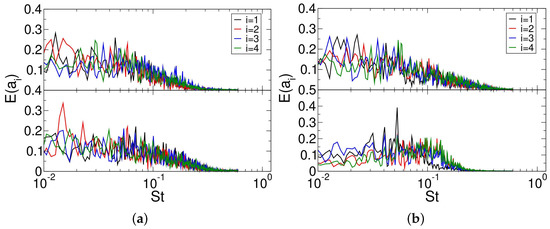
Figure 29.
Fourier transforms of 3D POD time coefficients for . (a) Box 1 (top) and box 2 (bottom) and (b) box 3 (top) and box 4 (bottom).
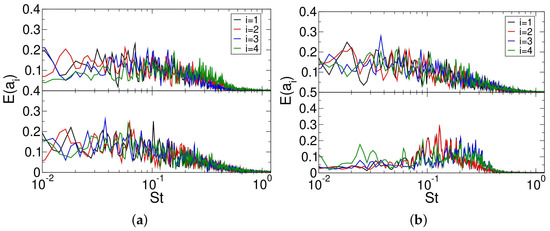
Figure 30.
Fourier transforms of 3D POD time coefficients for . (a) Box 1 (top) and box 2 (bottom) and (b) box 3 (top) and box 4 (bottom).
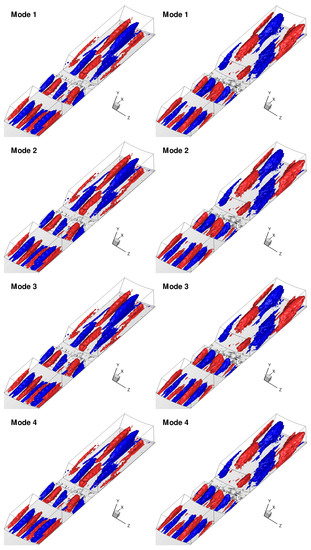
Figure 31.
POD modes for (left) and (right). Iso-surfaces of (blue) and (red). Furthermore, included is an instantaneous iso-surface of (gray) obtained directly from the simulation.
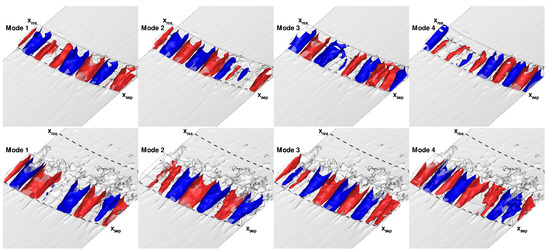
Figure 32.
Separated flow region (box 3) POD modes for (top row) and (bottom row). Iso-surfaces of (blue) and (red). Furthermore, included is an instantaneous iso-surface of (gray) obtained directly from the simulation.
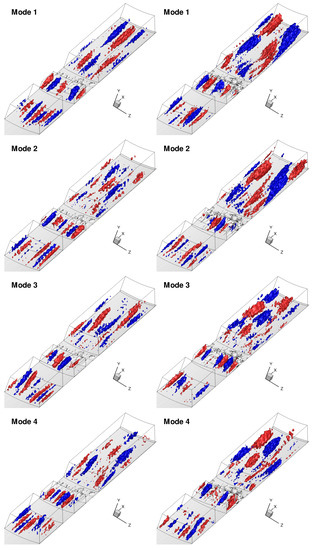
Figure 33.
POD modes for (left) and (right). Iso-surfaces of (blue) and (red). Furthermore, included is an instantaneous iso-surface of (gray) obtained directly from the simulation.
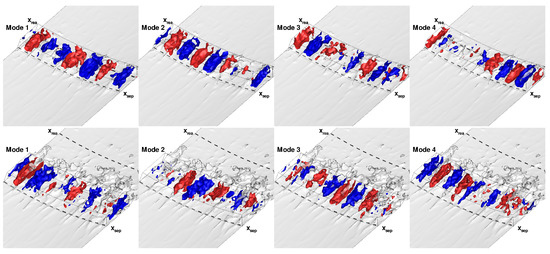
Figure 34.
Separated flow region (box 3) POD modes for (top row) and (bottom row). Iso-surfaces of (blue) and (red). Furthermore, included is an instantaneous iso-surface of (gray) obtained directly from the simulation.
The box 2 spectra, for the smaller centerbody, have peaks at and (mode 2). Furthermore, the peaks centered near and were also observed in the wall-pressure spectra. For , a large peak in the spectrum is present at (mode 3). This peak is also visible in the wall-pressure spectra in Figure 19b. The streamwise elongated regions of low- and high-momentum flow captured by the 3D POD modes for box 2, for the larger centerbody, have a spanwise length scale of approximately consistent with Priebe [18] and Loginov [63].
Comparing the mode visualizations for the sub-domain that outlines the undisturbed turbulent boundary layer (box 1) and the region capturing the separation shock foot and a portion of the upstream boundary layer (box 2), a change of the mode shapes is observed for the streamwise component (Figure 31) but not so much for the wall-normal component (Figure 33). This change is less pronounced for the higher modes. Similar fluctuations of the upstream boundary layer streamwise velocity caused by the most energetic mode (mode 1) were observed by Humble et al. [64] when performing POD of an incident shock wave turbulent boundary layer interaction experiment at Mach 2.1.
Furthermore, a low-frequency content is also observed for box 3. For the smaller centerbody in particular, distinct peaks are noted at for mode 1 and for mode 3 and were also previously seen in the wall-pressure coefficient spectra. The associated longitudinal flow structures inside the interaction region have a larger azimuthal wavelength than the structures for the approach flow boundary layer and the associated frequencies are much lower (Figure 29 and Figure 30). The azimuthal wavelength and wall-normal extent appears to scale with the size (in particular the height) of the interaction. Priebe et al. [18] observed similar longitudinal structures over the separation region when performing a DMD for a compression corner SBLI. They concluded that the large-scale elongated structures are linked to the low-frequency unsteadiness and that they are amplified as a result of Görtler instability.
For box 4 (downstream of interaction), the time coefficient spectra have appreciable amplitudes in the range (similar to the 2D POD analysis). Interestingly, the spectra for the smaller centerbody (Figure 29b) appear to be shifted towards a lower Strouhal number range compared to the previous 2D spectra, while the spectra for the larger centerbody (Figure 30b) closely resemble their 2D counterparts. However, different from the 2D POD results, the mode visualizations for box 4 do not reveal the shedding of spanwise coherent structures.
4. Discussion
The accurate prediction and physical understanding of shock wave boundary layer interactions (SBLI) is of great interest to the designers of supersonic and hypersonic air vehicles. SBLIs occur in external and internal flows and are known to have detrimental effects on overall performance. Implicit large-eddy simulations (ILES) of the Mach 2.5 axisymmetric turbulent shock wave boundary layer interaction experiment by Davis [30] and Sasson et al. [31] at the NASA Glenn Research Center (GRC) were carried out. For the simulations, the approach flow boundary layer thickness and freestream conditions were matched. The Reynolds number was lowered by a factor of 10 to cut back on the computational expense of the simulations. The wall-pressure distributions obtained from the ILES are in good agreement with the experiment. Precursor RANS calculations provided the initial and boundary conditions for the ILES. Two different shock generator radii, and , were investigated. The expansion fan emanating from the rear end of the shock generator weakens the conical shock wave before it impinges on the turbulent boundary layer. This effect is more pronounced for the smaller shock generator and the interaction region is smaller. For both centerbodies, the Reynolds stresses and turbulence kinetic energy increase strongly through the interaction. This behavior is more pronounced for the larger centerbody. The streamwise normal Reynolds stress peaks at separation and is associated with the back and forth motion of the separation shock. For the larger centerbody, the Reynolds shear stress exhibits a second peak downstream of the interaction, which suggests the shedding of coherent flow structures.
Spectra of the azimuthal average of the wall-pressure coefficient reveal a low-frequency content in the vicinity of the separation shock and a mid-frequency content downstream of reattachment associated with the shedding of coherent structures with pronounced azimuthal coherence. The intensity of both the low- and mid-frequency oscillations were found to be larger for the stronger interaction. Similar findings with respect to the shock strength were made for planar configurations (see Refs. [21,22,23]).
The azimuthal-averaged flow fields were analyzed with the proper orthogonal decomposition (POD). The POD time coefficient spectra shared many common features with the wall-pressure coefficient spectra. In accordance with the inviscid model by Agostini et al. [62], the POD of the 2D data captured both low- and mid-frequency dynamics of the separated flow region. Downstream of reattachment, the shedding of coherent structures (mid-frequency) is captured. A POD analysis of the full 3D data revealed longitudinal coherent flow structures inside the interaction region with an azimuthal wavelength that was noticeably larger than that of the dominant streamwise structures in the approach flow boundary layer. Similar structures for planar configurations were observed by Priebe et al. [18]. The frequency associated with the longitudinal structures falls in the frequency range commonly associated with the low-frequency unsteadiness. The azimuthal wavelength of the structures scales with the size (in particular the height) of the interaction.
Overall, the spectra of the wall-pressure coefficient as well as the 2D and 3D POD analyses reveal similar flow physics (with respect to both the dominant flow structures [18] and frequency content [4,8,9]) as for planar configurations. More noticeable differences compared to planar interactions may occur for very narrow inlet flows where the duct diameter is closer to the boundary layer thickness.
Author Contributions
Conceptualization, J.-P.M., A.G. and J.S.; methodology, J.-P.M., A.G.; software, A.G.; validation, J.-P.M.; formal analysis, J.-P.M.; investigation, J.-P.M.; writing—original draft preparation, J.-P.M.; writing—review and editing, A.G. and J.S.; visualization, J.-P.M.; supervision, A.G. and J.S.; project administration, A.G. and J.S.; funding acquisition, A.G. and J.S. All authors have read and agreed to the published version of the manuscript.
Funding
This material is based upon work supported by the National Aeronautics and Space Administration under grant 80NSSC19K1675 issued through the NASA Shared Services Center. The NASA High-End Computing (HEC) Program through the NASA Advanced Supercomputing (NAS) Division at Ames Research Center provided the computational resources for this work.
Institutional Review Board Statement
Not applicable.
Informed Consent Statement
Not applicable.
Data Availability Statement
The data presented in this study are available on request from the corresponding author.
Conflicts of Interest
The authors declare no conflict of interest.
References
- Green, J. Interactions between shock waves and turbulent boundary layers. Prog. Aerosp. Sci. 1970, 11, 235–340. [Google Scholar] [CrossRef]
- Babinsky, H.; Harvey, J. Shock Wave-Boundary-Layer Interactions; Cambridge University Press: Cambridge, UK, 2011; Volume 32. [Google Scholar]
- Dolling, D.S. Fifty Years of Shock-Wave/Boundary-Layer Interaction Research: What Next? AIAA J. 2001, 39, 1517–1531. [Google Scholar] [CrossRef]
- Gaitonde, D.V. Progress in shock wave/boundary layer interactions. Prog. Aerosp. Sci. 2015, 72, 80–99. [Google Scholar] [CrossRef]
- Délery, J.; Dussauge, J.P. Some physical aspects of shock wave/boundary layer interactions. Shock Waves 2009, 19, 453. [Google Scholar] [CrossRef]
- Smits, A.; Dussauge, J.P. Turbulent Shear Layers in Supersonic Flow; Springer: New York, NY, USA, 2006. [Google Scholar]
- Souverein, L.; Bakker, P.; Dupont, P. A scaling analysis for turbulent shock-wave/boundary-layer interactions. J. Fluid Mech. 2013, 714, 505–535. [Google Scholar] [CrossRef]
- Clemens, N.; Narayanaswamy, V. Low-Frequency Unsteadiness of Shock Wave/Turbulent Boundary Layer Interactions. Ann. Rev. Fluid Mech. 2014, 46, 469–492. [Google Scholar] [CrossRef]
- Piponniau, S.; Dussauge, J.P.; Debieve, J.F.; Dupont, P. A simple model for low-frequency unsteadiness in shock-induced separation. J. Fluid Mech. 2009, 629, 87–108. [Google Scholar] [CrossRef]
- Dussauge, J.P.; Dupont, P.; Debiève, J.F. Unsteadiness in shock wave boundary layer interactions with separation. Aerosp. Sci. Technol. 2006, 10, 85–91. [Google Scholar] [CrossRef]
- Ganapathisubramani, B.; Clemens, N.; Dolling, D. Low-frequency dynamics of shock-induced separation in a compression ramp interaction. J. Fluid Mech. 2009, 636, 397–425. [Google Scholar] [CrossRef]
- Humble, R.; Elsinga, G.; Scarano, F.; Van Oudheusden, B. Three-dimensional instantaneous structure of a shock wave/turbulent boundary layer interaction. J. Fluid Mech. 2009, 622, 33–62. [Google Scholar] [CrossRef]
- Porter, K.M.; Poggie, J. Selective upstream influence on the unsteadiness of a separated turbulent compression ramp flow. Phys. Fluids 2019, 31, 016104. [Google Scholar] [CrossRef]
- Beresh, S.; Clemens, N.; Dolling, D. Relationship Between Upstream Turbulent Boundary-Layer Velocity Fluctuations and Separation Shock Unsteadiness. AIAA J. 2002, 40, 2412–2422. [Google Scholar] [CrossRef]
- Ganapathisubramani, B.; Clemens, N.; Dolling, D. Effects of upstream boundary layer on the unsteadiness of shock-induced separation. J. Fluid Mech. 2007, 585, 369–394. [Google Scholar] [CrossRef]
- Vanstone, L.; Clemens, N.T. Proper Orthogonal Decomposition Analysis of Swept-Ramp Shock-Wave/Boundary-Layer Unsteadiness at Mach 2. AIAA J. 2019, 57, 3395–3409. [Google Scholar] [CrossRef]
- Priebe, S.; Martín, M.P. Low-frequency unsteadiness in shock wave–turbulent boundary layer interaction. J. Fluid Mech. 2012, 699, 1–49. [Google Scholar] [CrossRef]
- Priebe, S.; Tu, J.H.; Rowley, C.W.; Martín, M.P. Low-frequency dynamics in a shock-induced separated flow. J. Fluid Mech. 2016, 807, 441–477. [Google Scholar] [CrossRef]
- Dupont, P.; Haddad, C.; Debieve, J. Space and time organization in a shock-induced separated boundary layer. J. Fluid Mech. 2006, 559, 255–277. [Google Scholar] [CrossRef]
- Pirozzoli, S.; Grasso, F. Direct numerical simulation of impinging shock wave/turbulent boundary layer interaction at M = 2.25. Phys. Fluids 2006, 18, 065113. [Google Scholar] [CrossRef]
- Souverein, L.J.; Dupont, P.; Debieve, J.F.; Dussauge, J.P.; Van Oudheusden, B.W.; Scarano, F. Effect of Interaction Strength on Unsteadiness in Shock-Wave-Induced Separations. AIAA J. 2010, 48, 1480–1493. [Google Scholar] [CrossRef]
- Agostini, L.; Larchevêque, L.; Dupont, P.; Debiève, J.F.; Dussauge, J.P. Zones of Influence and Shock Motion in a Shock/Boundary-Layer Interaction. AIAA J. 2012, 50, 1377–1387. [Google Scholar] [CrossRef]
- Threadgill, J.A.; Bruce, P.J. Unsteady Flow Features Across Different Shock/Boundary-Layer Interaction Configurations. AIAA J. 2020, 58, 3063–3075. [Google Scholar] [CrossRef]
- Dolling, D.; Bogdonoff, S. Blunt Fin-Induced Shock Wave/Turbulent Boundary-Layer Interaction. AIAA J. 1982, 20, 1674–1680. [Google Scholar] [CrossRef]
- Hung, C.M.; Buning, P.G. Simulation of blunt-fin-induced shock-wave and turbulent boundary-layer interaction. J. Fluid Mech. 1985, 154, 163–185. [Google Scholar] [CrossRef]
- Bruce, P.; Burton, D.; Titchener, N.; Babinsky, H. Corner effect and separation in transonic channel flows. J. Fluid Mech. 2011, 679, 247–262. [Google Scholar] [CrossRef]
- Burton, D.; Babinsky, H. Corner separation effects for normal shock wave/turbulent boundary layer interactions in rectangular channels. J. Fluid Mech. 2012, 707, 287–306. [Google Scholar] [CrossRef]
- Seebaugh, W.R.; Childs, M.E. Conical Shock-Wave Turbulent Boundary-Layer Interaction Including Suction Effects. J. Aircr. 1970, 7, 334–340. [Google Scholar] [CrossRef]
- Rose, W.C. The Behavior of a Compressible Turbulent Boundary Layer in a Shock-Wave-Induced Adverse Pressure Gradient. Ph.D. Thesis, Washington University, Seattle, WA, USA, 1973. [Google Scholar]
- Davis, D.O. CFD Validation Experiment of a Mach 2.5 Axisymmetric Shock-Wave/Boundary-Layer Interaction. In Proceedings of the Fluids Engineering Division Summer Meeting, New York, NY, USA, 9–12 August 2015; Volume 57212, p. V001T06A001. [Google Scholar]
- Sasson, J.; Reising, H.H.; Davis, D.O.; Barnhart, P.J. Summary of Shock Wave Turbulent Boundary Layer Interaction Experiments In a Circular Test Section; AIAA Paper 2023-0442; American Institute of Aeronautics and Astronautics: Reston, VA, USA, 2023. [Google Scholar]
- Funderburk, M.L.; Narayanaswamy, V. Investigation of Negative Surface Curvature Effects in Axisymmetric Shock/Boundary-Layer Interaction. AIAA J. 2019, 57, 1594–1607. [Google Scholar] [CrossRef]
- Morgan, B.; Duraisamy, K.; Nguyen, N.; Kawai, S.; Lele, S. Flow physics and RANS modelling of oblique shock/turbulent boundary layer interaction. J. Fluid Mech. 2013, 729, 231–284. [Google Scholar] [CrossRef]
- Lumley, J.L. The structure of inhomogeneous turbulent flows. In Atmospheric Turbulence and Radio Wave Propagation; National Institute of Informatics: Tokyo, Japan, 1967; pp. 166–178. [Google Scholar]
- Gross, A.; Fasel, H.F. High-Order Accurate Numerical Method for Complex Flows. AIAA J. 2008, 46, 204–214. [Google Scholar] [CrossRef]
- Gross, A.; Fasel, H.F. Numerical investigation of supersonic flow for axisymmetric cones. Math. Comput. Simul. 2010, 81, 133–142. [Google Scholar] [CrossRef]
- Wilcox, D.C. Turbulence Modeling for CFD, 3rd ed.; DCW Industries: New York, NY, USA, 2006. [Google Scholar]
- Wilcox, D.C. Formulation of the k-w Turbulence Model Revisited. AIAA J. 2008, 46, 2823–2838. [Google Scholar] [CrossRef]
- Balsara, D.S.; Shu, C.W. Monotonicity preserving weighted essentially non-oscillatory schemes with increasingly high order of accuracy. J. Computat. Phys. 2000, 160, 405–452. [Google Scholar] [CrossRef]
- Yee, H.C. Upwind and Symmetric Shock-Capturing Schemes; NASA-TM-89464; NASA: Washington, DC, USA, 1987. [Google Scholar]
- Touber, E.; Sandham, N.D. Large-eddy simulation of low-frequency unsteadiness in a turbulent shock-induced separation bubble. Theor. Computat. Fluid Dyn. 2009, 23, 79–107. [Google Scholar] [CrossRef]
- Poggie, J.; Bisek, N.J.; Gosse, R. Resolution effects in compressible, turbulent boundary layer simulations. Comput. Fluids 2015, 120, 57–69. [Google Scholar] [CrossRef]
- Gross, A.; Little, J.; Fasel, H.F. Numerical investigation of unswept and swept turbulent shock-wave boundary layer interactions. Aerosp. Sci. Technol. 2022, 123, 107455. [Google Scholar] [CrossRef]
- Lee, S.; Gross, A. Numerical Investigation of Sweep Effect on Turbulent Shock-Wave Boundary-Layer Interaction. AIAA J. 2022, 60, 712–730. [Google Scholar] [CrossRef]
- Poletto, R.; Craft, T.; Revell, A. A New Divergence Free Synthetic Eddy Method for the Reproduction of Inlet Flow Conditions for LES. Flow Turbul. Combust. 2013, 91, 519–539. [Google Scholar] [CrossRef]
- Lee, S.; Gross, A. Large-Eddy Simulation of Supersonic Turbulent Boundary Layer. In Proceedings of the AIAA AVIATION 2020 FORUM, Virtual Event, 15–19 June 2020; American Institute of Aeronautics and Astronautics: Reston, VA, USA, 15–19 June 2020. [Google Scholar]
- Sirovich, L. Turbulence and the Dynamics of Coherent Structures. Q. Appl. Math. 1987, 45, 561–590. [Google Scholar] [CrossRef]
- Mustafa, M.; Parziale, N.; Smith, M.; Marineau, E. Amplification and structure of streamwise-velocity fluctuations in compression-corner shock-wave/turbulent boundary-layer interactions. J. Fluid Mech. 2019, 863, 1091–1122. [Google Scholar] [CrossRef]
- Castillo Gomez, P.; Gross, A.; Guildenbecher, D.R.; Miller, N.E.; Lynch, K.P. Wall-Modeled Large-Eddy Simulations of Turbulent Mach 3.5, 8, and 14 Boundary Layers-Effect of Mach Number on Aero-Optical Distortions. In Proceedings of the AIAA AVIATION 2022 Forum, Chicago, IL, USA, 27 June–1 July 2022; p. 3441. [Google Scholar]
- Anderson, J.D. Modern Compressible Flow: With Historical Perspective; McGraw-Hill: New York, NY, USA, 1990; Volume 12. [Google Scholar]
- Pirozzoli, S.; Bernardini, M. Direct Numerical Simulation Database for Impinging Shock Wave/Turbulent Boundary-Layer Interaction. AIAA J. 2011, 49, 1307–1312. [Google Scholar] [CrossRef]
- Guarini, S.E.; Moser, R.D.; Shariff, K.; Wray, A. Direct numerical simulation of a supersonic turbulent boundary layer at Mach 2.5. J. Fluid Mech. 2000, 414, 1–33. [Google Scholar] [CrossRef]
- Purtell, L.; Klebanoff, P.; Buckley, F. Turbulent boundary layer at low Reynolds number. Phys. Fluids 1981, 24, 802–811. [Google Scholar] [CrossRef]
- Hopkins, E.J.; Inouye, M. An Evaluation of Theories for Predicting Turbulent Skin Friction and Heat Transfer on Flat Plates at Supersonic and Hypersonic Mach Numbers. AIAA J. 1971, 9, 993–1003. [Google Scholar] [CrossRef]
- Sandham, N. Effects of Compressibility and Shock-Wave Interactions on Turbulent Shear Flows. Flow Turbul. Combust. 2016, 97, 1–25. [Google Scholar] [CrossRef]
- Fang, J.; Zheltovodov, A.A.; Yao, Y.; Moulinec, C.; Emerson, D.R. On the turbulence amplification in shock-wave/turbulent boundary layer interaction. J. Fluid Mech. 2020, 897, A32. [Google Scholar] [CrossRef]
- Wu, M.; Martin, M.P. Analysis of shock motion in shockwave and turbulent boundary layer interaction using direct numerical simulation data. J. Fluid Mech. 2008, 594, 71–83. [Google Scholar] [CrossRef]
- Pasquariello, V.; Hickel, S.; Adams, N.A. Unsteady effects of strong shock-wave/boundary-layer interaction at high Reynolds number. J. Fluid Mech. 2017, 823, 617–657. [Google Scholar] [CrossRef]
- Grilli, M.; Schmid, P.J.; Hickel, S.; Adams, N.A. Analysis of unsteady behaviour in shockwave turbulent boundary layer interaction. J. Fluid Mech. 2012, 700, 16–28. [Google Scholar] [CrossRef]
- Nichols, J.W.; Larsson, J.; Bernardini, M.; Pirozzoli, S. Stability and modal analysis of shock/boundary layer interactions. Theor. Comput. Fluid Dyn. 2017, 31, 33–50. [Google Scholar] [CrossRef]
- Piponniau, S.; Collin, E.; Dupont, P.; Debiève, J.f. Reconstruction of velocity fields from wall pressure measurements in a shock wave/turbulent boundary layer interaction. Int. J. Heat Fluid Flow 2012, 35, 176–186. [Google Scholar] [CrossRef]
- Agostini, L.; Larchevêque, L.; Dupont, P. Mechanism of shock unsteadiness in separated shock/boundary-layer interactions. Phys. Fluids 2015, 27, 126103. [Google Scholar] [CrossRef]
- Loginov, M.S.; Adams, N.A.; Zheltovodov, A.A. Large-eddy simulation of shock-wave/turbulent-boundary-layer interaction. J. Fluid Mech. 2006, 565, 135–169. [Google Scholar] [CrossRef]
- Humble, R.; Scarano, F.; Van Oudheusden, B. Unsteady aspects of an incident shock wave/turbulent boundary layer interaction. J. Fluid Mech. 2009, 635, 47–74. [Google Scholar] [CrossRef]
Disclaimer/Publisher’s Note: The statements, opinions and data contained in all publications are solely those of the individual author(s) and contributor(s) and not of MDPI and/or the editor(s). MDPI and/or the editor(s) disclaim responsibility for any injury to people or property resulting from any ideas, methods, instructions or products referred to in the content. |
© 2023 by the authors. Licensee MDPI, Basel, Switzerland. This article is an open access article distributed under the terms and conditions of the Creative Commons Attribution (CC BY) license (https://creativecommons.org/licenses/by/4.0/).