
Multi-Megawatt Horizontal Axis Wind Turbine Blade Optimization Based on PSO Method


Abstract
:1. Introduction
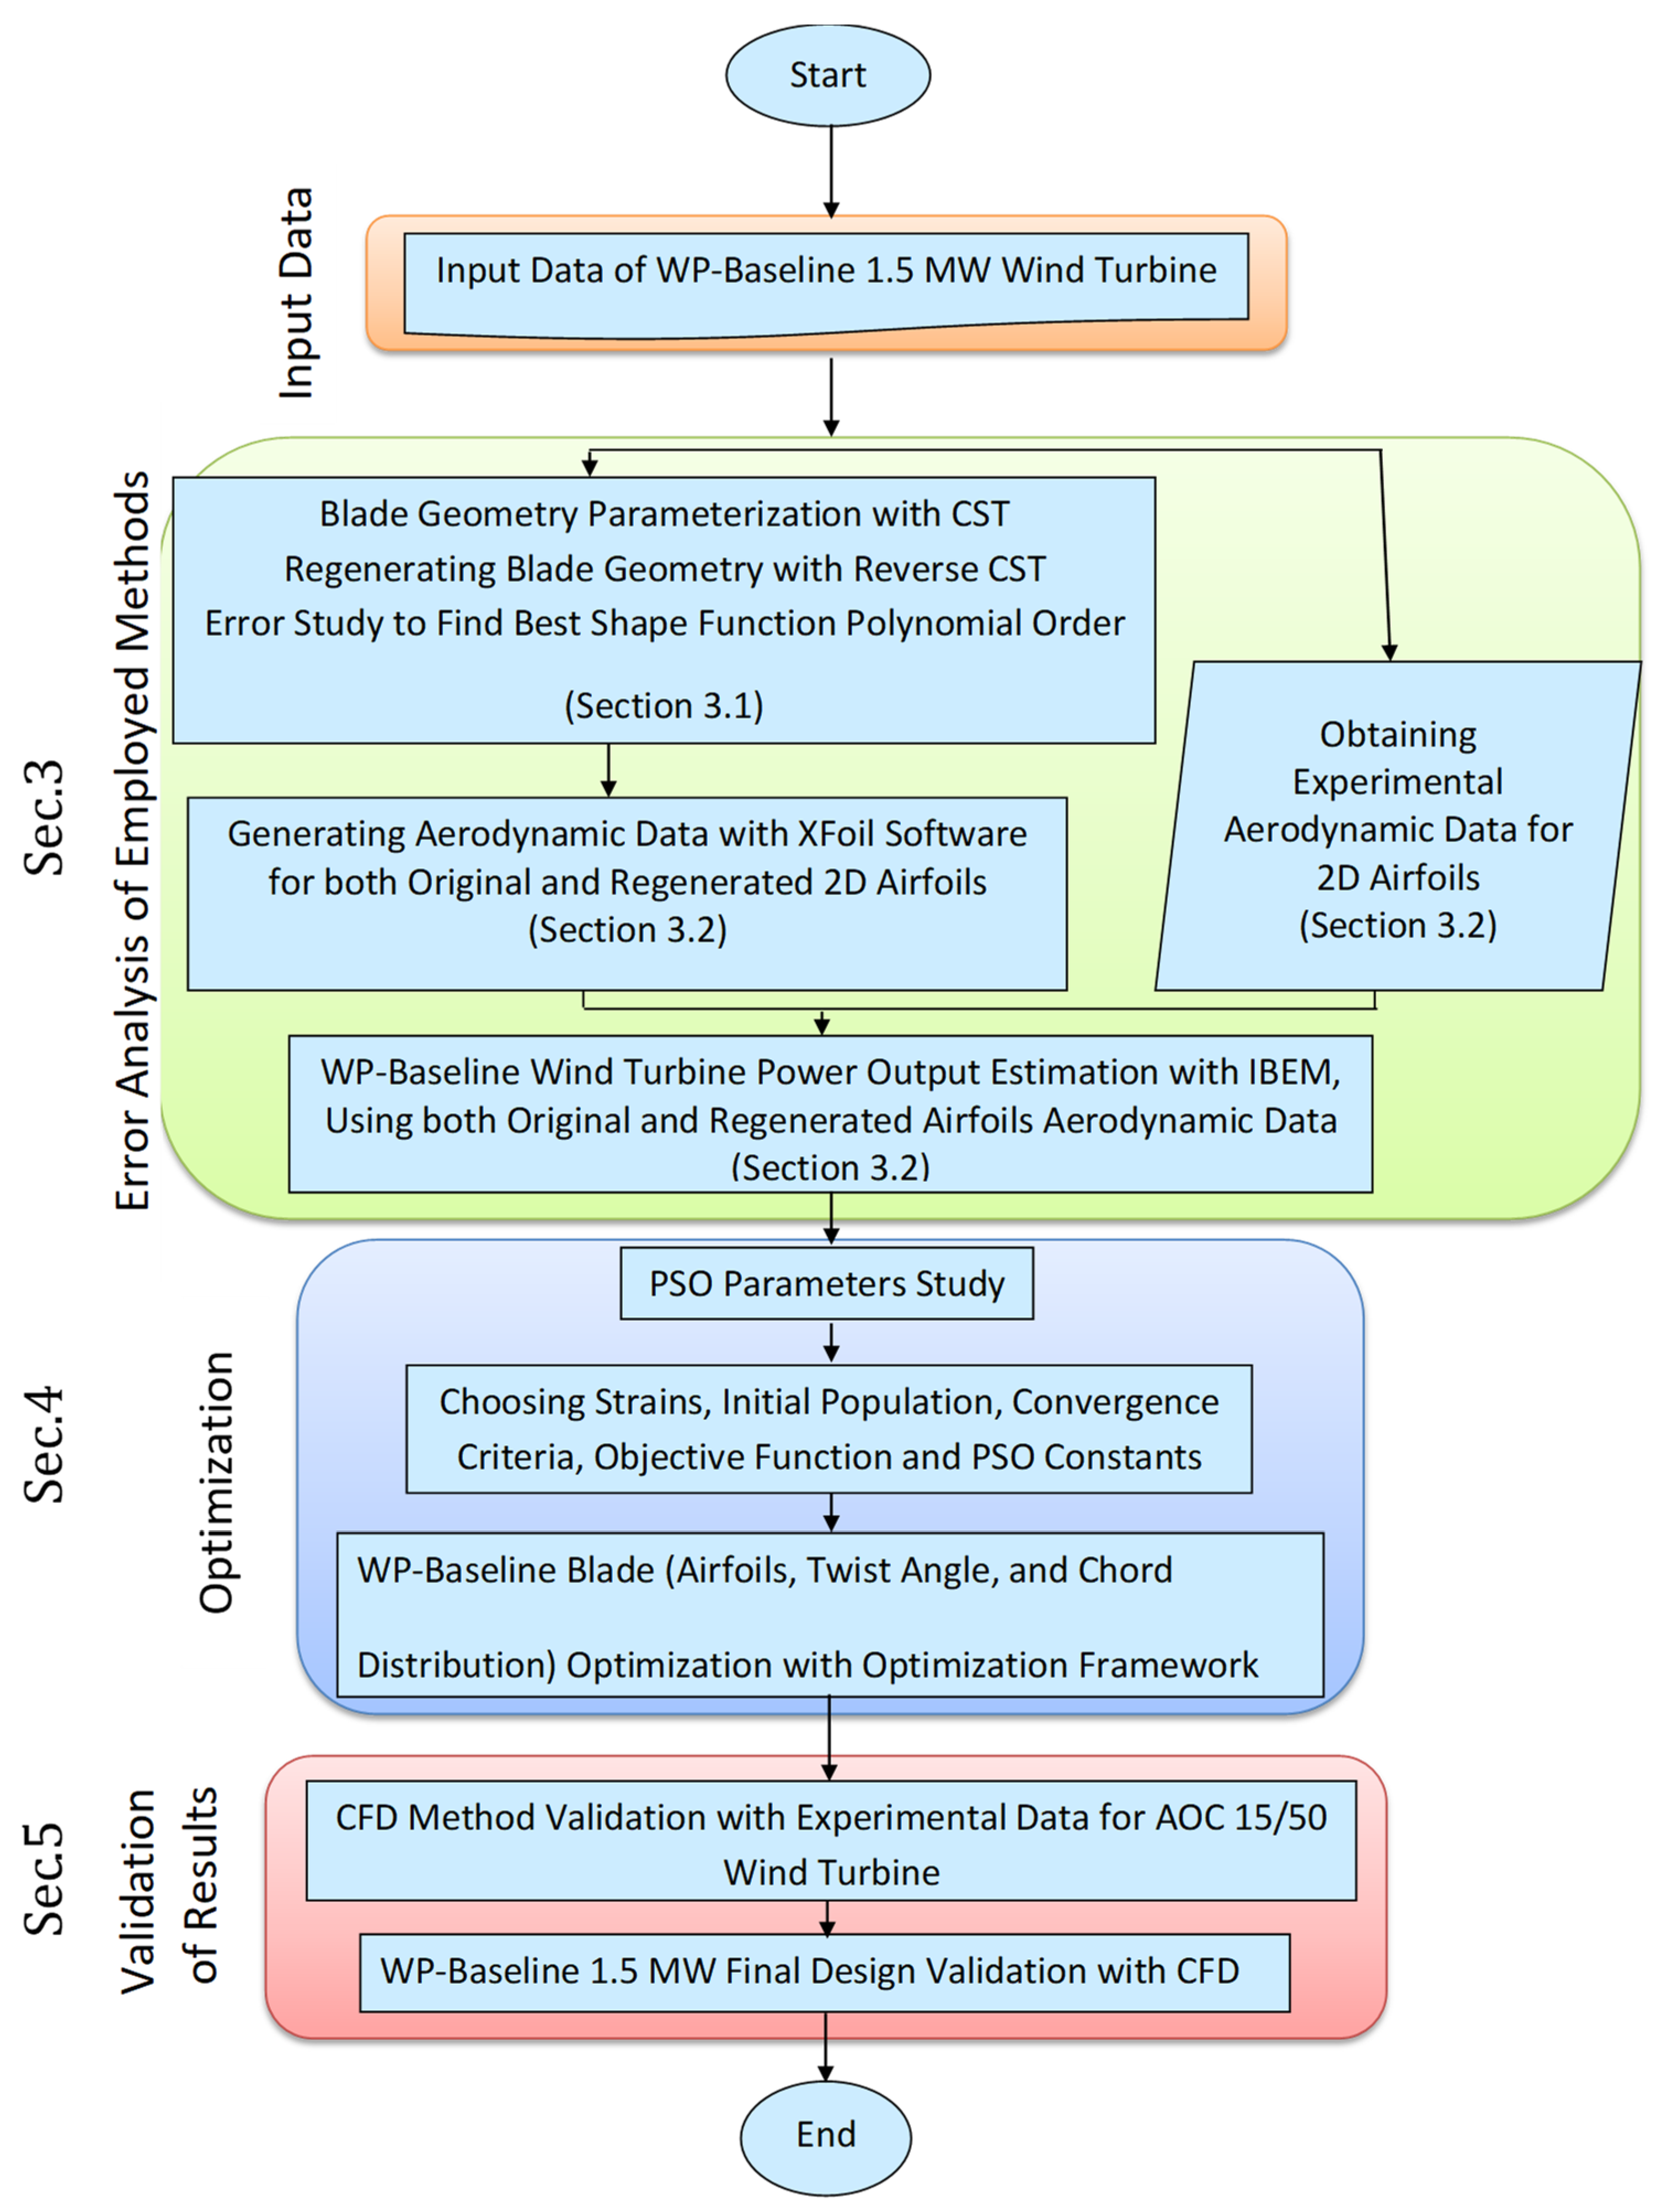
2. Methodology
- The CST technique for geometric parameterization (Section 2.1);
- The objective function evaluation tools (Section 2.2);
- The Single-Objective Particle Swarm Optimization (PSO) algorithm (Section 2.3).
2.1. The CST Technique
2.2. The Objective Function Evaluation Tool
2.3. Single-Objective Particle Swarm Optimization (PSO) Algorithm
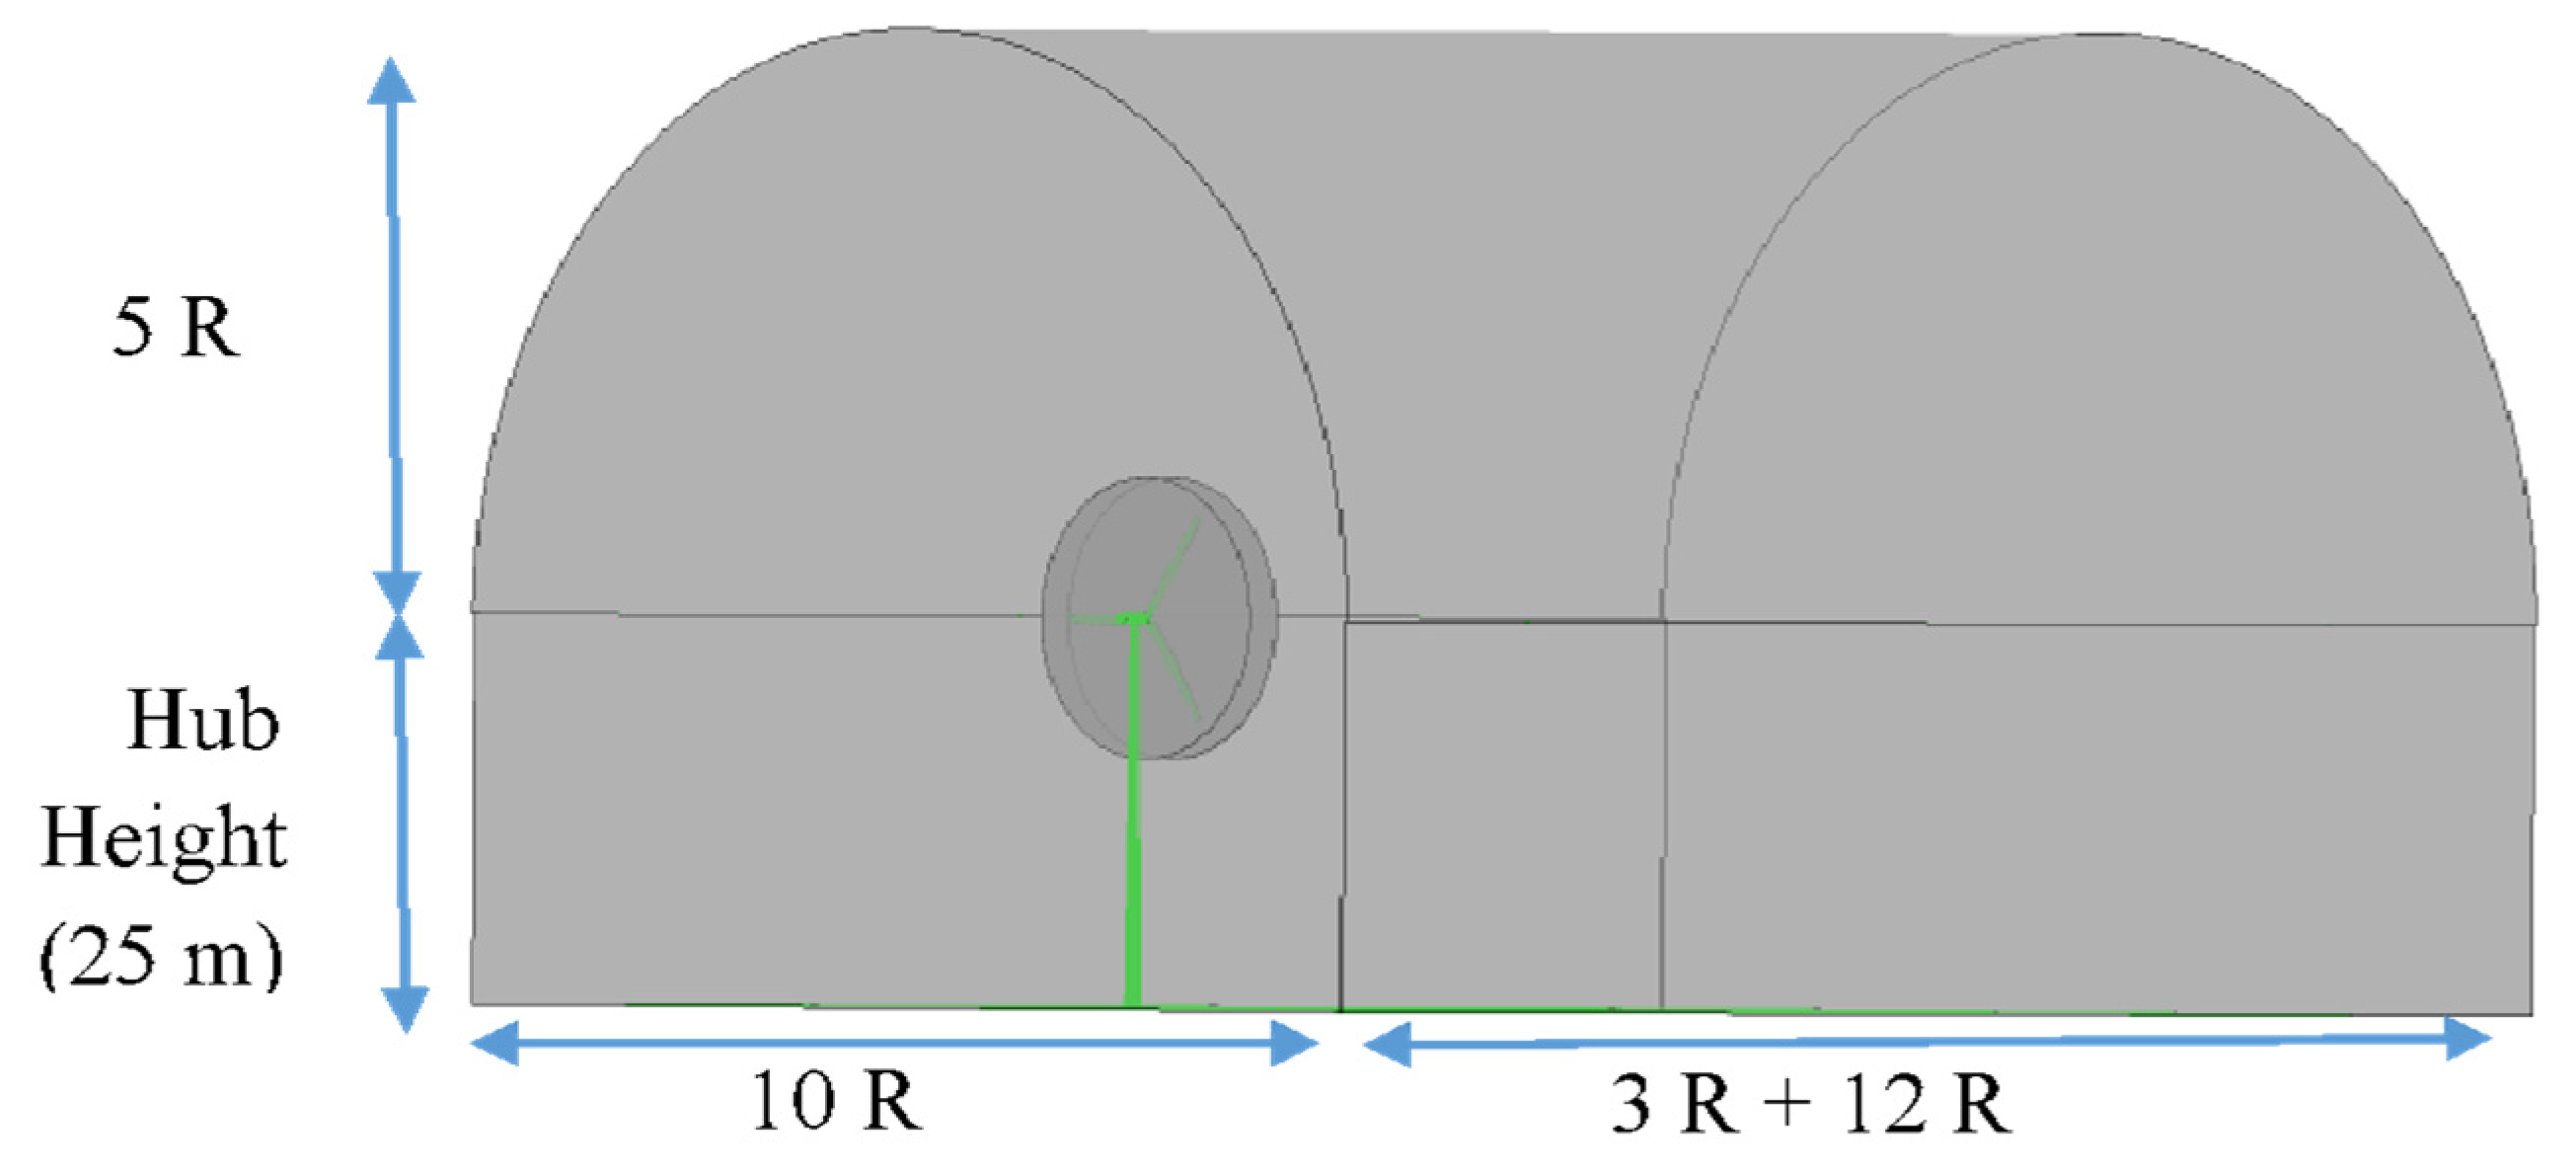
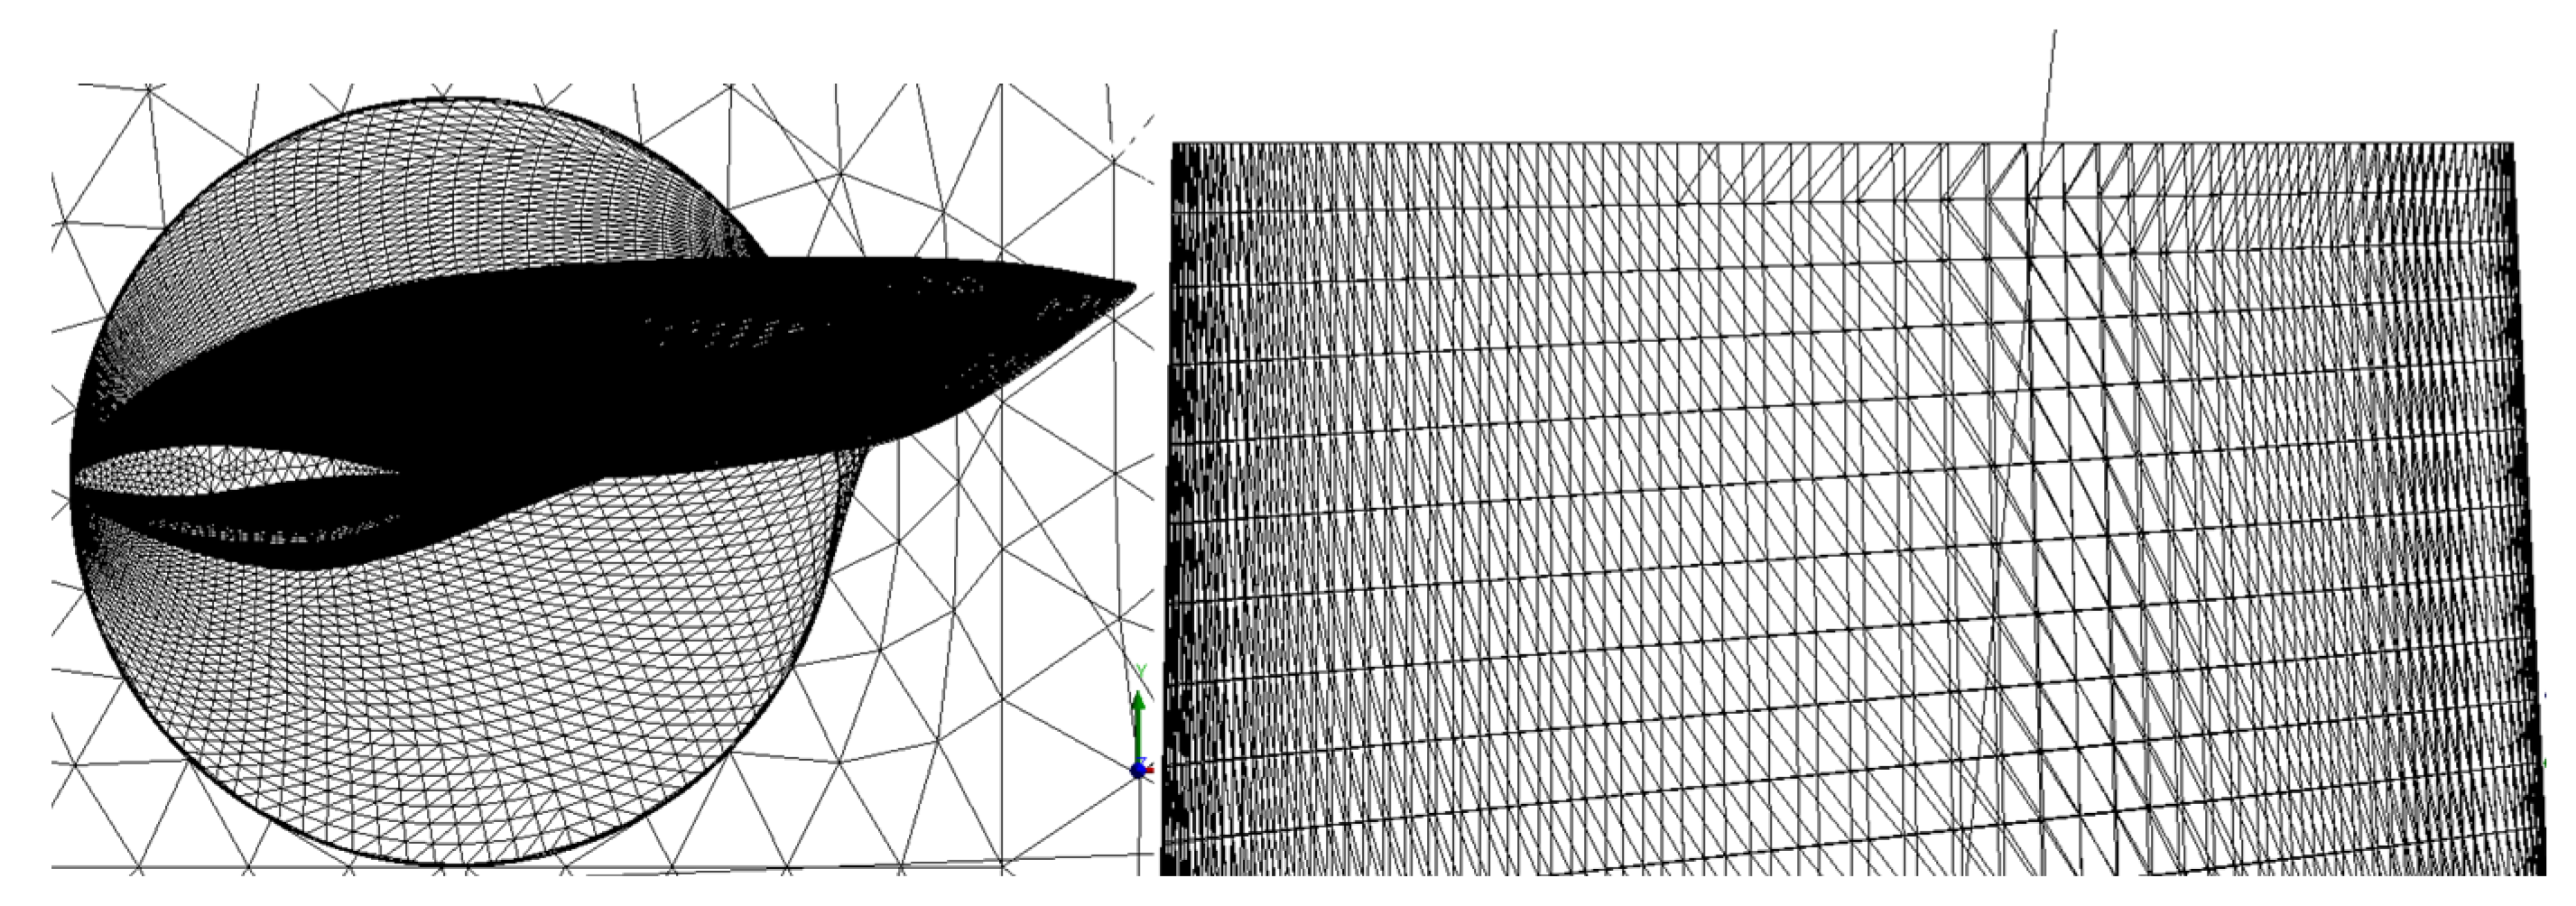
2.4. CFD Settings (for Validation Phase)
3. Validation of the Geometry Parametrization Technique and 2D Aerodynamic Data
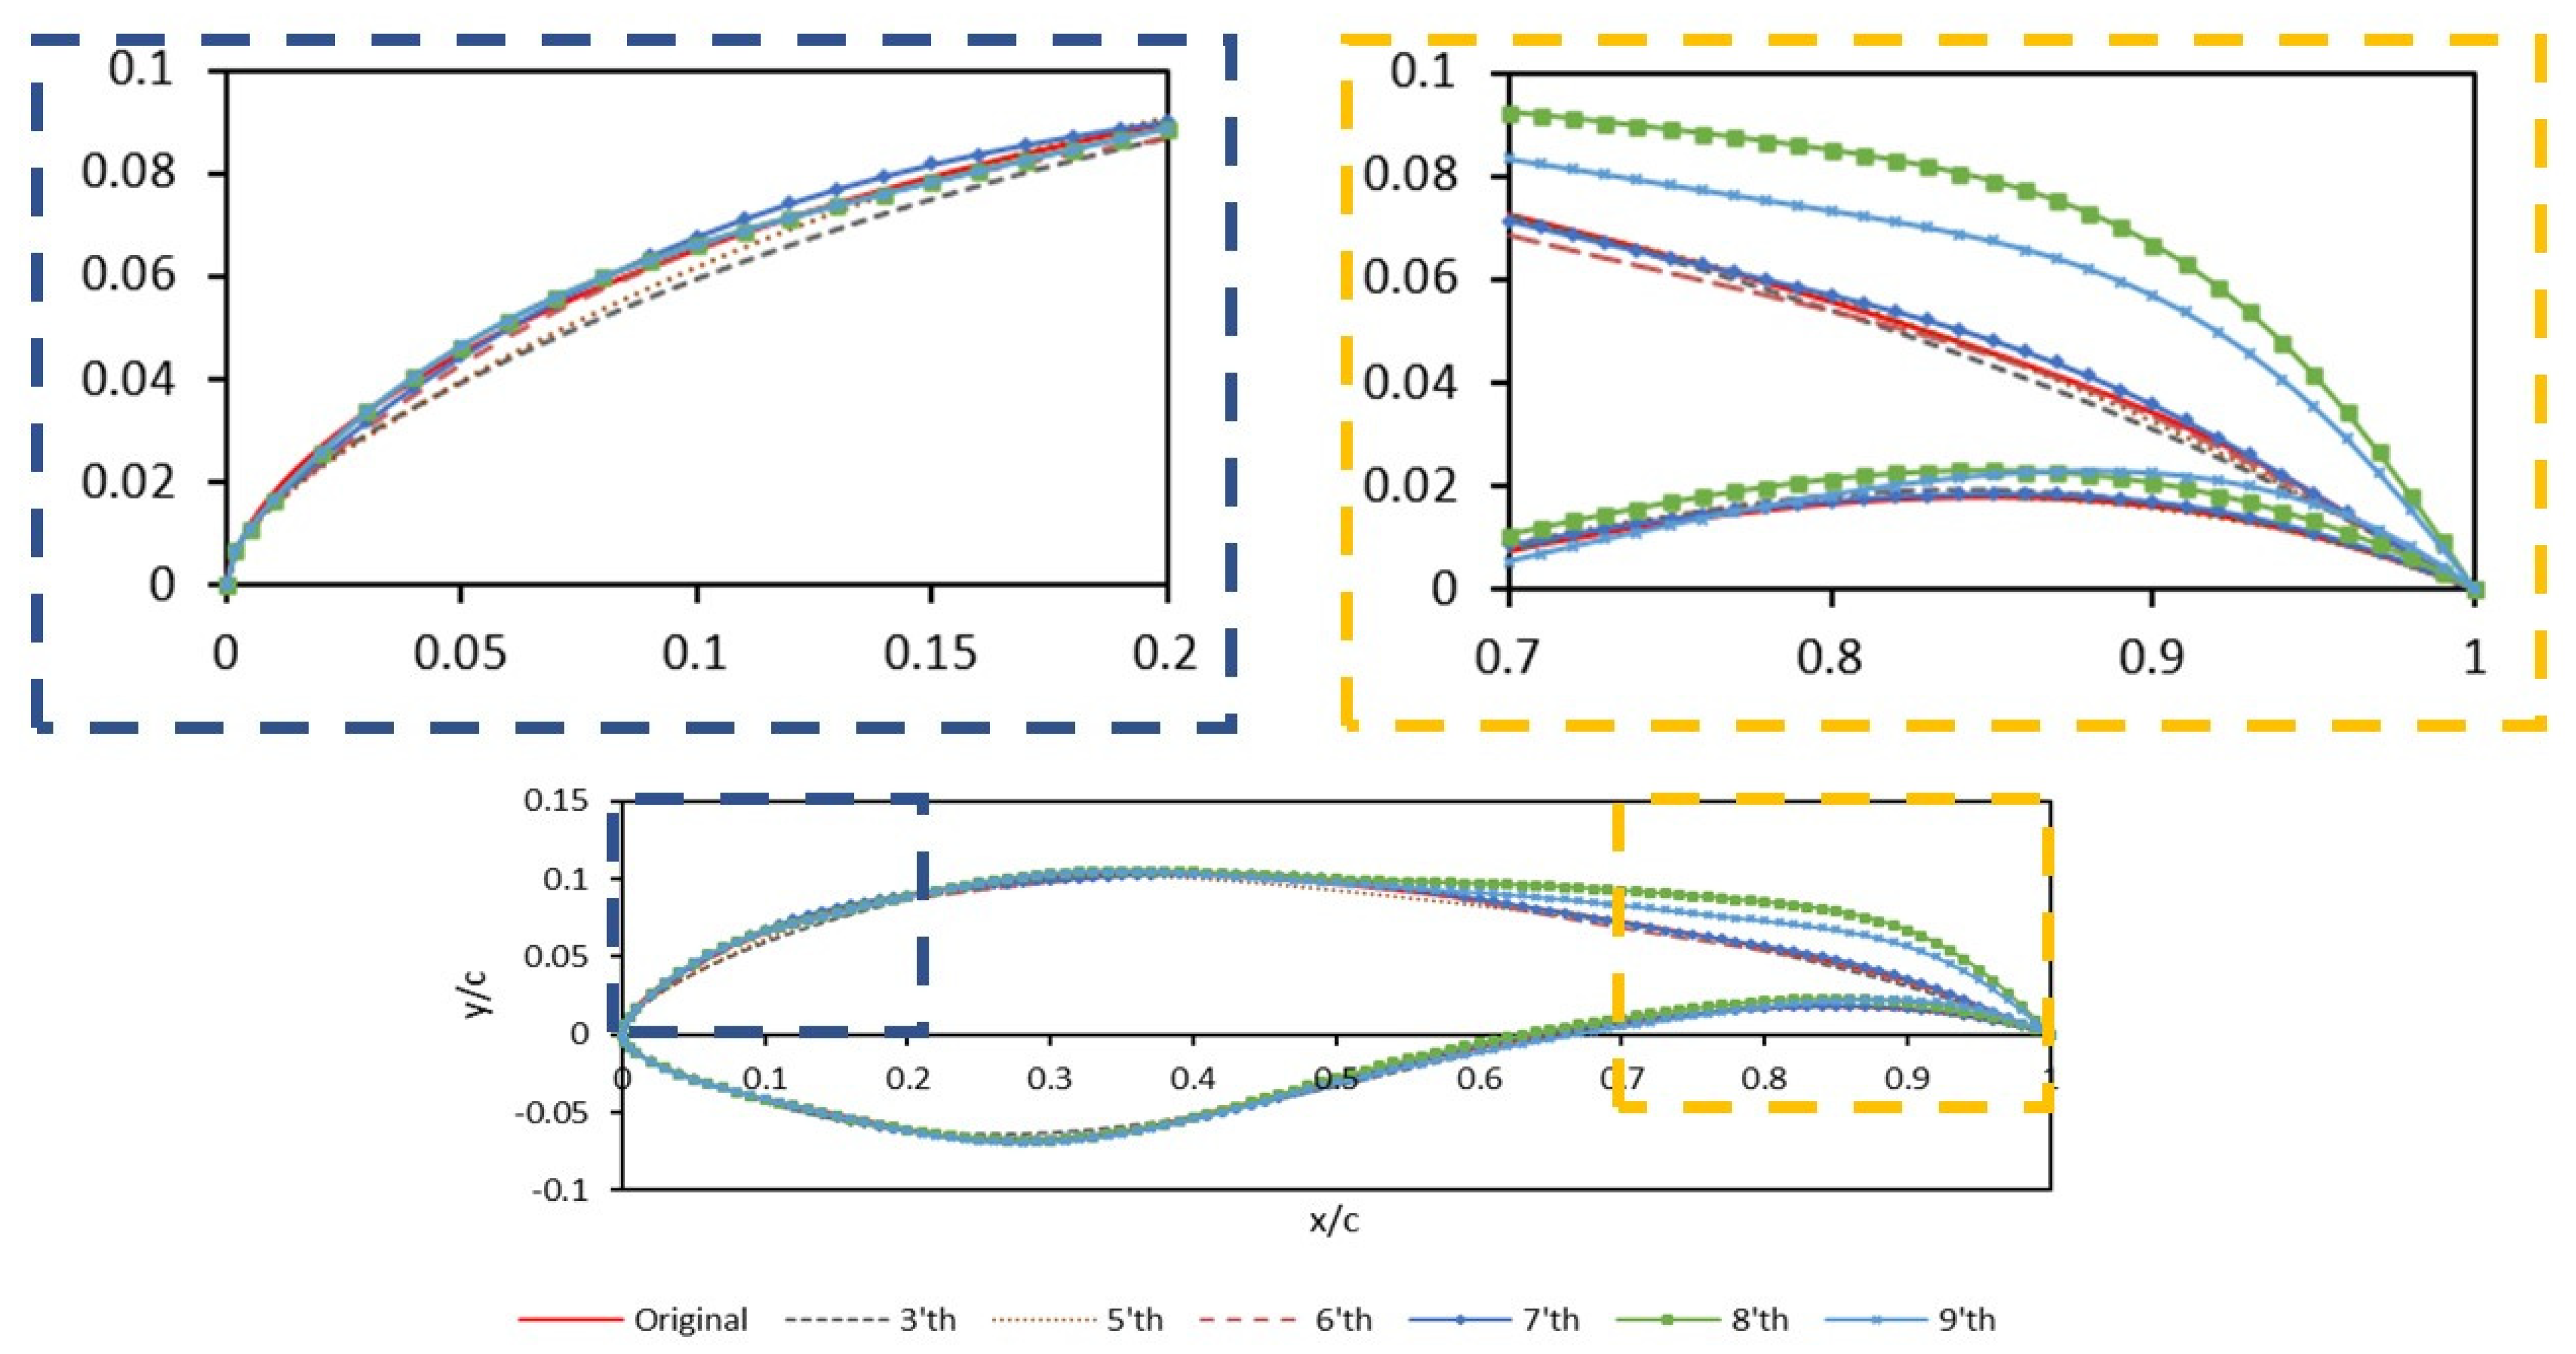
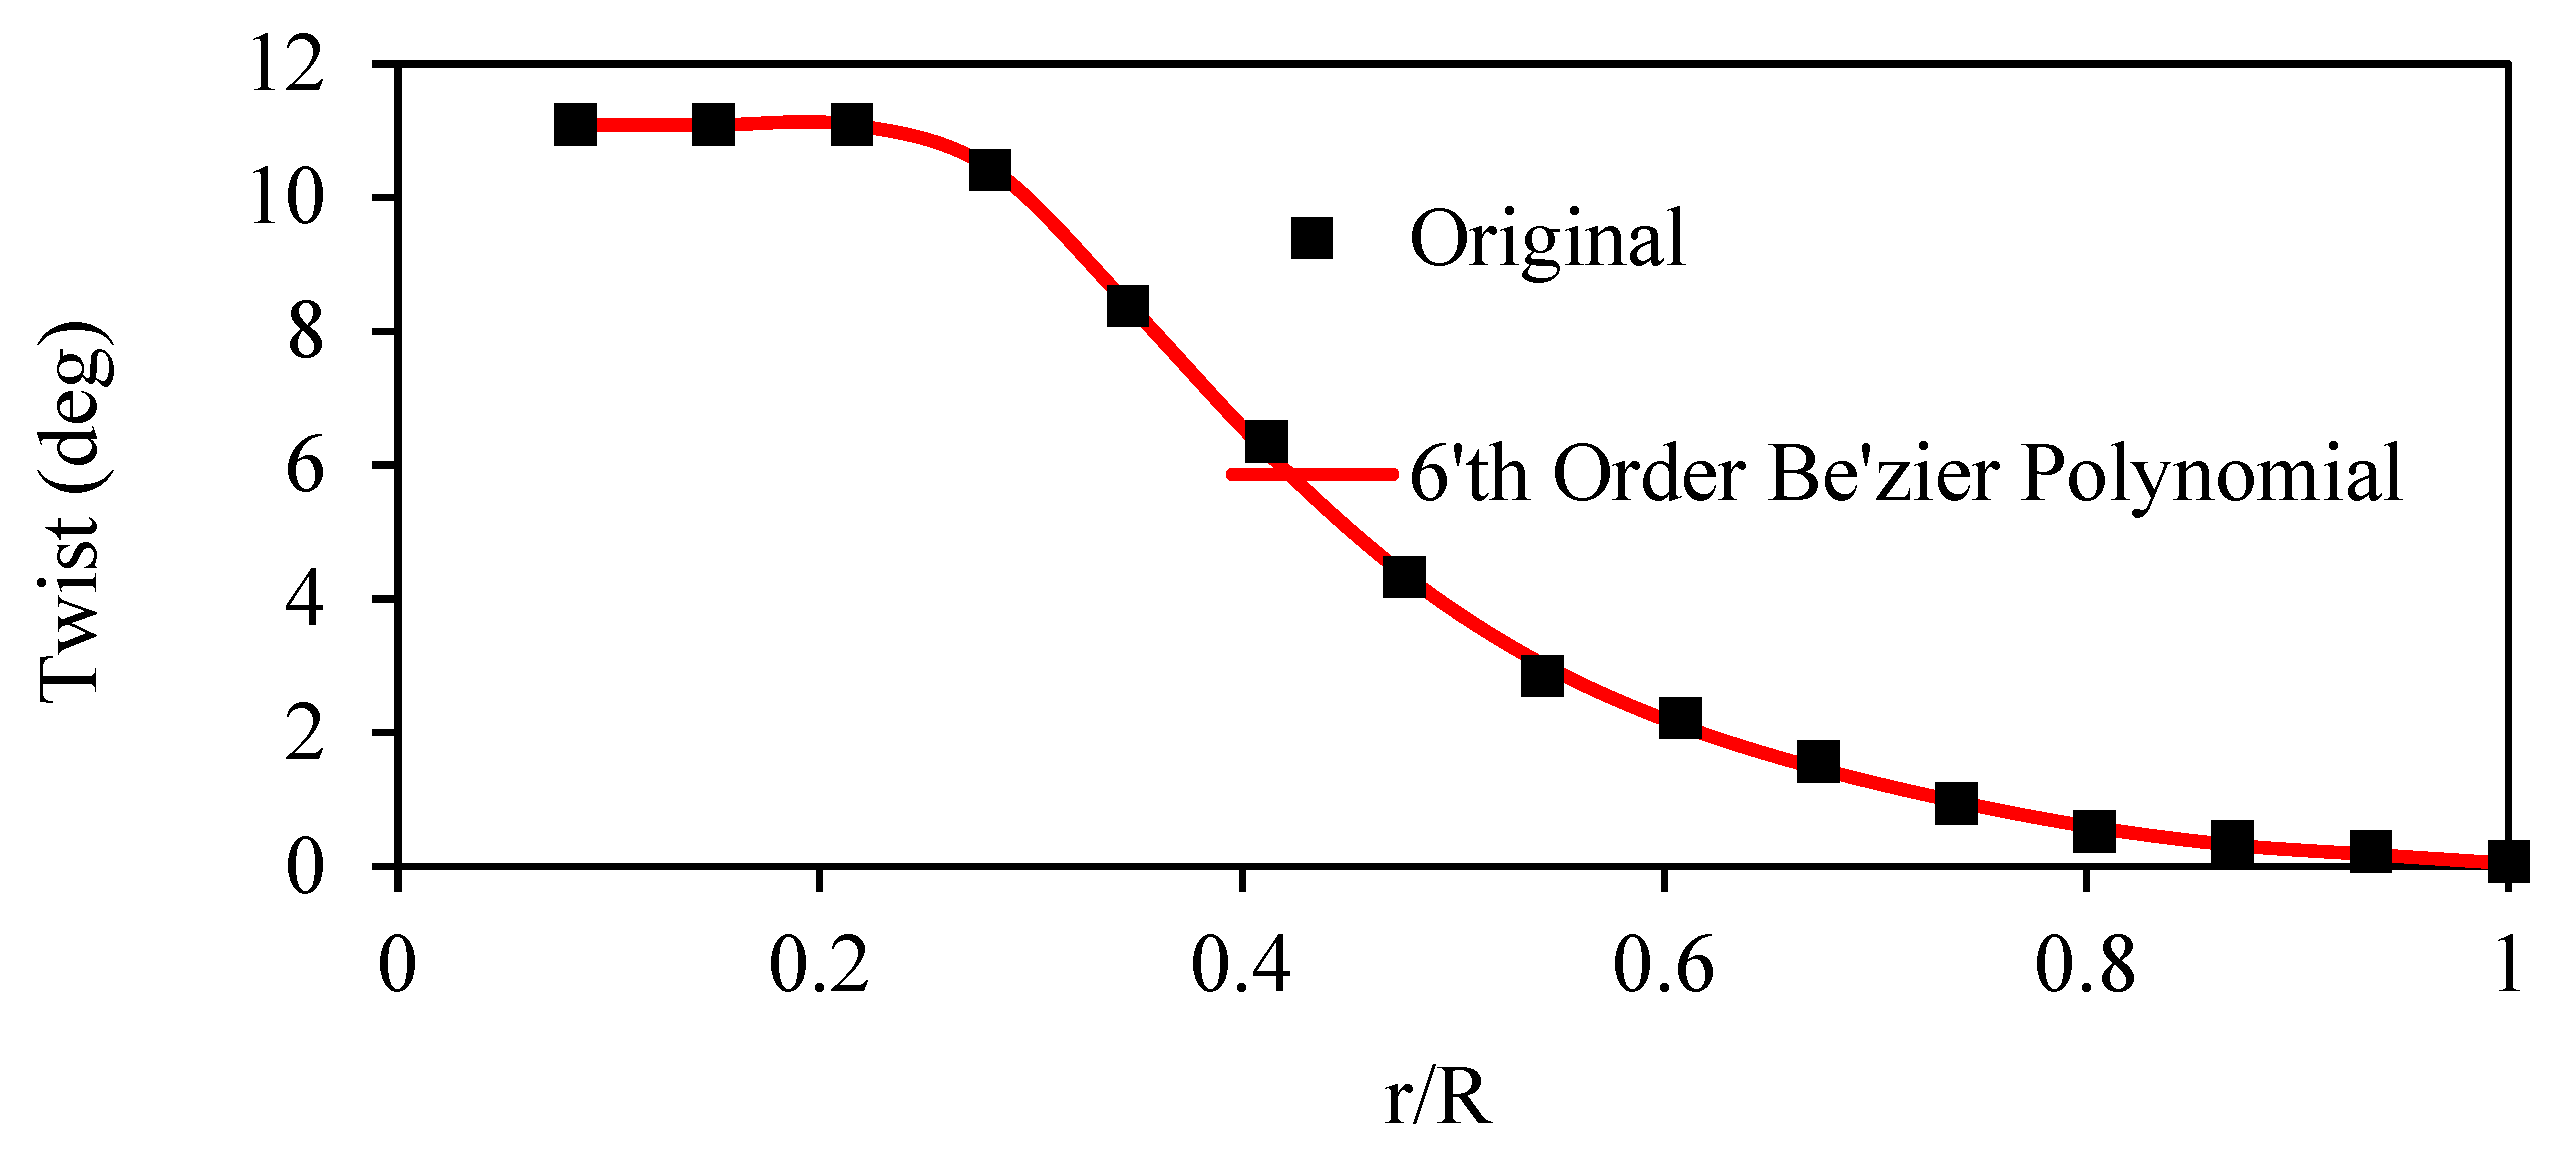
3.1. Geometry Parameterization Using CST
3.2. Airfoil Aerodynamic Data Validation
4. Optimization of WP-Baseline Wind Turbine Blade
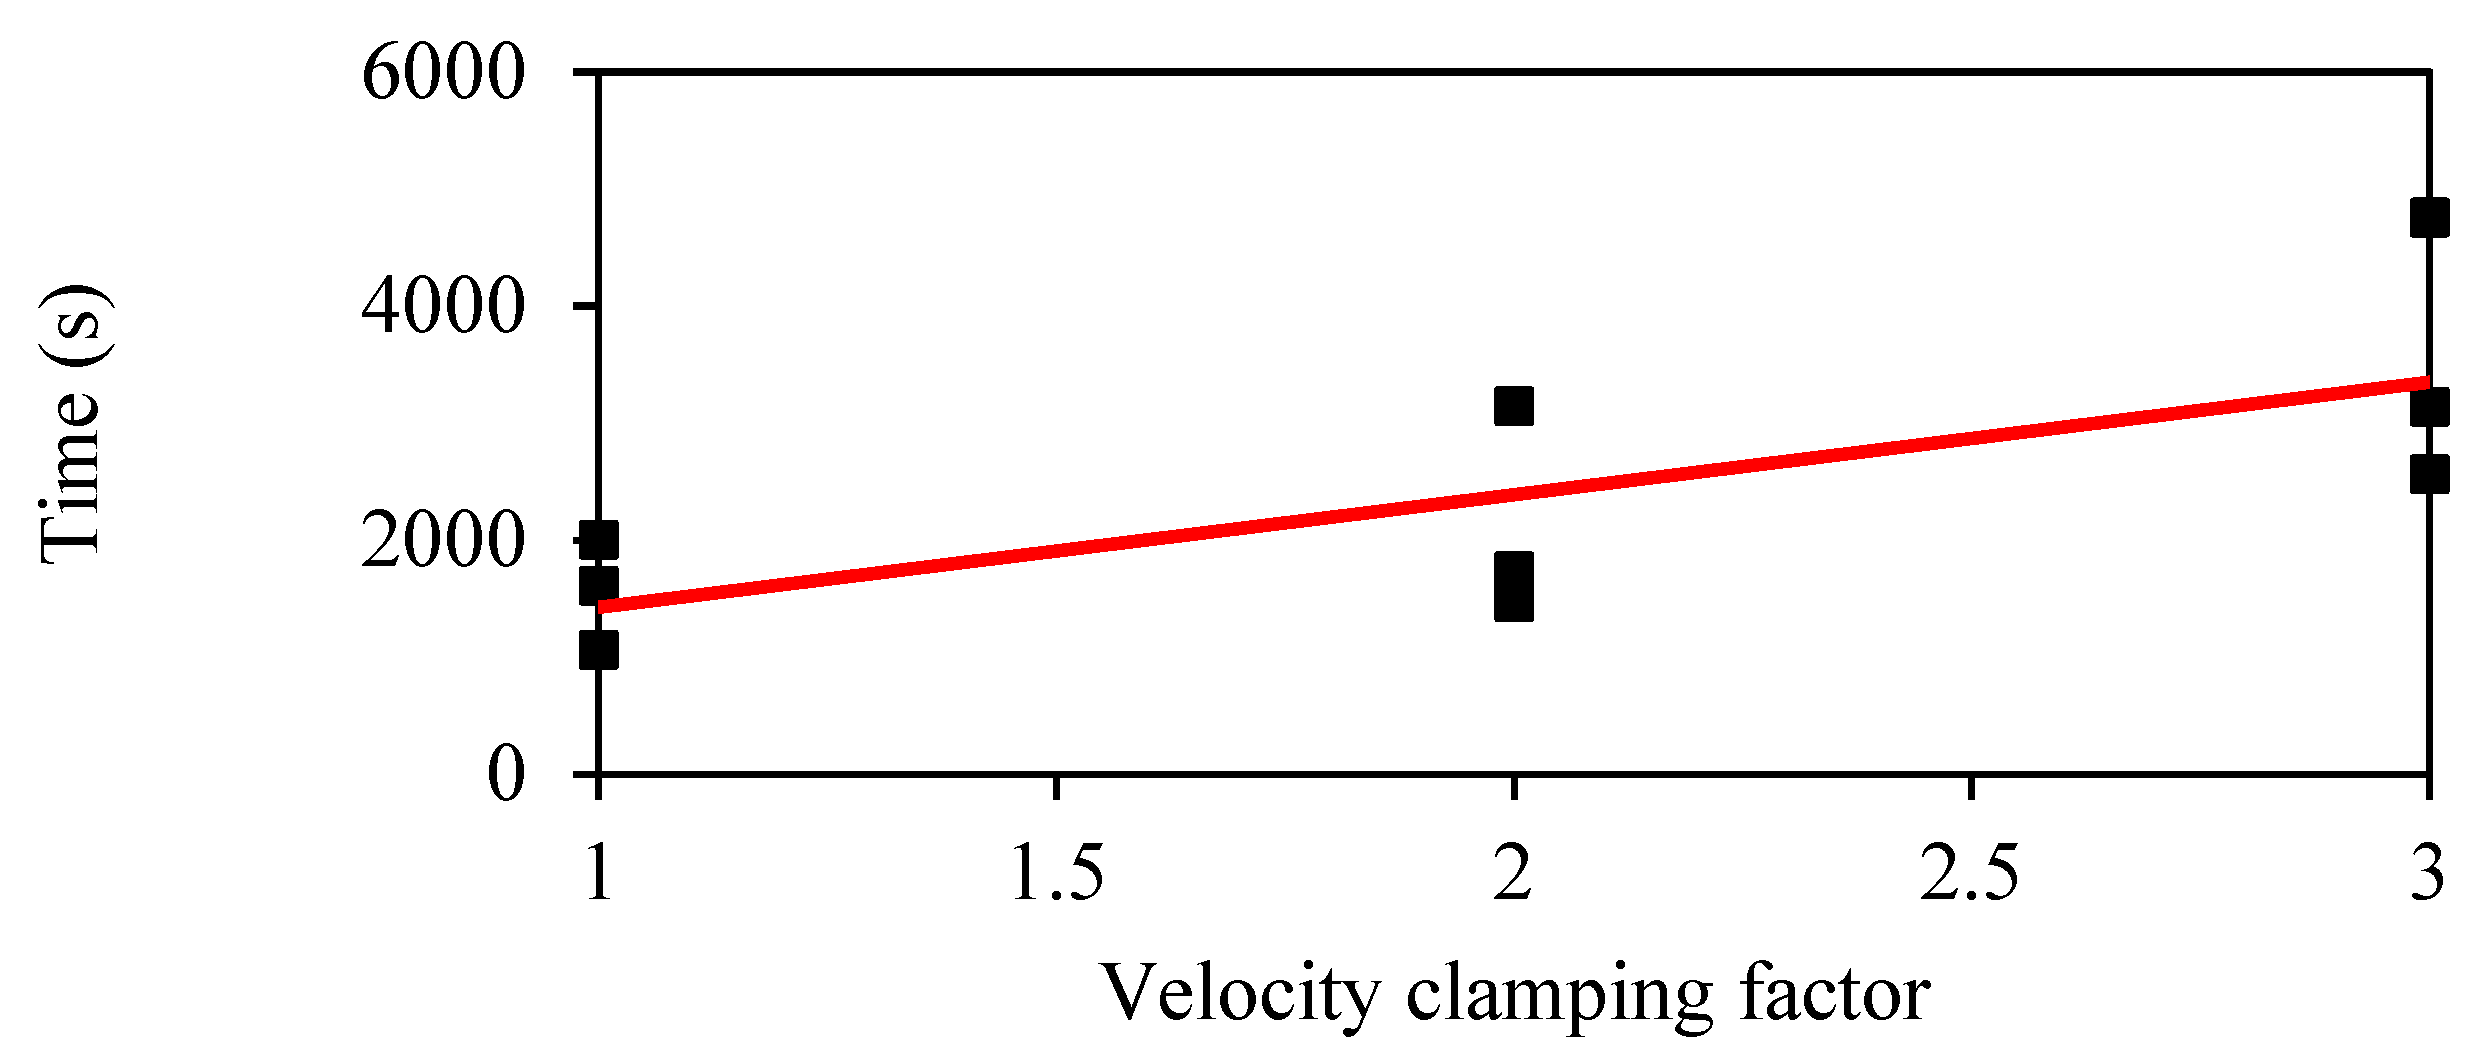
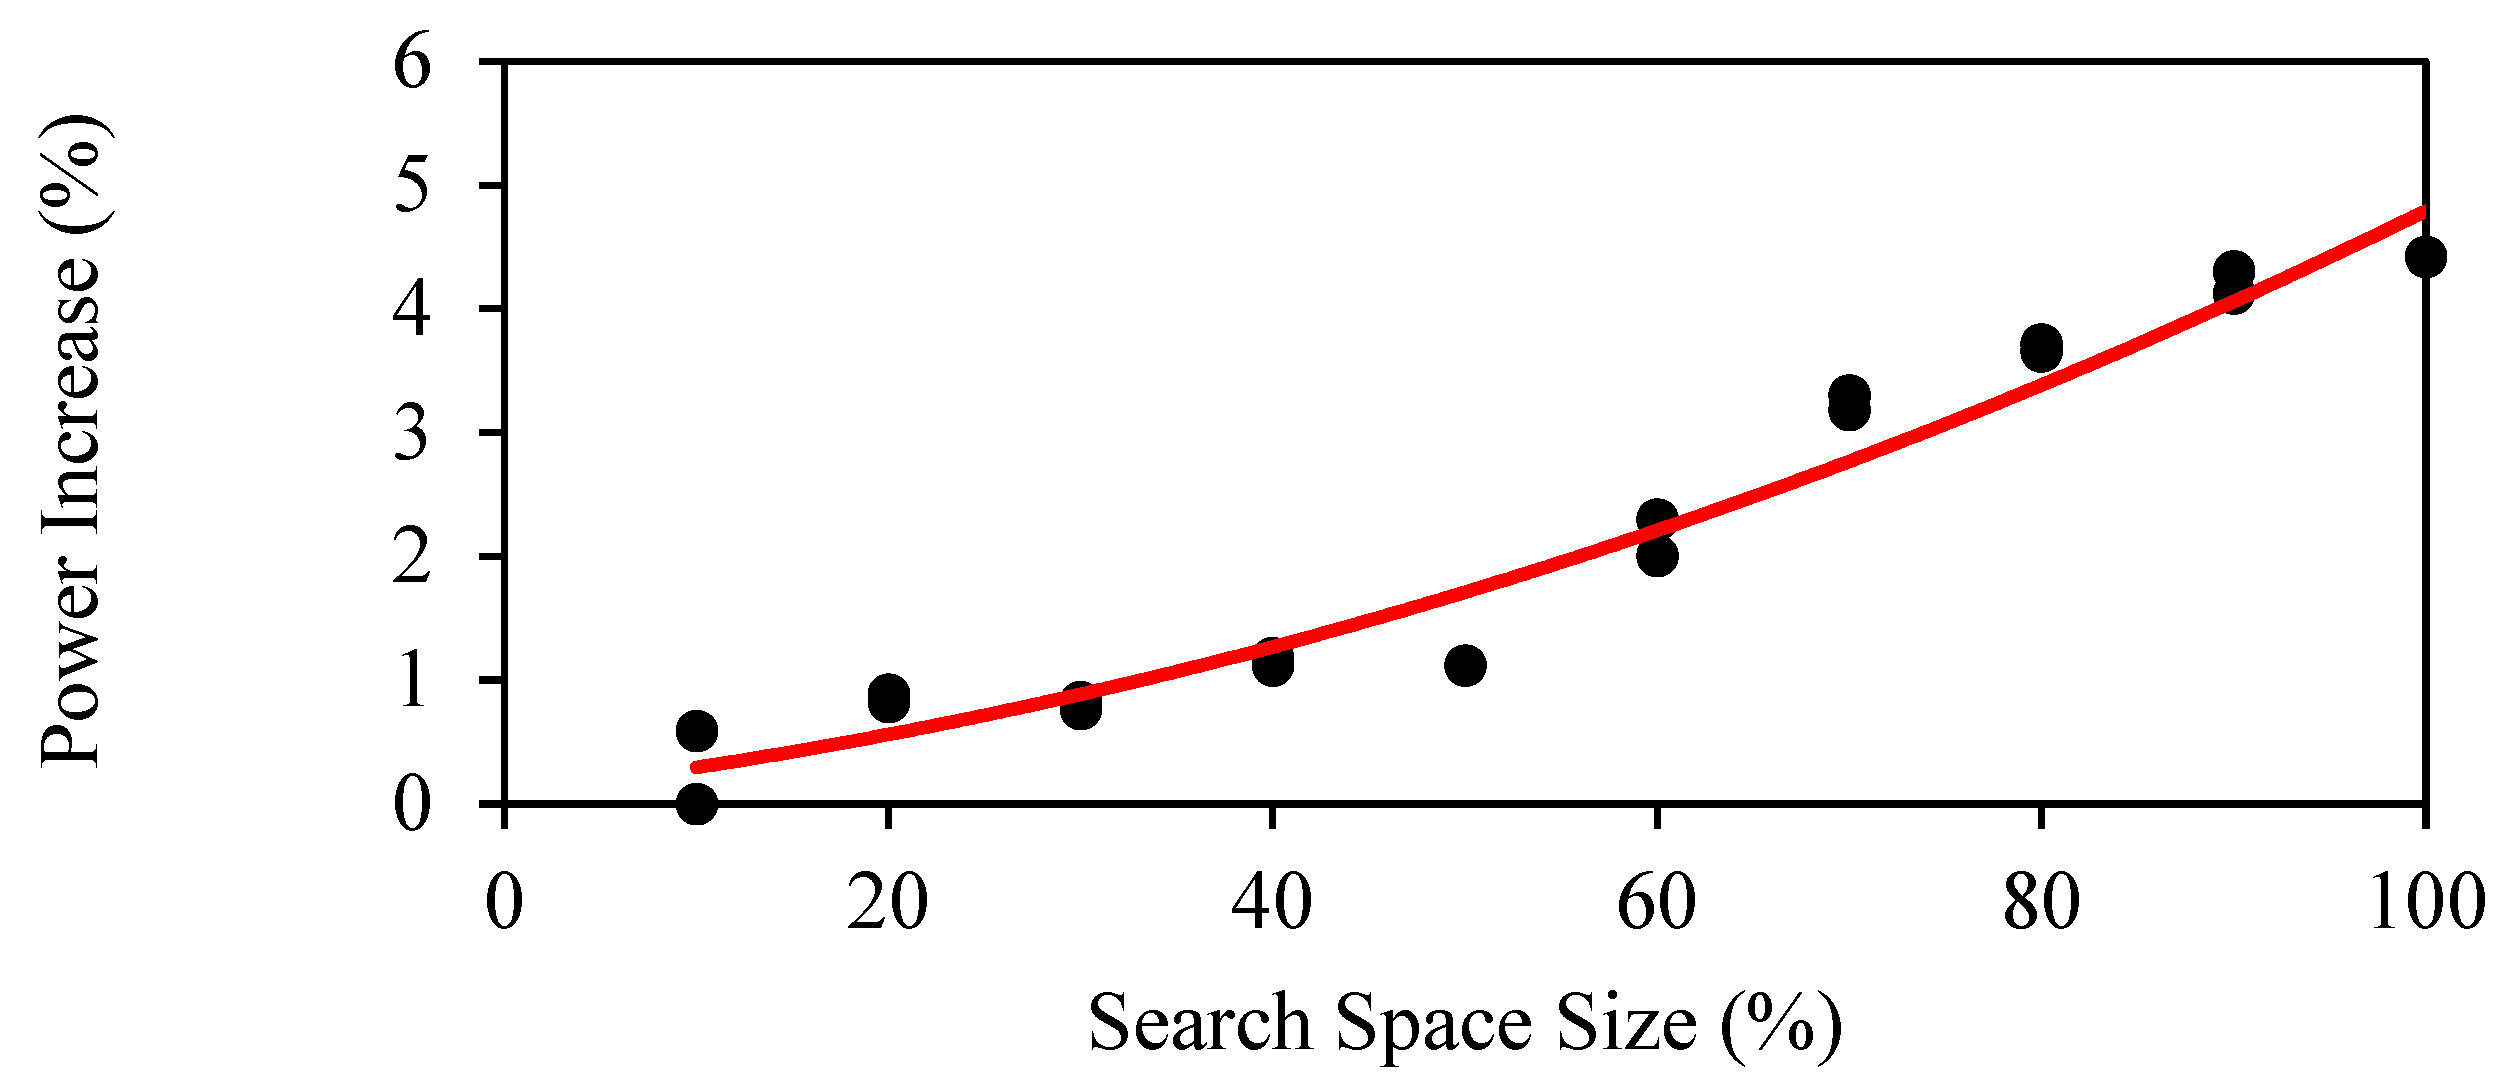
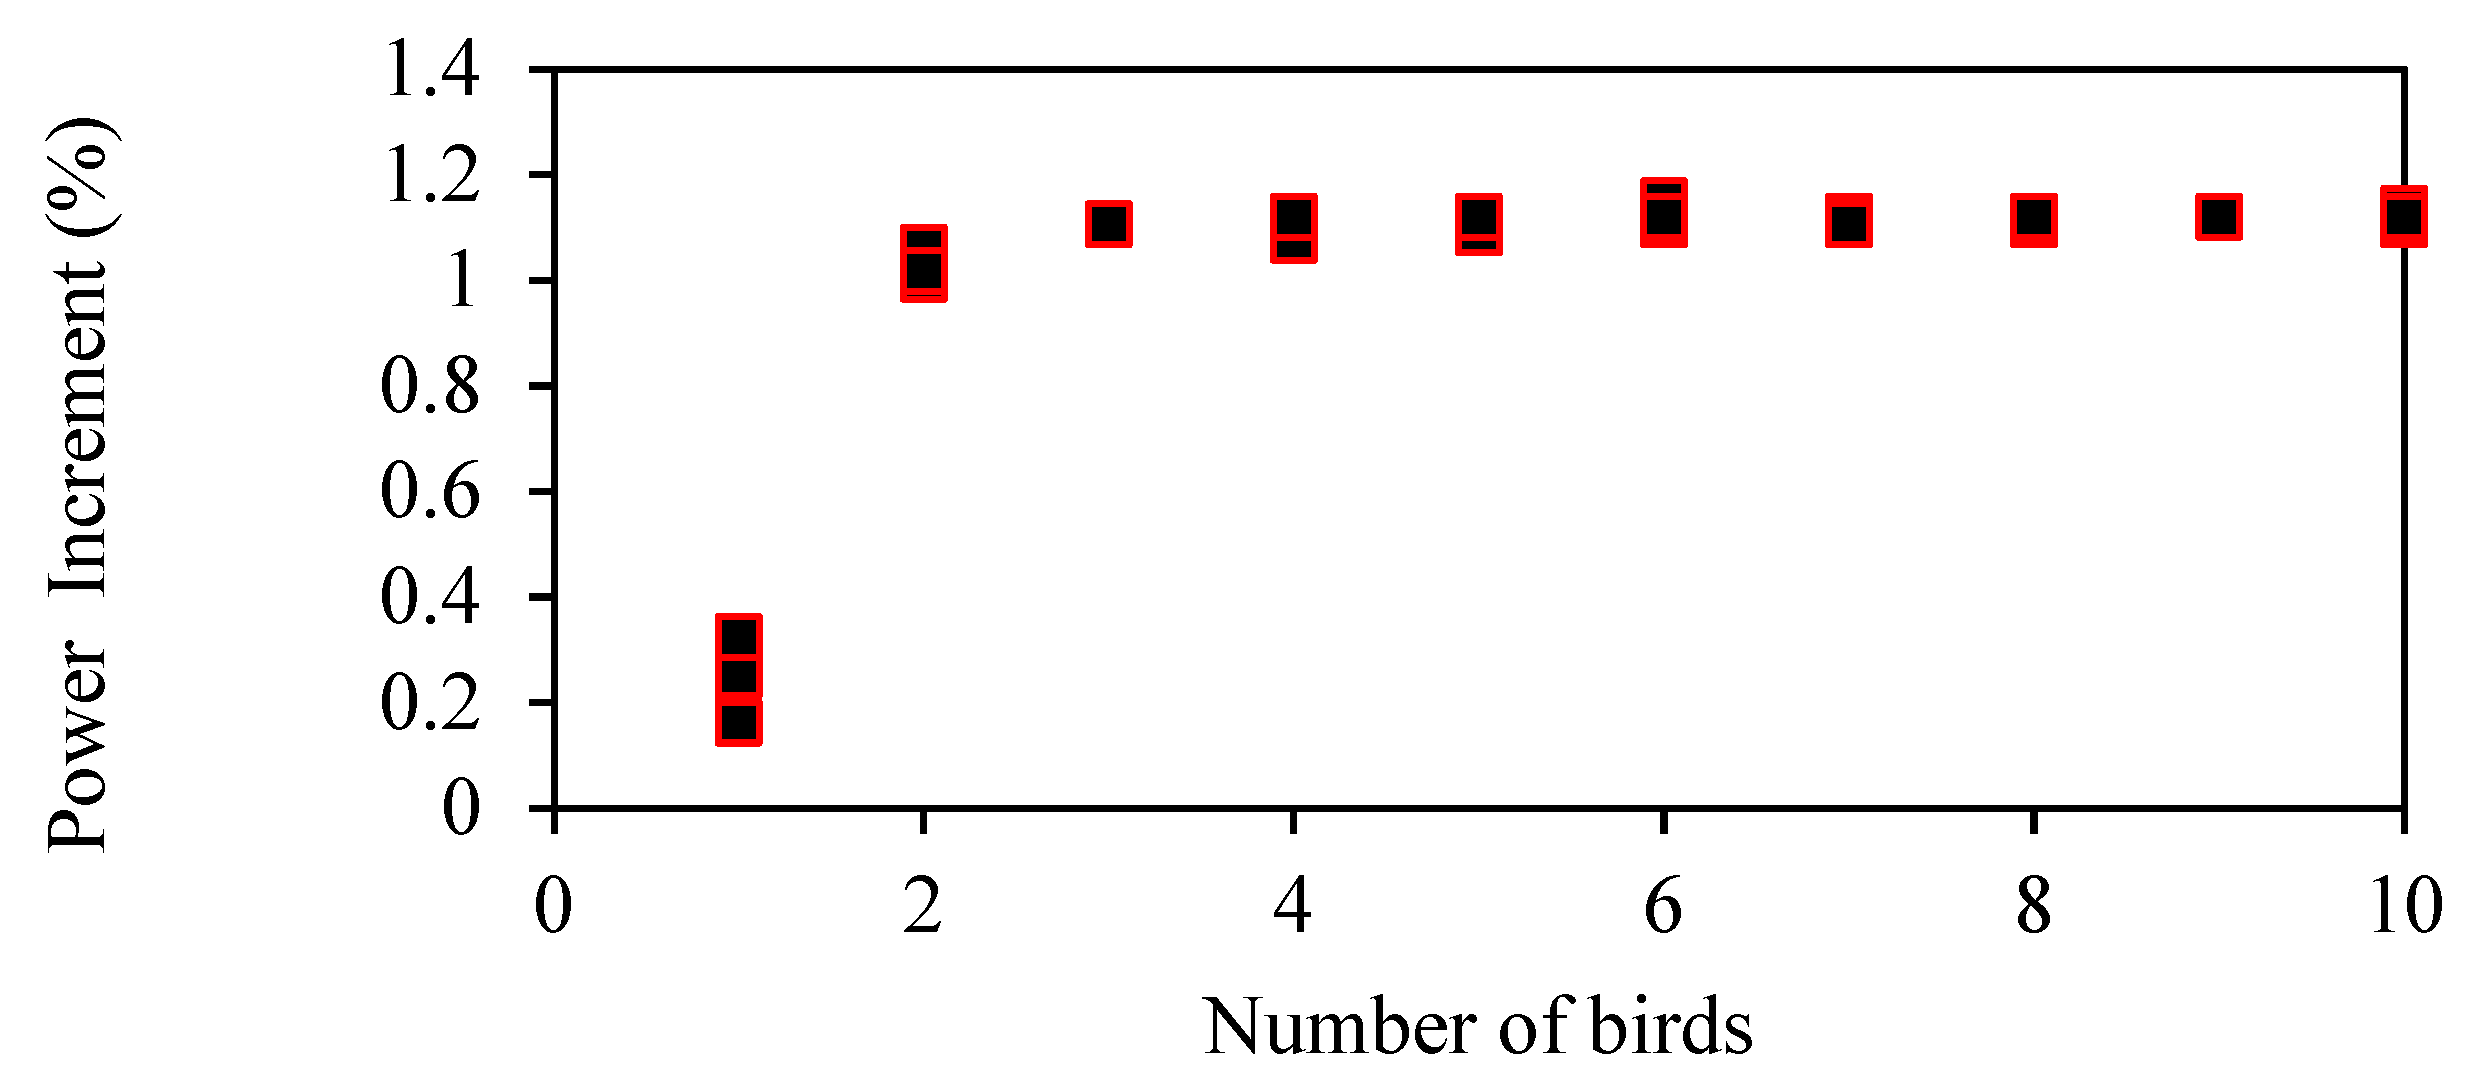
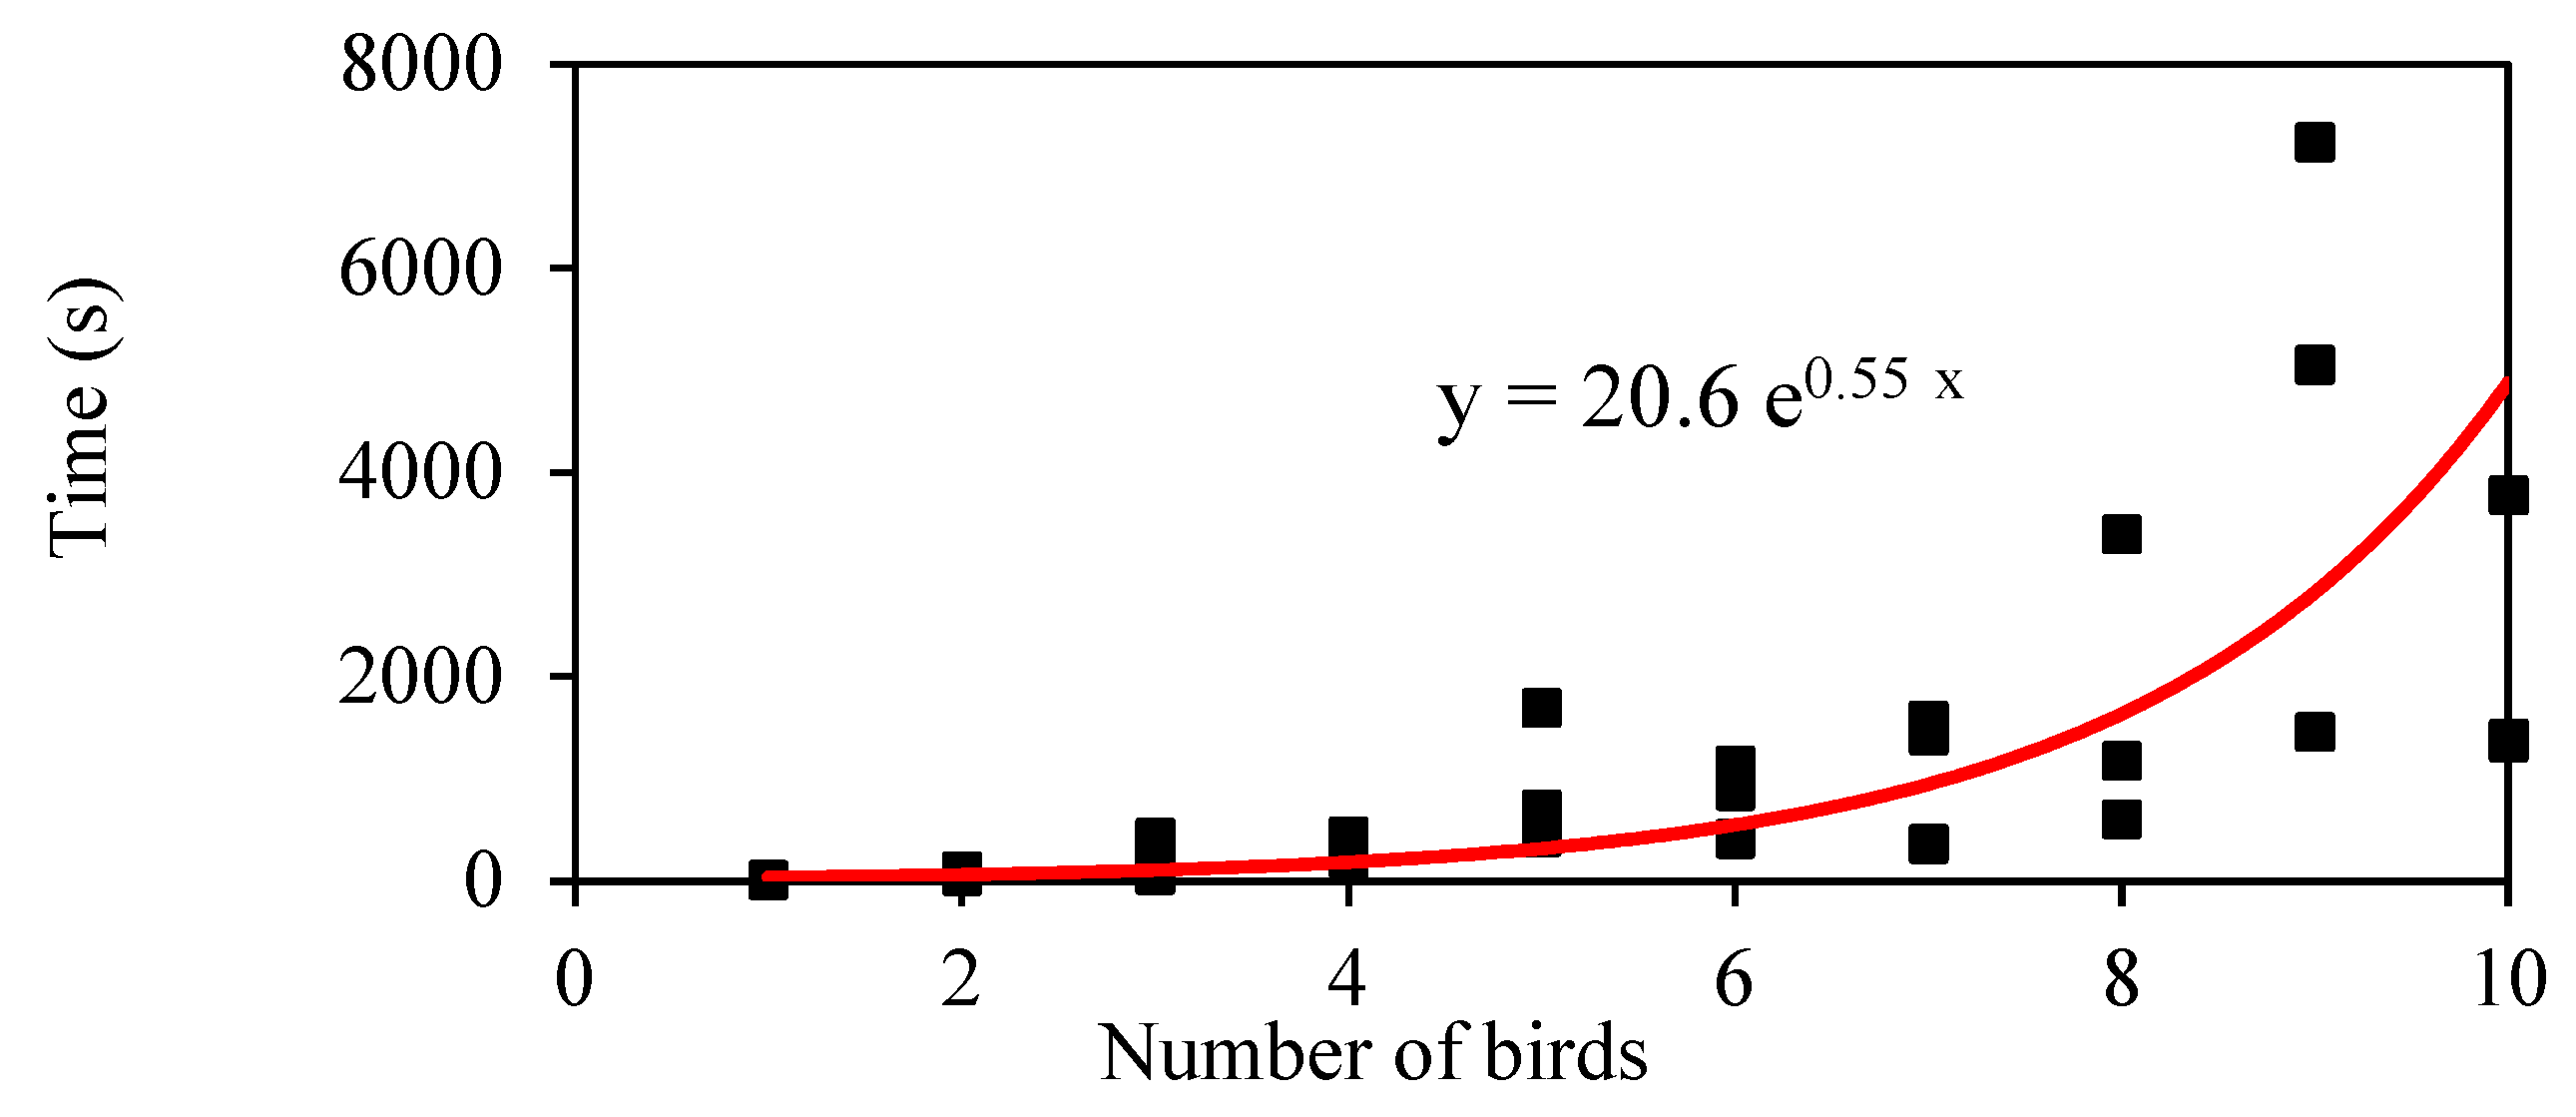
4.1. PSO Parametric Study for Blade Optimization
- Choosing an efficient and cost-effective number of birds to cooperate in the food search;
- Selecting the search space boundaries (for food);
- Appropriate speed of birds for food search;
- Convergence criteria for final location of birds (location of maximum food);
- Effects of individual knowledge (influenced by the cognitive constant, );
- Experience gained from the community (influenced by the social factor, ).
- Twist angle ≥ −2 degrees
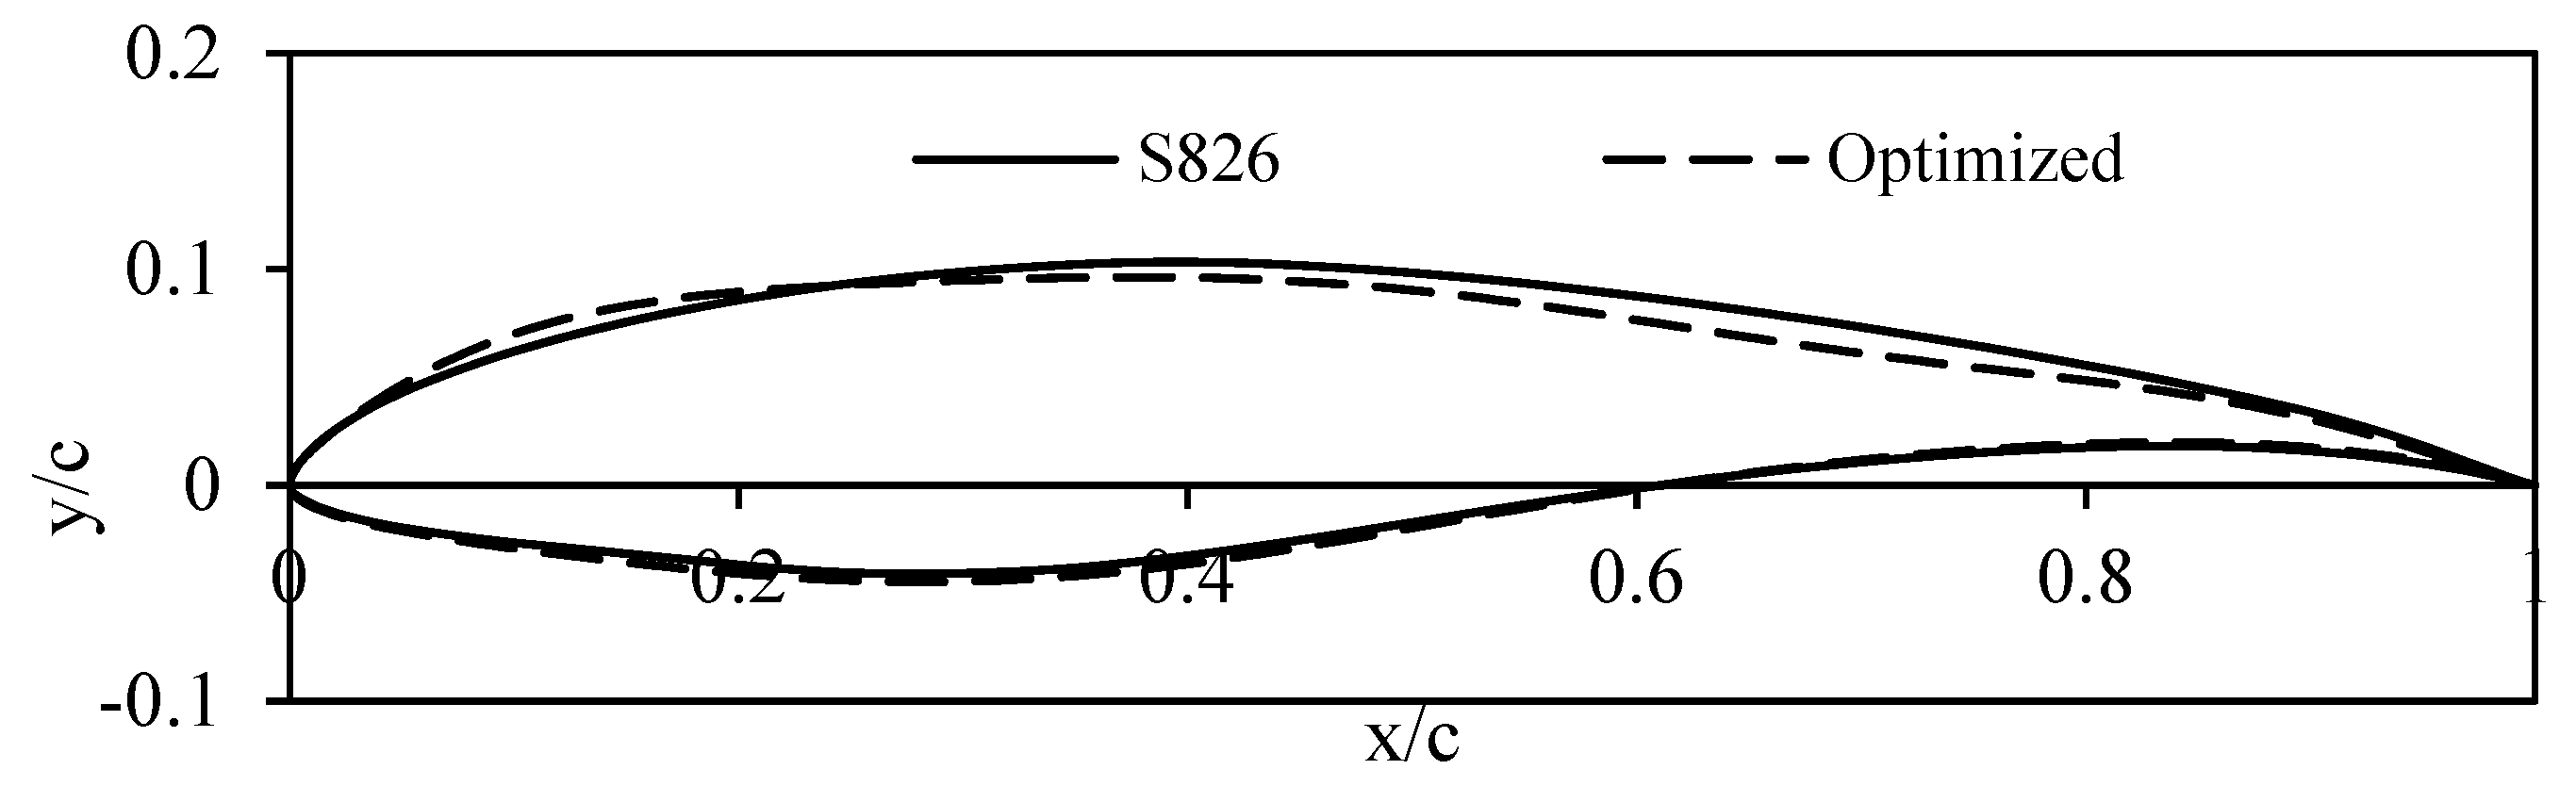
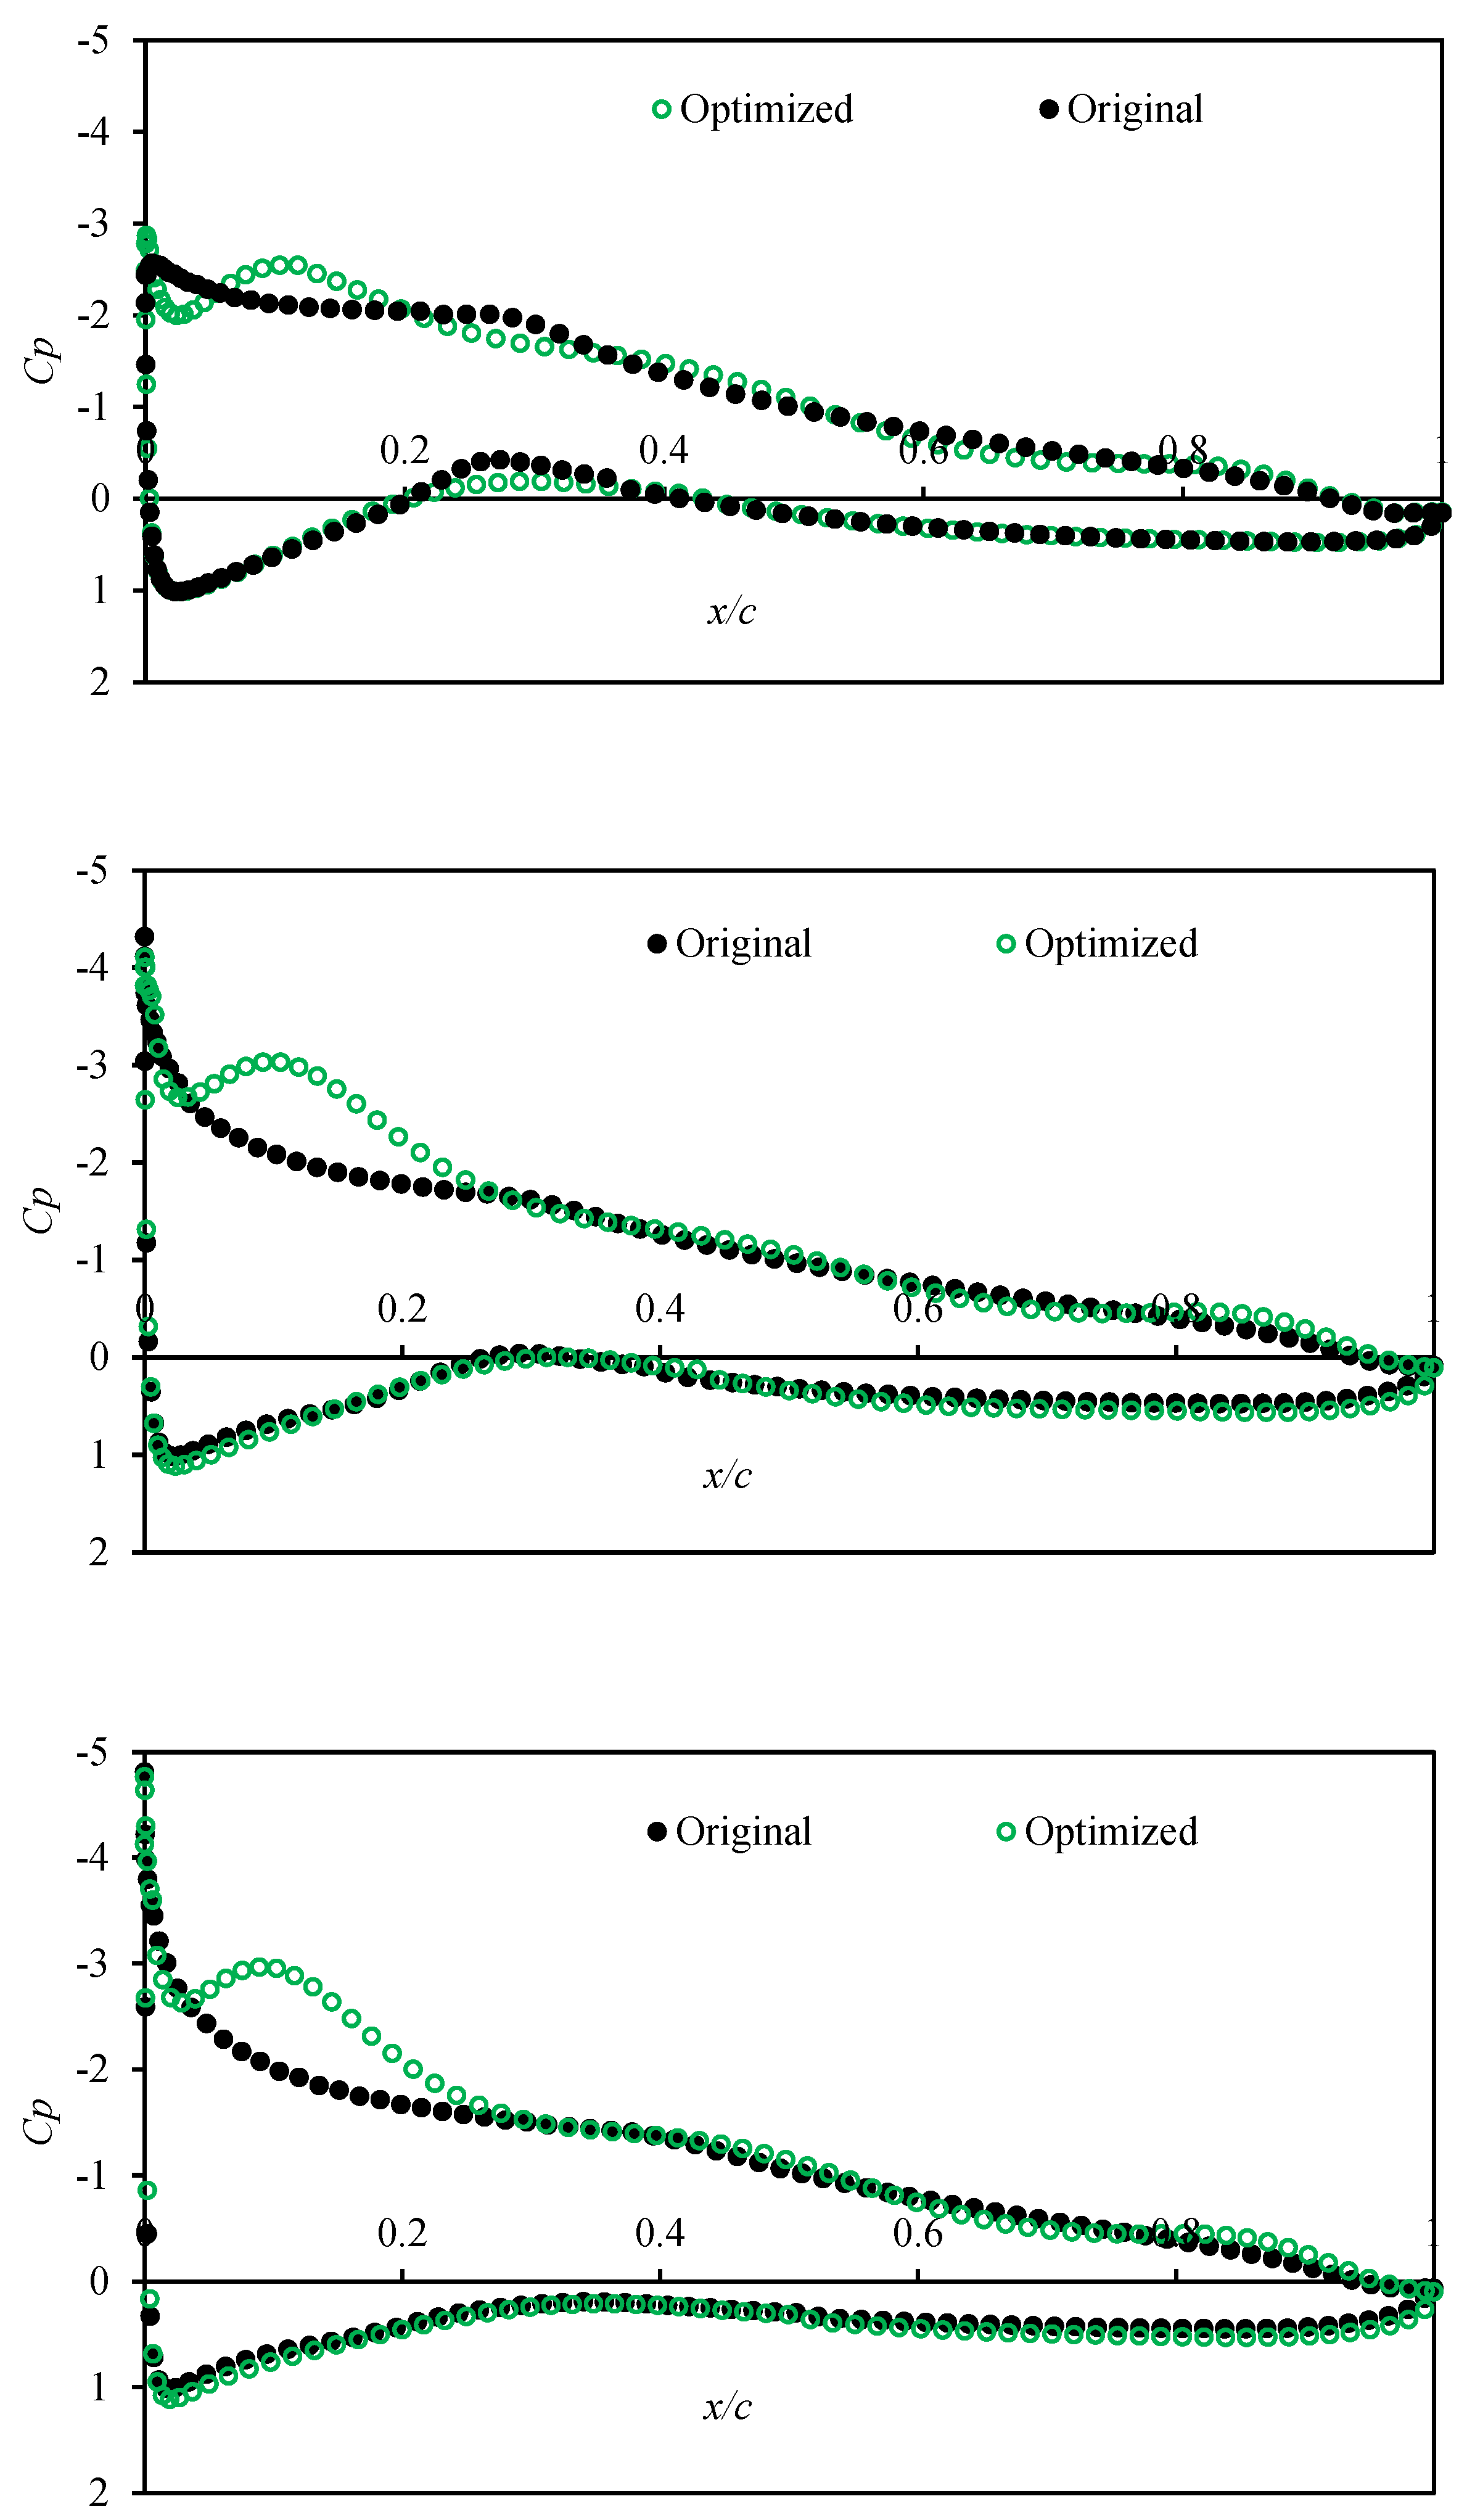
4.2. Airfoil Optimization
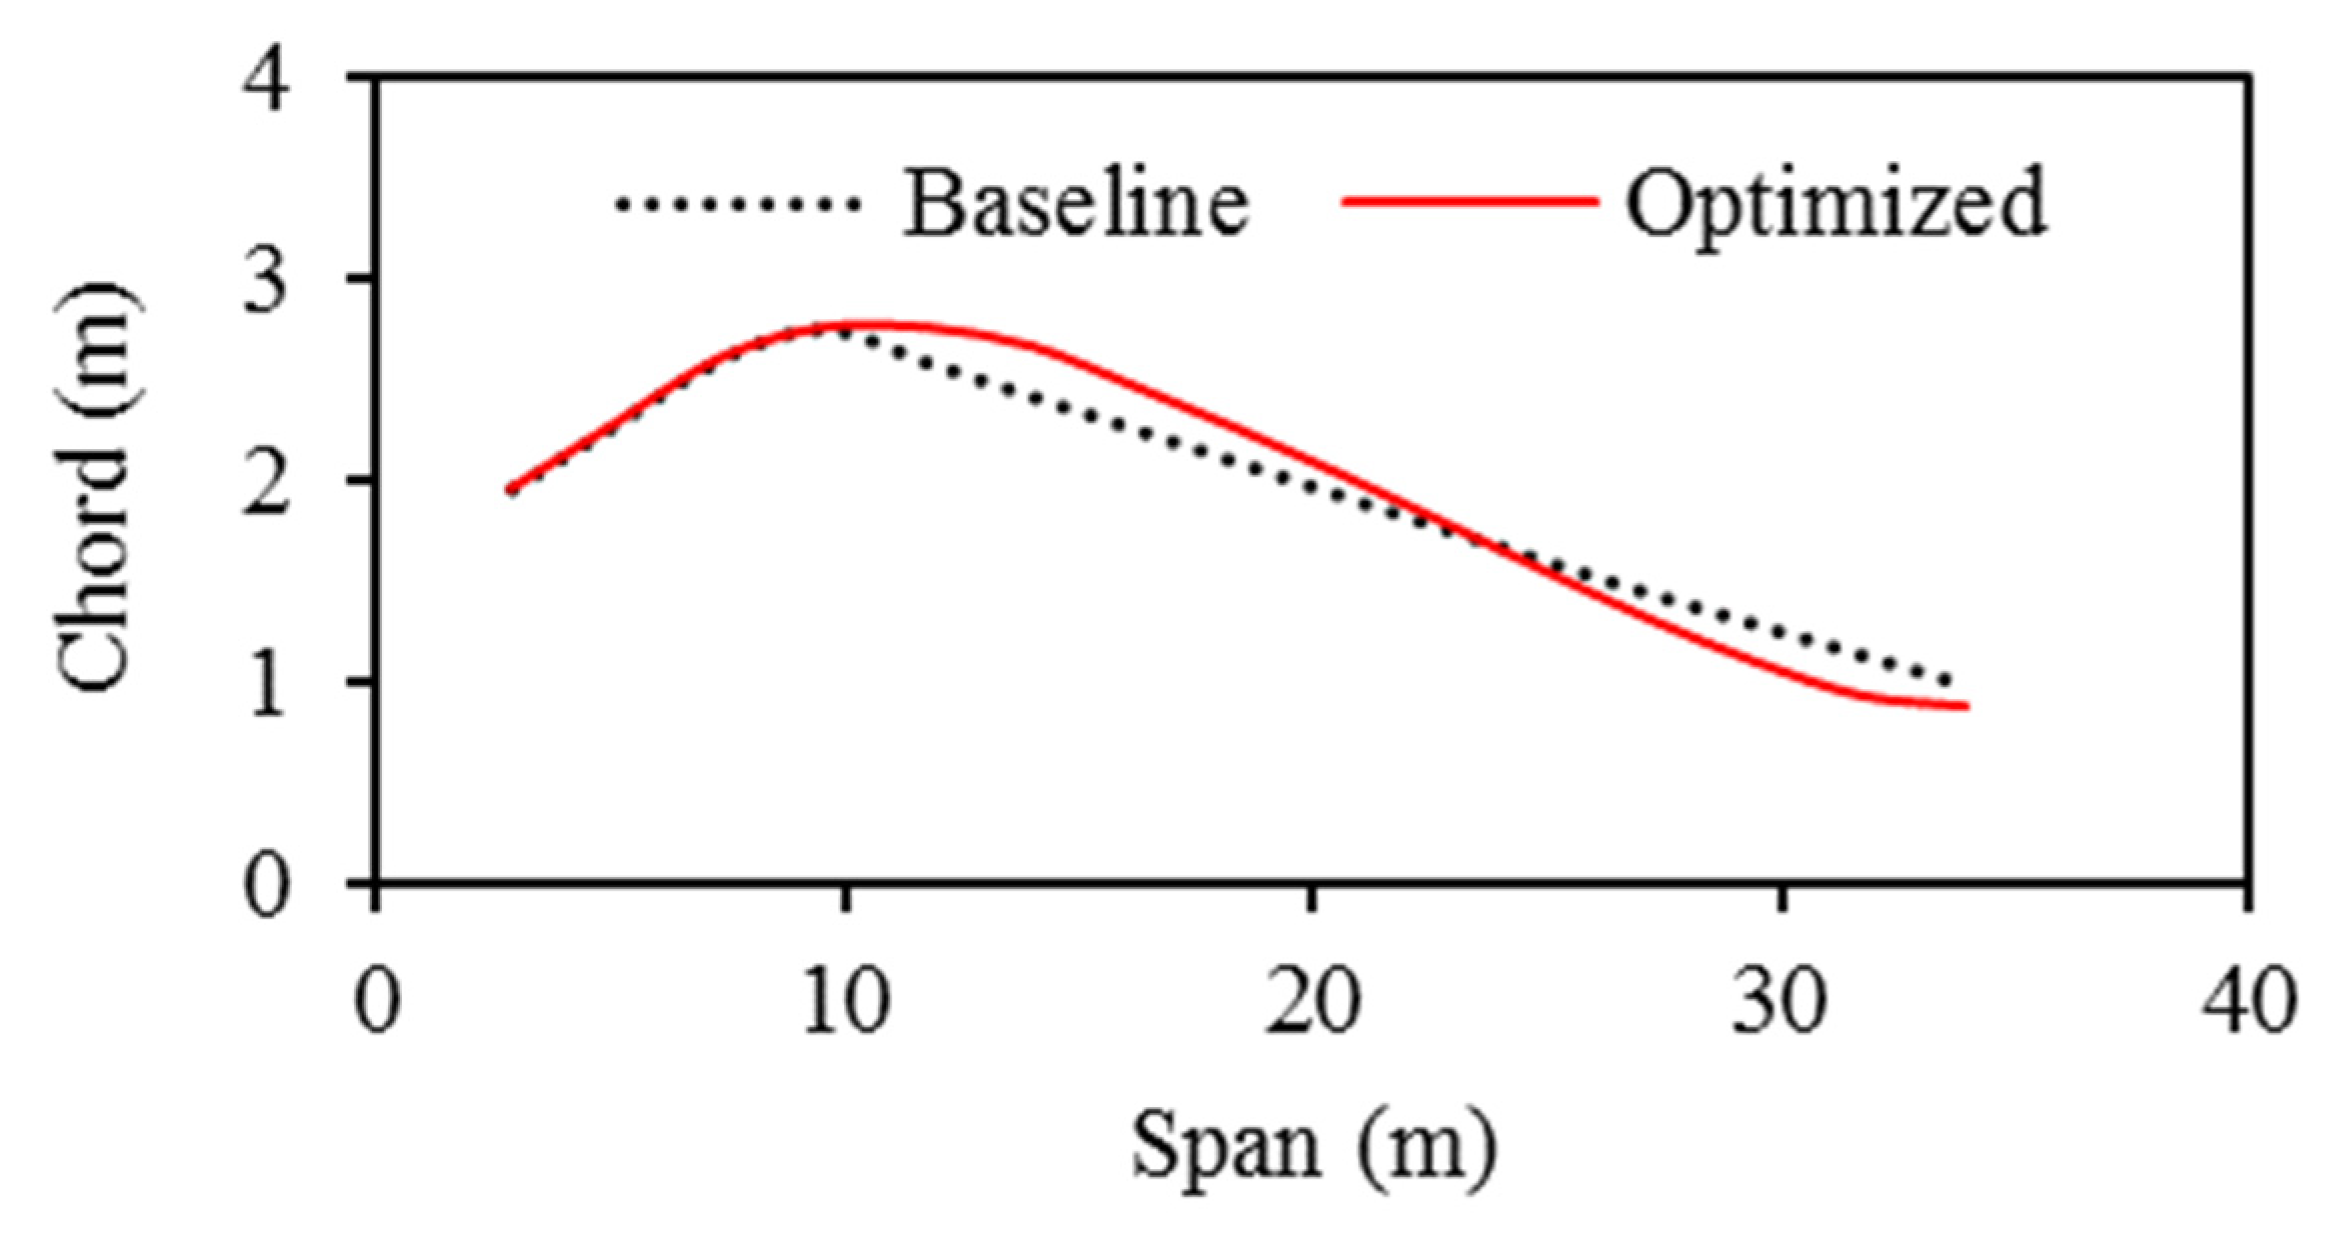
4.3. Chord Optimization
- Maximum chord length of the optimized blade original blade’s maximum chord;
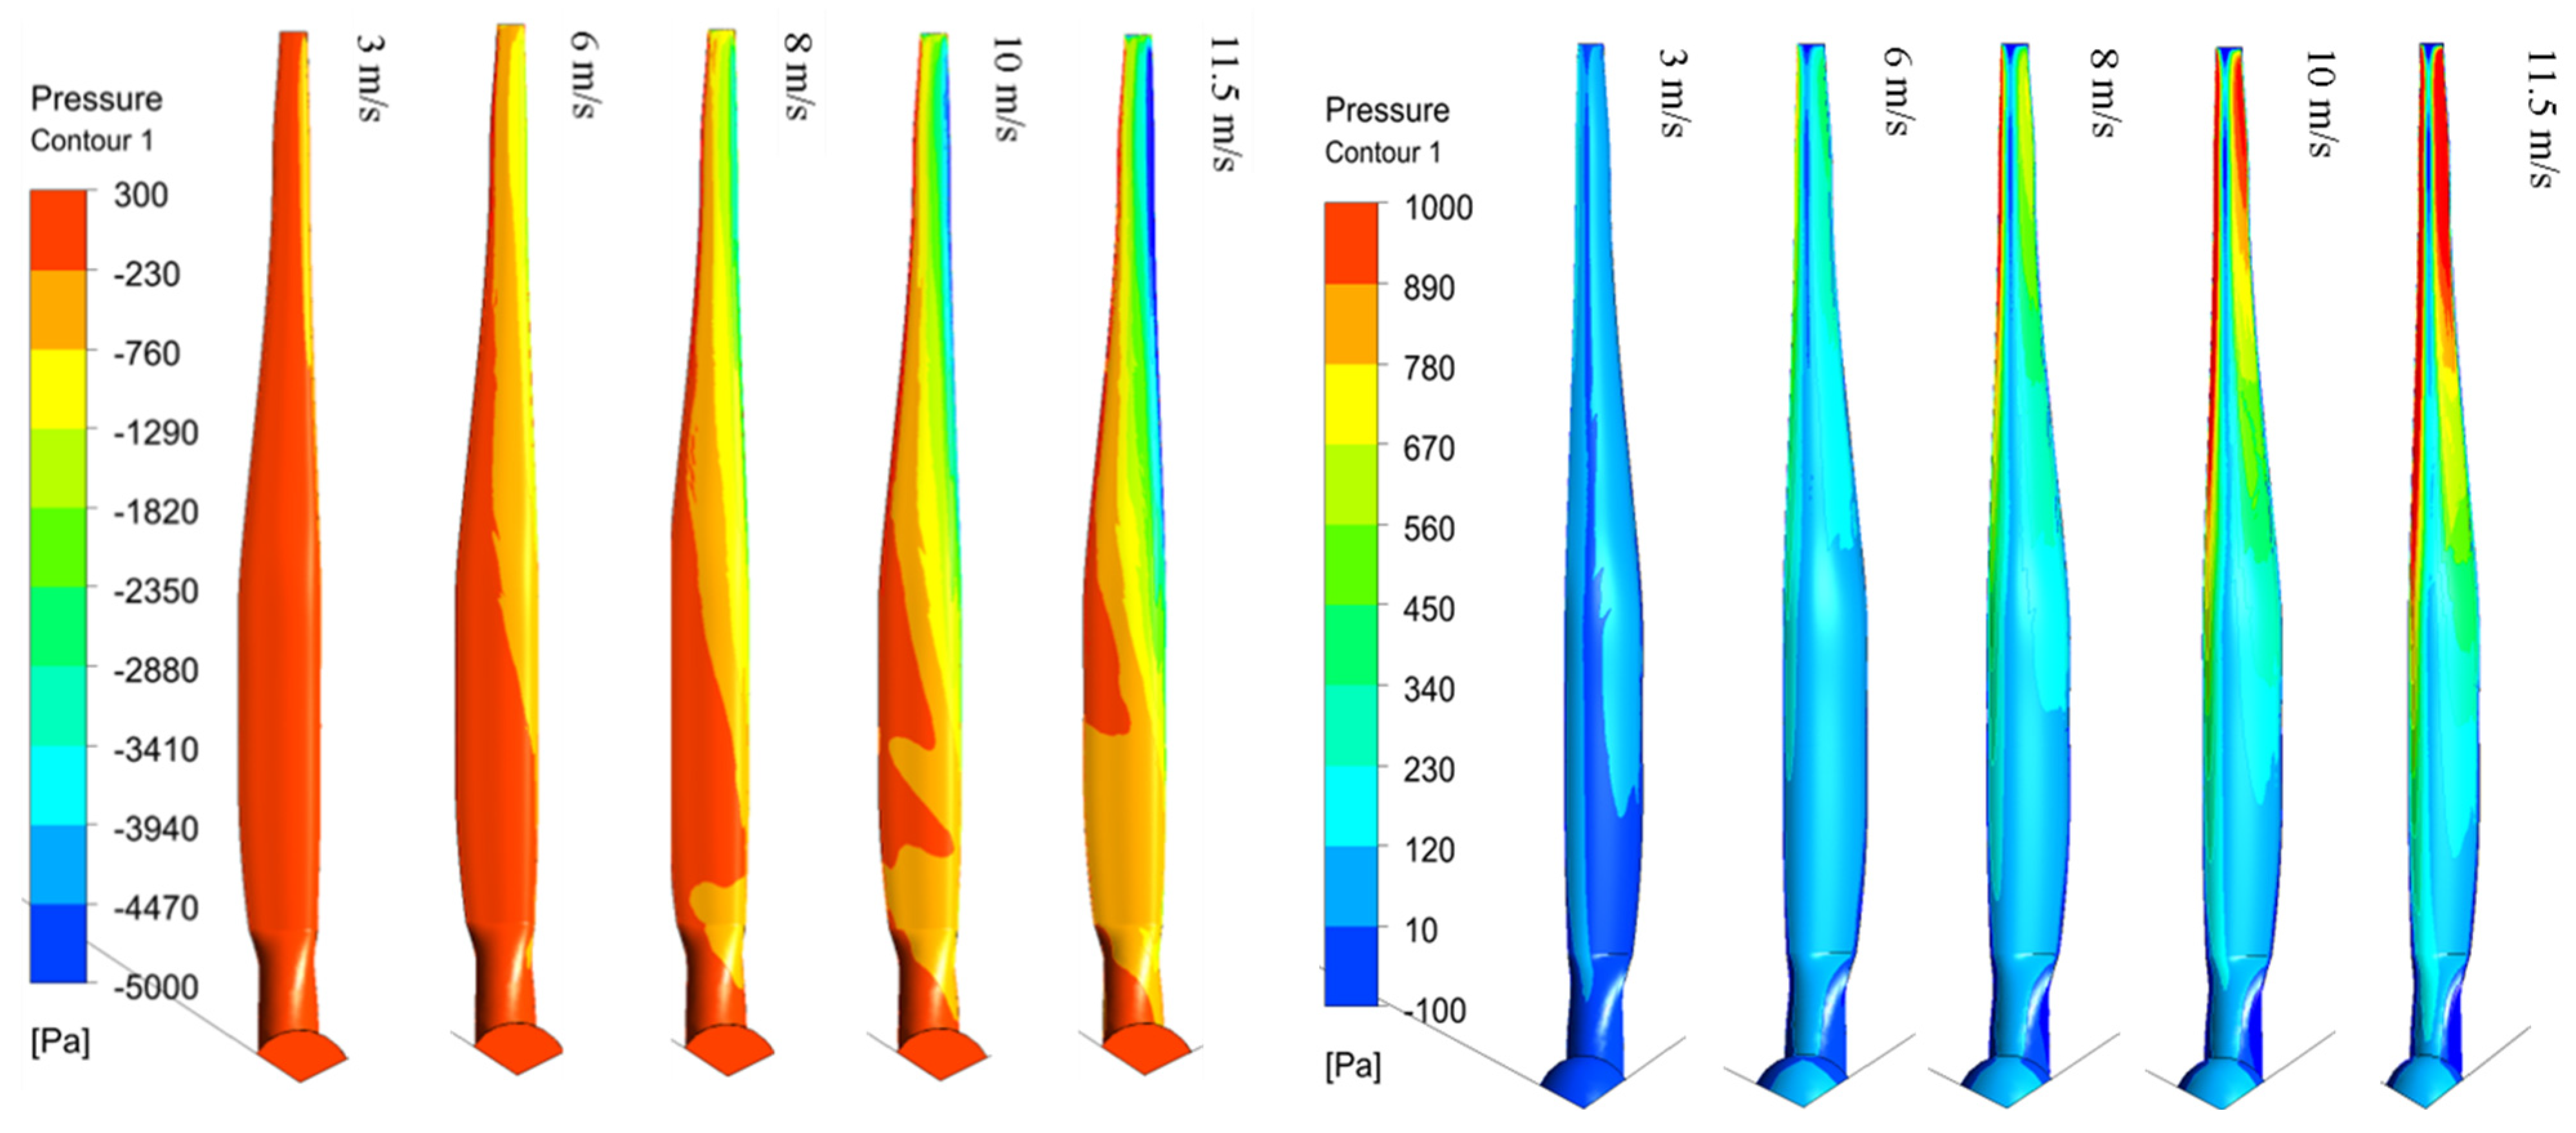
5. Validation of the Optimized Blade
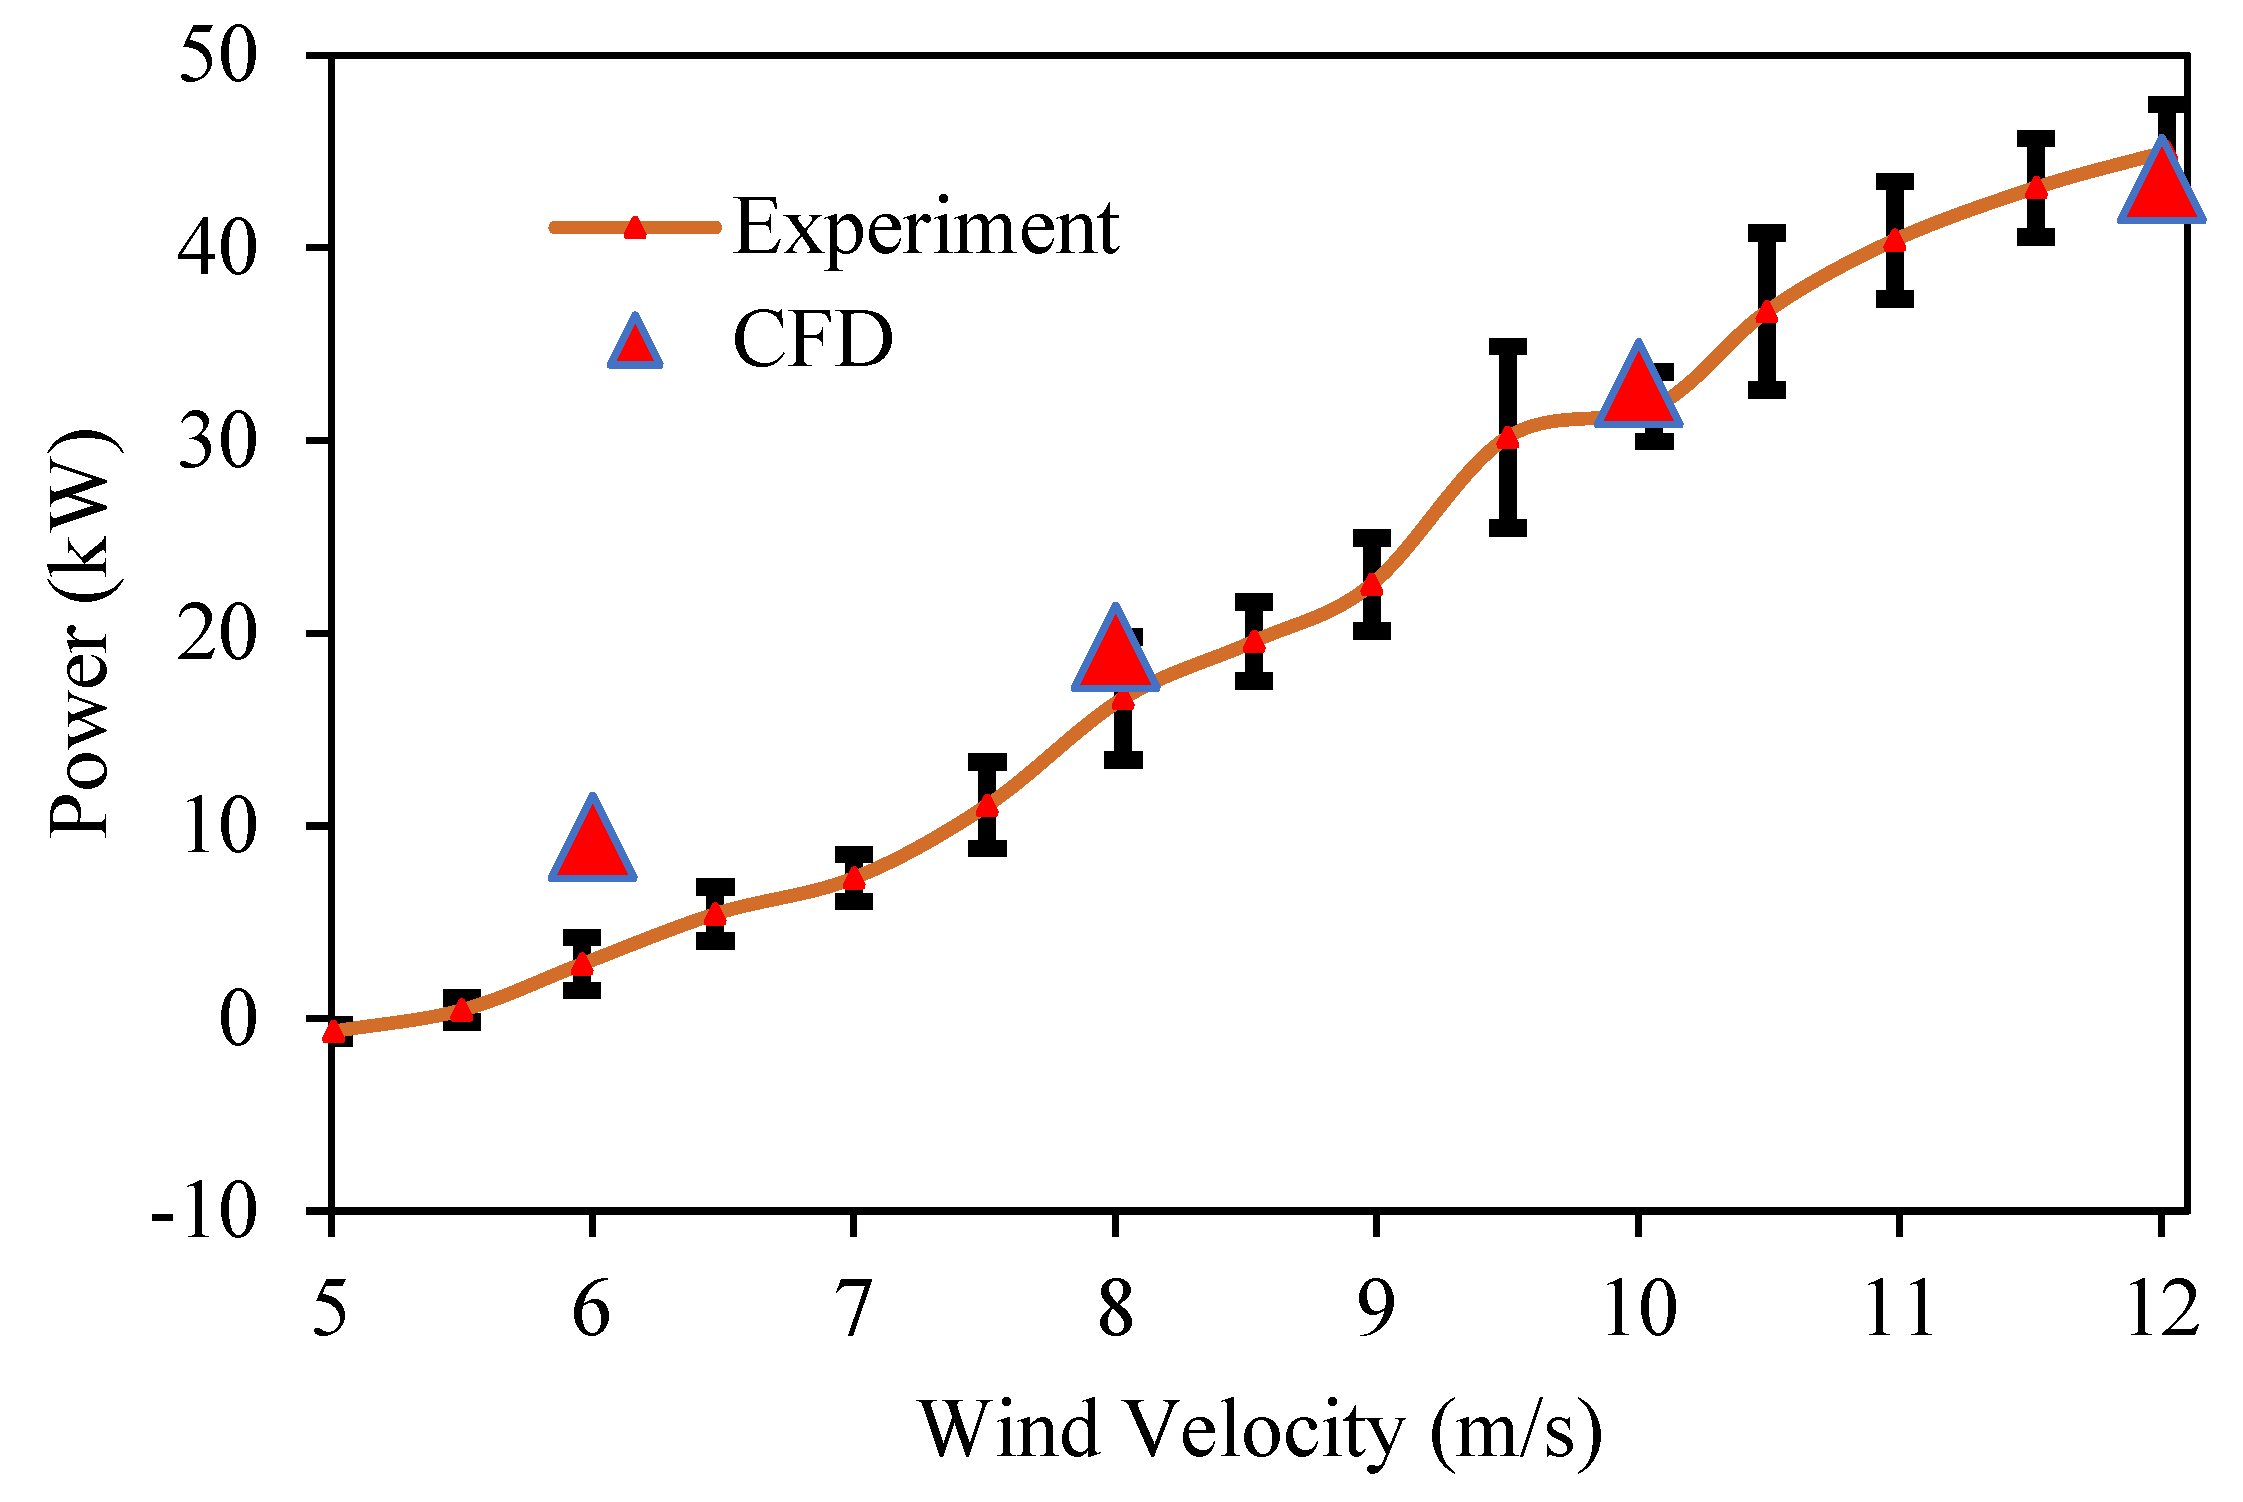
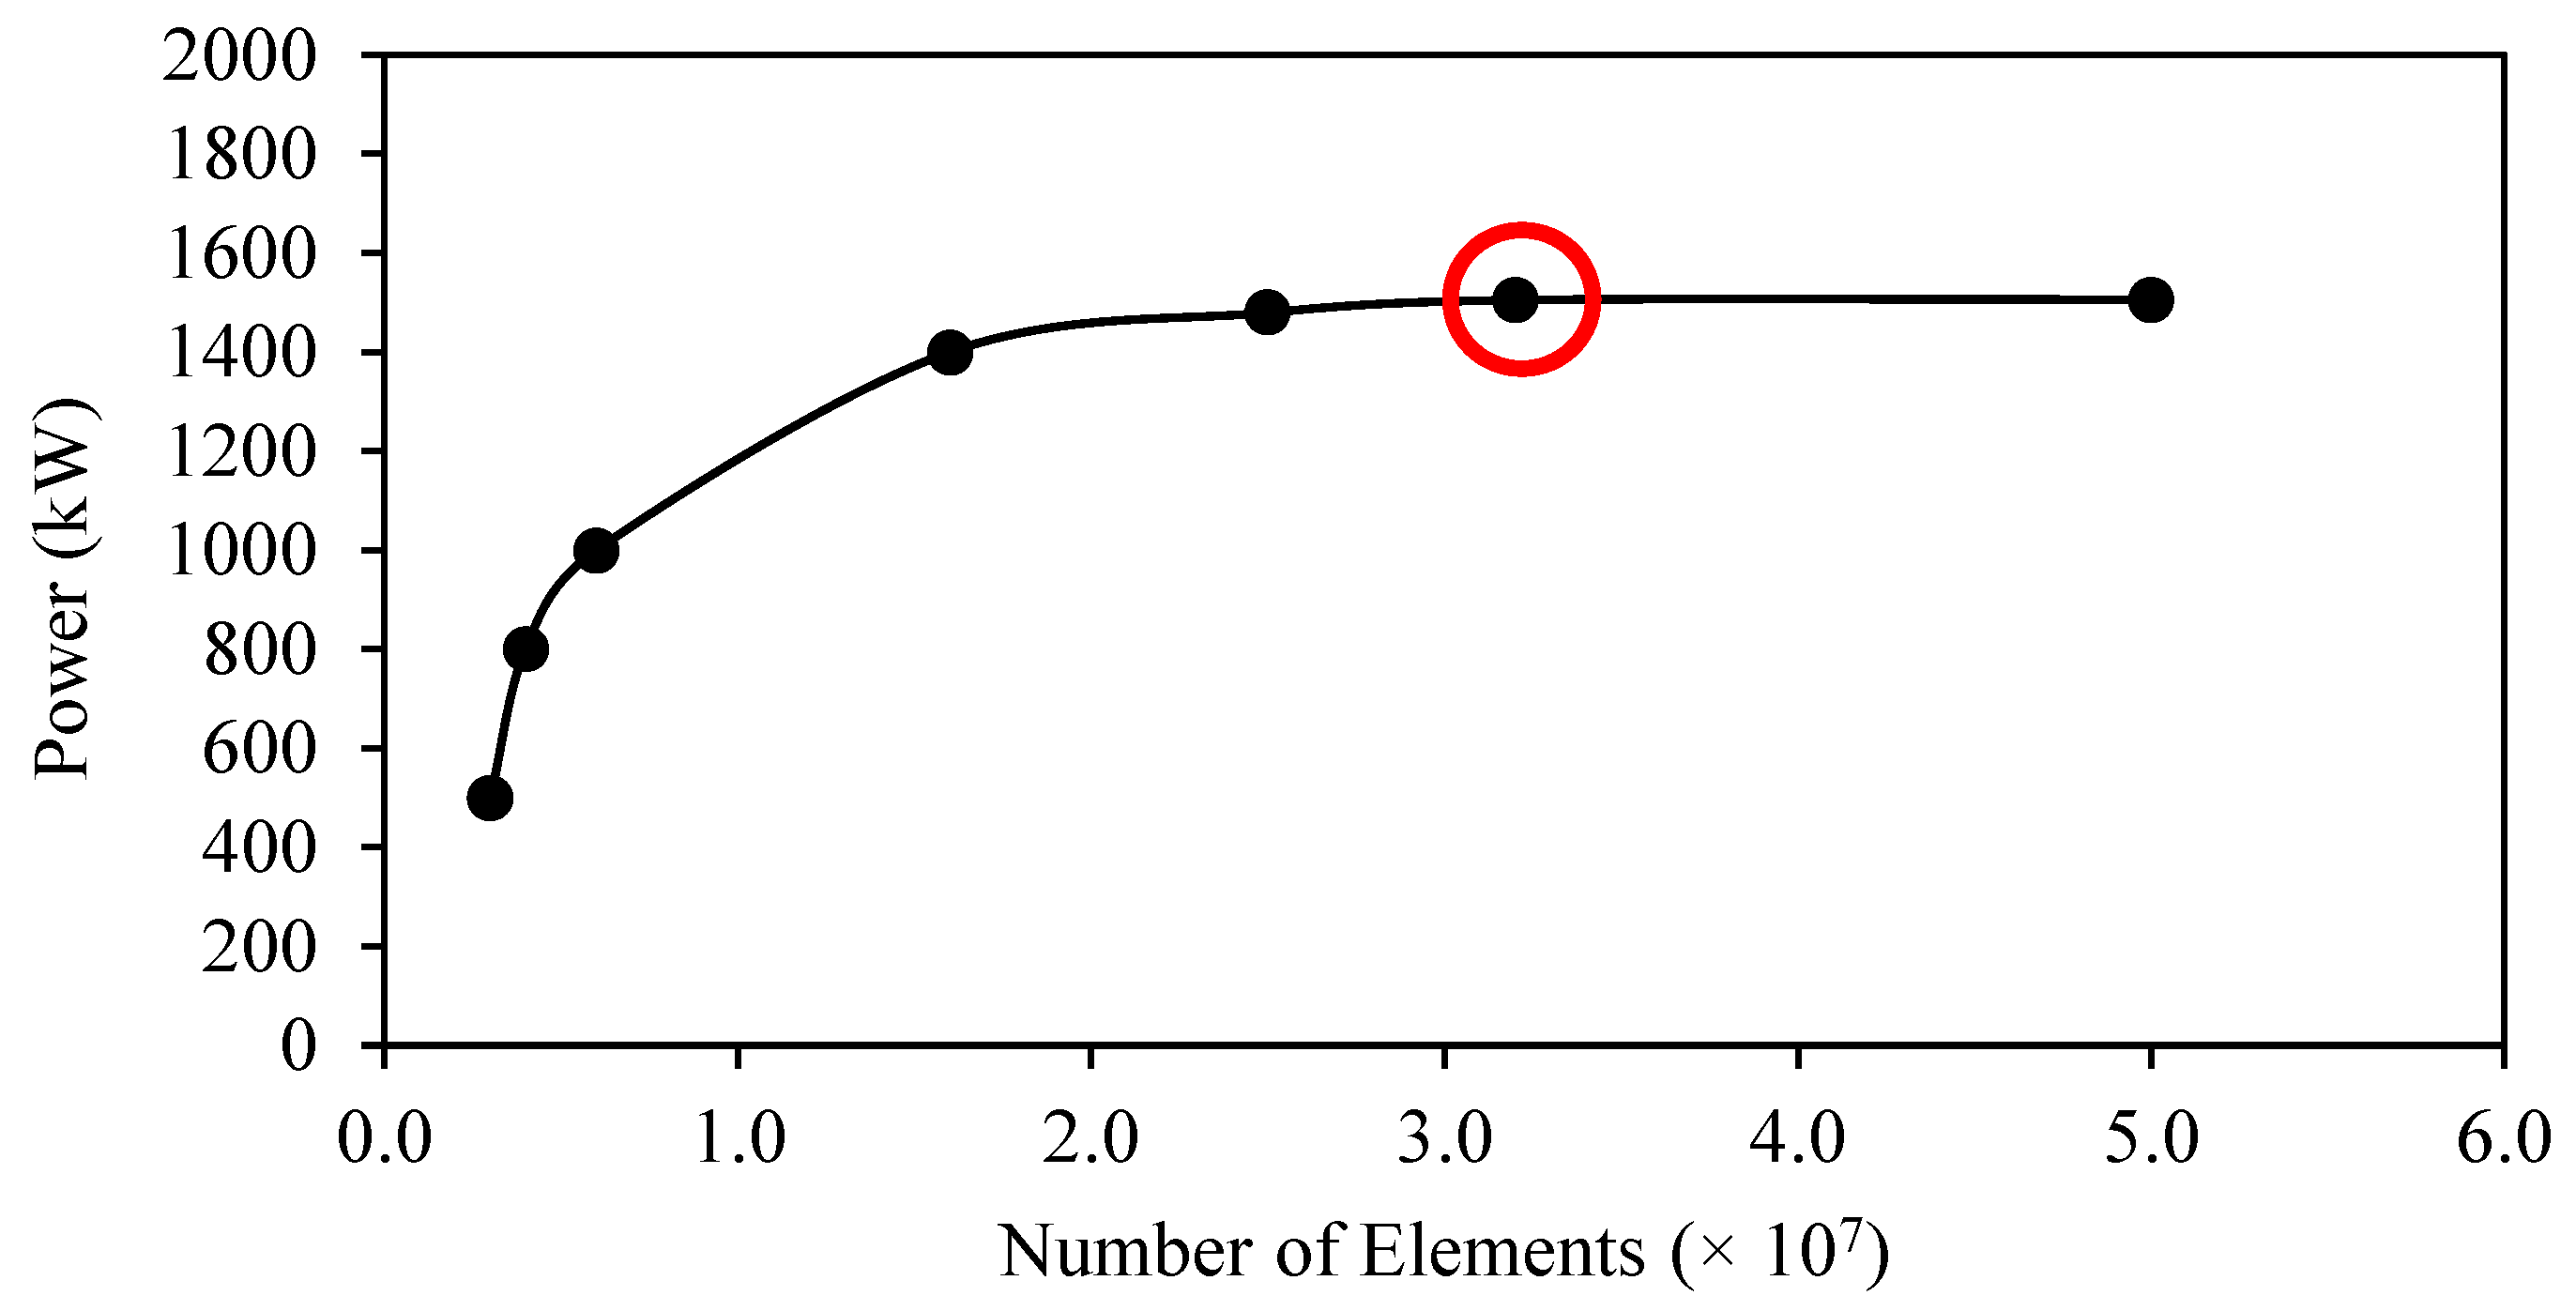
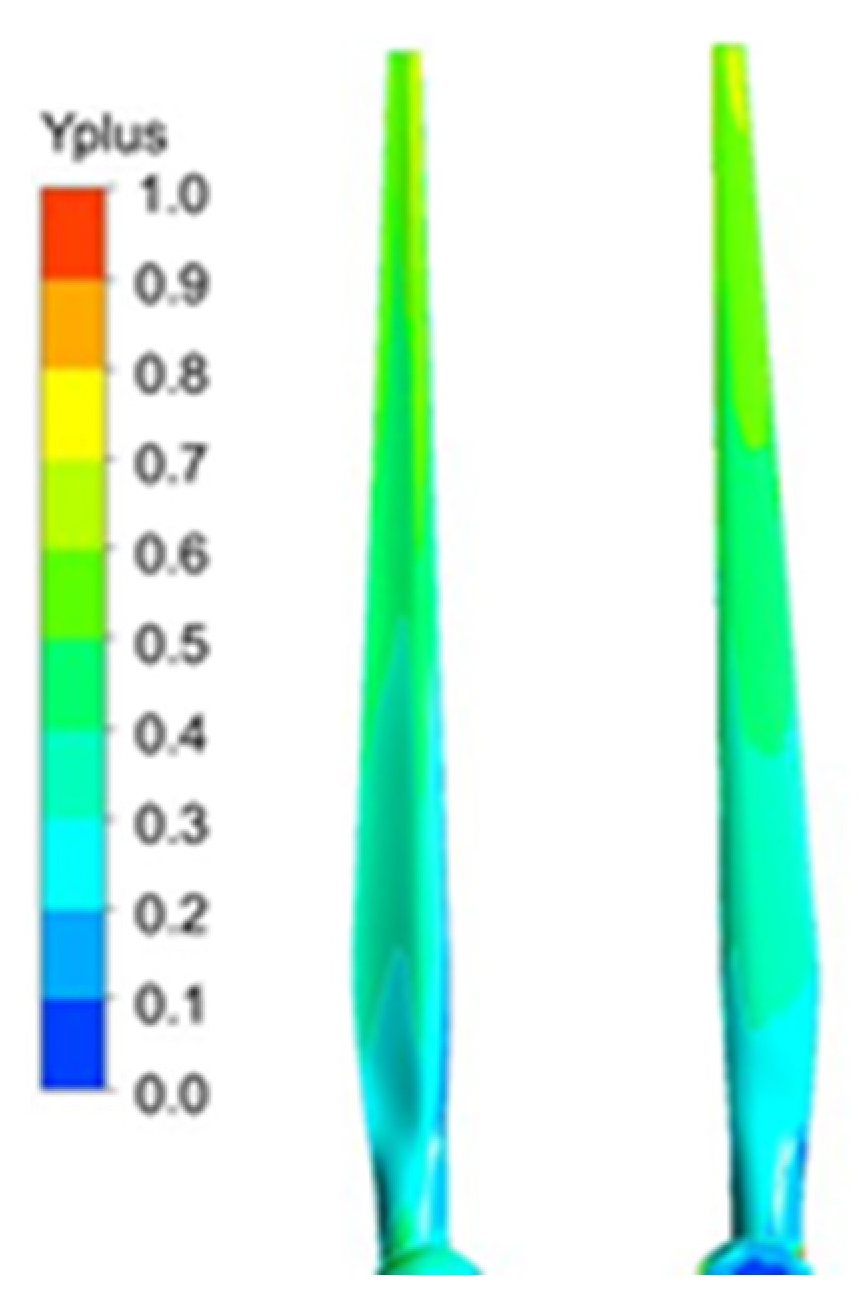
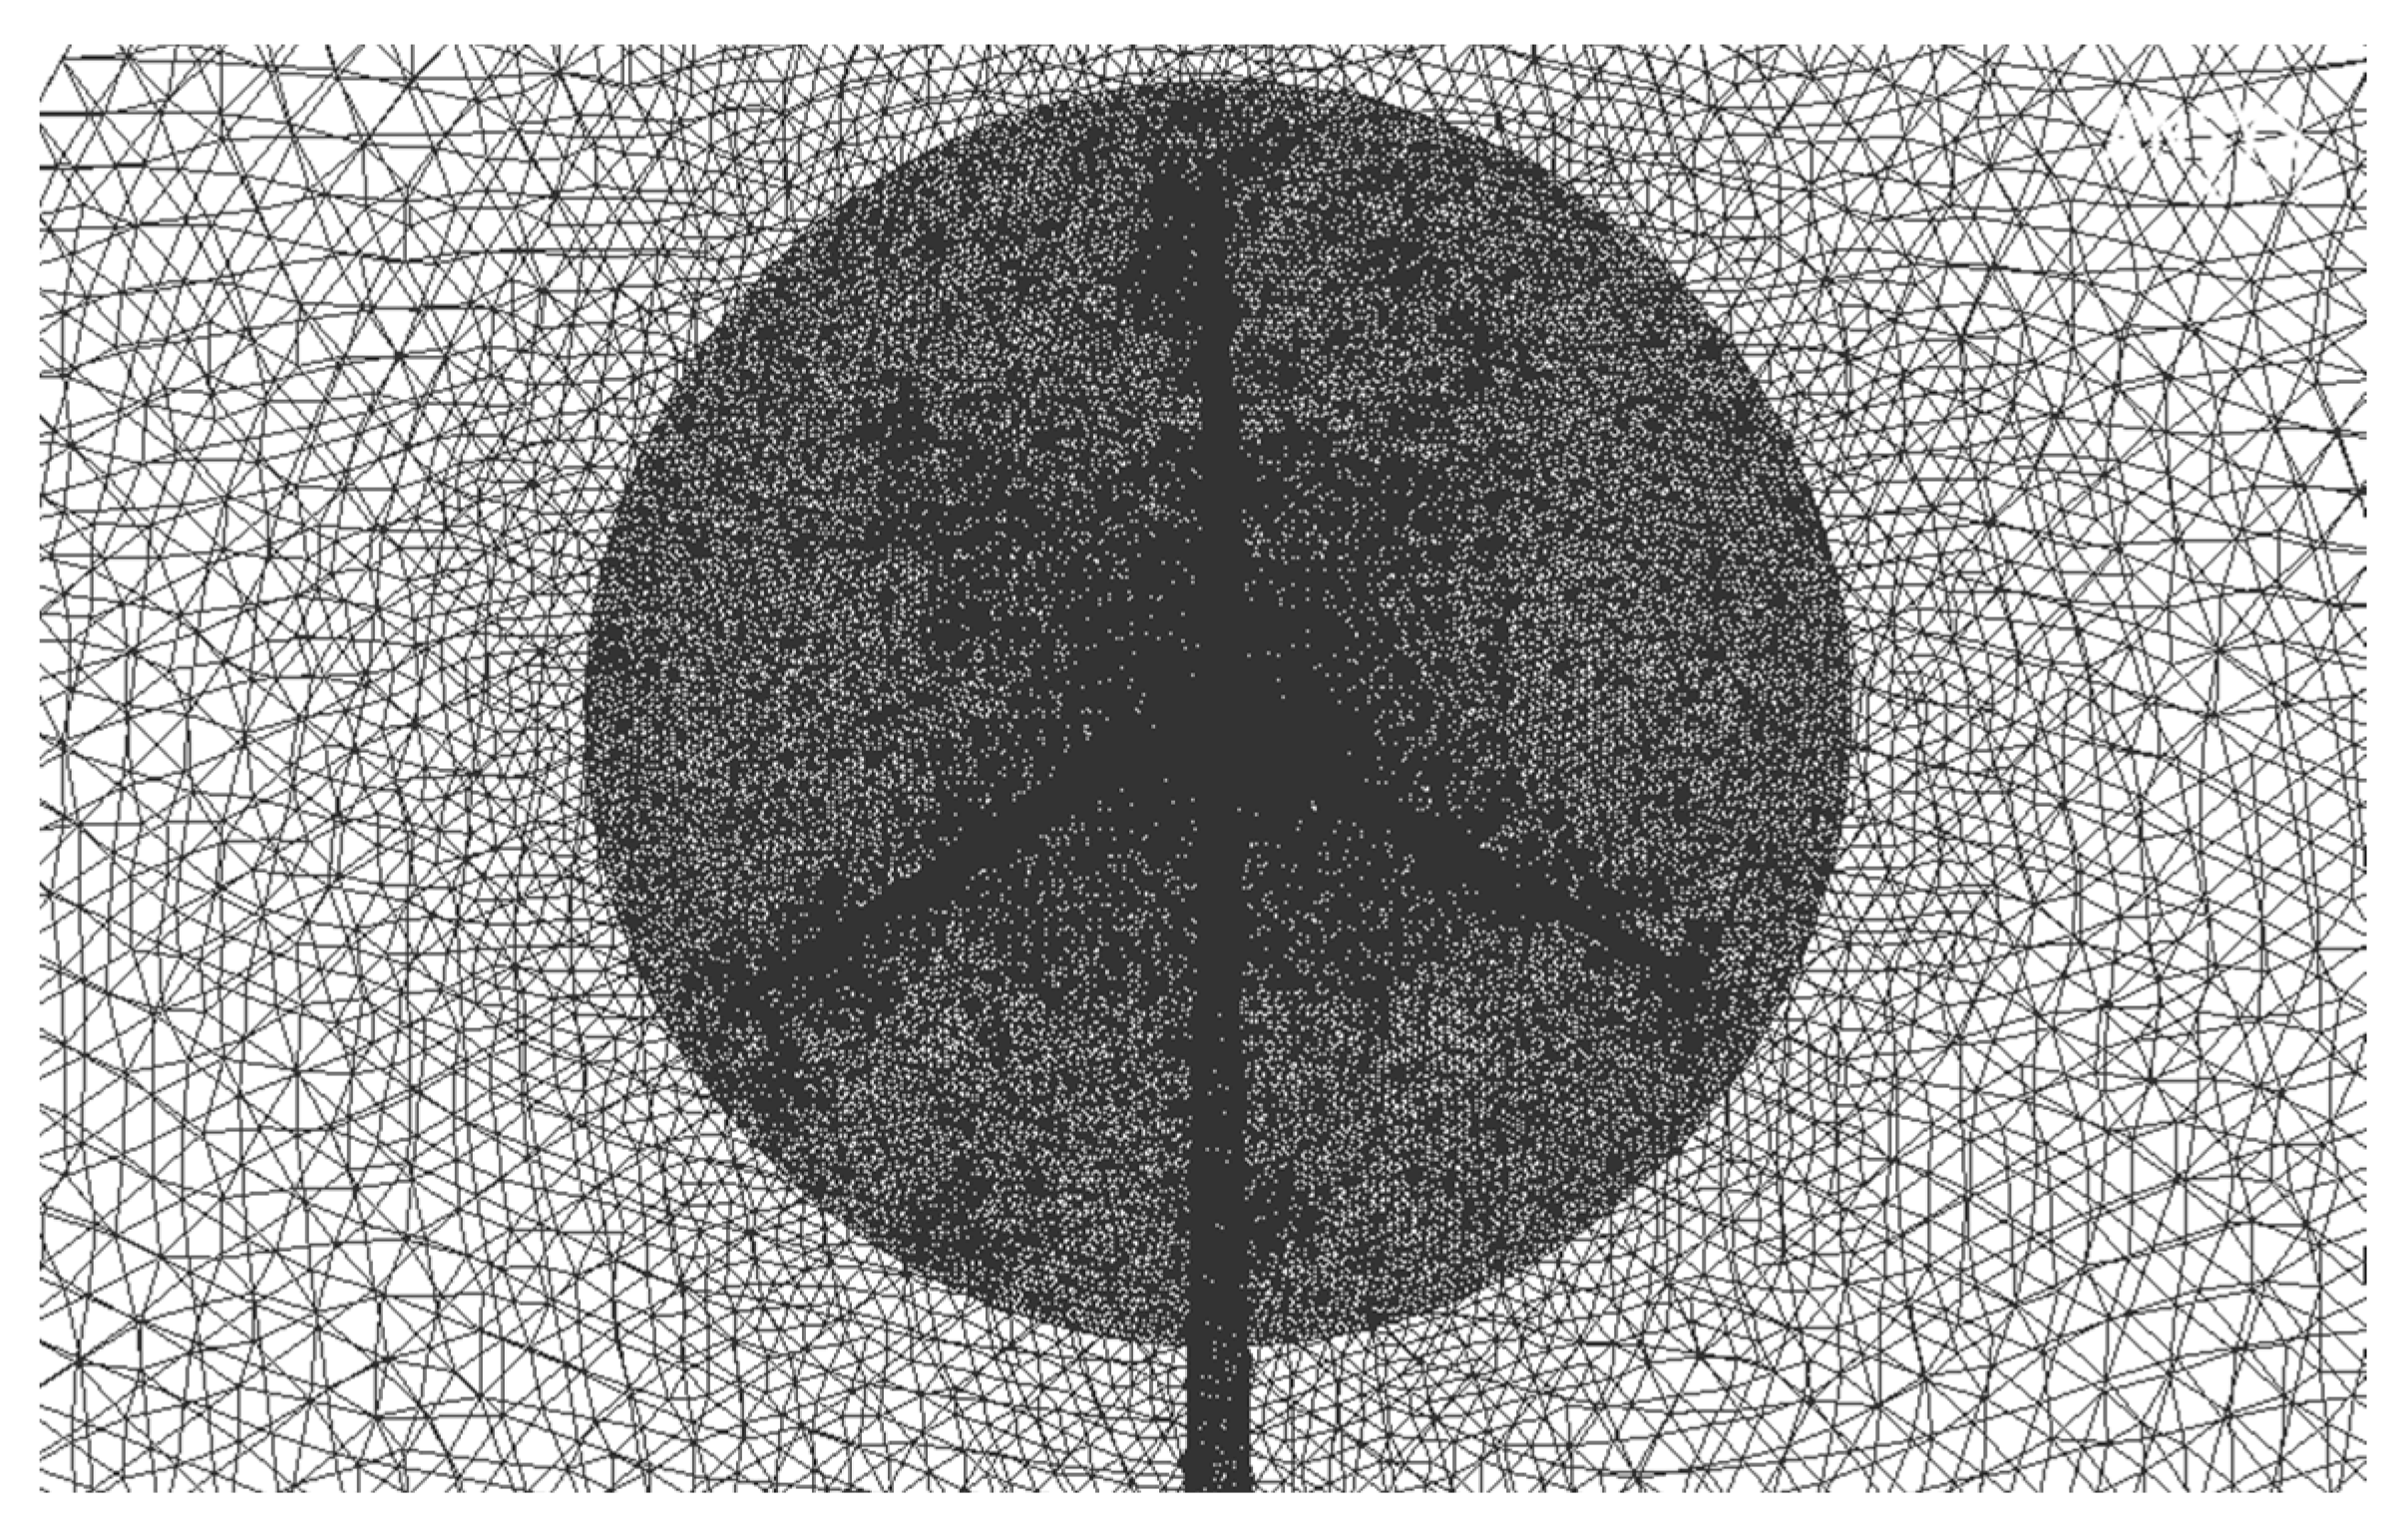
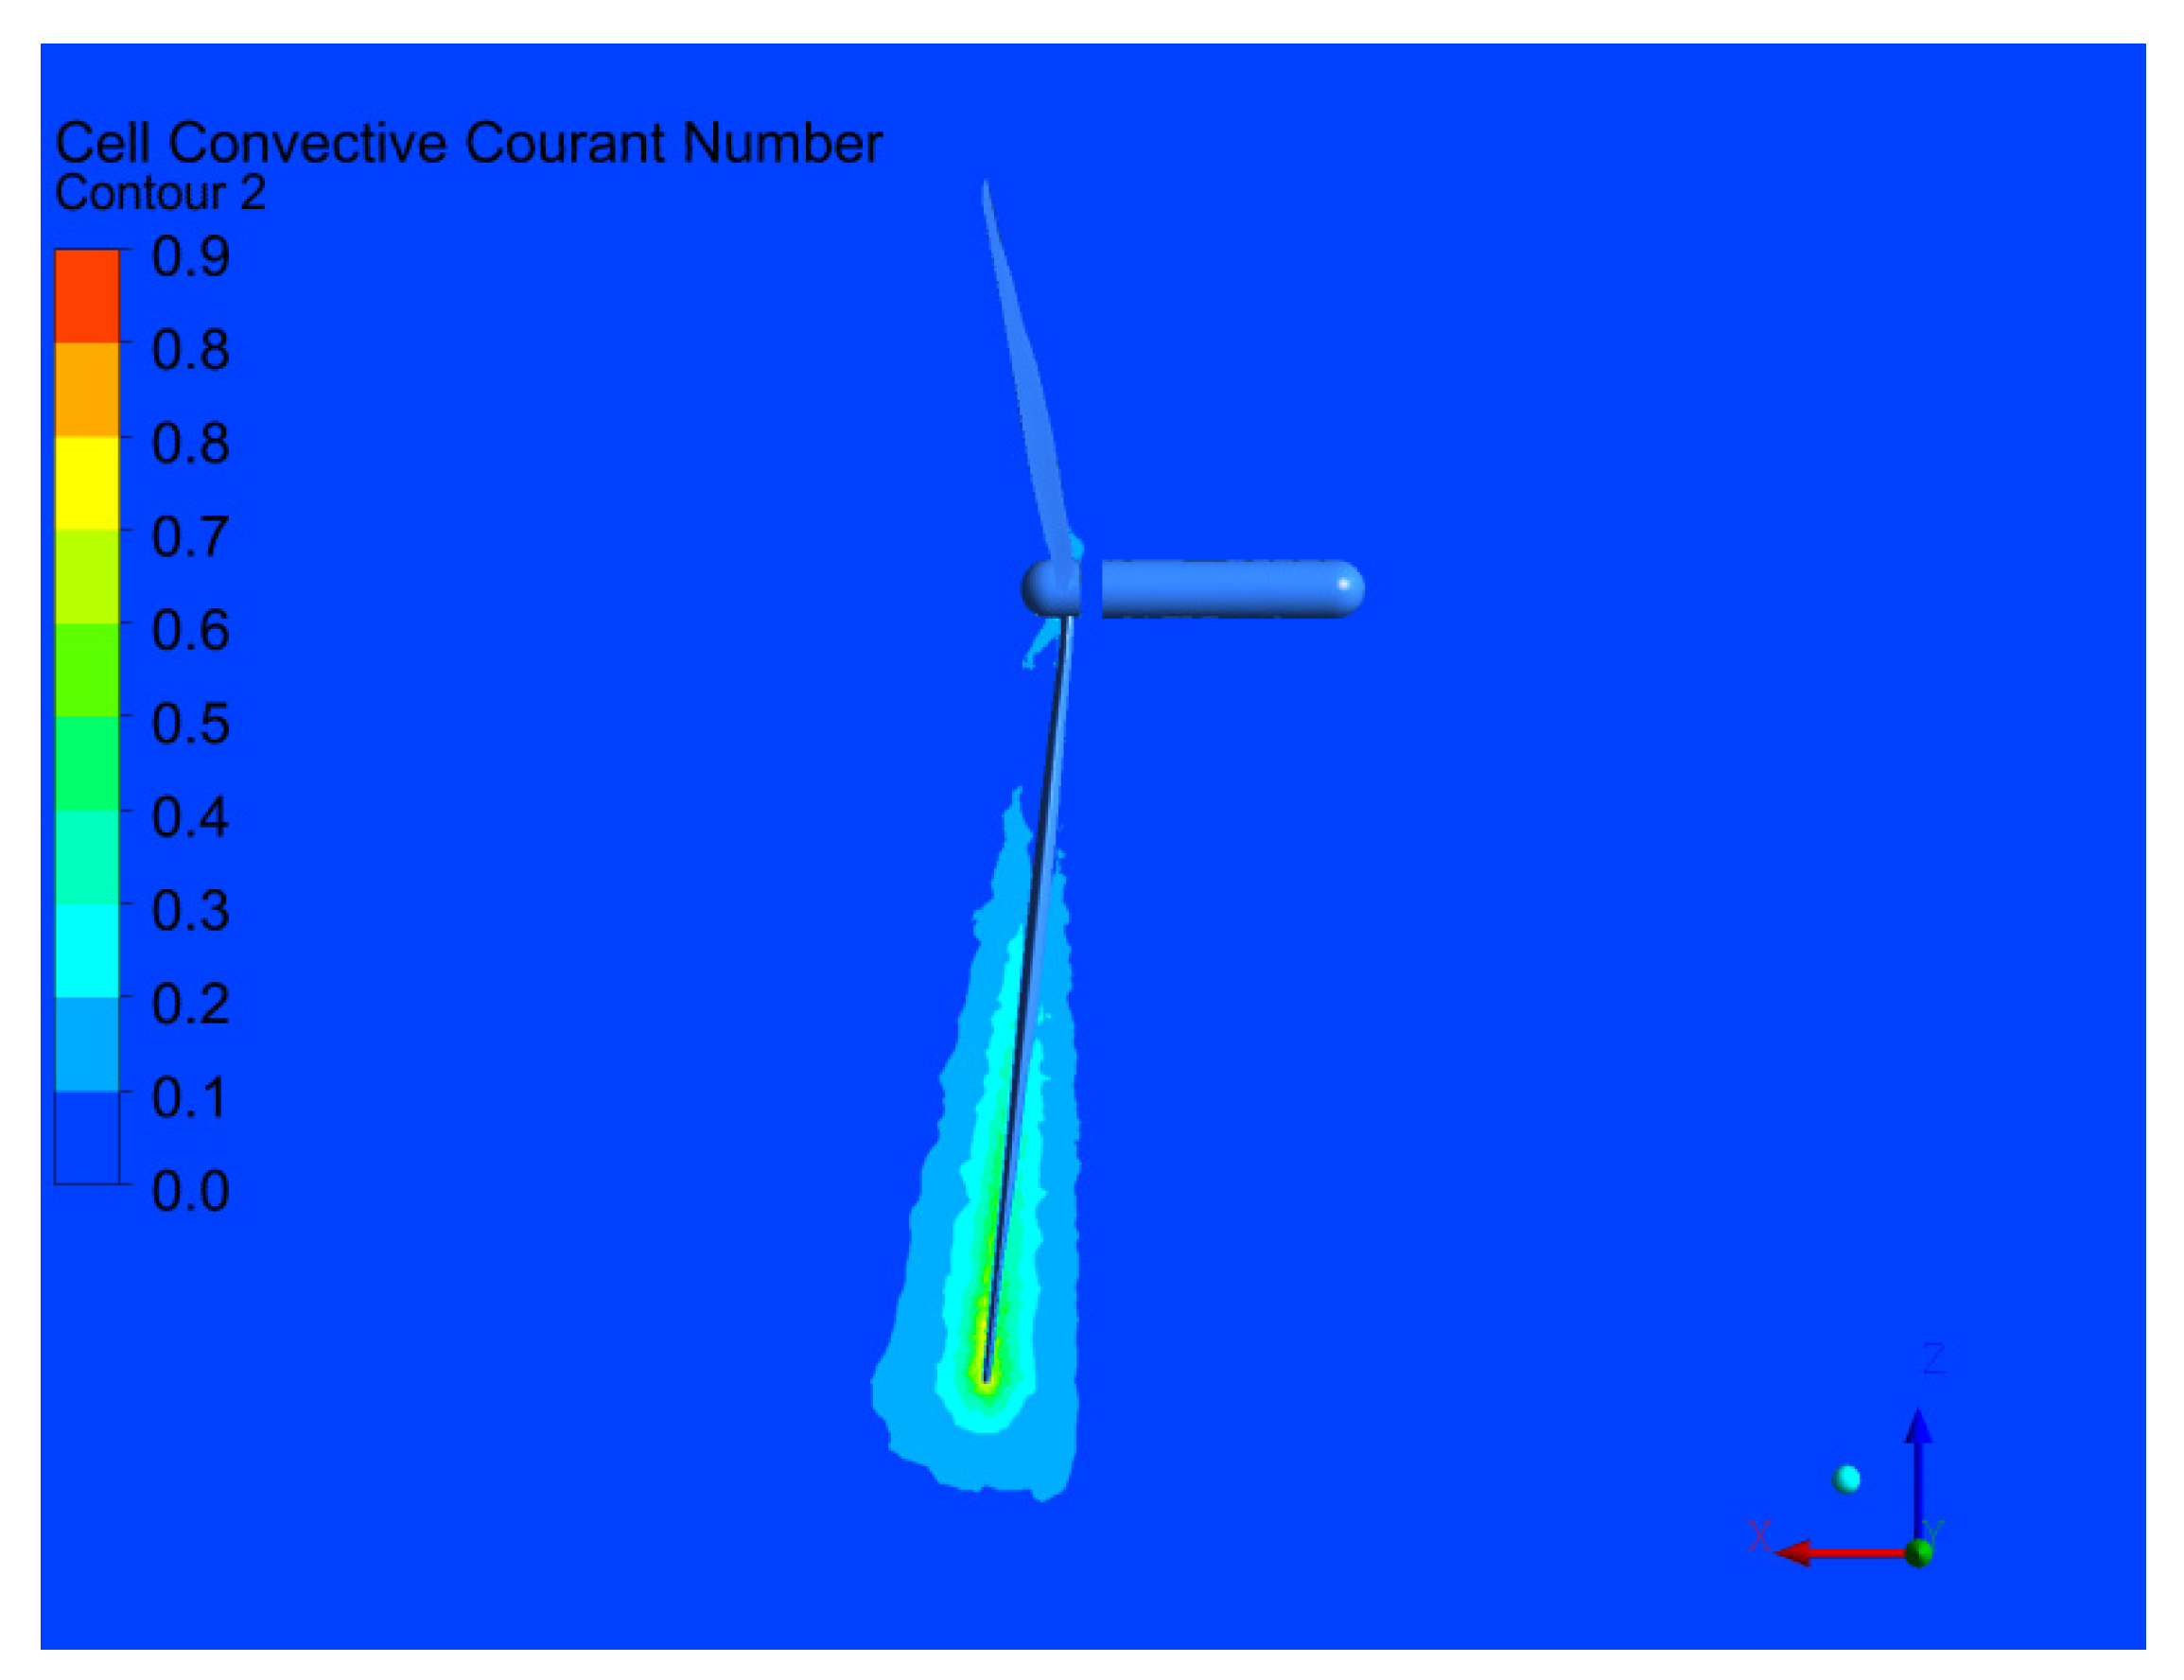
5.1. Validation of CFD Settings
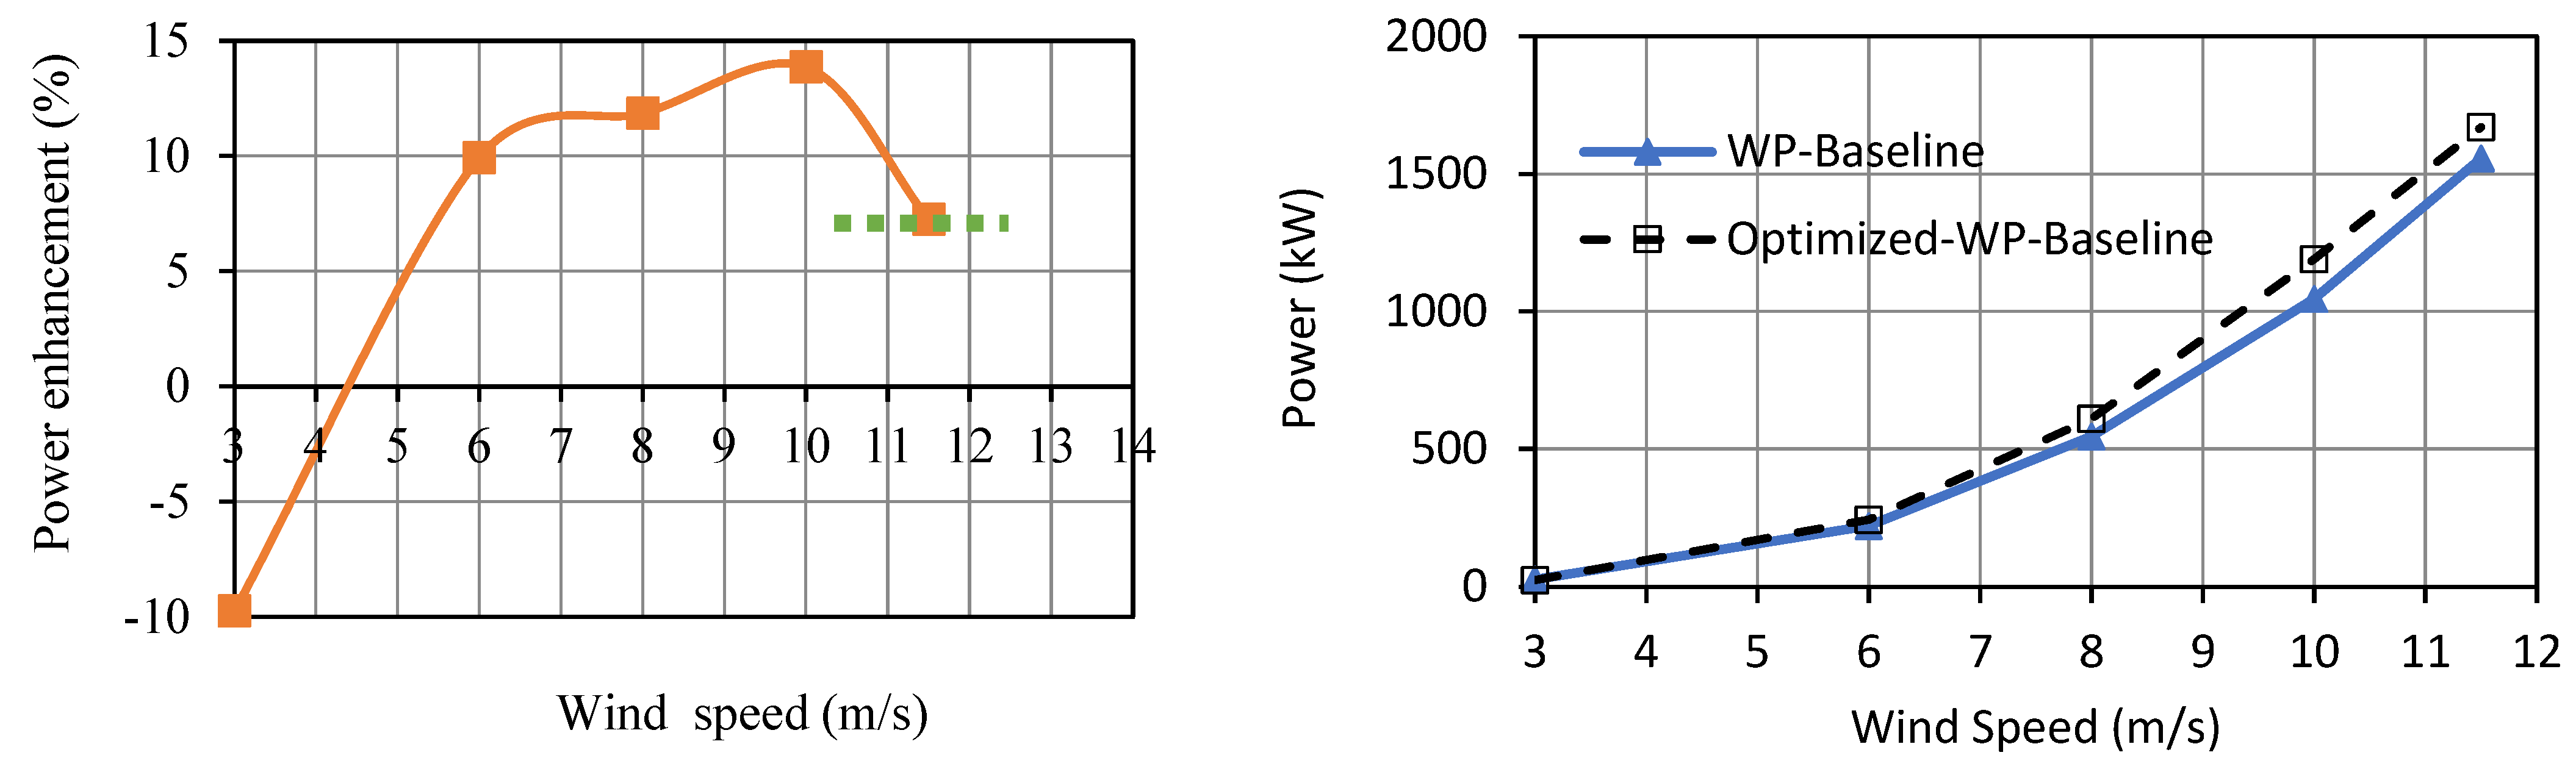
5.2. Verification of the Present Optimization Method
6. Conclusions
Author Contributions
Funding
Data Availability Statement
Conflicts of Interest
Abbreviations
| Nomenclature | |
| the th scaling coefficient | |
| cognitive constant [-] | |
| social factor [-] | |
| C | chord length [m] |
| CD | drag coefficient [-] |
| CL | lift coefficient [-] |
| Cp | pressure coefficient [-] |
| class function value at [-] | |
| particle position in m and n dimensions [-] | |
| , | random factors [-] |
| shape function value at [-] | |
| particle velocity in m and n dimensions [m/s] | |
| W | inertia weight [-] |
| X | chord-wise coordinate [-] |
| y+ | dimensionless wall distance [-] |
| Y | vertical coordinate [m] |
| Greek symbols | |
| Μ | viscosity [kg/m.s] |
| Ρ | density [kg/m3] |
| non-dimensional chordwise coordinate (=x/c)[-] | |
| non-dimensional vertical coordinate (=z/c)[-] | |
| ∆Z | closure thickness [m] |
| Superscripts | |
| local_best | the best quantity achieved by a particle in PSO algorithm |
| global_best | the best quantity achieved by the entire swarm in PSO algorithm |
| Subscripts | |
| LE | airfoil leading edge |
| TE | airfoil trailing edge |
| Abbreviations | |
| BEM | Blade Element Momentum |
| CFD | Computational Fluid Dynamic |
| CST | Class/Shape Function Transformation |
| IDDES | Improved Delayed Detached Eddy Simulation |
| HAWT | Horizontal Axis Wind Turbine |
| NSGA-II | Non-dominated Sorting Genetic Algorithm-II |
| NREL | National Renewable Energy Laboratory |
| PSO | Particle Swarm Optimization |
| RANS | Reynolds Average Navier–Stokes |
| SST | Shear Stress Transport |
| TSR | Tip Speed Ratio |
References
- Moshfeghi, M.; Hur, N. Power generation enhancement in a horizontal axis wind turbine blade using split blades. J. Wind. Eng. Ind. Aerodyn. 2020, 206, 104352. [Google Scholar] [CrossRef]
- Moshfeghi, M.; Ramezani, M.; Hur, N. Design and aerodynamic performance analysis of a finite span double-split S809 configuration for passive flow control in wind turbines and comparison with single-split geometries. J. Wind. Eng. Ind. Aerodyn. 2021, 214, 104654. [Google Scholar] [CrossRef]
- Kaviani, H.; Nejat, A. Aeroacoustic and aerodynamic optimization of a MW class HAWT using MOPSO algorithm. Energy 2017, 140, 1198–1215. [Google Scholar]
- Moradtabrizi, H.; Bagheri, E.; Nejat, A.; Kaviani, H. Aerodynamic optimization of a 5 Megawatt wind turbine blade. Energy Equip. Syst. 2016, 4, 133–145. [Google Scholar]
- Obayashi, S. Aerodynamic optimization with evolutionary algorithms. In Proceedings of the Control’96, UKACC International Conference on (Conf. Publ. No. 427), Exeter, IET, UK, 2–5 September 1996; pp. 687–692. [Google Scholar]
- Bizzarrini, N.; Grasso, F.; Coiro, D.P. Genetic Algorithms in Wind Turbine Airfoil Design; EWEA, EWEC2011: Bruxelles, Belgium, 2011; pp. 14–17. [Google Scholar]
- Zhang, T.-T.; Huang, W.; Wang, Z.-G.; Yan, L. A study of airfoil parameterization, modeling, and optimization based on the computational fluid dynamics method. J. Zhejiang Univ.-Sci. A 2016, 17, 632–645. [Google Scholar]
- Beyer, H.-G.; Sendhoff, B. Robust optimization–a comprehensive survey. Comput. Methods Appl. Mech. Eng. 2007, 196, 3190–3218. [Google Scholar] [CrossRef]
- Eberhart, R.C.; Shi, Y.; Kennedy, J. Swarm Intelligence; Morgan Kaufmann Publishers: San Francisco, CA, USA, 2001. [Google Scholar]
- Hassan, R.; Cohanim, B.; De Weck, O.; Venter, G. A comparison of particle swarm optimization and the genetic algorithm. In Proceedings of the 1st AIAA Multidisciplinary Design Optimization Specialist Conference, Austin, TX, USA, 18–21 April 2005; pp. 18–21. [Google Scholar]
- Mirjalili, S.; Rawlins, T.; Hettenhausen, J.; Lewis, A. A comparison of multi-objective optimisation metaheuristics on the 2D airfoil design problem. ANZIAM J. 2013, 54, 345–360. [Google Scholar]
- Shen, X.; Yang, H.; Chen, J.; Zhu, X.; Du, Z. Aerodynamic shape optimization of non-straight small wind turbine blades. Energy Convers. Manag. 2016, 119, 266–278. [Google Scholar] [CrossRef]
- Srinath, D.; Mittal, S. Optimal aerodynamic design of airfoils in unsteady viscous flows. Comput. Methods Appl. Mech. Eng. 2010, 199, 1976–1991. [Google Scholar]
- Duvigneau, R.; Visonneau, M. Hybrid genetic algorithms and artificial neural networks for complex design optimization in CFD. Int. J. Numer. Methods Fluids 2004, 44, 1257–1278. [Google Scholar] [CrossRef]
- Sobieczky, H. Geometry generator for CFD and applied aerodynamics. In New Design Concepts for High Speed Air Transport; Springer: Vienna, Austria, 1997; pp. 137–157. [Google Scholar]
- Selvan, K.M. On the Effect of Shape Parameterization on Aerofoil Shape Optimization. Int. J. Res. Eng. Technol. 2015, 4, 123–133. [Google Scholar]
- Sripawadkul, V.; Padulo, M.; Guenov, M. A comparison of airfoil shape parameterization techniques for early design optimization. In Proceedings of the 13th AIAA/ISSMO Multidisciplinary Analysis and Optimization Conference, Fort Worth, TX, USA, 13–15 September 2010. [Google Scholar]
- Kulfan, B.M. Recent extensions and applications of the ‘CST’ universal parametric geometry representation method. AIAA Pap. 2007, 7709, 157–176. [Google Scholar]
- Fischer, G.R.; Kipouros, T.; Savill, A.M. Multi-objective optimisation of horizontal axis wind turbine structure and energy production using aerofoil and blade properties as design variables. Renew. Energy 2014, 62, 506–515. [Google Scholar]
- Perfilev, D. Methodology for Wind Turbine Blade Geometry Optimization. Doctor of Science (Technology), Lappeenranta University of Technology, Lappeenranta, Finland, 2013. [Google Scholar]
- Xudong, W.; Shen, W.Z.; Zhu, W.J.; Sørensen, J.N.; Jin, C. Shape optimization of wind turbine blades. Wind. Energy 2009, 12, 781–803. [Google Scholar]
- Ashuri, T.; Zaaijer, M.B.; Martins, J.R.; Van Bussel, G.J.; Van Kuik, G.A. Multidisciplinary Design Optimization of Offshore Wind Turbines for Minimum Levelized Cost of Energy. Renew. Energy 2014, 68, 893–905. [Google Scholar]
- Monteiro, J.P.; Silvestre, M.R.; Piggott, H.; André, J.C. Wind tunnel testing of a horizontal axis wind turbine rotor and comparison with simulations from two Blade Element Momentum codes. J. Wind. Eng. Ind. Aerodyn. 2013, 123 Pt A, 99–106. [Google Scholar]
- Drela, M. XFOIL: An analysis and design system for low Reynolds number airfoils. In Low Reynolds Number Aerodynamics; Springer: Berlin/Heidelberg, Germany, 1989; pp. 1–12. [Google Scholar]
- Yuhui, S.; Eberhart, R. A modified particle swarm optimizer. In Proceedings of the IEEE International Conference on Evolutionary Computation Proceedings. IEEE World Congress on Computational Intelligence, Anchorage, AL, USA, 4–9 May 1998; pp. 69–73. [Google Scholar]
- Gritskevich, M.S.; Garbaruk, A.V.; Schütze, J.; Menter, F.R. Development of DDES and IDDES formulations for the k-ω shear stress transport model. Flow Turbul. Combust. 2012, 88, 431–449. [Google Scholar]
- Kaviani, H.; Nejat, A. Aerodynamic noise prediction of a MW-class HAWT using shear wind profile. J. Wind. Eng. Ind. Aerodyn. 2017, 168, 164–176. [Google Scholar]
- Moshfeghi, M.; Song, Y.J.; Xie, Y.H. Effects of near-wall grid spacing on SST-K-ω model using NREL Phase VI horizontal axis wind turbine. J. Wind. Eng. Ind. Aerodyn. 2012, 107, 94–105. [Google Scholar]
- Malcolm, D.J.; Hansen, A.C. WindPACT Turbine Rotor Design Study; National Renewable Energy Laboratory: Golden, CO, USA, 2006; pp. 11–26. [Google Scholar]
- Poore, R.; Lettenmaier, T. Alternative Design Study Report: WindPACT Advanced Wind Turbine Drive Train Designs Study; November 1, 2000–February 28, 2002; NREL/SR-500-33196; National Renewable Energy Lab.(NREL): Golden, CO, USA, 2003. [Google Scholar]
- Yassin, K.; Diab, A.; Ghoneim, Z. Aerodynamic Optimization of a Wind Turbine Blade Designed for Egypt’s Saharan Environment Using a Genetic Algorithm. Renew. Energy Sustain. Dev. 2015, 1, 106–112. [Google Scholar]
- Yuhui, S.; Eberhart, R.C. Empirical study of particle swarm optimization. In Proceedings of the 1999 Congress on Evolutionary Computation-CEC99, Washington, DC, USA, 6–9 July 1999. [Google Scholar]
- Clerc, M.; Kennedy, J. The particle swarm-explosion, stability, and convergence in a multidimensional complex space. Evol. Comput. IEEE Trans. 2002, 6, 58–73. [Google Scholar] [CrossRef]
- Jacobson, R.; Meadors, E.; Link, H. Power performance test report for the AOC 15/50 wind turbine, test b in golden, Colorado. In United States Department of Energy by National Wind Technology Centre; National Renewable Energy Laboratory: Golden, CO, USA, 2003; pp. 1–150. [Google Scholar]
- IEC 61400-11. Wind Turbines—Part 11: Acoustic Noise Measurement Techniques. 3rd ed. International Electrotechnical Commission: Geneva, Switzerland, 2012.
- Tamura, J. Calculation method of losses and efficiency of wind generators. In Wind Energy Conversion Systems; Springer: London, UK, 2012; pp. 25–51. [Google Scholar] [CrossRef]
- Hospodář, P.; Drábek, A.; Prachař, A. Aerodynamic Design and Strength Analysis of the Wing for the Purpose of Assessing the Influence of the Bell-Shaped Lift Distribution. Aerospace 2021, 9, 13. [Google Scholar]


| Airfoil | The Best Shape Function Order | Mean Error (%) | Max. Abs. Error (%) |
|---|---|---|---|
| S818 | 6 | 0.0881 | 0.37 |
| S825 | 7 | 0.0796 | 0.33 |
| S826 | 7 | 0.0795 | 0.22 |
| Turbine version | 1.5A08C01V03cAdm |
| Rated power | 1500 kW |
| Rated wind speed | 11.5 m/s |
| Cut-in wind speed | 3 m/s |
| Cut-out wind speed | 25 m/s |
| Variable Speed | Cut-in to rated wind speed |
| Variable Pitch | Rated to cut-out wind speed |
| Rated rotational speed | 20.5 rpm |
| Coning angle | 0 degree |
| Tilt angle | 5 degrees |
| Hub height | 84.3 m |
| Rotor diameter | 70 m |
| Drivetrain efficiency | 95% |
| No | r (m) | Twist (deg) | Chord (m) | Airfoil |
|---|---|---|---|---|
| 1 | 5.07 | 11.1 | 2.27 | S818 |
| 2 | 7.29 | 11.1 | 2.59 | S818 |
| 3 | 9.50 | 10.41 | 2.74 | S818 |
| 4 | 11.72 | 8.38 | 2.58 | S818 |
| 5 | 13.94 | 6.35 | 2.41 | S825 |
| 6 | 16.15 | 4.33 | 2.24 | S825 |
| 7 | 18.37 | 2.85 | 2.08 | S825 |
| 8 | 20.59 | 2.22 | 1.91 | S825 |
| 9 | 22.80 | 1.58 | 1.75 | S825 |
| 10 | 25.02 | 0.95 | 1.58 | S825 |
| 11 | 27.24 | 0.53 | 1.42 | S825 |
| 12 | 29.45 | 0.38 | 1.27 | S825 |
| 13 | 31.67 | 0.23 | 1.129 | S826 |
| 14 | 33.89 | 0.08 | 0.98 | S826 |
| 15 | 35 | 0.0 | 0.90 | S826 |
| Number of Birds | Search Space Size % | wmin | vmax | Convergence Criterion | ||
|---|---|---|---|---|---|---|
| 6 | 90 | 0.7 | 2 | 2 | 2 |
| Airfoil Used for the Blade | Power Enhancement by Each Section with the Optimized Airfoil (kW) |
|---|---|
| Optimized S818 | 3.9 kW |
| Optimized S825 | 16.7 kW |
| Optimized S826 | 19.6 kW |
| Total | 40.2 kW |
| Turbine version | 60 Hz |
| Rated wind speed | 12 m/s |
| Number of blades | 3 |
| Rotor diameter | 15 m |
| Operational wind speed | 4.9–22.3 m/s |
| Rotational speed (constant) | 65 rpm |
| Rotor position | Downwind |
| Coning angle | 6 degrees |
| Pitch angle | 1.54 degrees (toward feather) |
| Hub height | 25 m |
| Wind Speed, [m/s] | Baseline Rotor Torque [kN.m] | Baseline Power [kW] | Optimized Rotor Torque (CFD) [kN.m] | Optimized Power (CFD) [kW] |
|---|---|---|---|---|
| 3 | 12.3 | 26.4 | 11.1 | 23.8 |
| 6 | 102.9 | 220.8 | 113.1 | 242.7 |
| 8 | 254.4 | 545.8 | 284.5 | 610.4 |
| 10 | 487.2 | 1045.4 | 554.7 | 1190.3 |
| 11.5 * | 725.7 | 1557.1 | 778.3 | 1670.0 |
Disclaimer/Publisher’s Note: The statements, opinions and data contained in all publications are solely those of the individual author(s) and contributor(s) and not of MDPI and/or the editor(s). MDPI and/or the editor(s) disclaim responsibility for any injury to people or property resulting from any ideas, methods, instructions or products referred to in the content. |
© 2023 by the authors. Licensee MDPI, Basel, Switzerland. This article is an open access article distributed under the terms and conditions of the Creative Commons Attribution (CC BY) license (https://creativecommons.org/licenses/by/4.0/).
Share and Cite
Kaviani, H.R.; Moshfeghi, M. Multi-Megawatt Horizontal Axis Wind Turbine Blade Optimization Based on PSO Method. Aerospace 2023, 10, 158. https://doi.org/10.3390/aerospace10020158
Kaviani HR, Moshfeghi M. Multi-Megawatt Horizontal Axis Wind Turbine Blade Optimization Based on PSO Method. Aerospace. 2023; 10(2):158. https://doi.org/10.3390/aerospace10020158
Chicago/Turabian StyleKaviani, Hamid R., and Mohammad Moshfeghi. 2023. "Multi-Megawatt Horizontal Axis Wind Turbine Blade Optimization Based on PSO Method" Aerospace 10, no. 2: 158. https://doi.org/10.3390/aerospace10020158
APA StyleKaviani, H. R., & Moshfeghi, M. (2023). Multi-Megawatt Horizontal Axis Wind Turbine Blade Optimization Based on PSO Method. Aerospace, 10(2), 158. https://doi.org/10.3390/aerospace10020158