Article

The Influence of Gas Models on Numerical Simulations of Cryogenic Flow

1
Key Laboratory of Unsteady Aerodynamics and Flow Control, Ministry of Industry and Information Technology, Nanjing University of Aeronautics and Astronautics, Nanjing 210016, China
2
High Speed Aerodynamic Institute, China Aerodynamics Research and Development Center, Mianyang 621000, China
*
Author to whom correspondence should be addressed.
Aerospace 2023, 10(12), 986; https://doi.org/10.3390/aerospace10120986
Submission received: 3 October 2023 / Revised: 4 November 2023 / Accepted: 21 November 2023 / Published: 23 November 2023

Abstract

:
At cryogenic temperatures, gases exhibit significant deviations from ideal behaviour, and the commonly employed gas model may inadequately represent the thermodynamic properties of cryogenic gases, subsequently impacting numerical simulations using various thermodynamic and transport models at cryogenic temperatures. The findings of this study reveal that the relative errors in aerodynamic characteristics obtained through different isentropic relations are noteworthy, with the maximum relative error in the drag coefficient reaching 16%. The impact of the equation of state, viscosity model, and thermal conductivity model is relatively minor, with relative errors in the pressure drag coefficient and viscous drag coefficient remaining well below 1%. Nevertheless, the relative error in the skin friction coefficient cannot be ignored due to transonic shock wave/boundary layer interactions. Consequently, when conducting numerical simulations of cryogenic flow, it is imperative to select appropriate gas models to attain precise results.

1. Introduction

The primary solution to address the challenge of low Reynolds numbers in large wind tunnels involves integrating cryogenic technology with wind tunnel systems, resulting in the creation of cryogenic wind tunnels. These specialized wind tunnels typically employ nitrogen as the test gas [1,2]. In comparison to conventional wind tunnels, cryogenic wind tunnels raised pressure levels, and the reduced temperature led to a lower viscosity of the test gas. These modifications substantially enhance the experimental Reynolds number.
Cryogenic wind tunnels, owing to their capability to achieve higher Reynolds numbers, have facilitated numerous experiments [3,4,5,6,7] and numerical simulations [3,4,8,9]. However, as the temperature decreases, gas gradually deviates from ideal gas behaviour, giving rise to real gas effects in cryogenic flows [10,11,12,13] which are called low-temperature effects in thermodynamics. The real gas effects occurring in cryogenic wind tunnels can be categorized into two groups. The first category pertains to potential disparities between the real gas behaviour of the low-temperature nitrogen gas experienced by the model in the tunnel and the nearly ideal gas behaviour of the air encountered by an actual flying aircraft, which could impose limitations on low-temperature testing [14]. The second category encompasses condensation effects, which significantly impact the aerodynamic characteristics of test models.
Regarding the first category, real gas effects in cryogenic wind tunnels, Adcock [2] conducted a study on the impact of cryogenic nitrogen as an experimental gas in transonic wind tunnels. The research confirmed that nitrogen can certainly be employed in transonic wind tunnels operating at a maximum total pressure of 506,625 Pa. Under these conditions, the specific heat ratio of low-temperature nitrogen notably deviates from the ideal gas specific heat ratio of 1.4. However, the isentropic expansion coefficient closely approximates 1.4, similar to the specific heat ratio of an ideal gas. Inger [15,16], in his investigations, identified that the absence of a free-flight adiabatic wall temperature ratio and the lack of proper gas property simulation in a cryogenic tunnel can significantly magnify the effects of transonic shock–boundary layer interactions, leading to localized separation on the model. This effect is more pronounced when compared to a flight scenario at the same Mach number and Reynolds number. These non-adiabatic real gas effects should be taken into consideration. However, Adcock [17] raised doubts about these findings as Inger utilized an ideal gas model in his research and combined it with a real gas specific heat ratio. His research suggested that this approach erroneously yields results, suggesting a significant impact of real gas effects. Wagner and Schmidt [18] employed the Beattie–Bridgeman equation of state to compute real gas effects in cryogenic nitrogen flows. Their results indicated some noticeable deviations from ideal gas behaviour, not only under cryogenic conditions but also at normal temperatures and high pressures. Within the operating range of cryogenic wind tunnels, these deviations remained quite small, with the friction coefficient exhibiting the most notable systematic variation. It is worth noting that the aforementioned literature primarily utilized a flat plate model for validation when considering transonic shock wave–boundary layer interactions, without accounting for the influence of the gas model on the airflow over the aerofoil surface.
Concerning the second category of real gas effects, Hall and Ray [14] and Hall [19] conducted tests on the condensation effect of nitrogen flow over a 0.137 m NACA 0012-64 aerofoil, utilizing the 0.3 m transonic wind tunnel at the NASA Langley Center. In a similar vein, Sun et al. [20] conducted numerical research on condensation within cryogenic wind tunnels, simulating 32 cases involving NACA 0012-64 aerofoils measuring 0.137 m in length across three different Reynolds numbers. The simulation results revealed that condensation exerts a substantial impact on specific flow characteristics, namely, pressure, temperature, and the Mach number, when the local airflow temperature falls below the saturation temperature and remains under a certain critical threshold.
Ma et al. [21] introduced modifications to the pressure Poisson equation, employing various real fluid equations of state (EOSs) to investigate turbulent liquid nitrogen jet flows under cross/supercritical pressure conditions, utilizing different turbulence models based on the Reynolds-averaged Navier–Stokes (RANS) equation. The findings highlighted the significance of selecting an appropriate real fluid state equation, suggesting that it has a more pronounced effect on numerical results than the choice of turbulence models. Within the liquid core region near the nozzle, the Soave–Redlich–Kwong (SRK) equation of state exhibited superior performance compared to the Peng–Robinson (PR) equation of state. As the jet extended, the performance of the PR equation of state gradually improved.
The existing literature has paid limited attention to the influence of various gas models on numerical results in cryogenic wind tunnels. Given that computational fluid dynamics (CFD) can offer valuable insights for cryogenic wind tunnels, and considering that the properties of the test gas substantially affect calculation outcomes, it is necessary to ascertain whether gas models have an impact on numerical simulations of cryogenic nitrogen flow. In context of cryogenic flow, achieving precise descriptions of the thermodynamic and transport properties of gases is crucial for obtaining accurate results. Consequently, the selection of appropriate gas models becomes essential to accurately depict the variation in nitrogen’s properties with temperature within a specific range of applications. Figure 1 in this manuscript illustrates the classification of gas properties as described.
To address the issue mentioned above, this study aims to compare and analyse the disparities arising from different gas models. The investigation compares the variation relationships of different gas models with temperature and pressure, then employs an NACA0012-64 aerofoil [20] as a test model, meticulously scrutinizing the effects of diverse gas models on numerical simulations. The results indicate that using different isentropic relationships can lead to significant discrepancies in the results, and the specific heat ratios of real gases should not be used together with ideal gas EOSs for calculations.

2. Gas Models

In order to investigate the differences between various gas models, this chapter provides a brief introduction to different gas models, including EOSs, isentropic relationships, viscosity models, and thermal conductivity models. The expressions associated with each of these models are also presented.

2.1. EOS

Equations of state (EOSs) serve as fundamental tools for describing the thermodynamic properties of gases, establishing relationships between the pressure ( p ) , temperature ( T ) , and specific volume ( v ) of substances [22]. Under standard room temperature and pressure conditions, the ideal gas EOS proves highly effective at accurately characterizing gas thermodynamic properties and is expressed as follows:
p v = R T
Here, p is pressure, v is the specific volume, T is temperature, and R represents the gas constant of nitrogen.
However, real gas effects typically become significant in environments with either higher or lower temperatures, resulting in the substantial deviation of gas properties from the ideal thermally and calorically perfect gas behaviour. Consequently, the ideal gas EOS ceases to be suitable for accurately describing the thermodynamic properties of gases in such conditions.
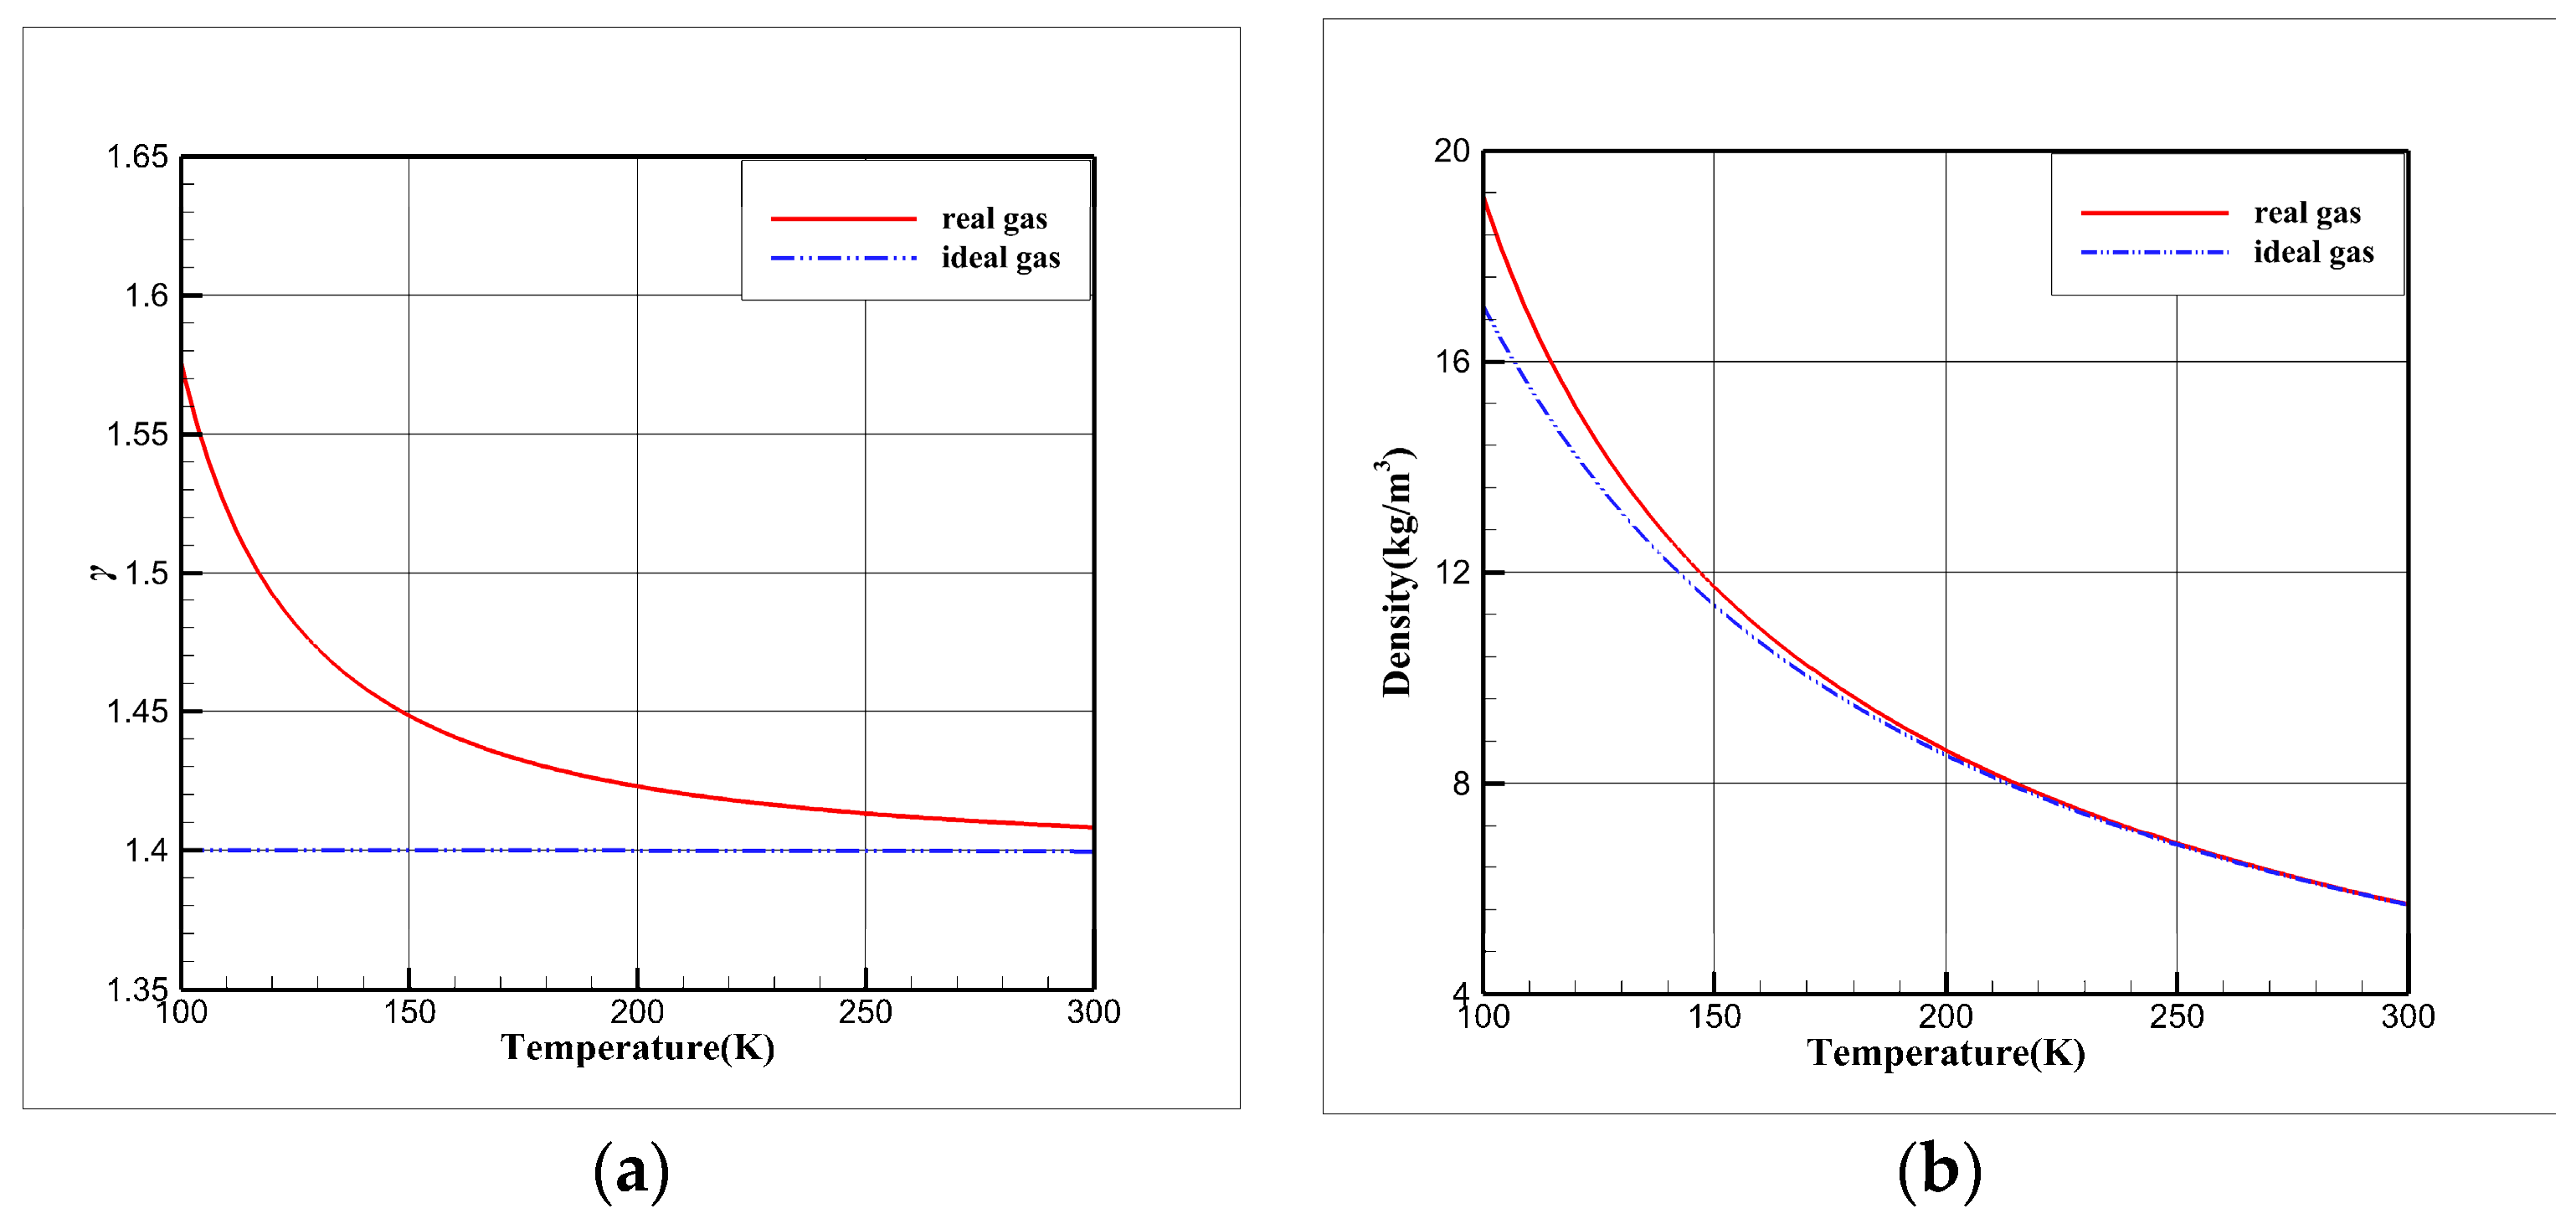
To visually illustrate the distinctions in thermodynamic properties between real gases and ideal gases, we utilized the National Institute of Standards and Technology (NIST) database to obtain the thermodynamic properties of nitrogen in its real gas state. Figure 2 displays variations in the specific heat ratio and density with temperature for both real gas and ideal gas conditions at 506,625 Pa. From the figure, it becomes clear that as the temperature decreases, the thermodynamic properties of the real gas progressively deviate from those of the ideal gas. Moreover, this deviation steadily amplifies, culminating in a pronounced low-temperature real gas effect. Consequently, it becomes essential to select an appropriate EOS better suited for describing cryogenic nitrogen.
In the realm of real gas states, several commonly employed EOSs include the Redlich–Kwong (RK) EOS and its various modified versions, the Benedict–Webb–Rubin (BWR) EOS, and the Martin–Hou (M-H) EOS, among others. In this article, the RK EOS and its modified forms like the Soave–Redlich–Kwong (SRK) EOS, Aungier–Redlich–Kwong (ARK) EOS, and Peng–Robinson (PR) EOS were used with the following form [23]:
p = R T v b + c α v 2 + δ v + ε
where the coefficients α , b , c , δ , and ε for each equation of state are provided as functions of the critical temperature T c , critical pressure p c , acentric factor ω , and critical specific volume v c . Table 1 presents the coefficients for the RK EOS and its modified forms.
In addition to the aforementioned EOSs, the National Institute of Standards and Technology (NIST) [24] offers thermodynamic properties for various gases. For nitrogen, the NIST database relies on the EOS developed by Span et al. [25], which is formulated using Helmholtz energy as the fundamental property with independent variables of density and temperature.

2.2. Isentropic Expansion of Cryogenic Nitrogen

In the context of compressible flow calculations, the application of isentropic relations is necessary. This relationship is most commonly expressed through Equation (3).
p ρ γ = c o n s t a n t
where γ is the specific heat ratio.
The relationship between stagnation properties and static properties can be determined using the Mach number M a and the specific heat ratio γ , represented by the following expression:
T 0 T = 1 + γ 1 2 M a 2 p 0 p = 1 + γ 1 2 M a 2 γ γ 1 ρ 0 ρ = 1 + γ 1 2 M a 2 1 γ 1
where T 0 , p 0 , and ρ 0 represent the stagnation temperature, pressure, and density, and T , p , and ρ represent the static temperature, pressure, and density.
It is worth noting that the isentropic relation for real gases does not align perfectly with Equation (3). For simplicity, pressure and density can still be related using the same equation, albeit with a different expansion coefficient denoted as α   [2]. Therefore, the isentropic relation can be reformulated as
p ρ α = c o n s t a n t
According to pertinent thermodynamic relationships, the isentropic expansion coefficient, α, can be determined using Equation (6).
α = v p p v s
According to relations of thermodynamic, we obtain
c p c v = v p T p v s
where c p represents the specific heat at a constant pressure and c v represents the specific heat at a constant volume.
Combining Equations (6) and (7), we obtain
α = c p c v v p p v T = γ v p p v T
Furthermore, the relationship between stagnation properties and static properties can be determined using the Mach number M a and the isentropic expansion coefficient α to represent
T 0 T = 1 + α 1 2 M a 2 p 0 p = 1 + α 1 2 M a 2 α α 1 ρ 0 ρ = 1 + α 1 2 M a 2 1 α 1
When dealing with ideal gases, the combination of Equations (8) and (1) leads to the conclusion that α = γ . Under such circumstances, Equation (9) is essentially identical to Equation (4). For nitrogen in an ideal gas state, this implies that α = γ = c p . 0 c v . 0 1.4 . Therefore, if researchers employ the isentropic relation (3) in cryogenic flow and merge an ideal gas EOS with a real gas specific heat ratio, which gradually varies with temperature as depicted in Figure 2a, it will certainly exert a substantial impact on the results.

2.3. Viscosity Model

Viscosity serves as a quantitative measure of a fluid’s resistance to flow, specifically indicating the fluid’s strain rate generated by a given applied shear stress [26]. A crucial aspect of gas viscosity is its relationship with temperature, which is characterized by the viscosity model.
In most general problems, researchers commonly employ the Sutherland law to depict the relationship between viscosity and temperature. Its formulation involves three coefficients, as follows:
μ = μ r T T r 3 2 T r + S T + S
where μ represents viscosity, μ r is the reference viscosity,   T r is the reference temperature, and S denotes the effective temperature.
The Sutherland law exclusively accounts for the influence of viscosity based on temperature, yet when dealing with real gases, viscosity is influenced by both temperature and pressure. Therefore, it becomes imperative to compare the Sutherland law with other viscosity models and identify a more suitable model to describe the viscosity of cryogenic nitrogen.
One such gas viscosity model, proposed by Chung et al. [27], is represented as follows:
μ = μ * 36.344 M T c 1 2 v c 2 3
μ * = T * 1 2 Ω F c G 2 1 + E 6 y + μ * *
μ * * = E 7 y 2 G 2 exp E 8 + E 9 T * 1 + E 10 T * 2
where
G 2 = E 1 1 exp E 4 y y + E 2 G 1 exp E 5 y + E 3 G 1 E 1 E 4 + E 2 + E 3
G 1 = 1 0.5 y 1 y 3
y = ρ v c 6
E i = a i + b i ω + c i μ r 4 + d i κ
For nitrogen, specific properties include an acentric factor ω = 0.03772 , an association factor κ = 0 , and a dimensionless dipole moment μ r = 0 , while other coefficients like E i , a i , b i , c i , and d i can be seen in Ref. [27].
The NIST database employs the viscosity model established by Lemmon et al. [28] for gases like air and nitrogen. The model’s formulation is as follows:
μ = μ 0 T + μ τ τ , δ
μ 0 T = 0.0266958 M T σ 2 Ω
μ τ τ , δ = i = 1 n N i τ t i δ d i exp γ i δ l i
where
Ω = exp i = 0 4 b i [ ln T * ] i
τ = T c T ,   δ = ρ ρ c ,   T * = T k ε
The Lennard-Jones size parameter σ and the coefficients t i , N i , γ i , and l i exhibit variations across different gases. The model demonstrates remarkable accuracy when predicting the viscosity of nitrogen at low temperatures. Additionally, in non-critical gas states, the associated uncertainty is found to be less than 2% [28], making it a reliable reference point.

2.4. Model of Thermal Conductivity

Heat can be transferred through three distinct mechanisms: conduction, convection, and radiation. Conduction involves the transfer of energy from more energetic particles within a substance to adjacent, less energetic particles due to their interactions. Thermal conductivity serves as a quantification of a material’s ability to conduct heat [22]. Typically, researchers consider thermal conductivity a constant when calculating temperature distribution. Nevertheless, under cryogenic conditions, thermal conductivity deviates significantly from being constant, necessitating a more precise model.
Chung et al. [27] developed a method for calculating the pure component thermal conductivity under low pressure with the following formula:
λ = 31.2 μ 0 Ψ M G 2 1 + B 6 y + q B 7 y 2 T r 1 2 G 2
where λ is the thermal conductivity, μ 0 is the dilute gas viscosity, and the other coefficients can be calculated as follows:
Ψ = 1 + α 0.215 + 0.28288 α 1.061 β + 0.26665 Z 0.6366 + β Z + 1.061 α β
α = c v / R 1.5
β = 0.7862 0.7109 ω + 1.3168 ω 2
q = 3.586 × 10 3 T c M 1 2 / v c 2 3
Z = 2.0 + 10.5 T r 2
y = v c 6 v
G 2 = B 1 y 1 e x p ( B 4 y ) + B 2 G 1 exp B 5 y + B 3 G 1 B 1 B 4 + B 2 + B 3
B i = a i + b i ω + c i μ r 4 + d i κ
For nitrogen, ω = 0.03772 , κ = 0 , and μ r = 0 , while the other coefficients can be seen in Ref. [27].
The thermal conductivity model developed by Lemmon et al. [28] was used in the NIST database for gases such as air and nitrogen, and its form is as follows:
λ = λ 0 T + λ τ τ , δ + λ c τ , δ
λ 0 T = N 1 μ 0 T 1 μ P a · s + N 2 τ t 2 + N 3 τ t 3
λ τ = i = 4 n N i τ t i δ d i exp γ i δ l i
λ c = ρ c p k R 0 T 6 π ξ η T , ρ Ω ~ Ω ~ 0
where
Ω ~ = 2 π c p c v c p t a n 1 ξ q D + c v c p ξ q D
Ω ~ 0 = 2 π 1 exp 1 ξ q D 1 + 1 3 ξ q D 2 ξ q D 2
ξ = ξ 0 χ ~ T , ρ χ ~ ( T r e f , ρ ) T r e f T Γ α 1 α 2
χ ~ T , ρ = p c ρ ρ c 2 ρ p T
where k is Boltzmann’s constant ( 1.380658 × 10 J · K ), T r e f is the reference temperature, with T r e f = 252.384   K for nitrogen. α 1 , α 2 and R 0 are theoretically based constants, with values of R 0 = 1.01 , α 1 = 0.63 , and α 2 = 1.2415 . q D , ξ 0 , and Γ are fluid-specific terms. For nitrogen, q D = 0.4 , ξ 0 = 0.17 , and Γ = 0.055 .

3. Comparative Analysis of Gas Models

Since wind tunnel tests primarily adjust p t , T t , and M a to achieve the desired conditions, this article examines the influence of pressure and temperature on thermodynamic and transport properties by comparing the variation in the results with temperature obtained from different gas models under varying pressures.

3.1. Comparative Study of Isentropic Relations

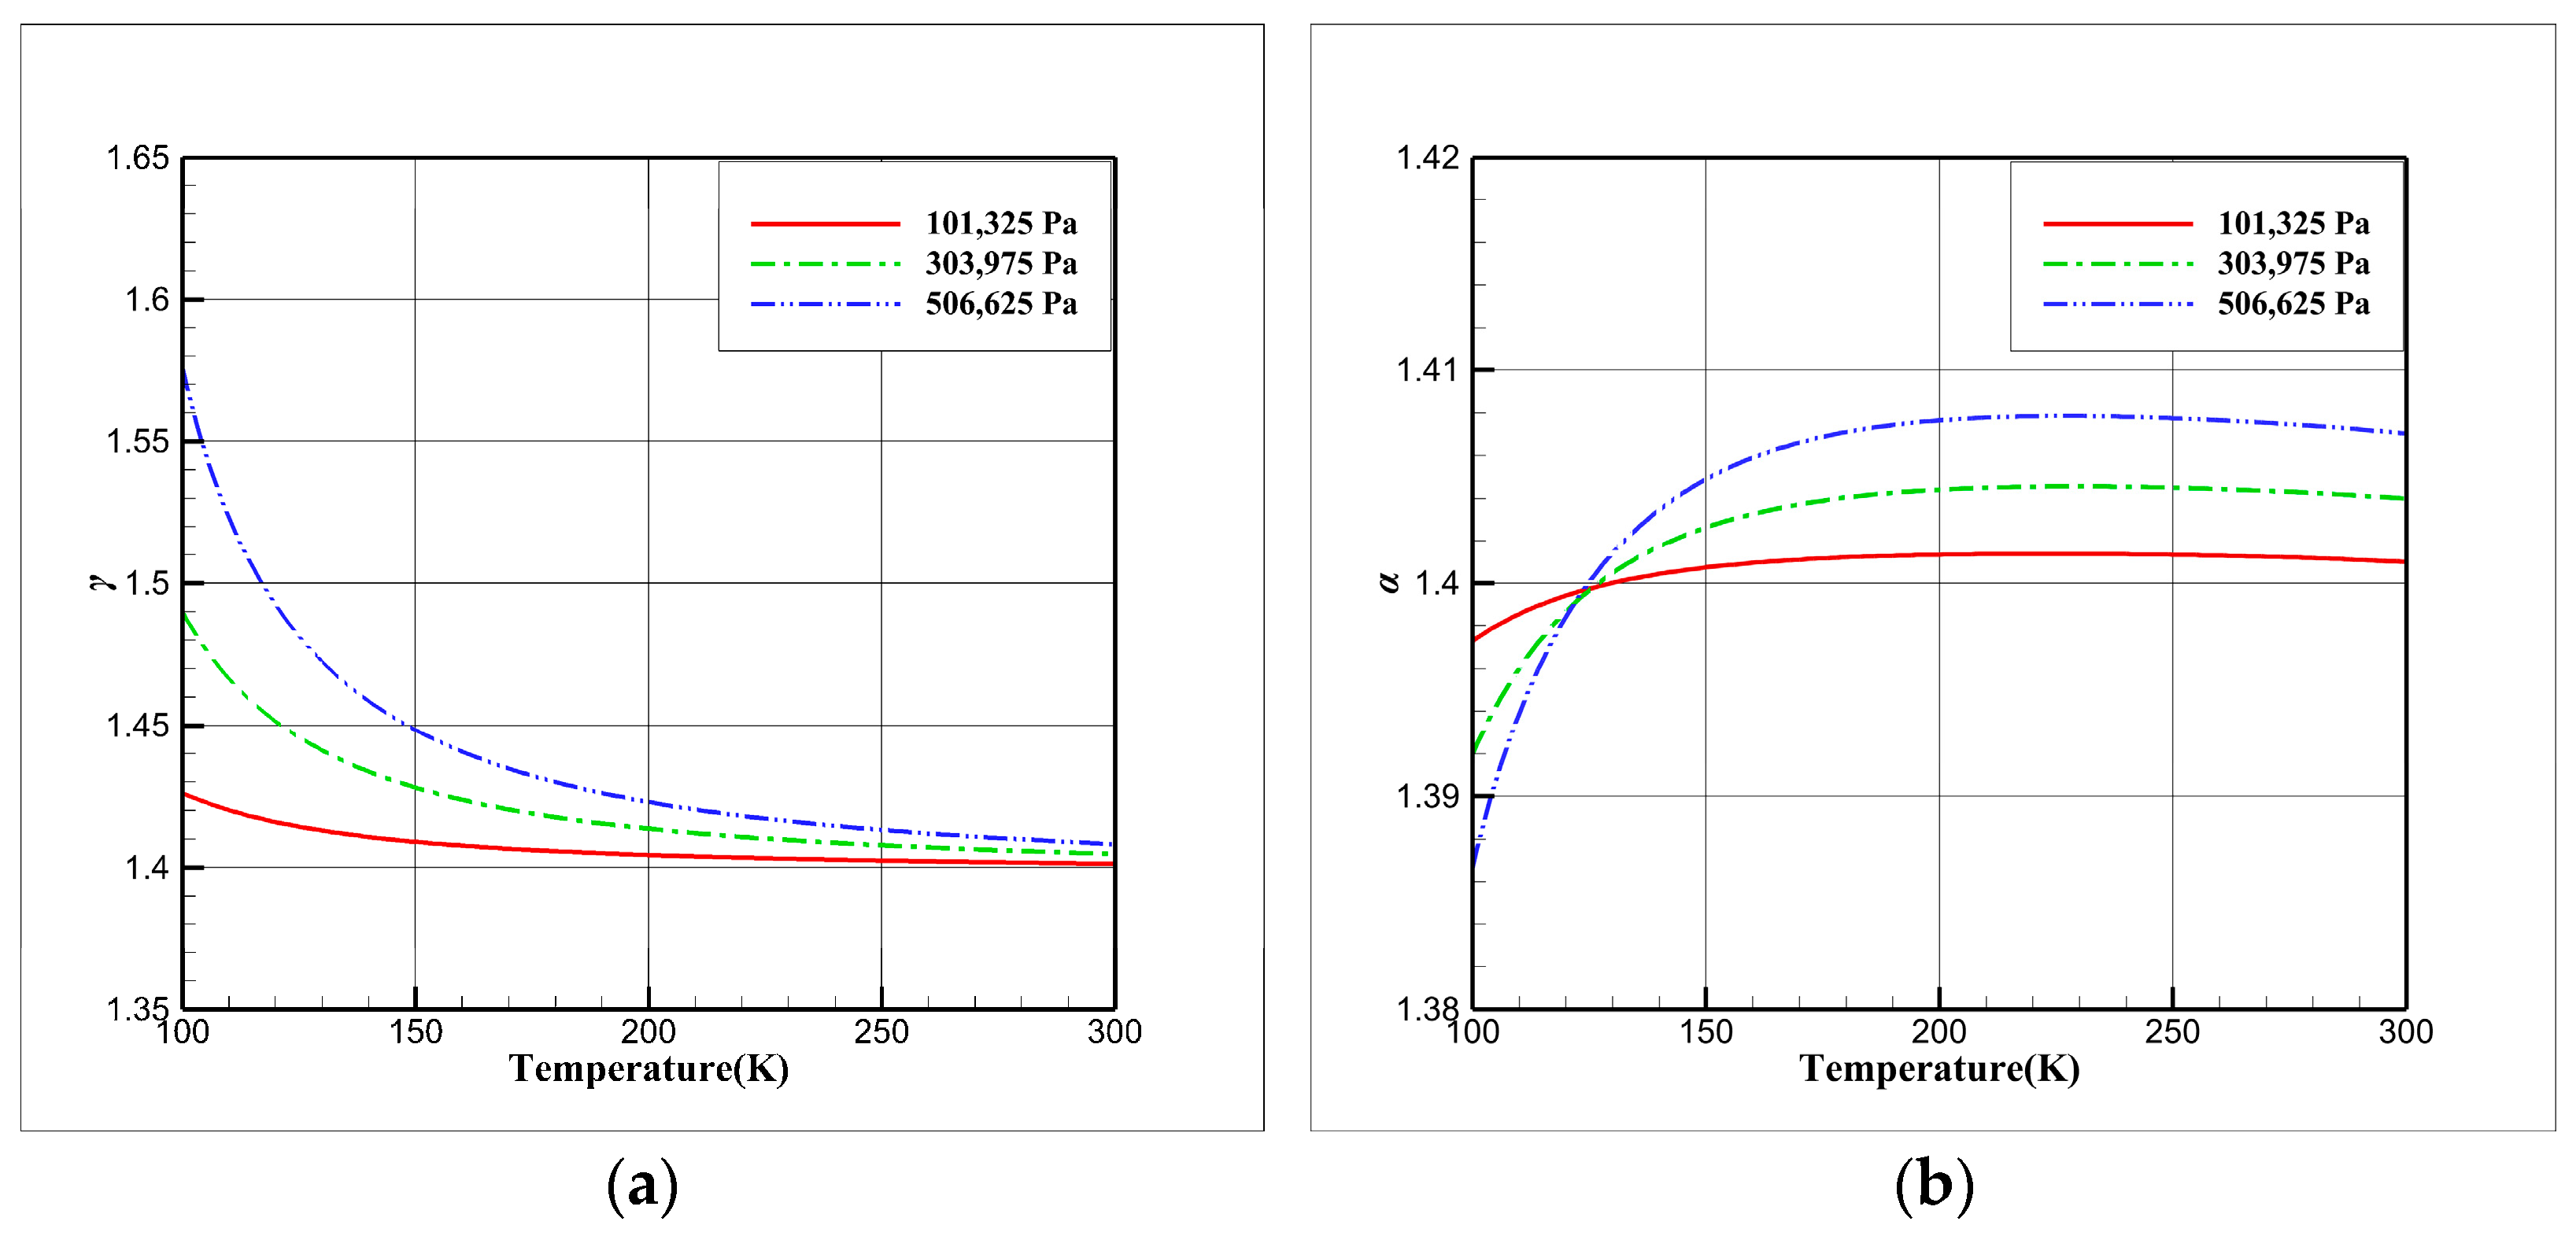
To explore the deviation between ideal isentropic expansion and real isentropic expansion, Figure 3 illustrates variation curves of the specific heat ratio and isentropic expansion coefficient at pressures of 101,325, 303,975, and 506,625 Pa, which were obtained from the NIST database. Notably, at 101,325 Pa, the specific heat ratio and isentropic expansion coefficient closely approximate the ideal gas specific heat ratio ( γ = 1.4 ) . With decreasing temperature, the specific heat ratio gradually increases, while the isentropic expansion coefficient declines. As pressure rises, the deviation between the real gas specific heat ratio and the ideal gas specific heat ratio steadily increases. At 506,625 Pa, the maximum relative error reaches 12%, whereas the isentropic expansion coefficient converges towards the ideal gas specific heat ratio of 1.4.
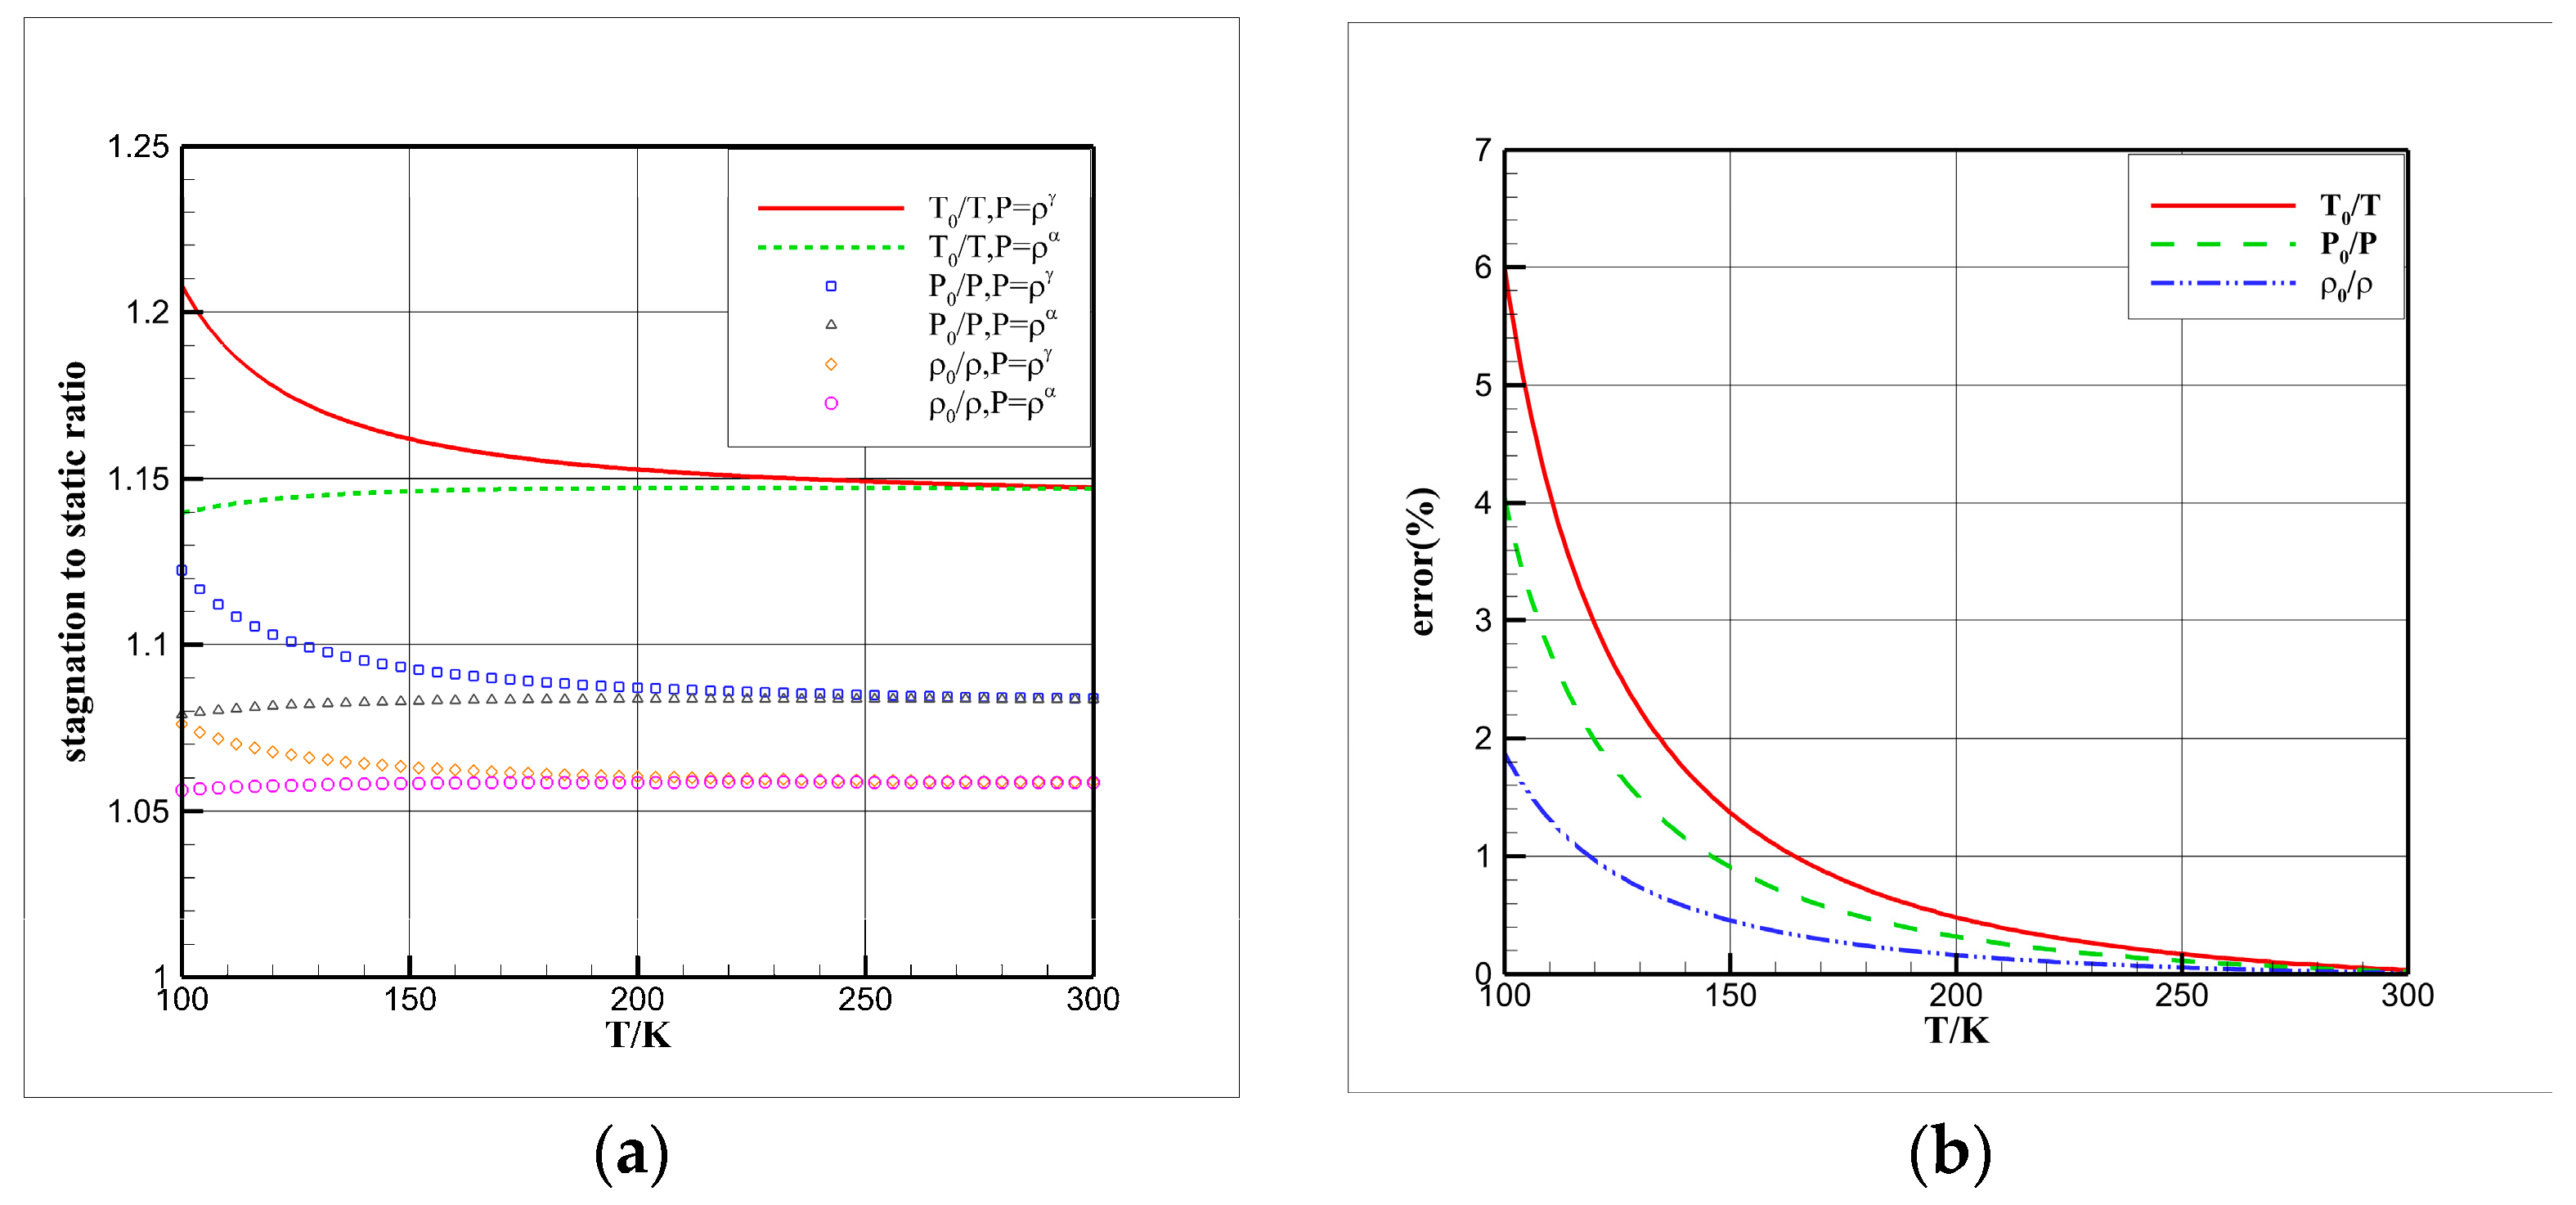
In general, Equation (4) serves as a direct method for converting the stagnation-to-static ratio. However, for cryogenic flows, utilizing Equation (4) can result in deviations in the outcomes. Figure 4 depicts variations in the flow parameters obtained from Equations (4) and (9) at 506,625 Pa with respect to temperature. From Figure 4a, it becomes obvious that when calculating flow parameters such as the stagnation-to-static ratio using the specific heat ratio, the results exhibit relatively high values, and this disparity becomes more pronounced as temperature gradually decreases. This observation indicates that, while the free stream’s p t , T t , and ρ t remain constant, the static parameters ( p , T , ρ ) derived from Equation (4) are smaller. To express the relative error in the results when employing different relationships more intuitively, we calculate the relative error using the results from Equation (9) as the reference value, as illustrated in Figure 4b. The relative error stemming from Equation (4) gradually increases with decreasing T , and the relative error between T 0 / T reaches approximately 6%, which could potentially impact the prediction of thermodynamic and transport properties.

3.2. Comparative Study of EOSs

Ideal gas EOSs, ARK EOS [23], and RK EOS, as well as thermodynamic data from the National Institute of Standards and Technology (NIST) database, were compared. Due to the high accuracy of the NIST database, it can be used as a reference value. Figure 5 displays density versus temperature curves obtained using the aforementioned EOSs at p = 101,325, 303,975, and 506,625 Pa. It is evident, in cryogenic temperatures, that the real gas EOS (RK/ARK EOS) fits better with the NIST data compared to the ideal gas EOS. As temperature gradually increases, the density of the ideal gas EOS deviates increasingly from that of the real gas EOSs. Comparing (a), (b), and (c), it becomes apparent that as pressure increases, the deviation of the ideal gas EOS also increases. Using the NIST database data as a reference, Figure 6 illustrates the relative errors of the ideal gas EOS and the RK/ARK EOSs.
As shown in Figure 6, at the same T , the relative errors of different EOSs gradually increase with an increase in pressure. However, the relative errors of the real gas EOSs (RK/ARK) are much smaller than that of the ideal gas EOS. When the pressure is 506,625 Pa, the maximum relative error of the ideal gas EOS is about 10%, while the maximum relative error of the ARK equation of state is only 0.14%.

3.3. Comparative Study of Viscosity Models

This article conducts a comparative analysis of the Sutherland law, the gas viscosity model introduced by Chung et al. [27] (hereinafter referred to as the Chung viscosity model), and the gas viscosity model proposed by Lemmon et al. [28] (hereinafter referred to as the Lemmon viscosity model), as utilized within the NIST database. Figure 7 illustrates the viscosity variation with temperature obtained from each model under different pressure conditions of 101,325, 303,975, and 506,625 Pa. Given the high precision of the Lemmon viscosity model, its viscosity values serve as a reference for evaluating the relative errors of the various models, as depicted in Figure 8. Examining Figure 7 and Figure 8, it becomes obvious that at identical pressures, viscosity steadily increases with rising temperature, while the relative error between different models gradually decreases. Notably, the relative error associated with the Chung model is marginally higher than that of the Sutherland law. Furthermore, as the pressure escalates, the relative errors among models gradually increase. At a pressure of 506,625 Pa, the maximum relative error attributable to the Sutherland law amounts to approximately 5%, potentially impacting the precision of aerofoil aerodynamic characteristic calculations.

3.4. Comparative Study of Thermal Conductivity Models

This research conducts a comparative study on the thermal conductivity models proposed by Lemmon et al. [28] (hereinafter referred to as the Lemmon thermal conductivity model), Chung et al. [27] (hereinafter referred to as the Chung thermal conductivity model), and a constant which is commonly employed.
The thermal conductivity values obtained from these different models exhibit temperature-dependent variations, as illustrated in Figure 9. It is noteworthy that the thermal conductivity values obtained from the Chung and Lemmon models closely resemble each other across various pressure conditions. Due to the high precision of the Lemmon thermal conductivity model, it serves as a reference for assessing the relative errors of the Chung thermal conductivity model and the constant. The relative errors, presented as functions of temperature, are depicted in Figure 10.
An analysis of the data in Figure 9 and Figure 10 reveals a noteworthy trend: the thermal conductivity values obtained from the Chung thermal conductivity model and the Lemmon thermal conductivity model demonstrate similar temperature-dependent behaviours. Remarkably, within the pressure range of 101,325–506,625 Pa, these models exhibit relative errors consistently below 5%.

4. Influence Analysis of Gas Models on Numerical Simulations of Cryogenic Flow

To study the impact of various gas models on CFD calculations, different EOSs, isentropic relations, viscosity models, and thermal conductivity models were selected for a comparative analysis of transonic airflow over an aerofoil’s surface. Given that altering the Reynolds number R e is a comprehensive consequence of adjusting the stagnation temperature T 0 , stagnation pressure p 0 , and Mach number M a , this study chose three different R e values. The calculation conditions for different EOSs, viscosity models, and thermal conductivity models at different R e values are detailed in Table 2.

4.1. Governing Equations and Numerical Schemes

For a compressible flow, the conservative form of the Navier–Stokes equation can be described as
Q t + · F F v = S
where Q = ρ ρ u ρ e and F = ρ u T ρ u u T + p I ( ρ e + p ) u T , u is a velocity vector, e is the total specific energy, and F v is a viscous flux vector.
The Roe Flux Difference Splitting Scheme [29] was used to solve the governing equation, in which a second-order upwind scheme was used for spatial discretization. Different gas models were coupled to calculate the physical properties of nitrogen gas. The Spalart–Allmaras model was used for the prediction of turbulent flow since this model can deal well with the adverse pressure gradient within the boundary layer.

4.2. Grid Independence and the Validity

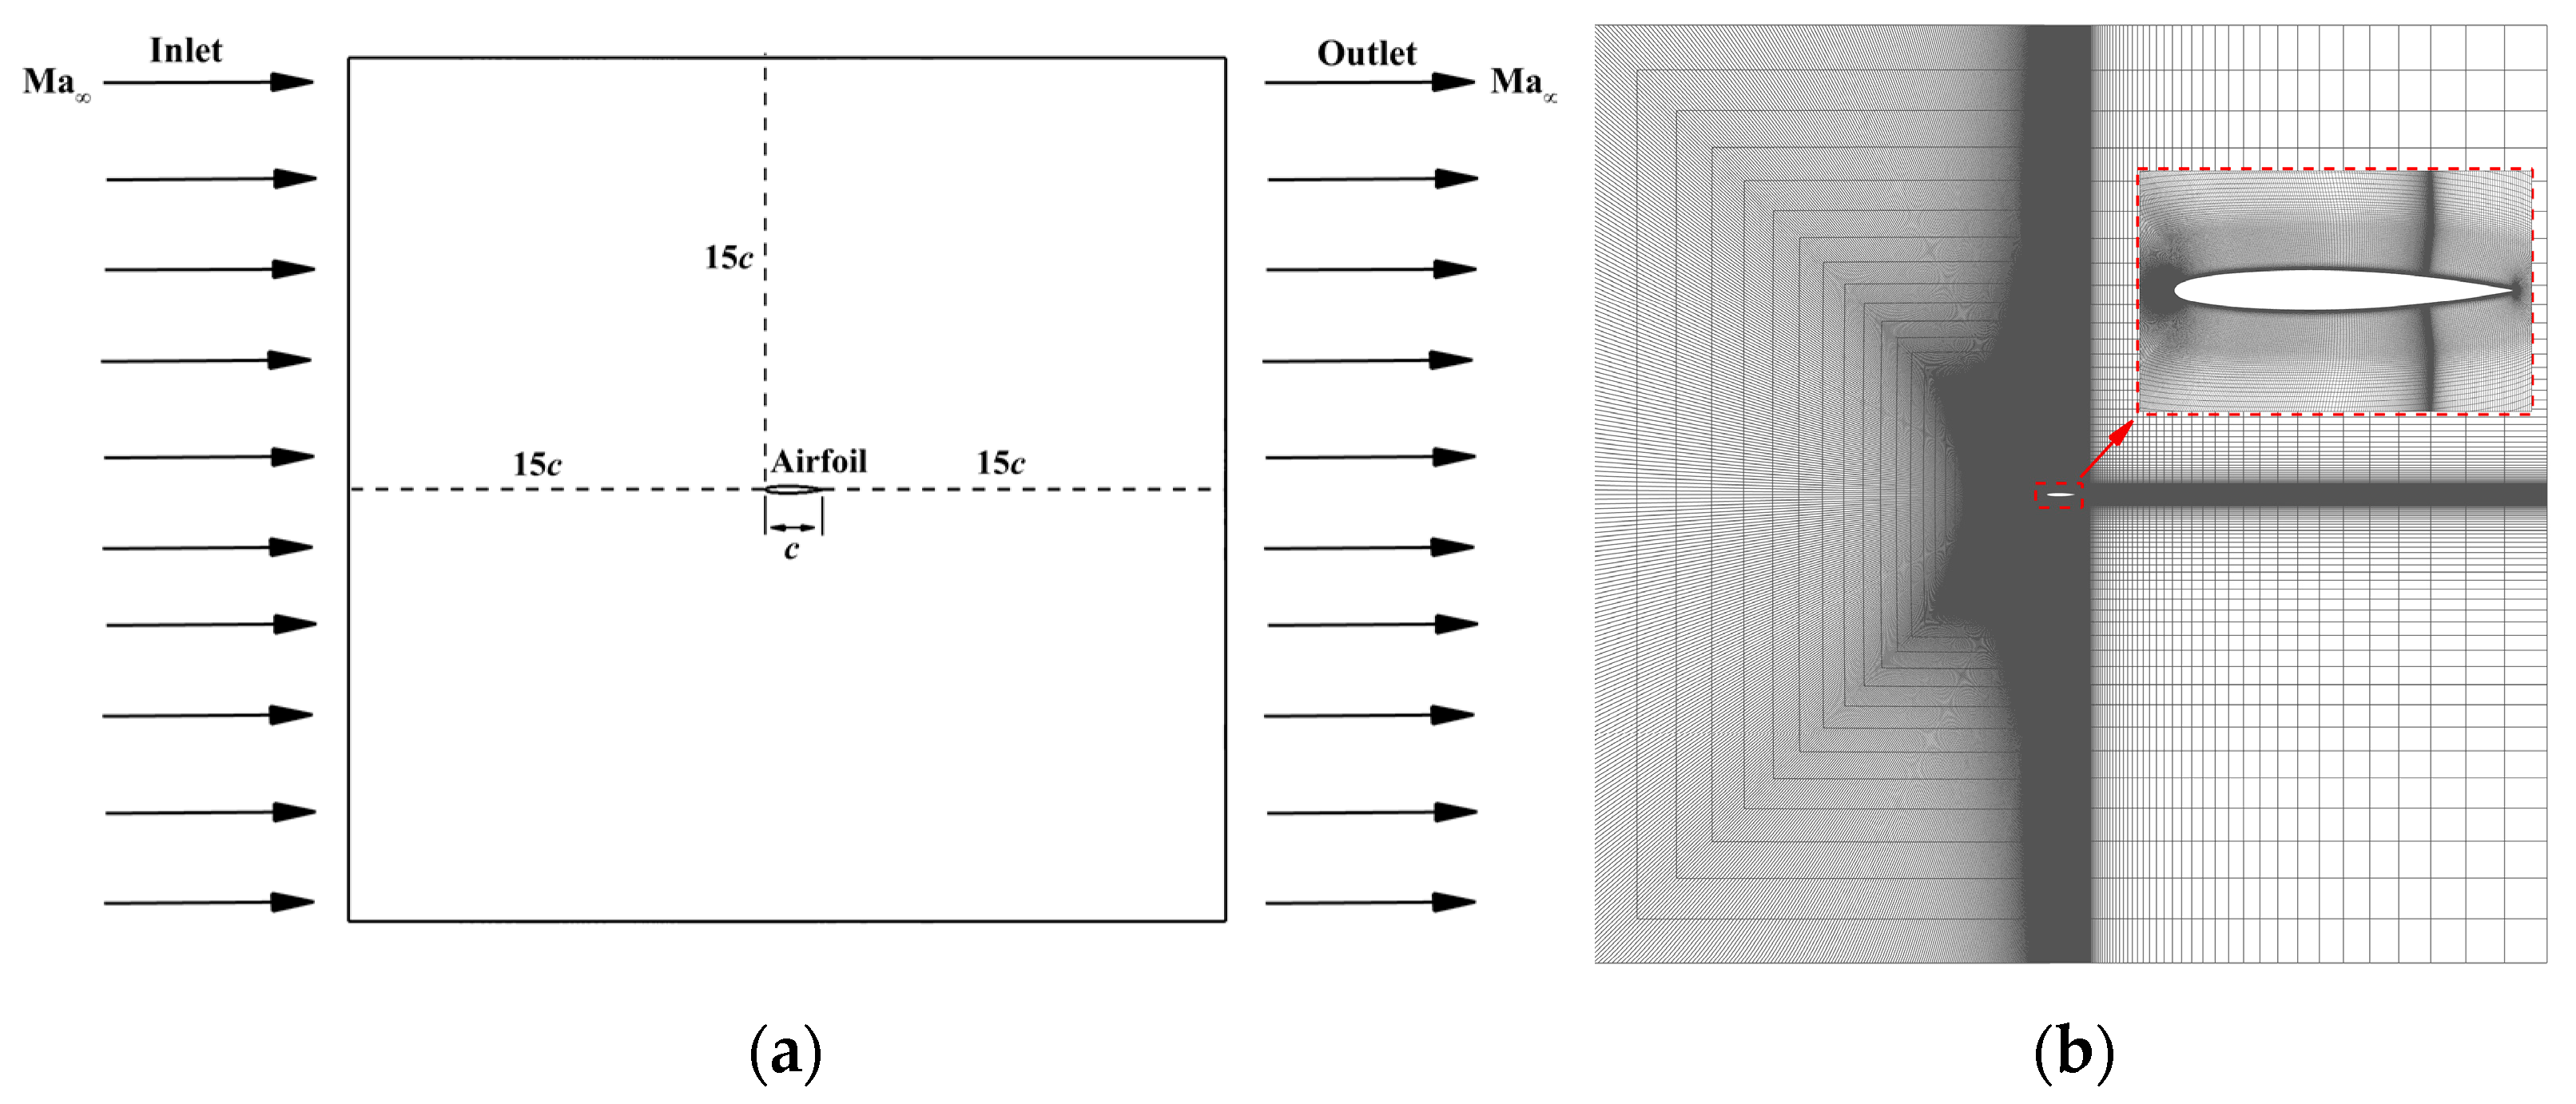
This research delves into the impact of gas models on CFD calculations for the NACA0012-64 aerofoil, a design frequently utilized in various cryogenic wind tunnel experiments and simulation studies, and the chord length c of the aerofoil is 0.137 m. The computational domain assumes a rectangular shape, as shown in Figure 11a. The dimensions of the calculation domain are 31c × 30c, with the inlet positioned 15c from the aerofoil’s leading edge and the outlet situated 15c from the trailing edge. To mitigate the impact of wall effects on the aerofoil’s surface pressure distribution, the upper and lower boundaries of the computational domain are positioned 15c away from the aerofoil. Once the computational domain is established, a structured grid is generated, as shown in Figure 11b.
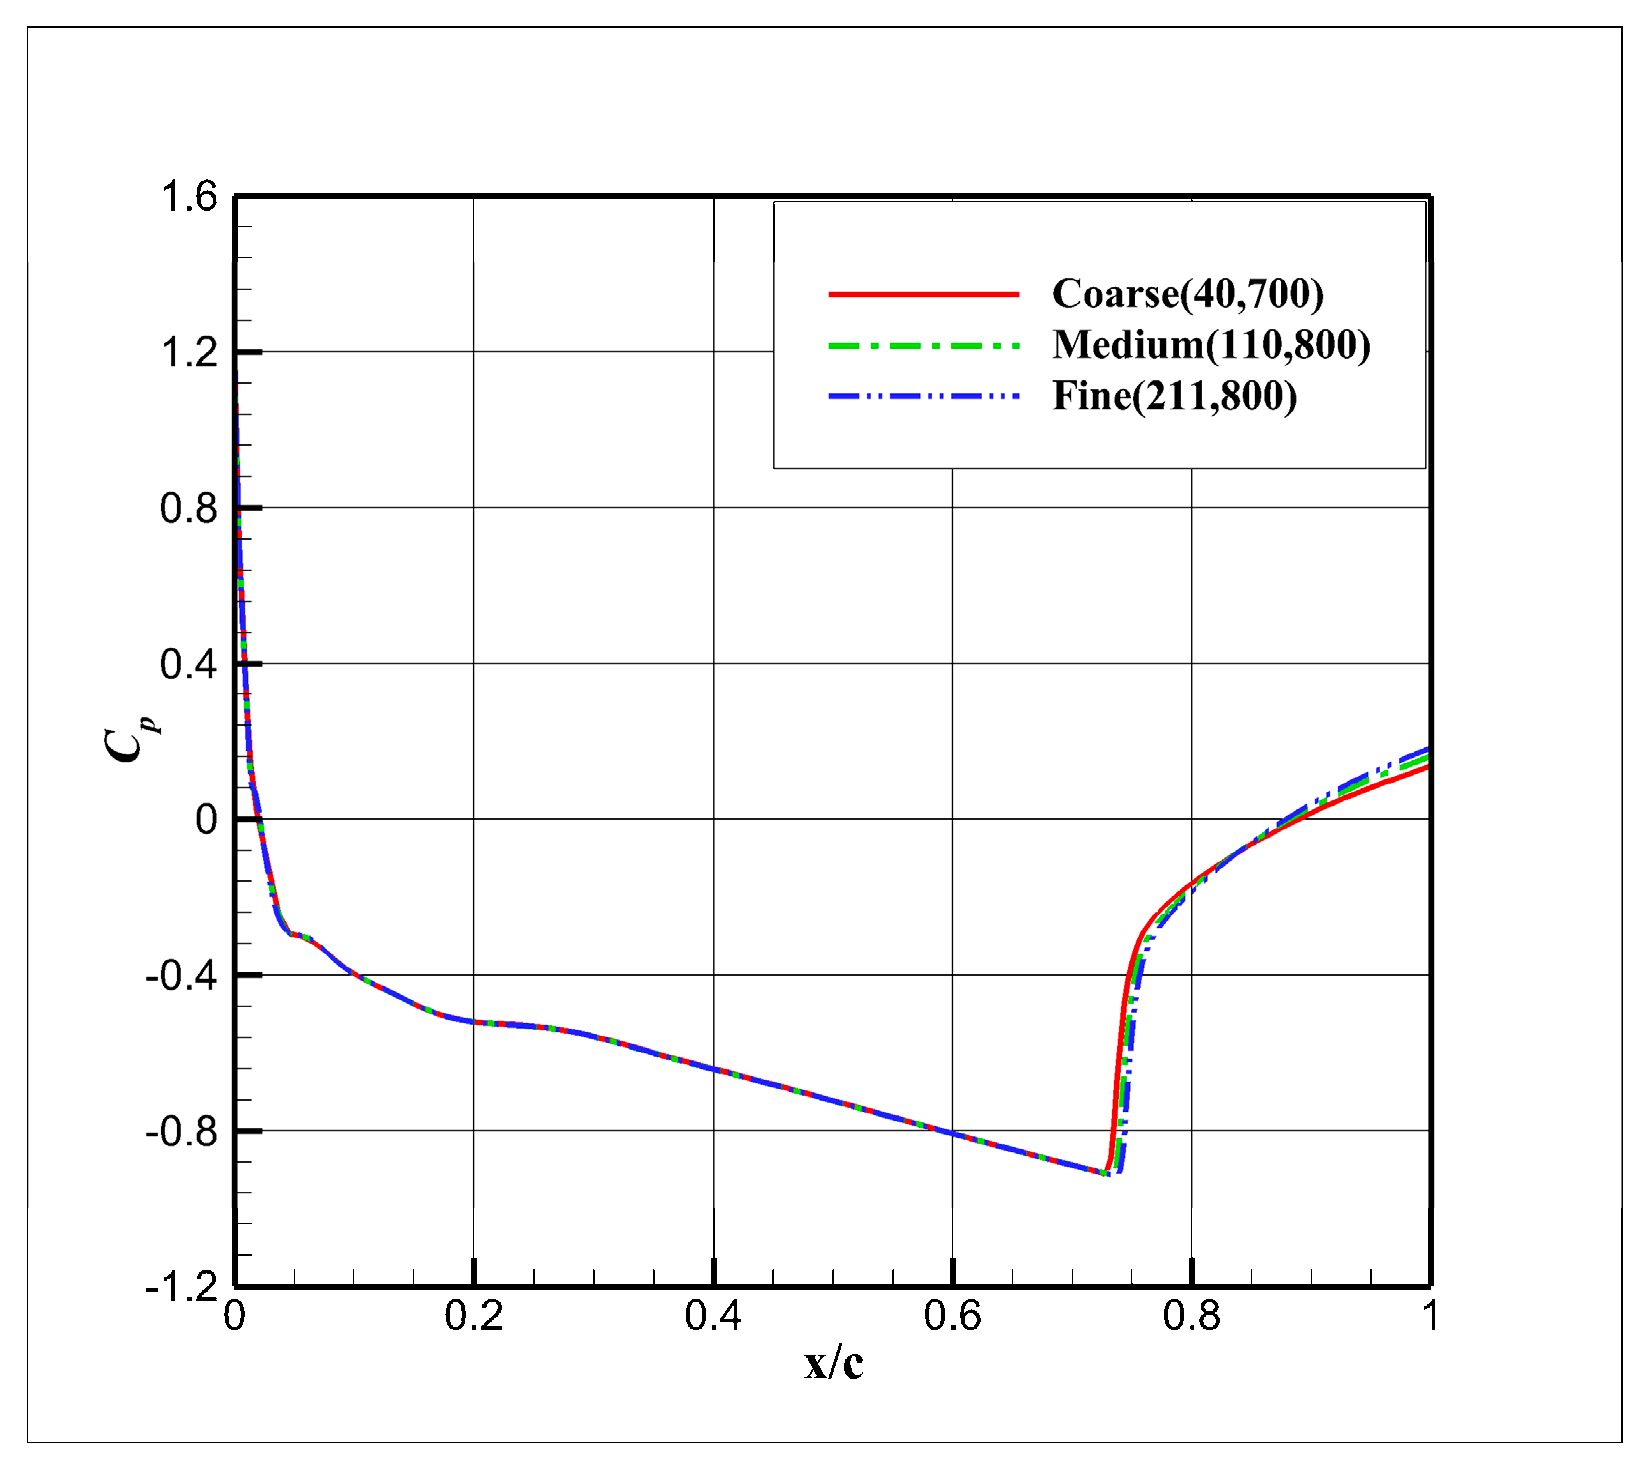
Three sets of grids with varying sizes were created to assess grid independence. Given that the pressure coefficient ( C p ) holds significant importance as an aerodynamic coefficient, the grid independence assessment primarily focuses on comparing C p values calculated using different grids. This study computed the pressure coefficient and drag coefficient using Equation (23) and Equation (24), respectively.
C p = p p q
C d = D q S
In the given equations, where C p is the pressure coefficient, C d is the drag coefficient, p represents the static pressure on the aerofoil’s surface, p denotes the static pressure in the free stream, and q signifies the dynamic pressure in the free stream and can be computed as q = 0.5 ρ V 2 . Here, D represents the drag force exerted on the aerofoil, and S represents the reference area of the aerofoil. For two-dimensional aerofoils, S = 1 × c = c , while c represents the chord length of the aerofoil.
To assess the computational performance of the grid under cryogenic temperature conditions, the total temperature at the pressure inlet is set at 116.3 K, the total pressure is 506,625 Pa, and the static pressure can be derived using Equation (4). The state equation utilizes the ARK EOS, the viscosity model adopts the Lemmon viscosity model, and the gas thermal conductivity model employs the Lemmon thermal conductivity model. Figure 12 presents the pressure coefficient curves obtained from various grid calculations. Notably, a shock wave is observed at approximately relative position x / c 0.75 on the aerofoil’s surface. The results obtained from the medium grid closely align with those from the fine grid. Consequently, to strike a balance between accuracy and computational resource conservation, the medium mesh is deemed suitable for other simulations.

4.3. Influence Analysis of Isentropic Relations on Numerical Simulation

In cryogenic flow calculations, researchers have employed various methods to calculate the isentropic relationships of gases. These methods can be summarized as follows:
(1)
Considering the real gas effect, combining the isentropic relationship in Equation (5) with the thermodynamic properties obtained from the real gas EOS, as shown in Ref. [2];
(2)
Considering the real gas effect. However, instead of using the thermodynamic properties obtained from the real gas EOS, the isentropic relationship in Equation (3) is combined with the properties derived from the ideal gas EOS. In this case, the free-stream specific heat ratio in the real gas state is utilized as the expansion coefficient, which was previously used in Ref. [15];
(3)
The real gas effect is not taken into account, the isentropic relationship in Equation (3) is combined with the thermodynamic properties obtained via the ideal gas EOS, and the specific heat ratio is 1.4. This method was used in Refs. [20,30].
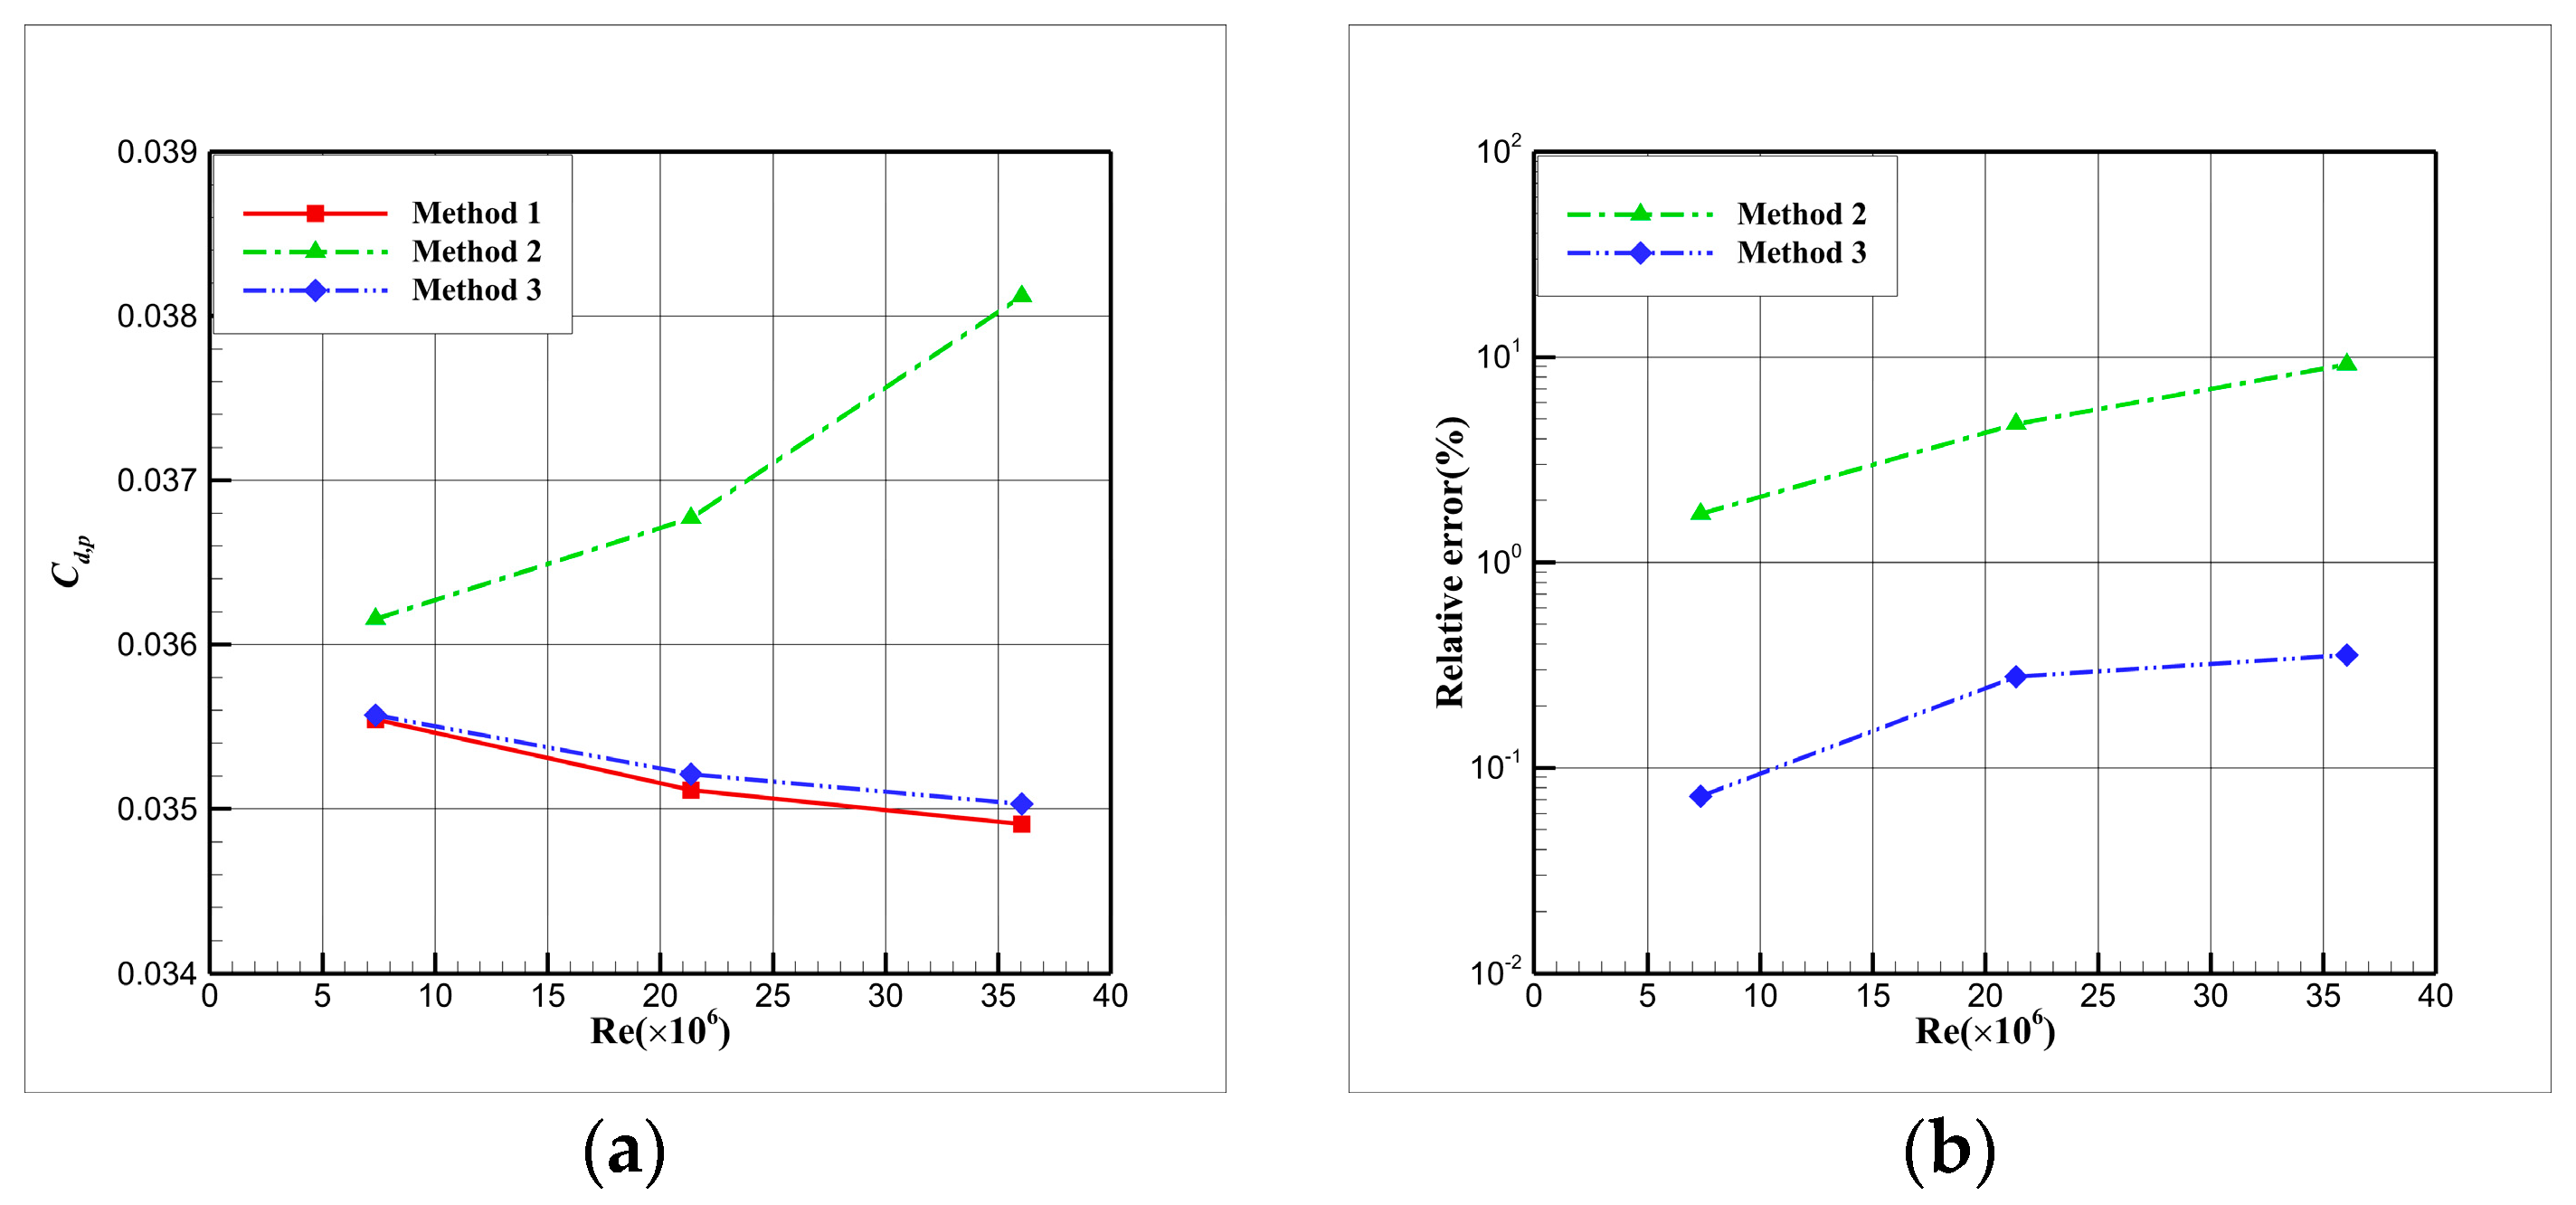
To ensure the accuracy and reliability of cryogenic flow calculations, it is essential to verify the impact of the three aforementioned calculation methods on the results. In order to conduct this study, researchers utilized the detailed calculation conditions outlined in Table 3. The γ of the real gas used in Method 2 is adjusted according to the free stream. The viscous drag coefficient (denoted as C d , v ) and pressure drag coefficient C d , p calculated for these three methods are presented in Figure 13 and Figure 14.
The results from Figure 13 and Figure 14, show the considerable impact of isentropic relations on the solution. C d , p and C d , v exhibit diverse variations with Re when calculated using different methods, while the C d , p and C d , v obtained via Method (1) and Method (3) gradually decrease as R e increases, and the C d , p calculated via Method (2) deviates from this trend and shows an opposite behaviour. To assess the reliability of the different methods, the real gas solution (calculated via Method 1) was chosen as the reference value for calculating relative errors. Figure 13b and Figure 14b illustrate that the relative errors for C d , v and C d , p which increase as R e increases. Notably, when Method (2) was used and R e = 36.05 × 10 6 , it led to a 9.17% error in C d , p and a 3.65% error in C d , v , while the relative error of Method (3) is much less than 1% at a different R e . These results suggest that for cryogenic flow scenarios, combining the ideal gas EOS with real gas specific heat ratios can introduce significant errors in the results, potentially leading to erroneous conclusions regarding the prominence of real gas effects.
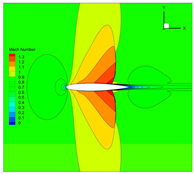
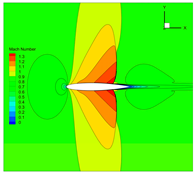
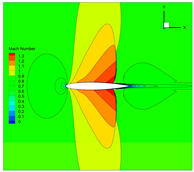
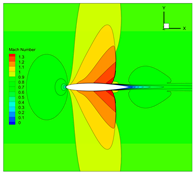
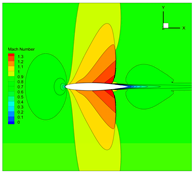
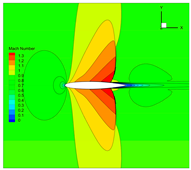
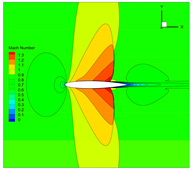
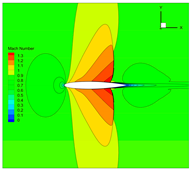
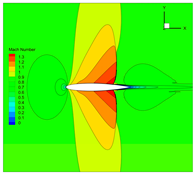
To validate this conclusion, Mach number contours for different Methods are presented in Table 4. Upon examining the Mach number contours, a significant expansion in the supersonic region’s size is evident when using Method (2), significantly impacting the distribution of C p . To assess the impact of isentropic relations on C p , pressure coefficients for different isentropic relations at various R e values are shown in Figure 15. To render the results dimensionless, the relative position x / c serves as the x coordinate.
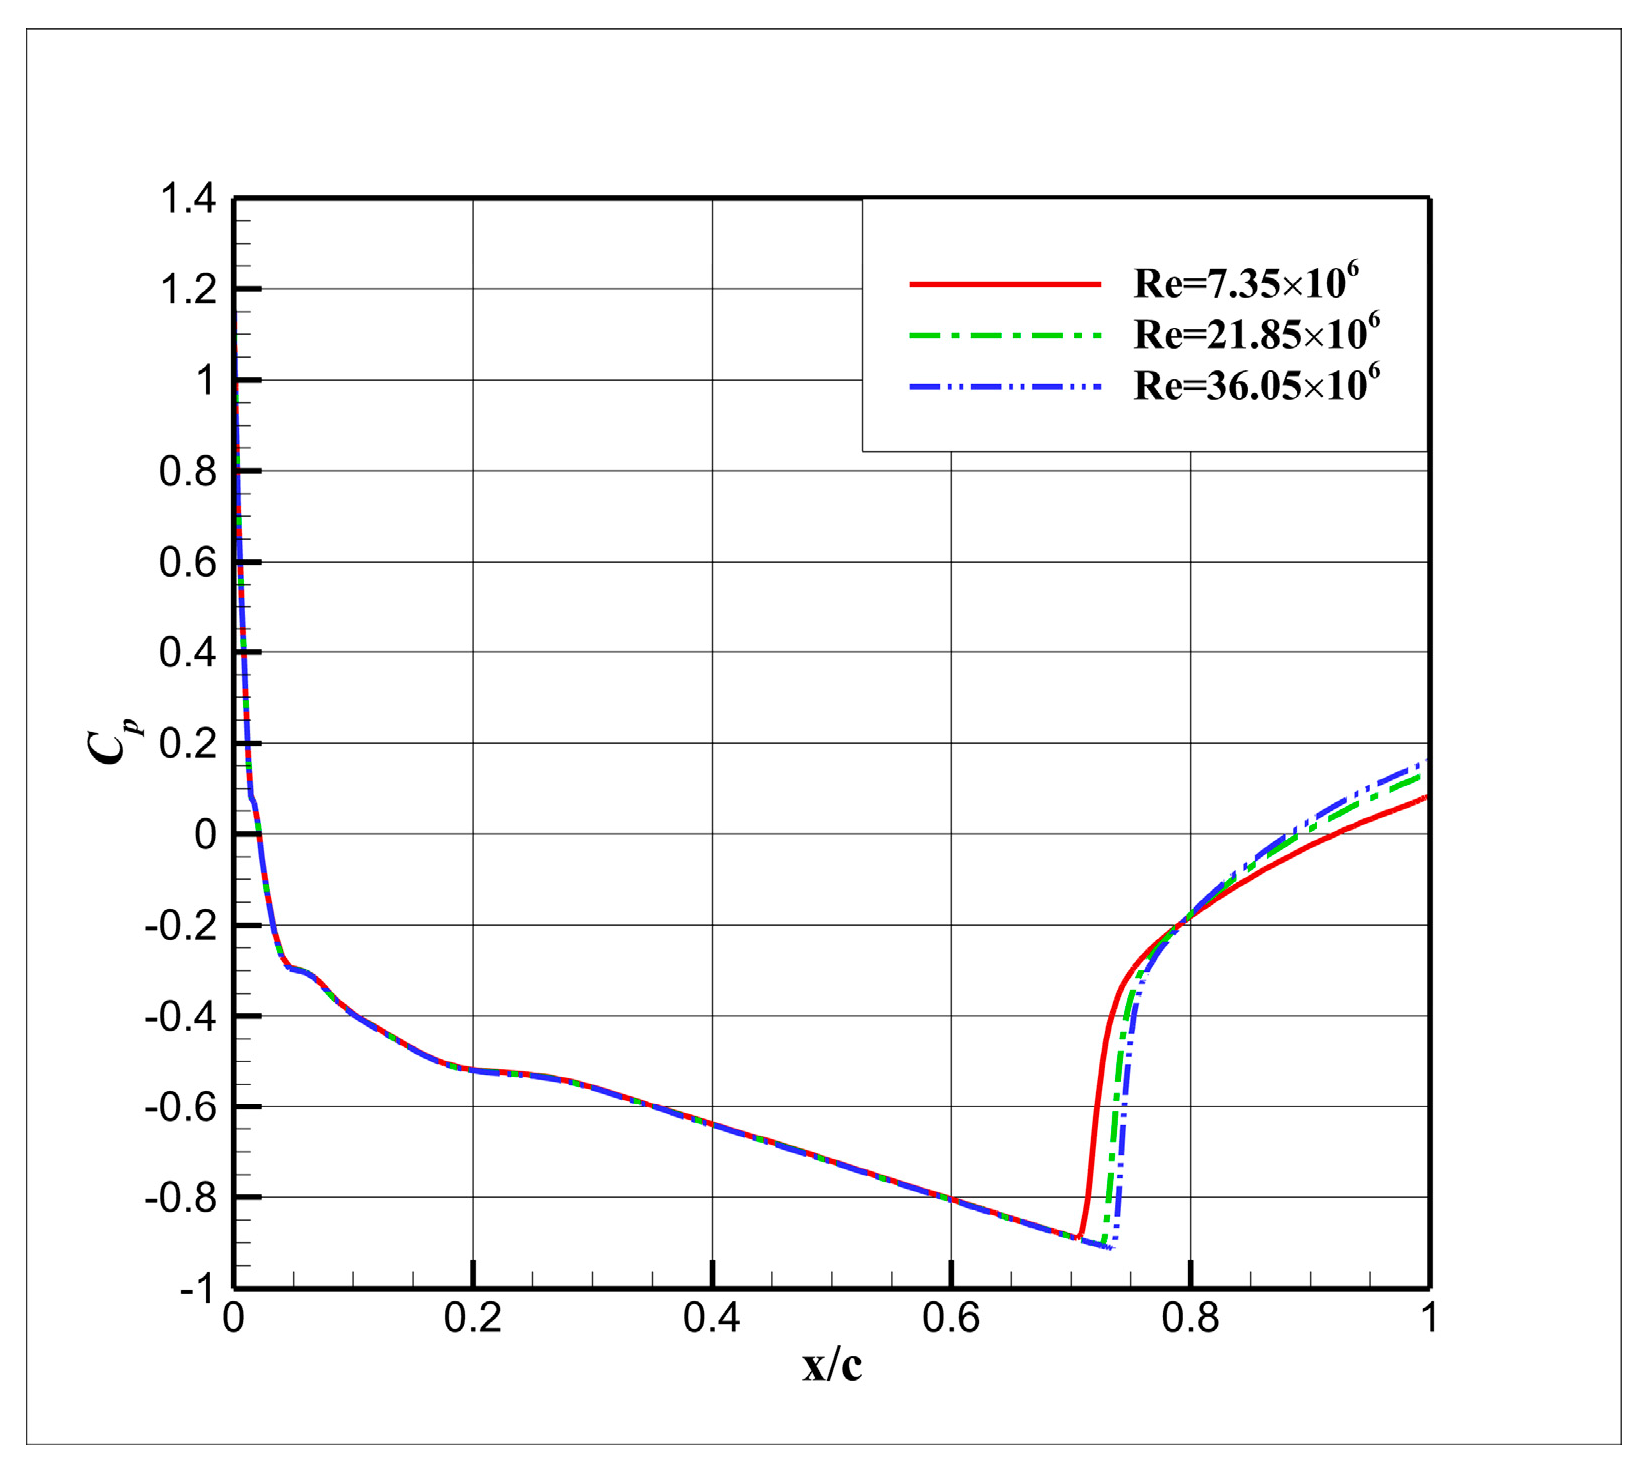
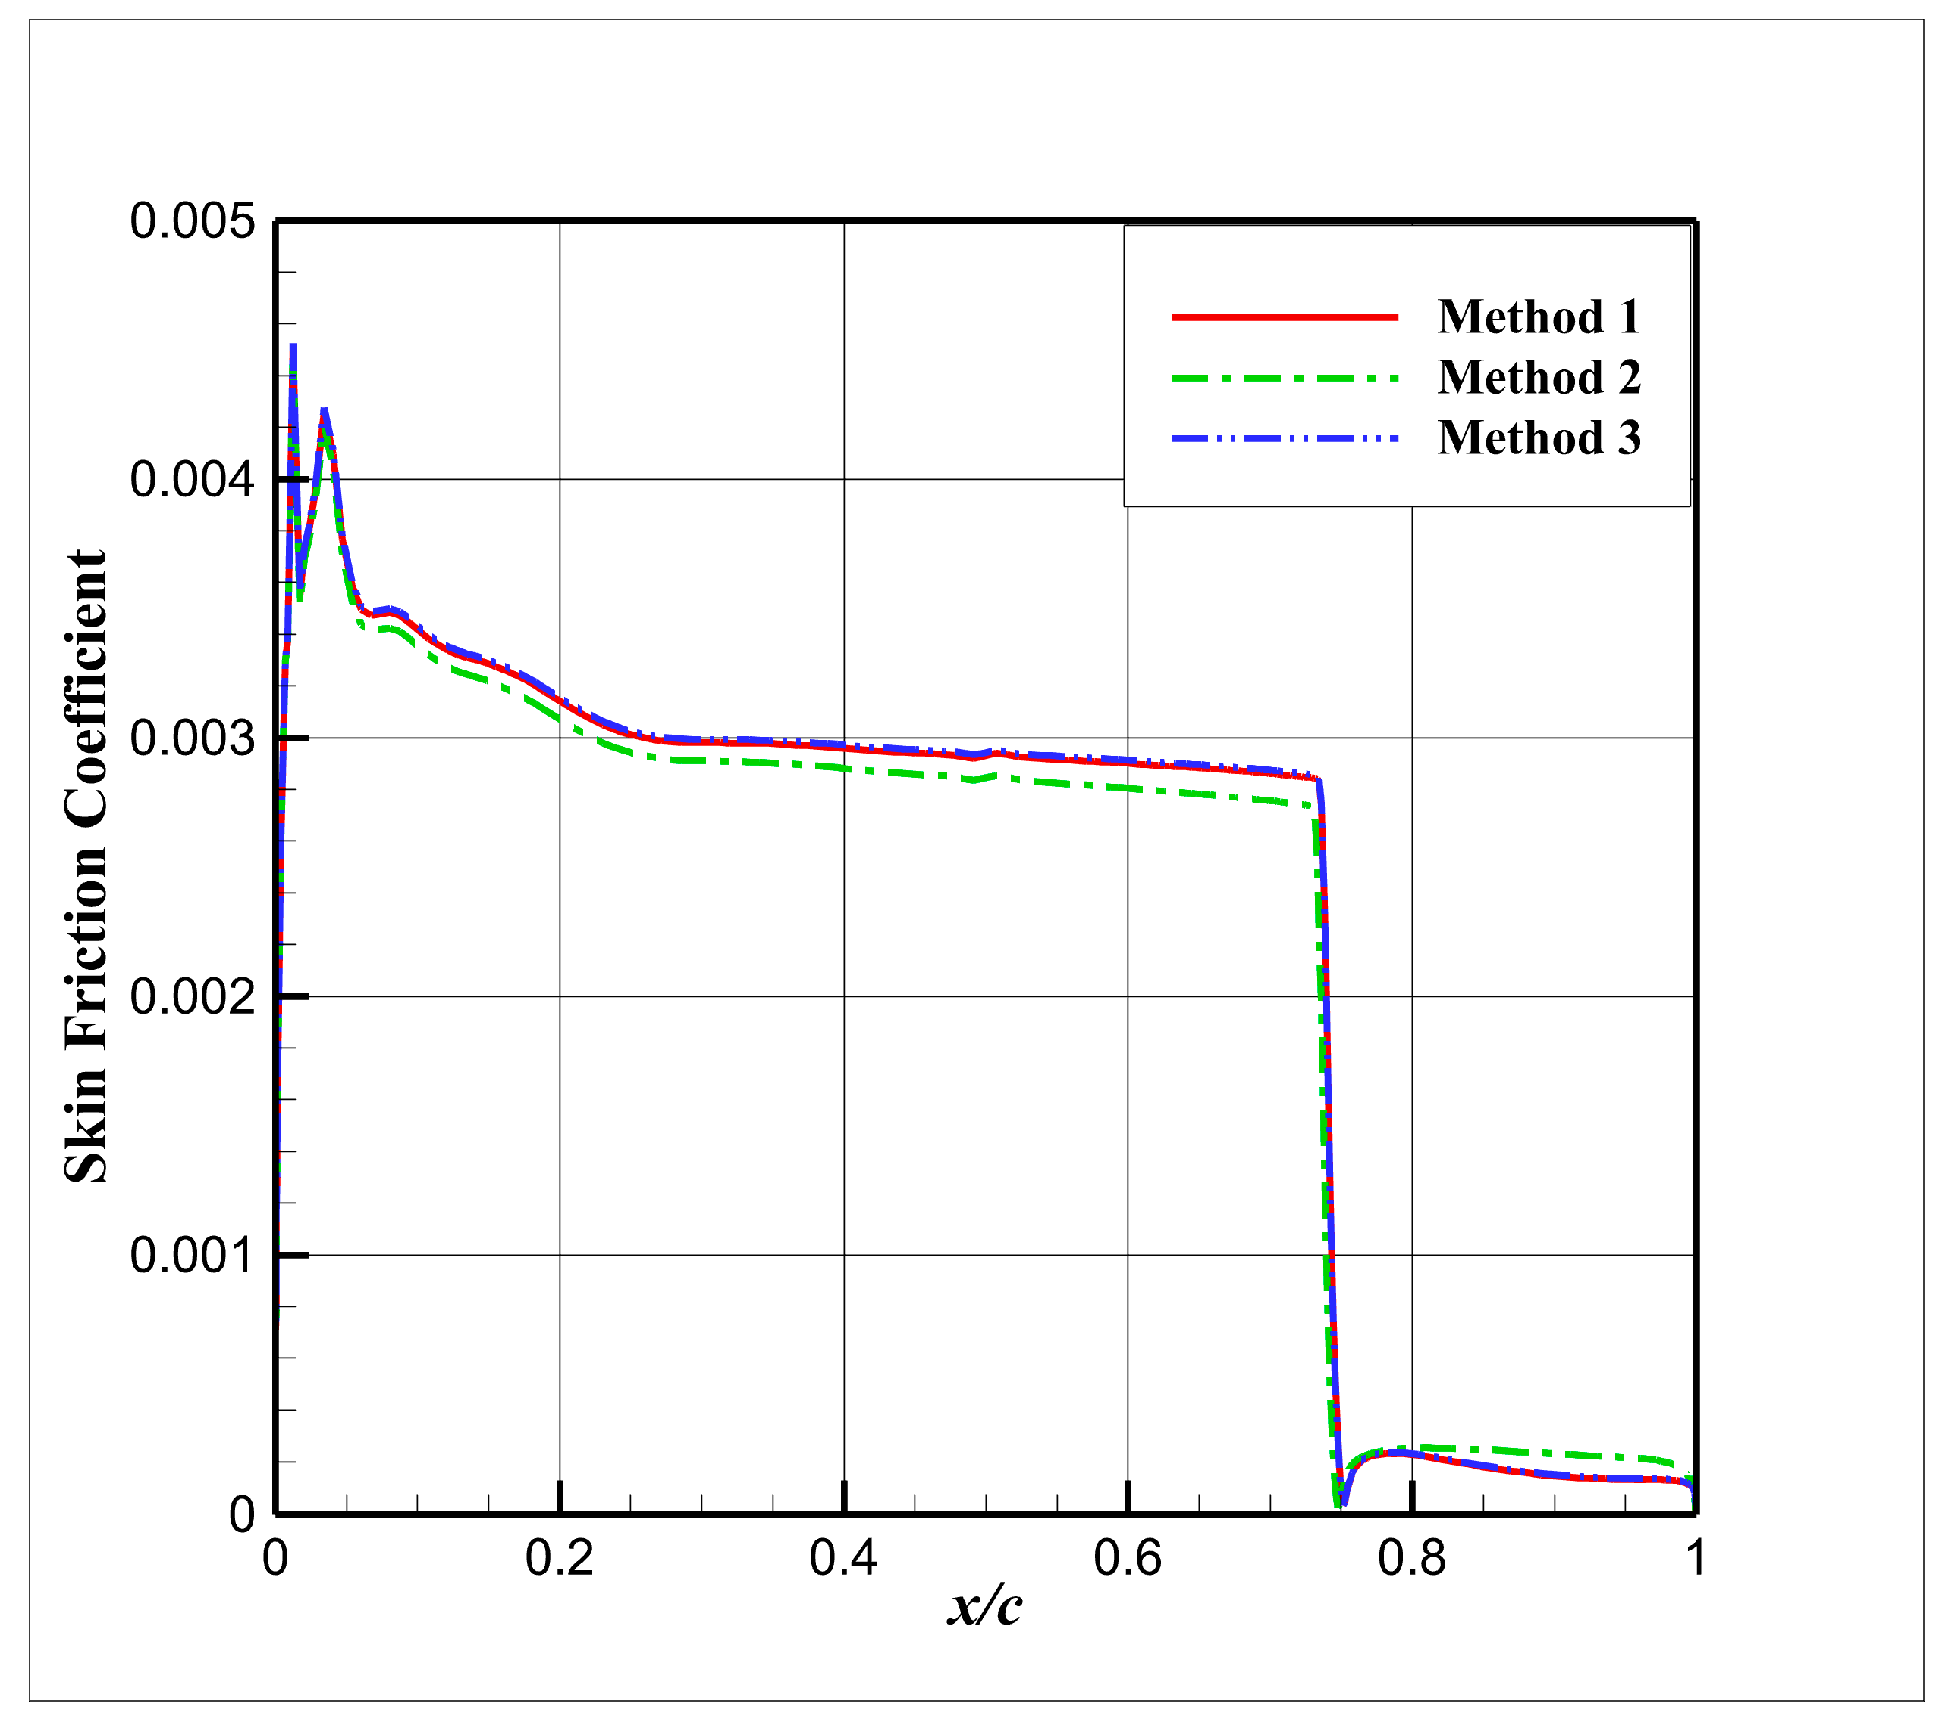
Figure 15 underscores substantial disparities in the calculated pressure coefficient C p among different methods, highlighting the undeniable influence of isentropic relations on CFD calculations. At the same R e , using Method 2 will lead to a significant deviation in the pressure coefficient C p from the real gas solution (Method 1), while the pressure coefficient C p calculated using an ideal gas (Method 3) is similar to the real gas solution (Method 1). With an increase in R e , the degree of deviation of the pressure coefficient C p calculated via Method 2 gradually increases. It should be noted that although the surface pressure coefficients obtained by the same method at different Reynolds numbers appear to be quite similar, the positions of the shock wave obtained still have deviations, as shown in Figure 16. To further scrutinize the impact of isentropic relationships, the skin friction coefficient of the aerofoil at R e = 36.05 × 10 6 is presented in Figure 17.
Figure 17 clearly demonstrates that the utilization of different isentropic relations undeniably influences the surface friction coefficient. Notably, the skin friction coefficient gradually decreases before the shock wave and increases after the shock wave when Method 2 is used. For a more straightforward representation of this effect, the real gas solution (Method 1) was used as a reference, and Figure 18 presents the relative error in the surface friction coefficient before ( 0 x / c 0.7 ) and after the shock wave ( 0.8 x / c 1 ).
Figure 18 reveals that the relative error of the skin friction coefficient gradually increases as the relative position x / c progresses before the shock wave location. Notably, Method 2 is associated with greater relative errors, while the relative errors of Method 3 are much less than 1%. After passing the shock wave, the rate of relative error growth intensifies, with the relative error for Method 2 reaching a substantial 63%, while the relative error of Method 3 is less than 5%.
In conclusion, employing different isentropic relationships can lead to noteworthy discrepancies in CFD calculation outcomes. In the context of cryogenic flow, despite gas properties deviating from ideal gas behaviour, the ideal gas EOS is still acceptable if researchers combine it with an ideal gas specific heat ratio ( γ = 1.4 ). A real gas specific heat ratio cannot be combined with the ideal gas EOS and isentropic relation Equation (3) since this method can lead to erroneous conclusions that the real gas effect is noticeable. A detailed comparison of different EOSs is provided in Section 4.4

4.4. Influence Analysis of EOSs on Numerical Simulation

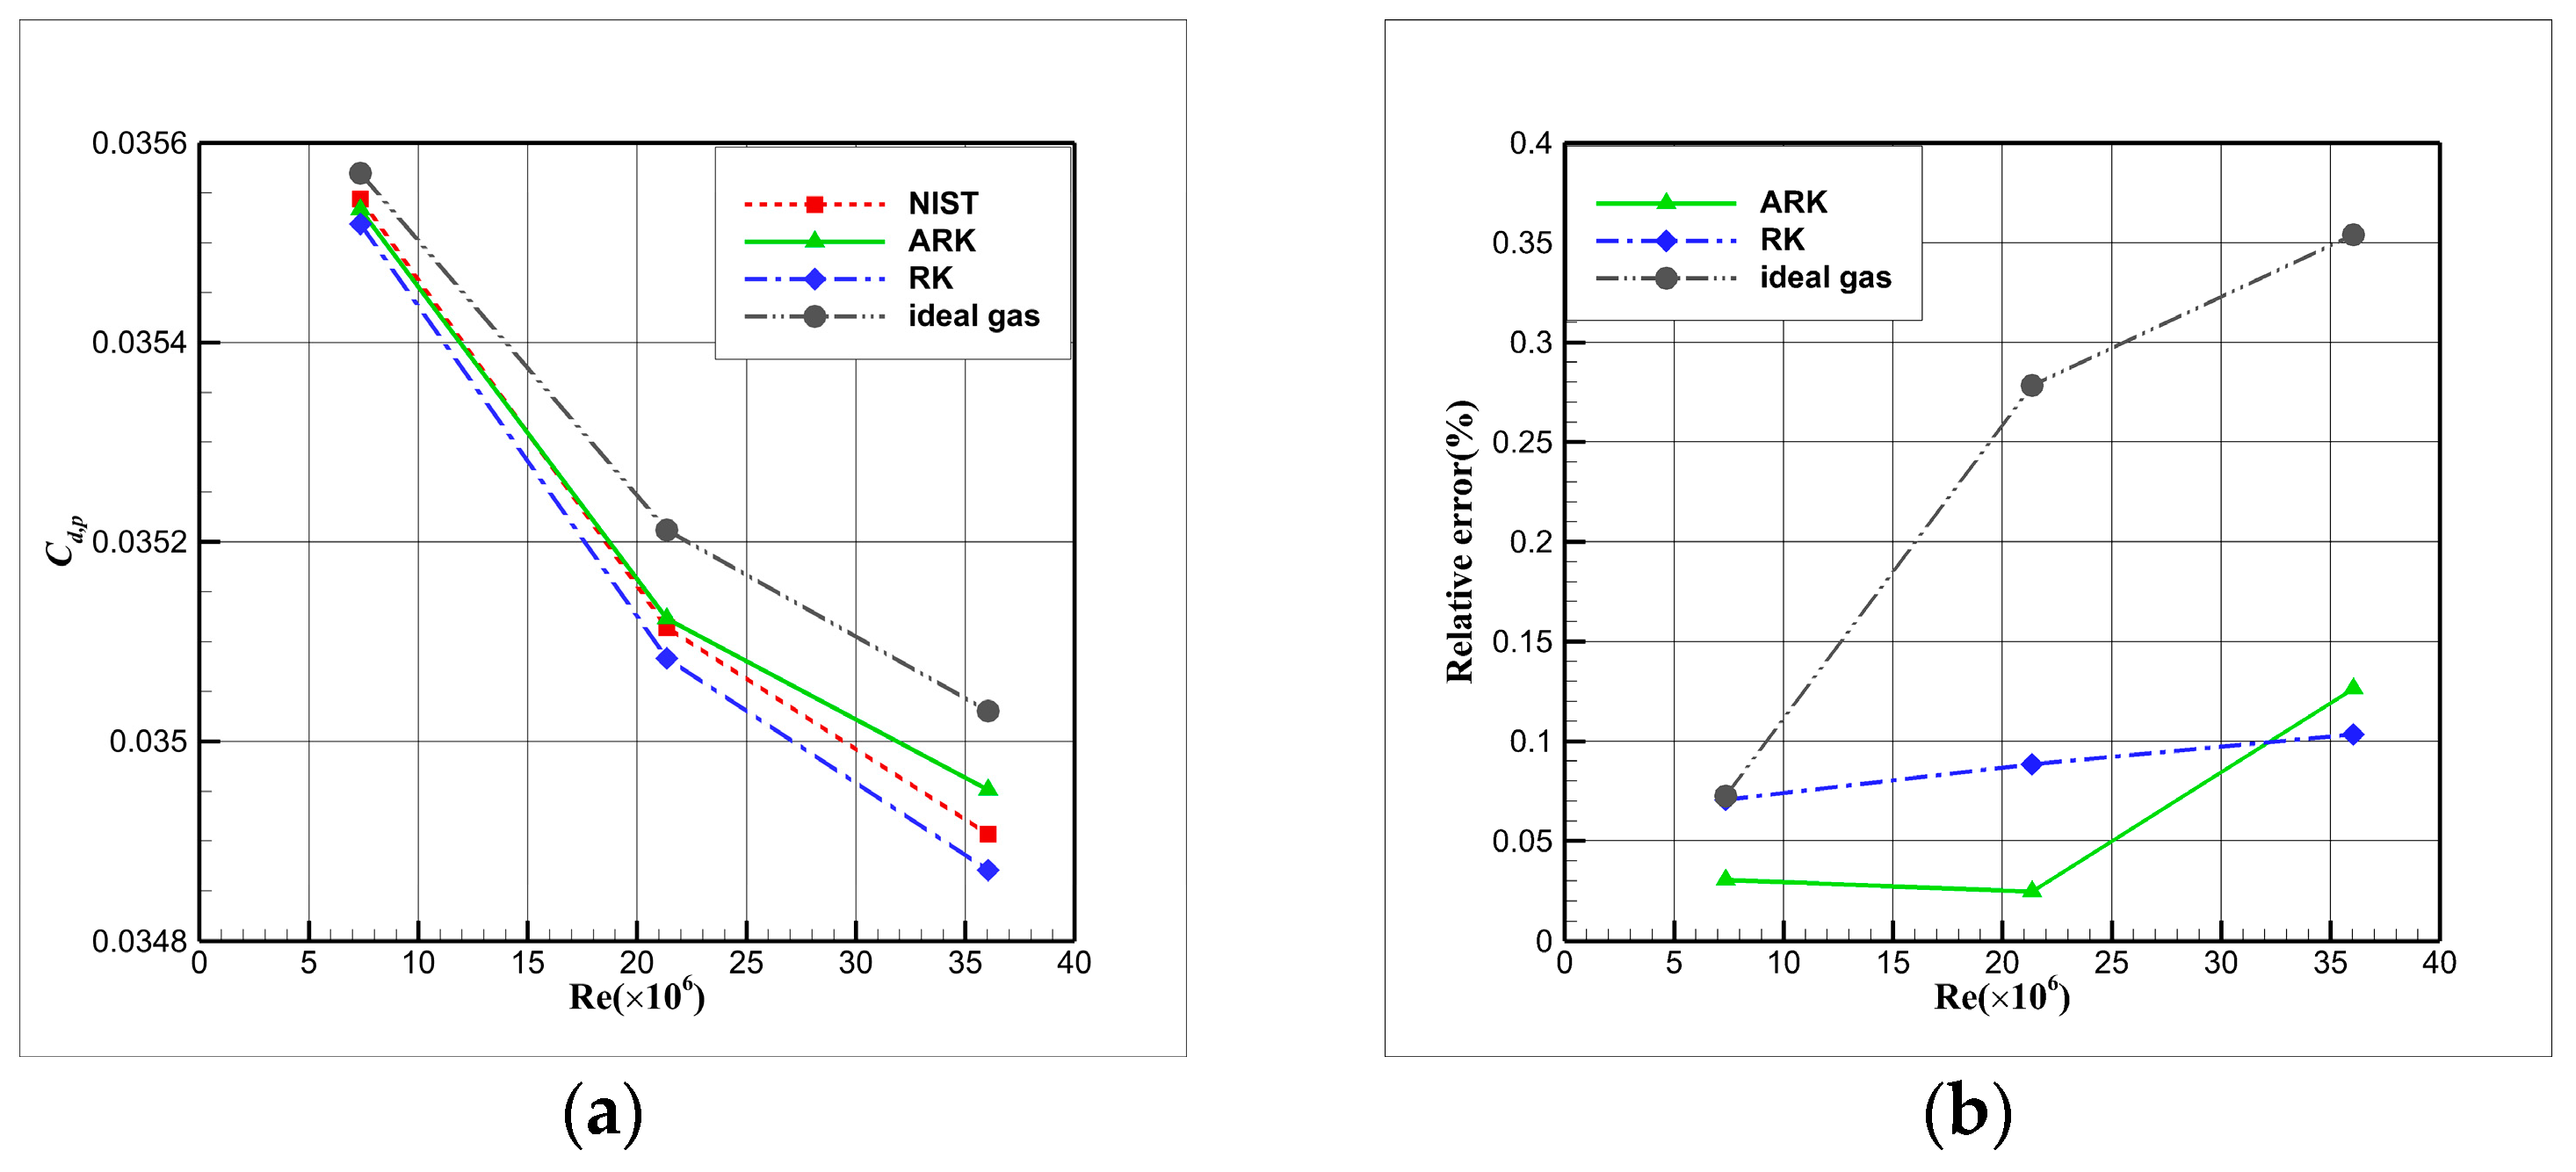
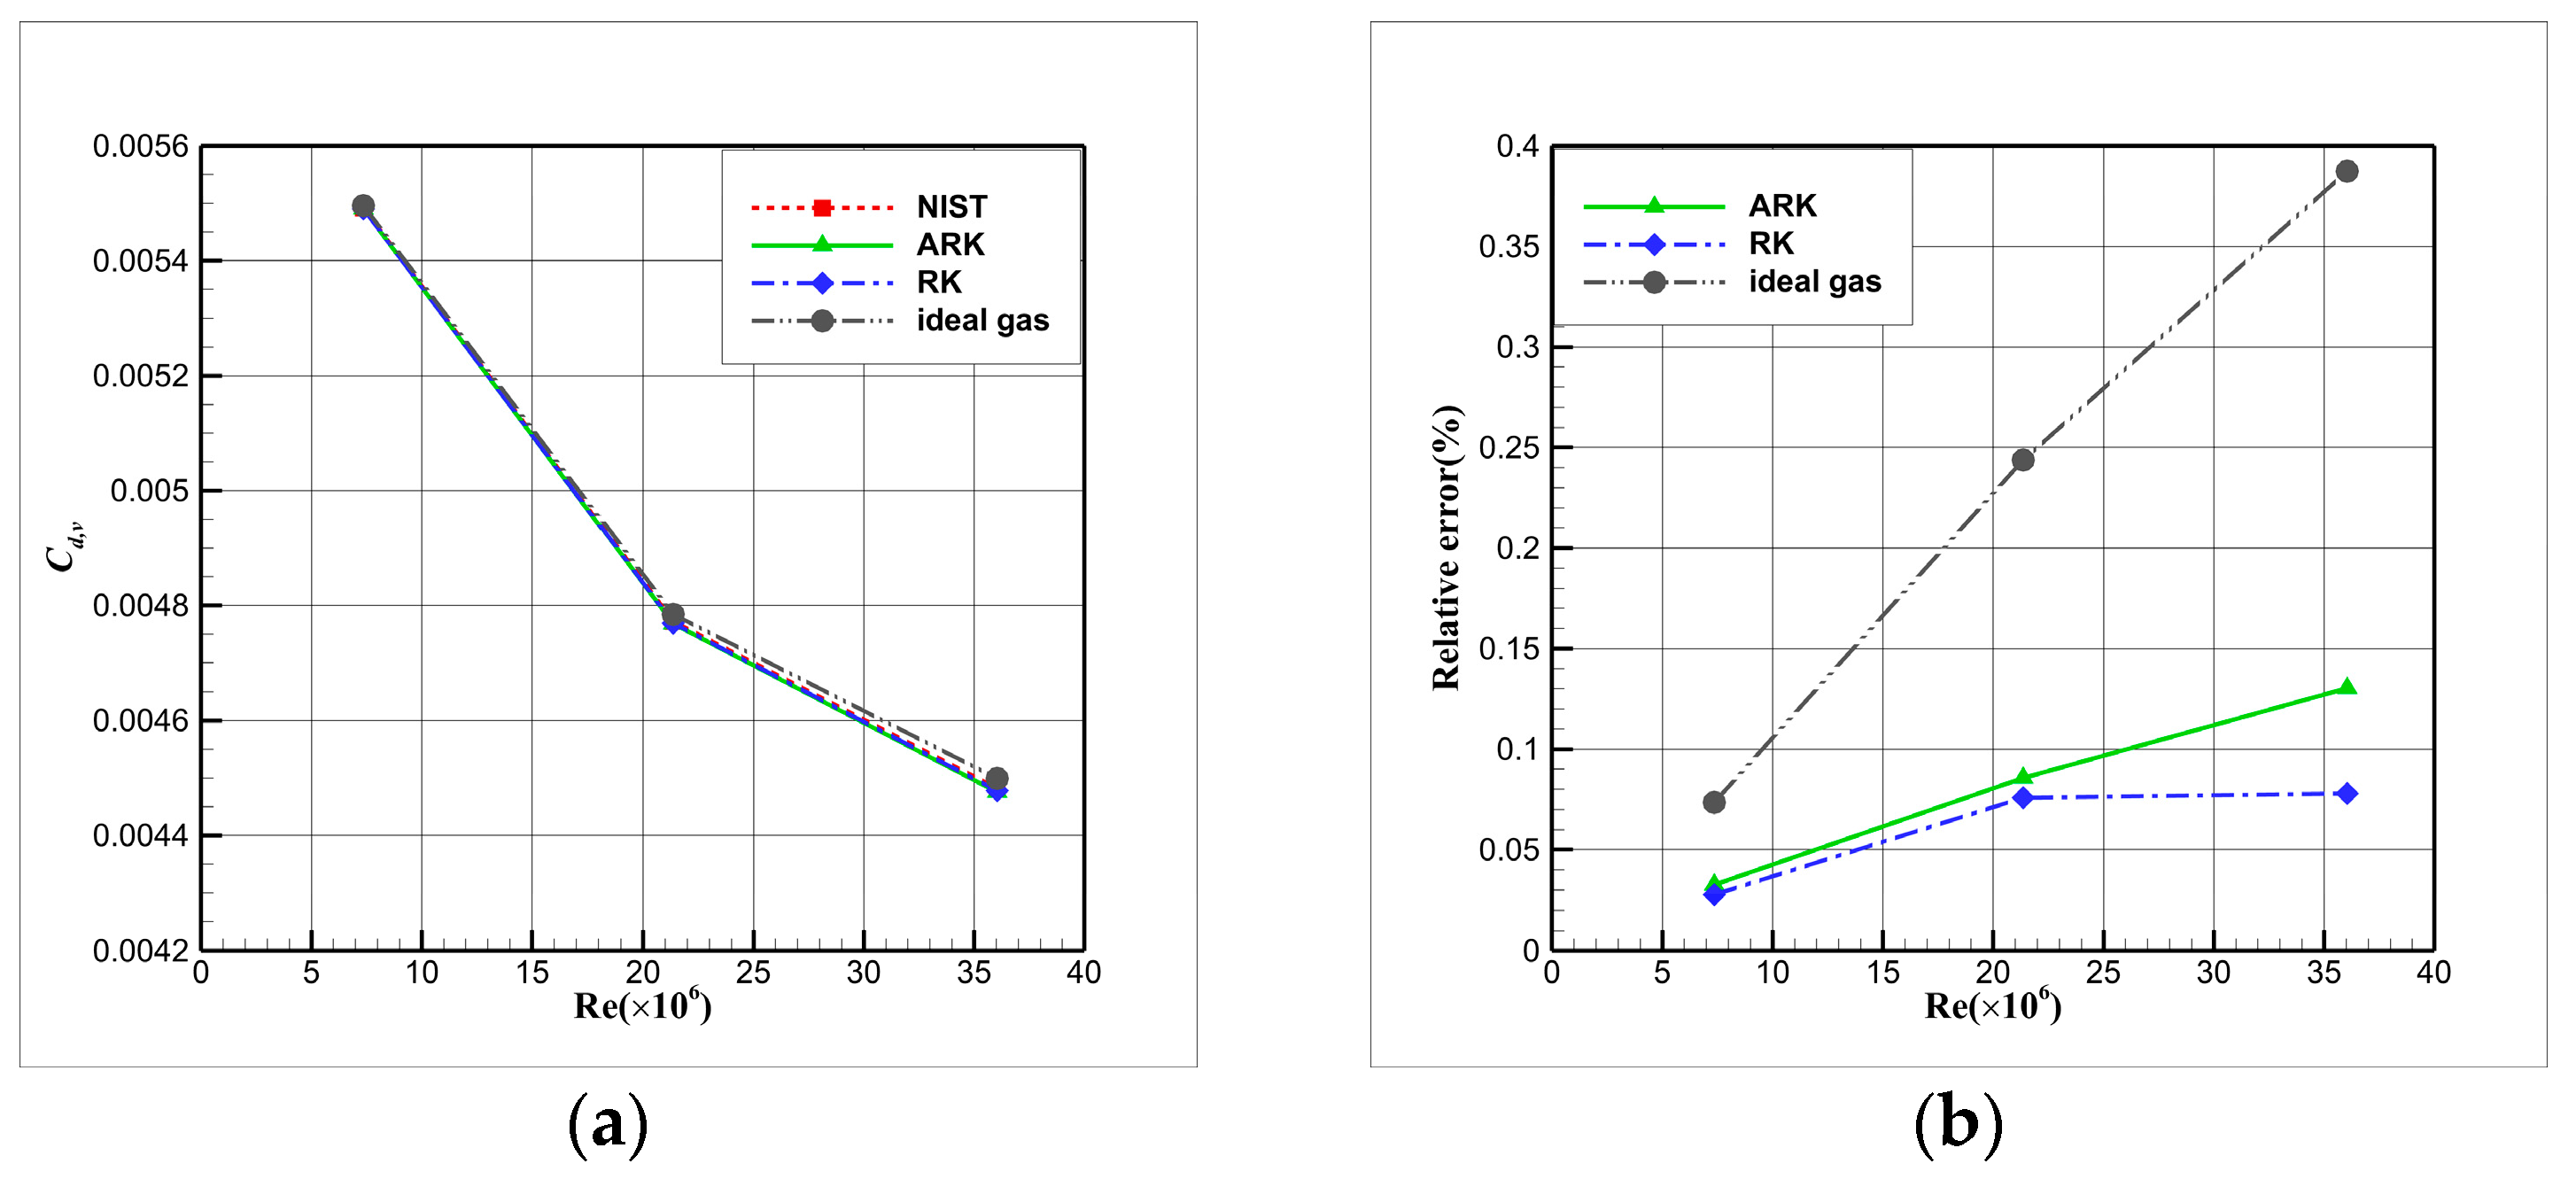
To investigate the influence of the EOS on cryogenic flow, simulations were conducted for a transonic flow over the surface of an NACA0012-64 aerofoil at a 0° angle of attack, employing various EOS models, namely, the ARK EOS, RK EOS, and ideal gas EOS (combined with γ = 1.4 , as in Method 3 in Section 4.3), and NIST thermodynamic data. It is worth noting that when the ideal gas EOS was combined with an ideal gas specific heat ratio of 1.4, the isentropic relation in Equation (3) is equivalent to the isentropic relation in Equation (5), as mentioned in Section 2.2. Therefore, the only differences between using the ideal gas EOS and the real gas EOS are the resulting thermodynamic properties, and this is the impact of the EOS on the numerical simulation that this study aims to compare. Detailed calculation conditions are outlined in Table 2. The discrepancies in results among the different EOS models are illustrated through the pressure drag coefficient and viscous drag coefficient, as depicted in Figure 19 and Figure 20.
From Figure 19 and Figure 20, it is clear that the EOS does not have a significant effect on the drag coefficient calculated via CFD. The drag coefficient calculated from the NIST data serves as a reference value due to its high accuracy. When R e = 7.35 × 10 6 , the relative errors of C d , p and C d , v are both less than 1 . As R e increases, the relative errors of the drag coefficient calculated by different EOSs gradually increase. When R e = 36.05 × 10 6 , the relative errors of C d , p and C d , v obtained from the ideal gas EOS both reach 4‰, which is still much less than 1%. However, this finding is questionable as different EOSs exhibit significant differences at higher pressures. Therefore, the skin friction coefficient of the aerofoil should be considered. Figure 21 illustrates the variation in the skin friction coefficient before ( 0.6 x / c 0.7 ) and after ( 0.8 x / c 1 ) the shock wave, obtained from different EOSs at R e = 36.05 × 10 6 . Similar to the analysis of the drag coefficient, the result calculated from NIST data is used as the reference value to calculate the relative error.
Figure 21 reveals that the EOS truly exerts a certain influence on the skin friction coefficient. Figure 21a,c depict the C f distribution before and after the shock wave, displaying a noticeable disparity between the results obtained with the ideal gas EOS and the real gas EOSs. To present their differences more intuitively, Figure 21b,d provide the relative errors for comparison. It can be observed that the relative error in C f calculated using the ideal gas EOS is relatively larger than that calculated using other real gas EOSs but still remains well below 1%. However, after the shock wave, the relative error surpasses 1% and gradually increases to 3%. Based on these findings, it can be concluded that the EOS does indeed have a certain impact on CFD calculations.

4.5. Influence Analysis of Viscosity Models on Numerical Simulation

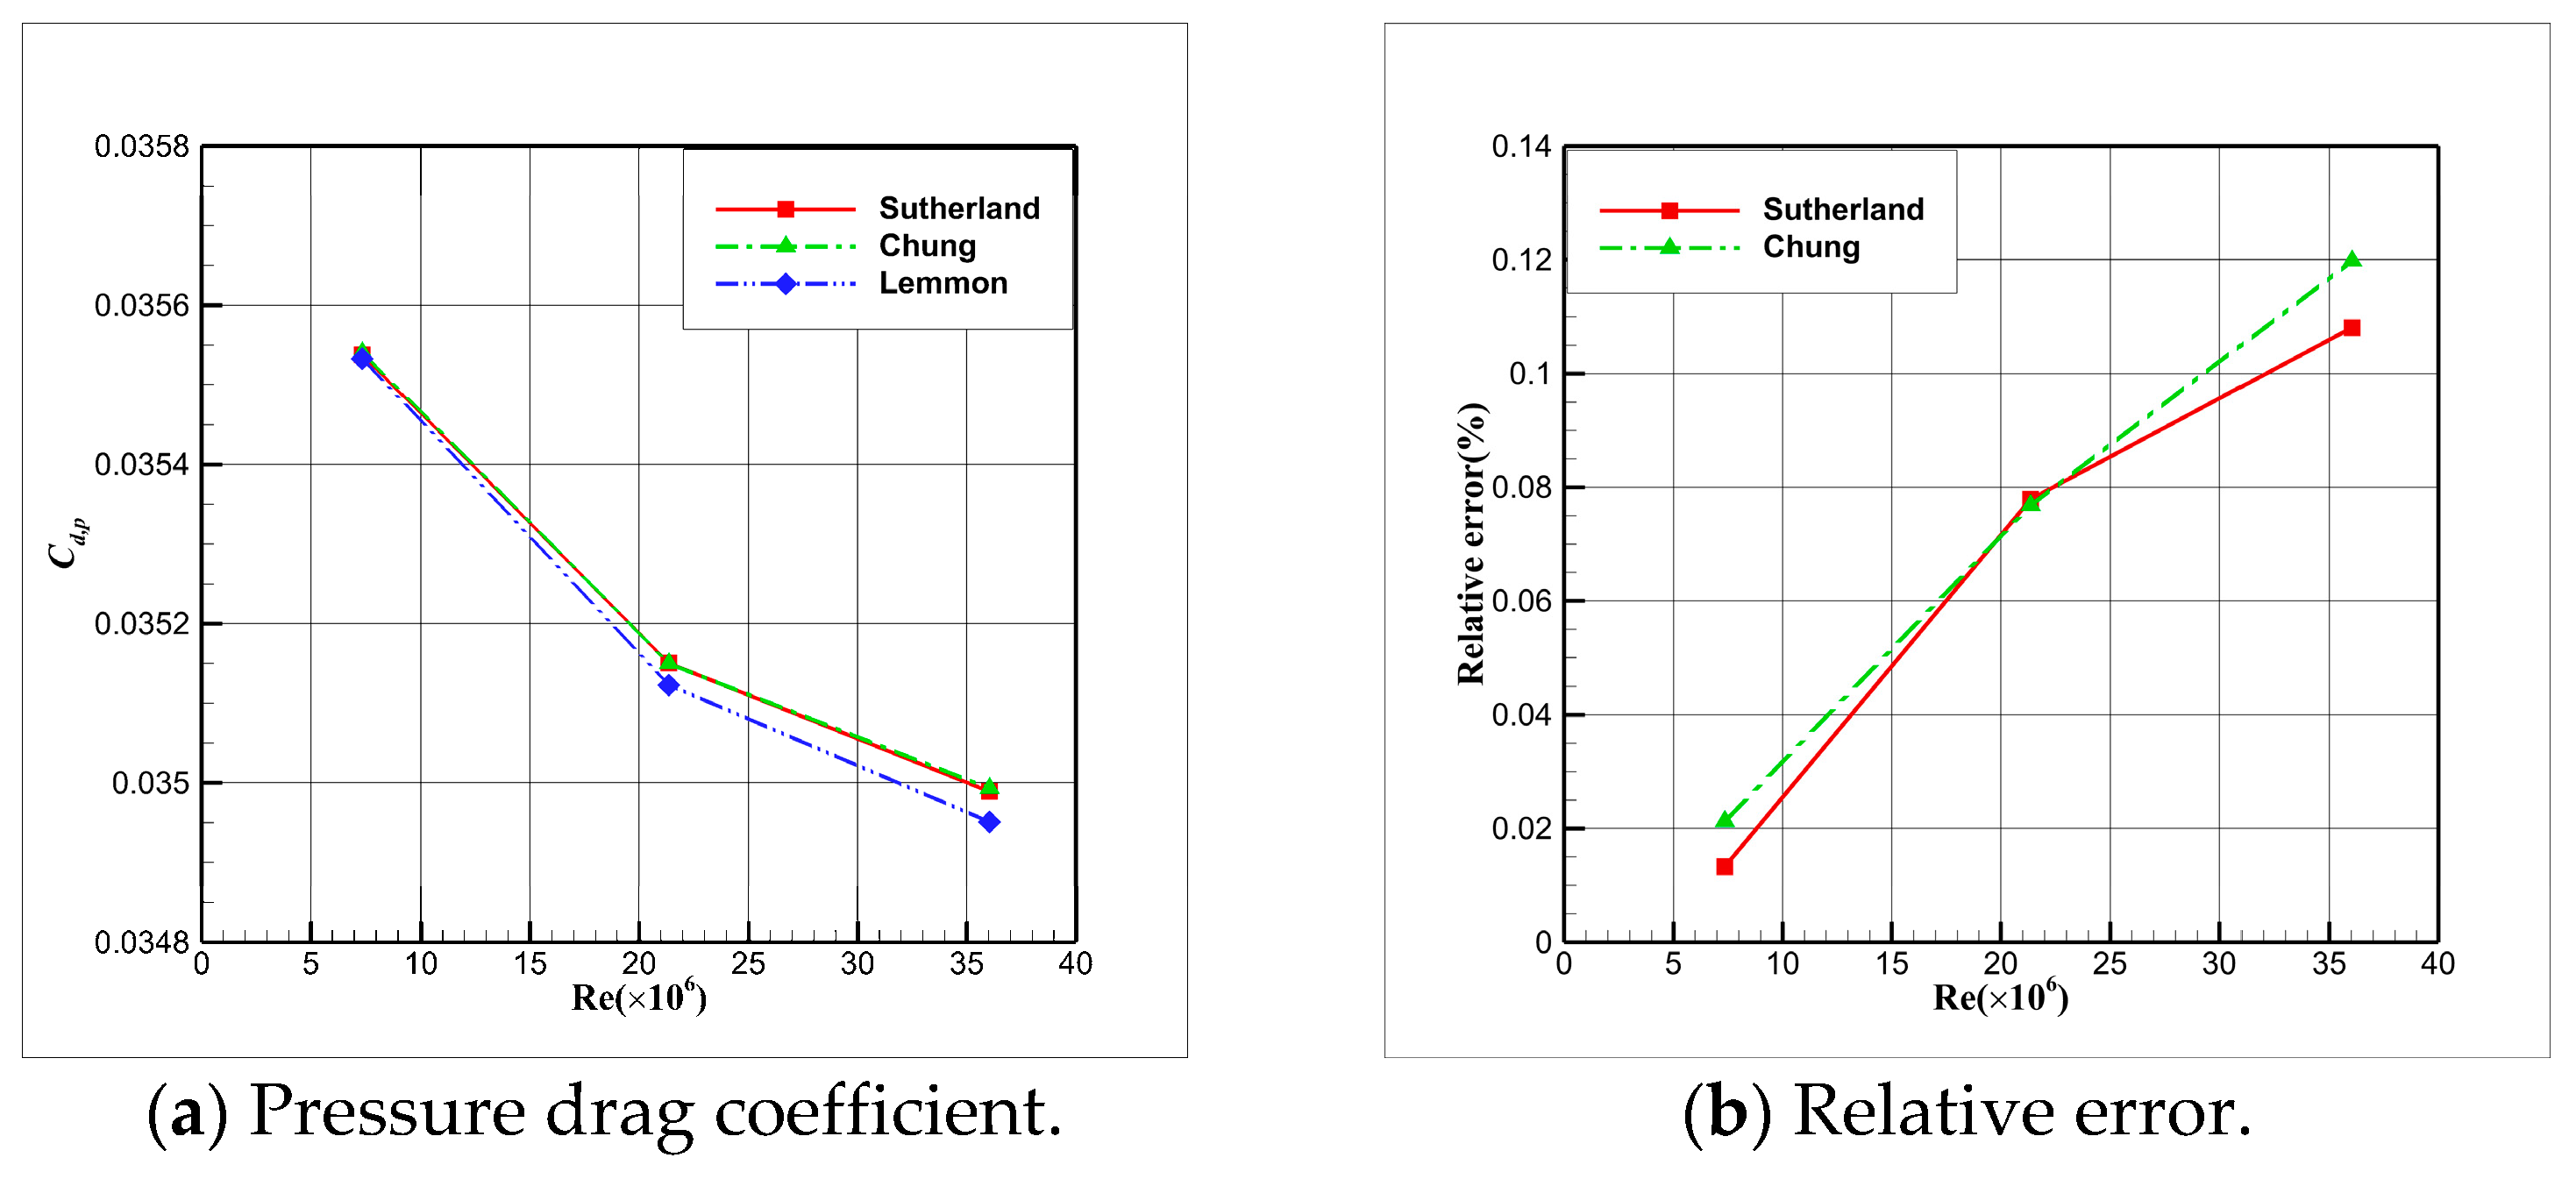
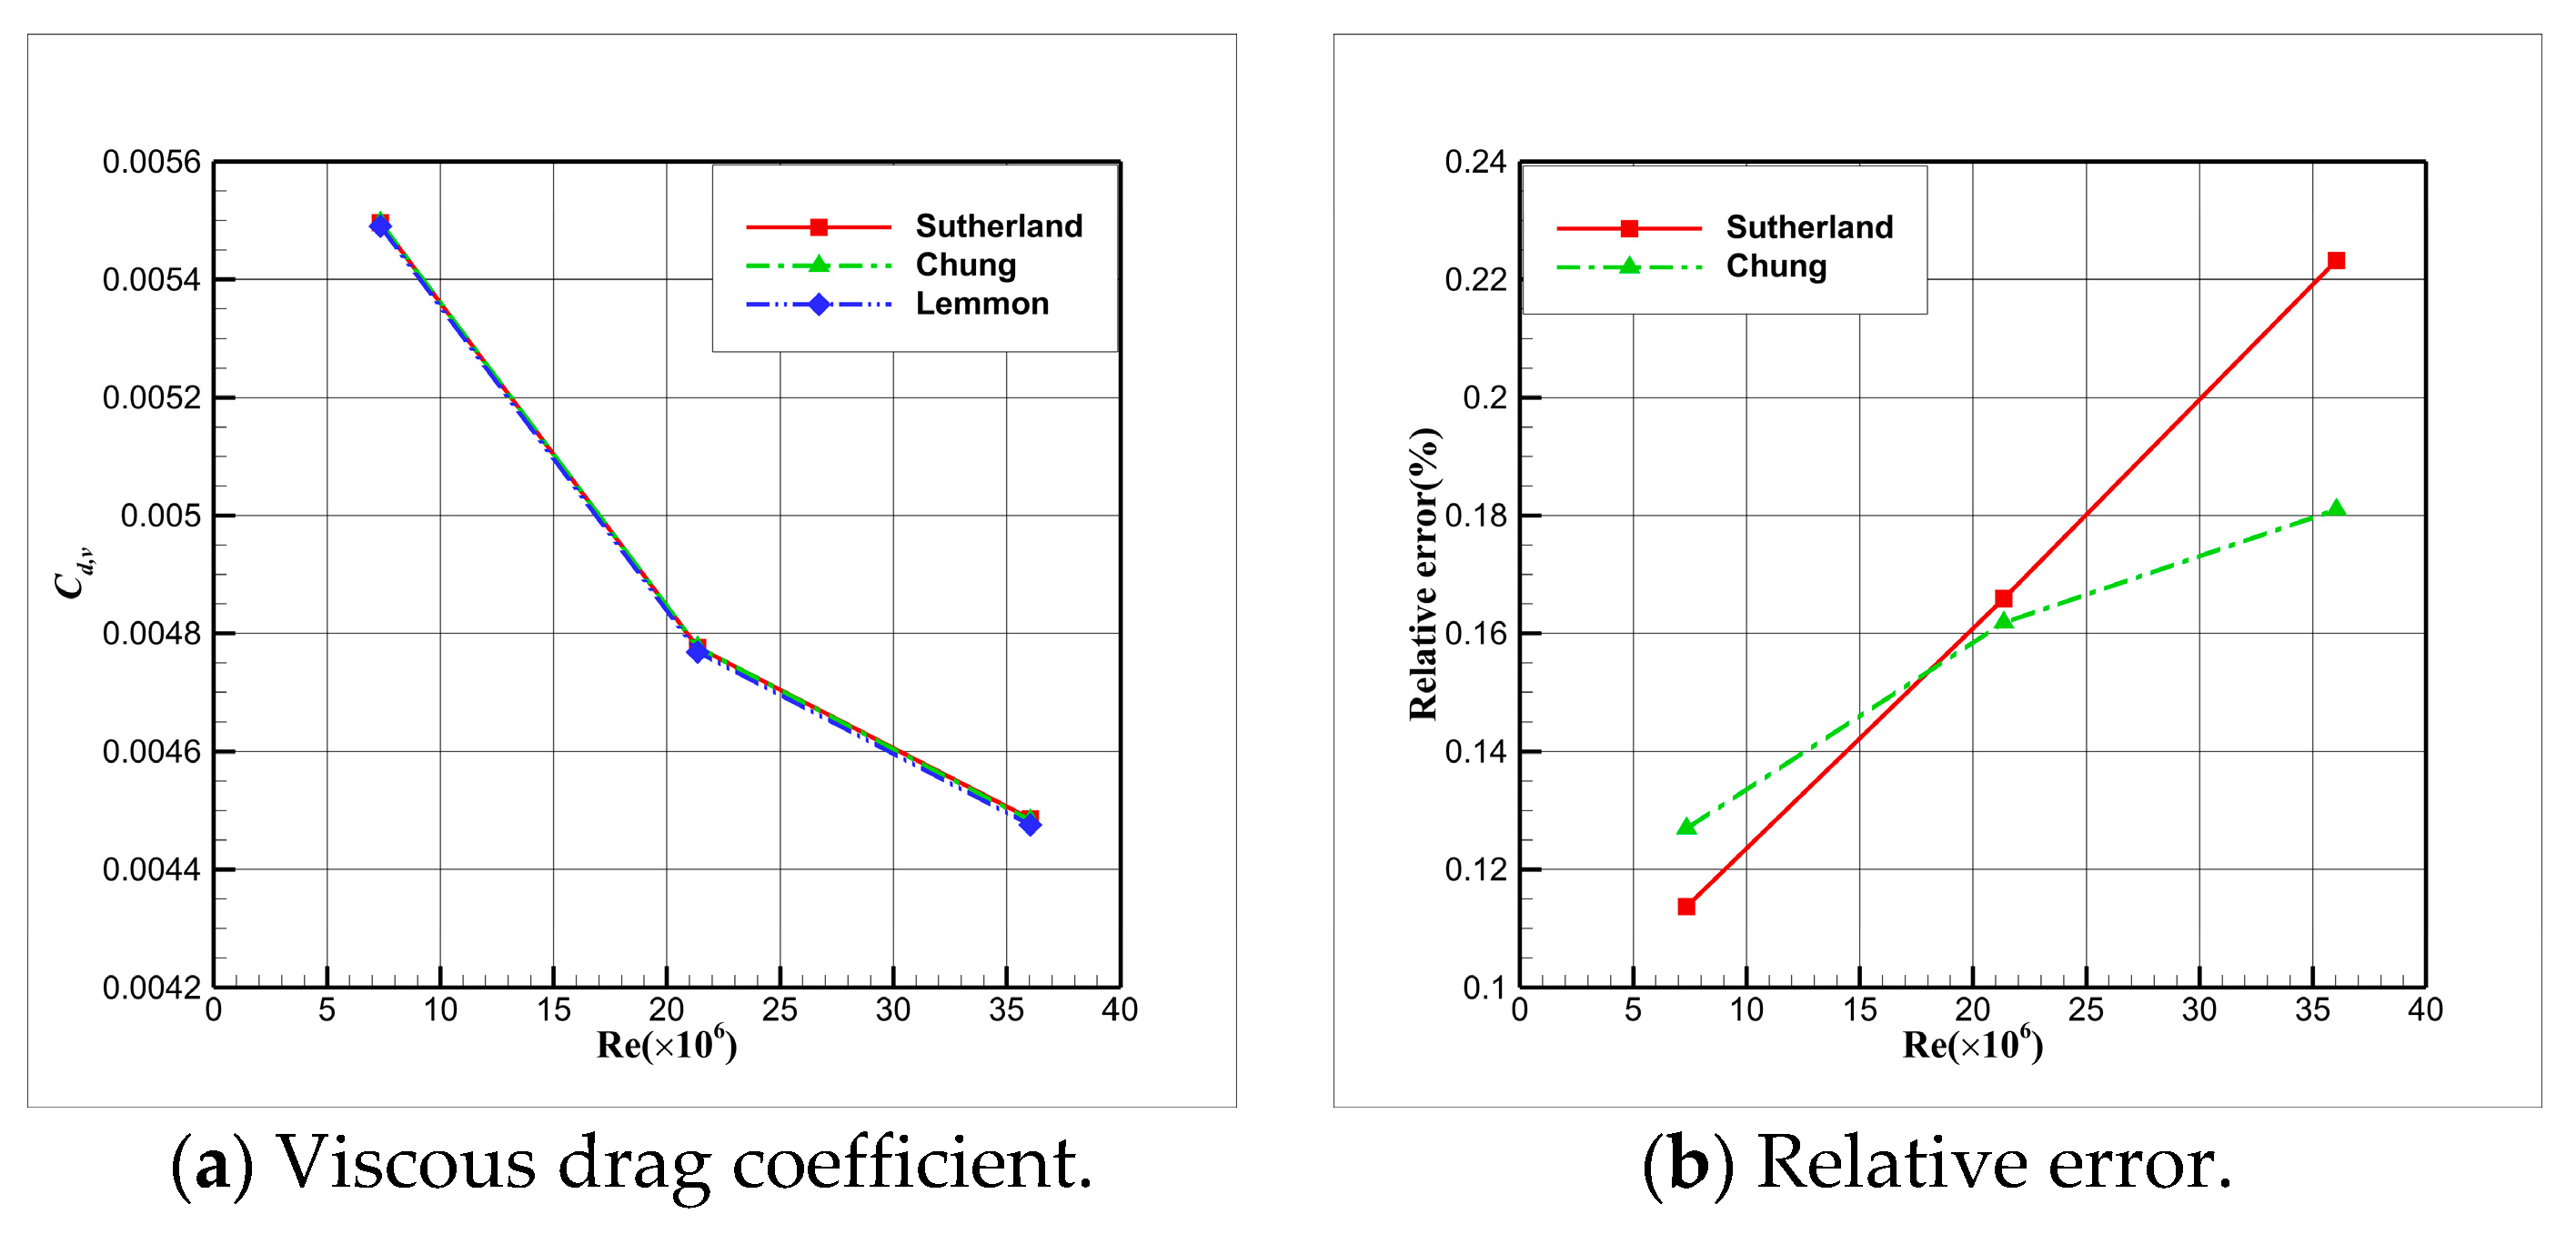
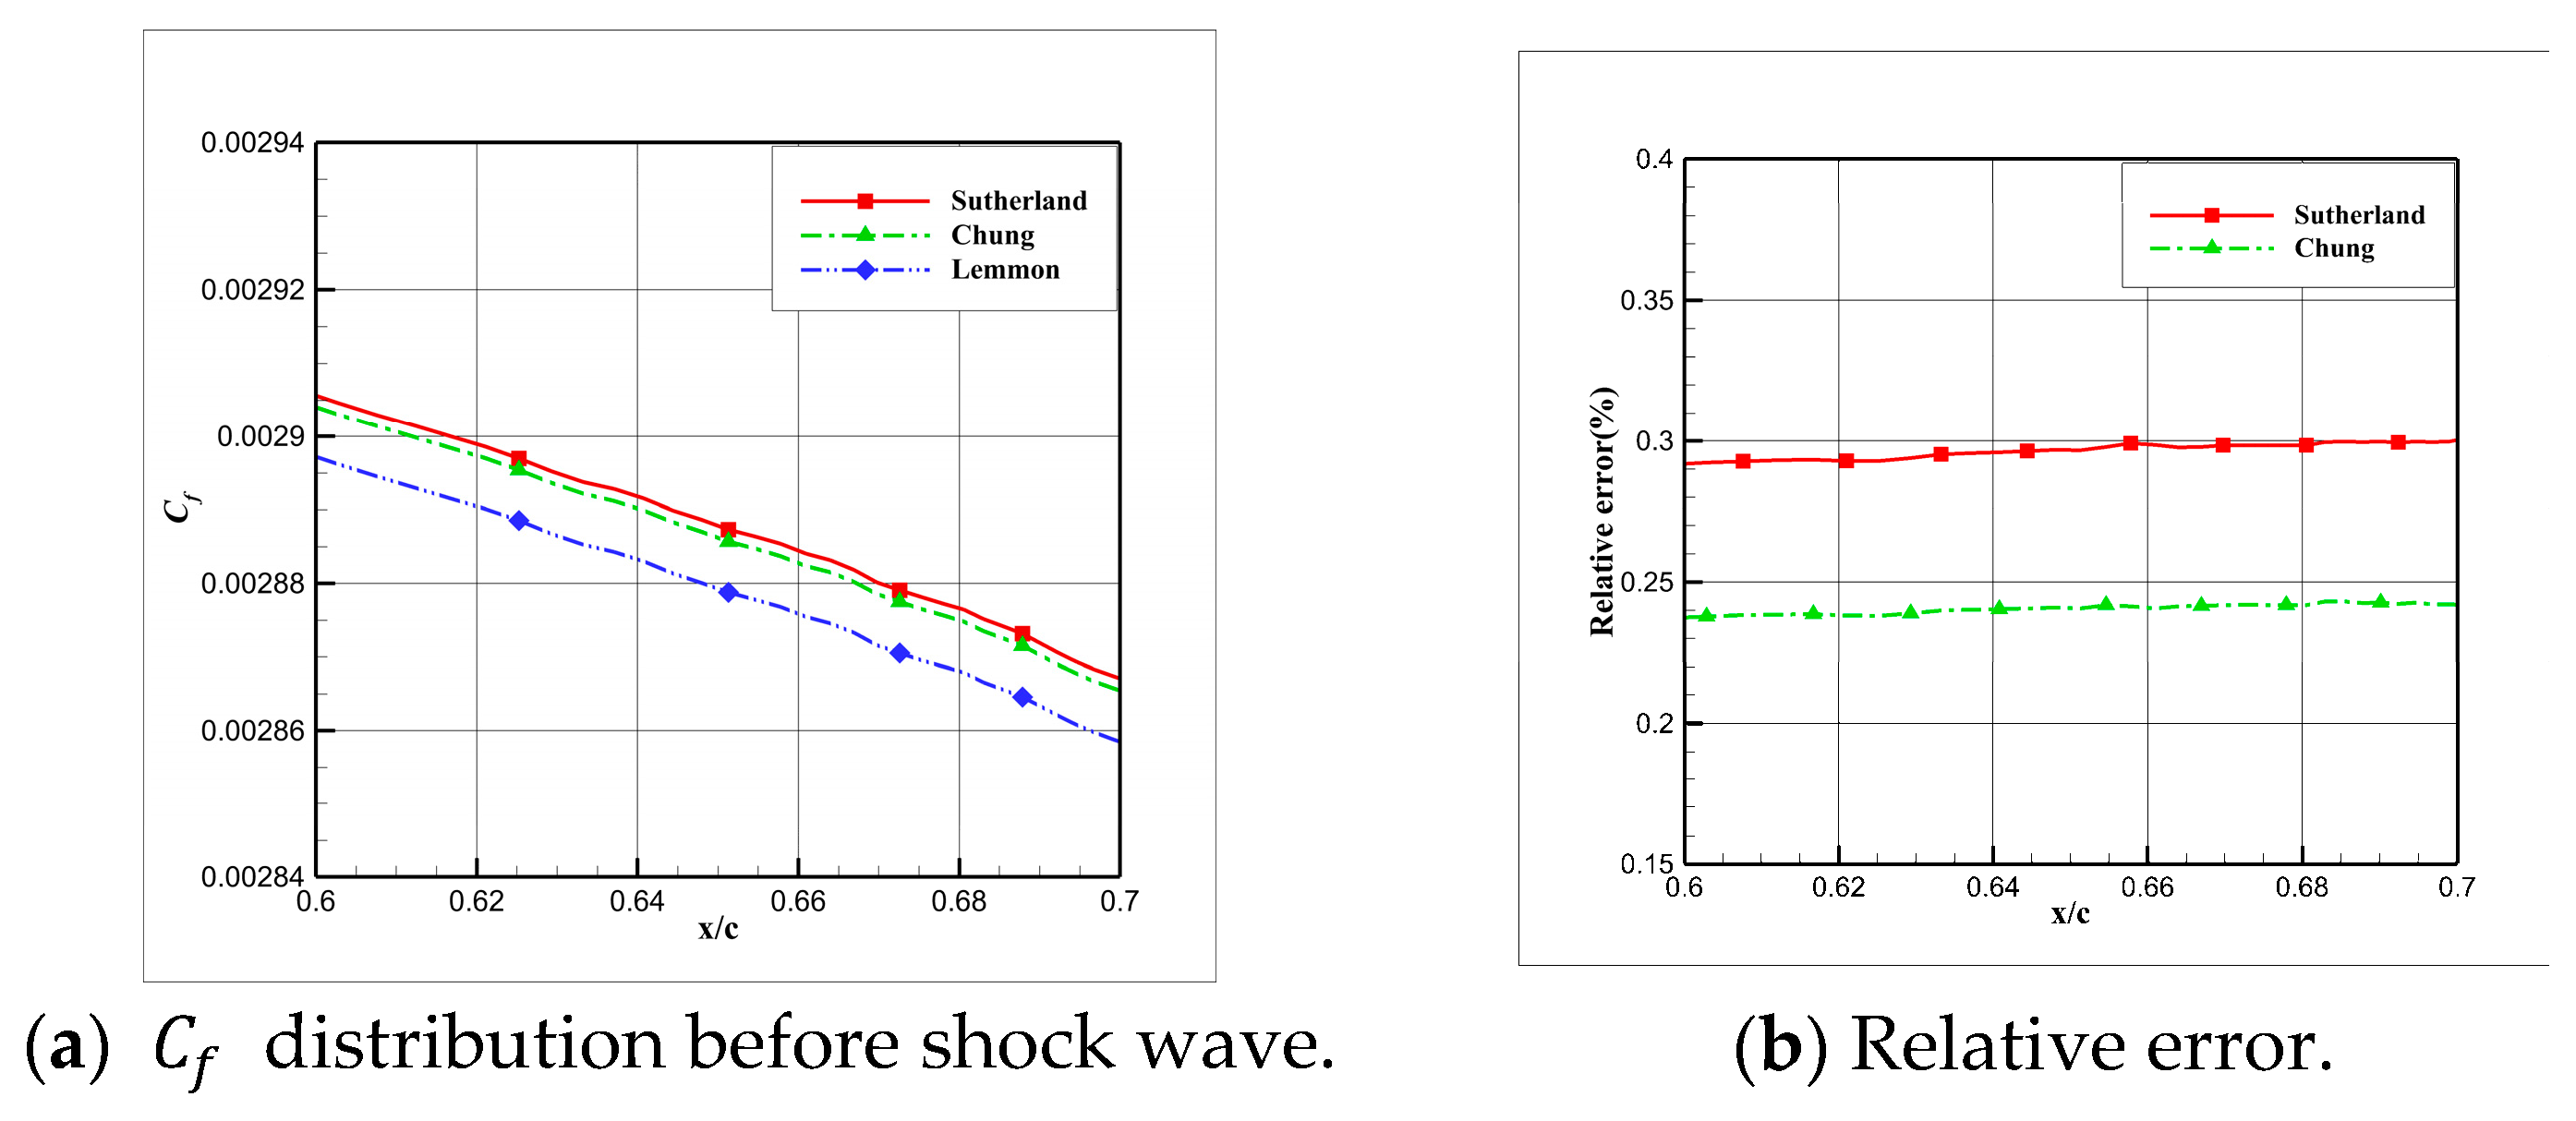
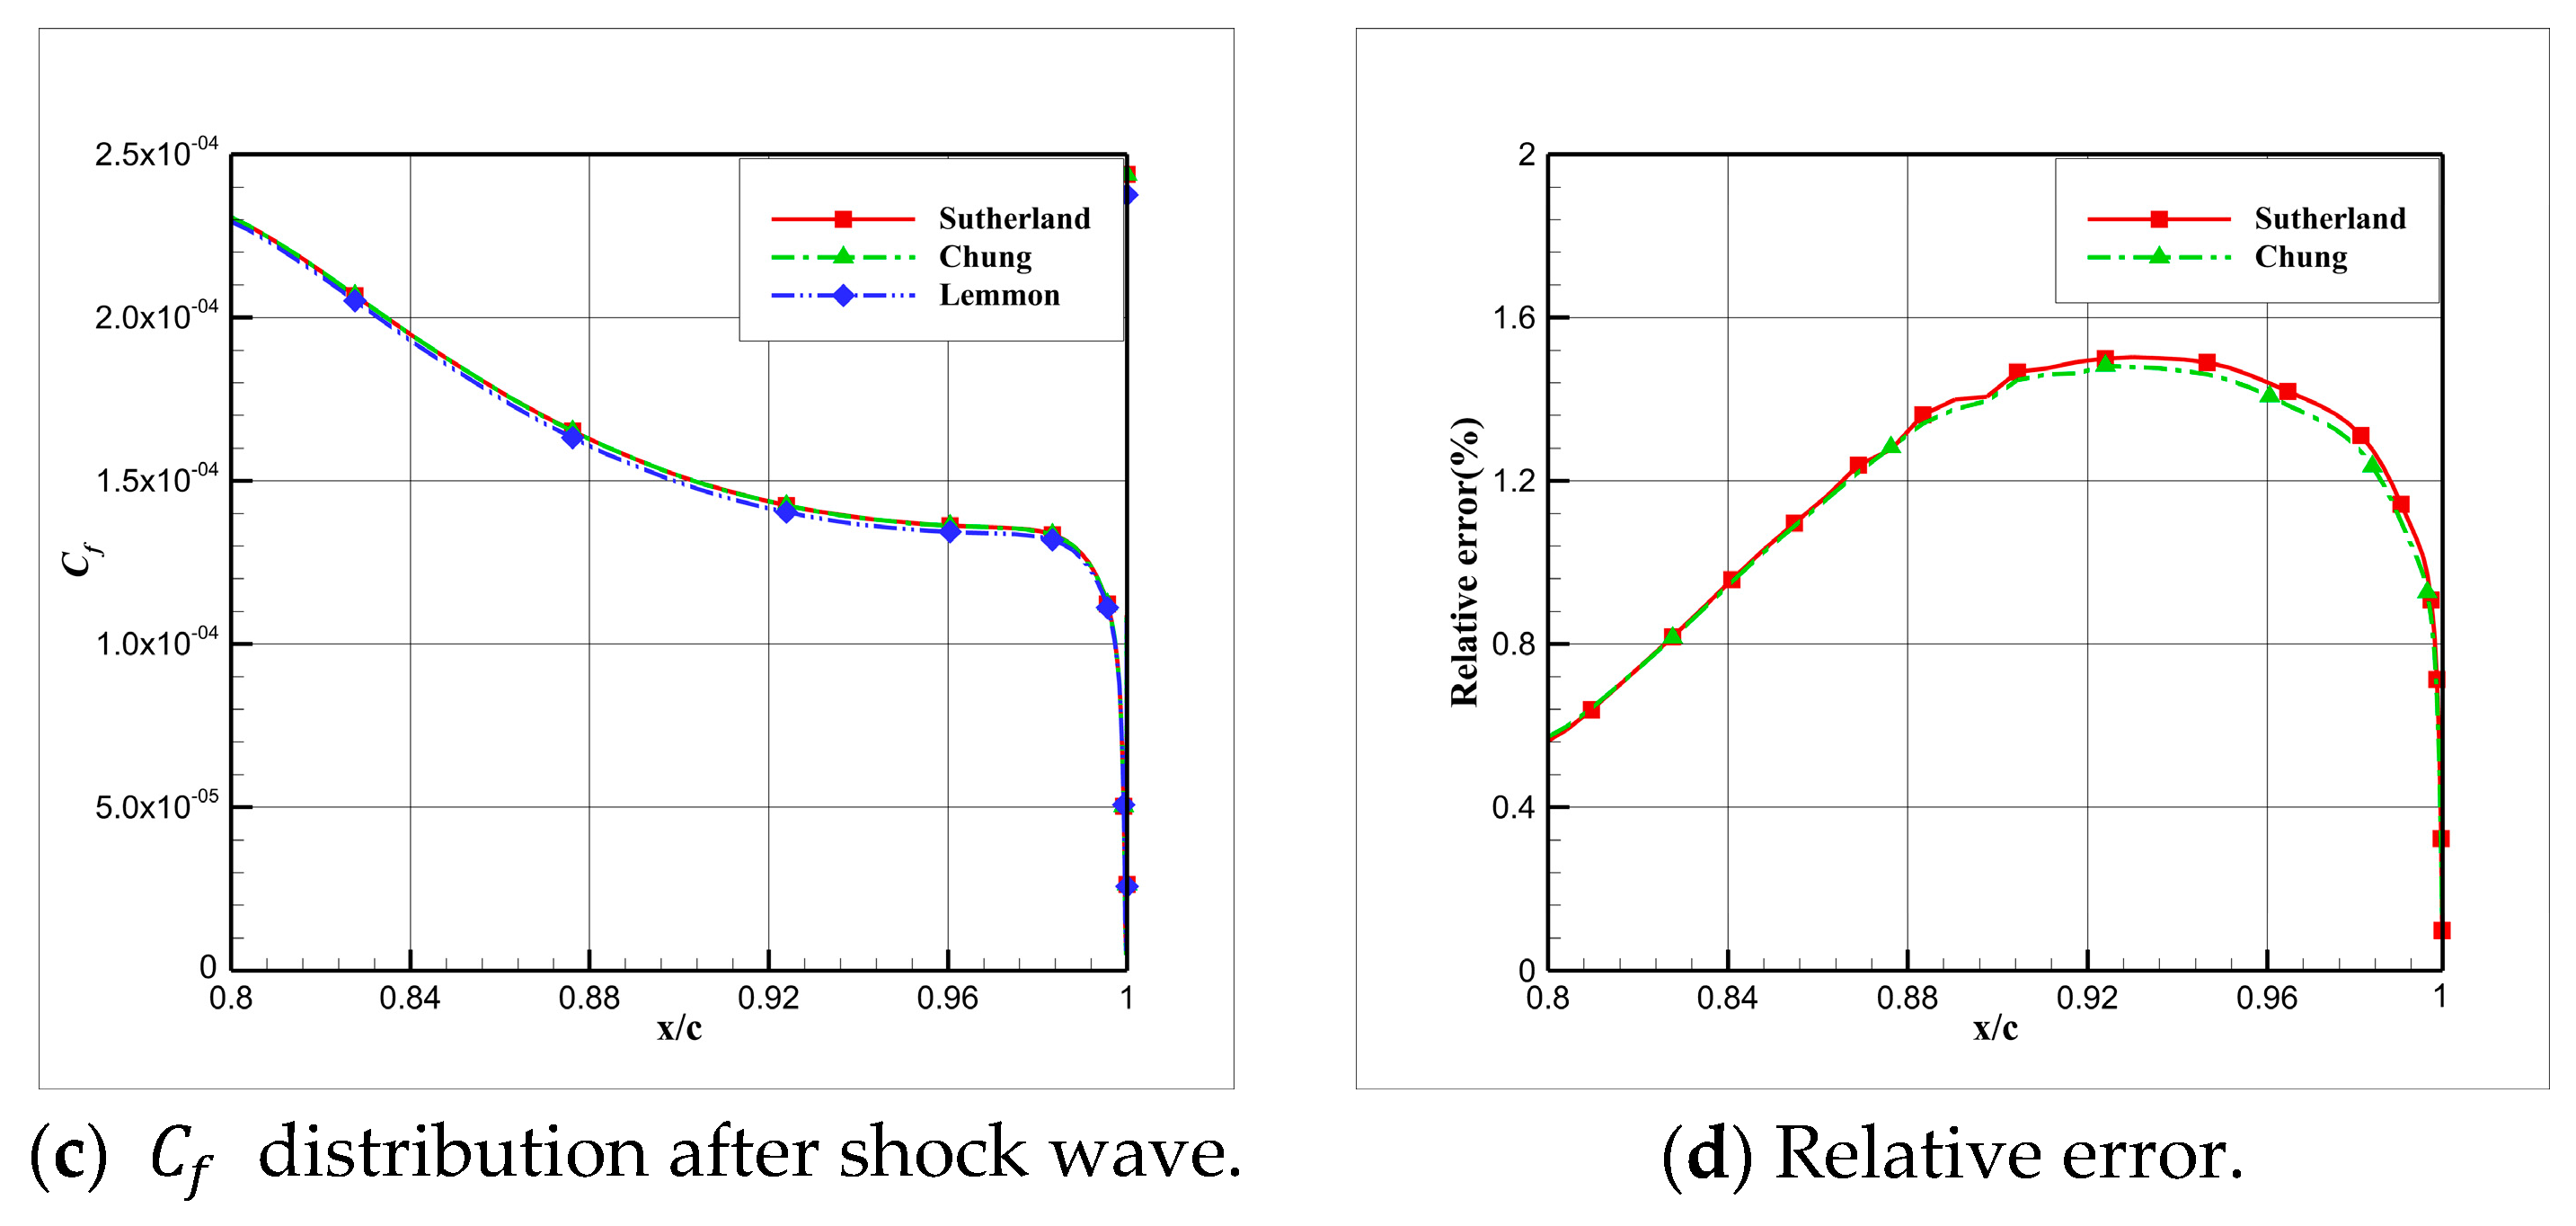
Given the significant disparities observed in viscosity models at cryogenic temperatures, as demonstrated in Section 2.3, it becomes crucial to investigate whether these viscosity models influence the results. In order to assess the potential impact of viscosity models, a comparative analysis was conducted on the aerodynamic characteristics of NACA0012-64 aerofoils with a 0° angle of attack, employing different viscosity models, namely, the Sutherland law, Chung viscosity model, and Lemmon viscosity model. Detailed calculation conditions are outlined in Table 2. To quantify the distinctions in results arising from different viscosity models, the pressure drag coefficient and viscous drag coefficient from CFD simulations are presented in Figure 22 and Figure 23.
Figure 22 and Figure 23 illustrate that the viscosity model exerts a relatively minor impact on the drag coefficient, which aligns with the outcomes observed with different EOSs. As R e increases, both C d , p and C d , v , calculated using different viscosity models, gradually decrease. By employing the results obtained from the Lemmon model as a reference value, the relative error and uncertainty associated with C d , p and C d , v from different viscosity models increase with the rise in R e . Nevertheless, even at R e = 36.05 × 10 6 , the relative error of C d , p calculated using the Chung viscosity model remains below 1%. Similar to the analysis in Section 4.2, for a comprehensive understanding, the skin friction coefficient and its relative error before and after the shock wave, using a relative position as a parameter, are presented in Figure 24, with the results from the Lemmon model serving as the reference value.
As depicted in Figure 24, noticeable discrepancies exist in the skin friction coefficient calculated through various viscosity models. Figure 24a,b illustrate the C f distribution before the shock wave and its relative errors, while Figure 24c,d present the results after the shock wave. When contrasted with the effect of different EOSs, as shown in Figure 21, it becomes apparent that the deviations attributed to the viscosity model are relatively smaller than those arising from the choice of the EOS. The maximum relative error stands at 0.3% before the shock wave and 1.56% after the shock wave. In conclusion, viscosity models indeed influence CFD results, and their impact is further amplified in scenarios involving shock wave/boundary interactions. Nevertheless, the deviations resulting from the utilization of different viscosity models are comparatively smaller than those stemming from the application of the ideal gas EOS.

4.6. Influence Analysis of Thermal Conductivity Models on Numerical Simulation

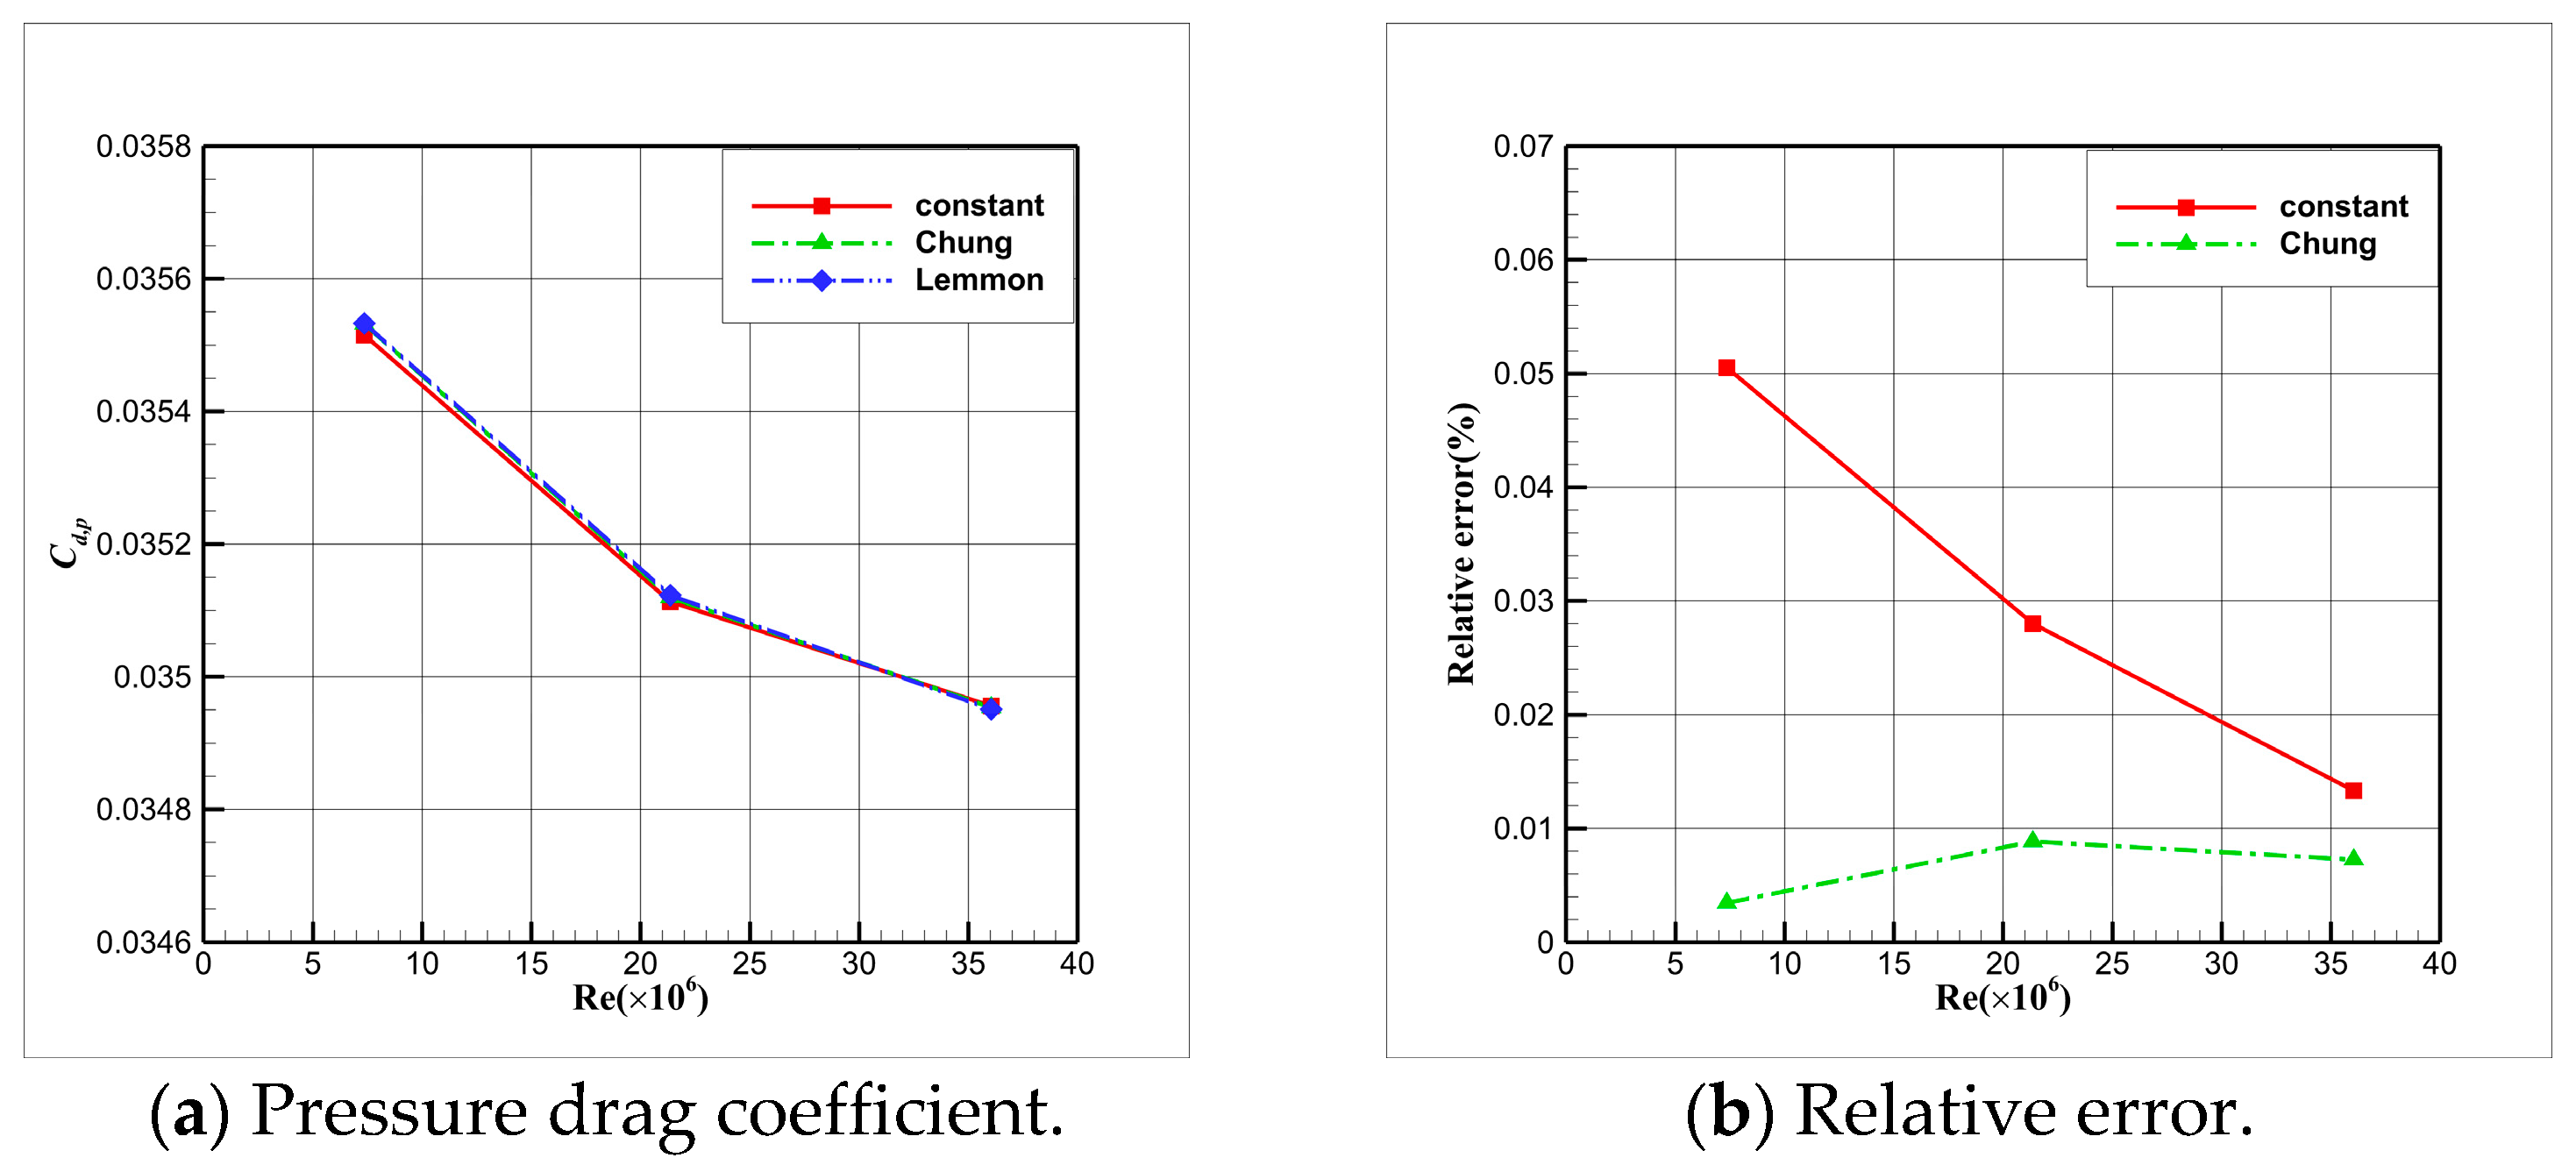
To assess the potential influence of thermal conductivity models on CFD simulations, a comparative analysis was conducted on the aerodynamic characteristics of NACA0012-64 aerofoils at a 0° angle of attack. Various thermal conductivity models were employed for this investigation. Detailed computational conditions are provided in Table 2, while the aerofoil’s drag coefficient is presented in Figure 25 and Figure 26.
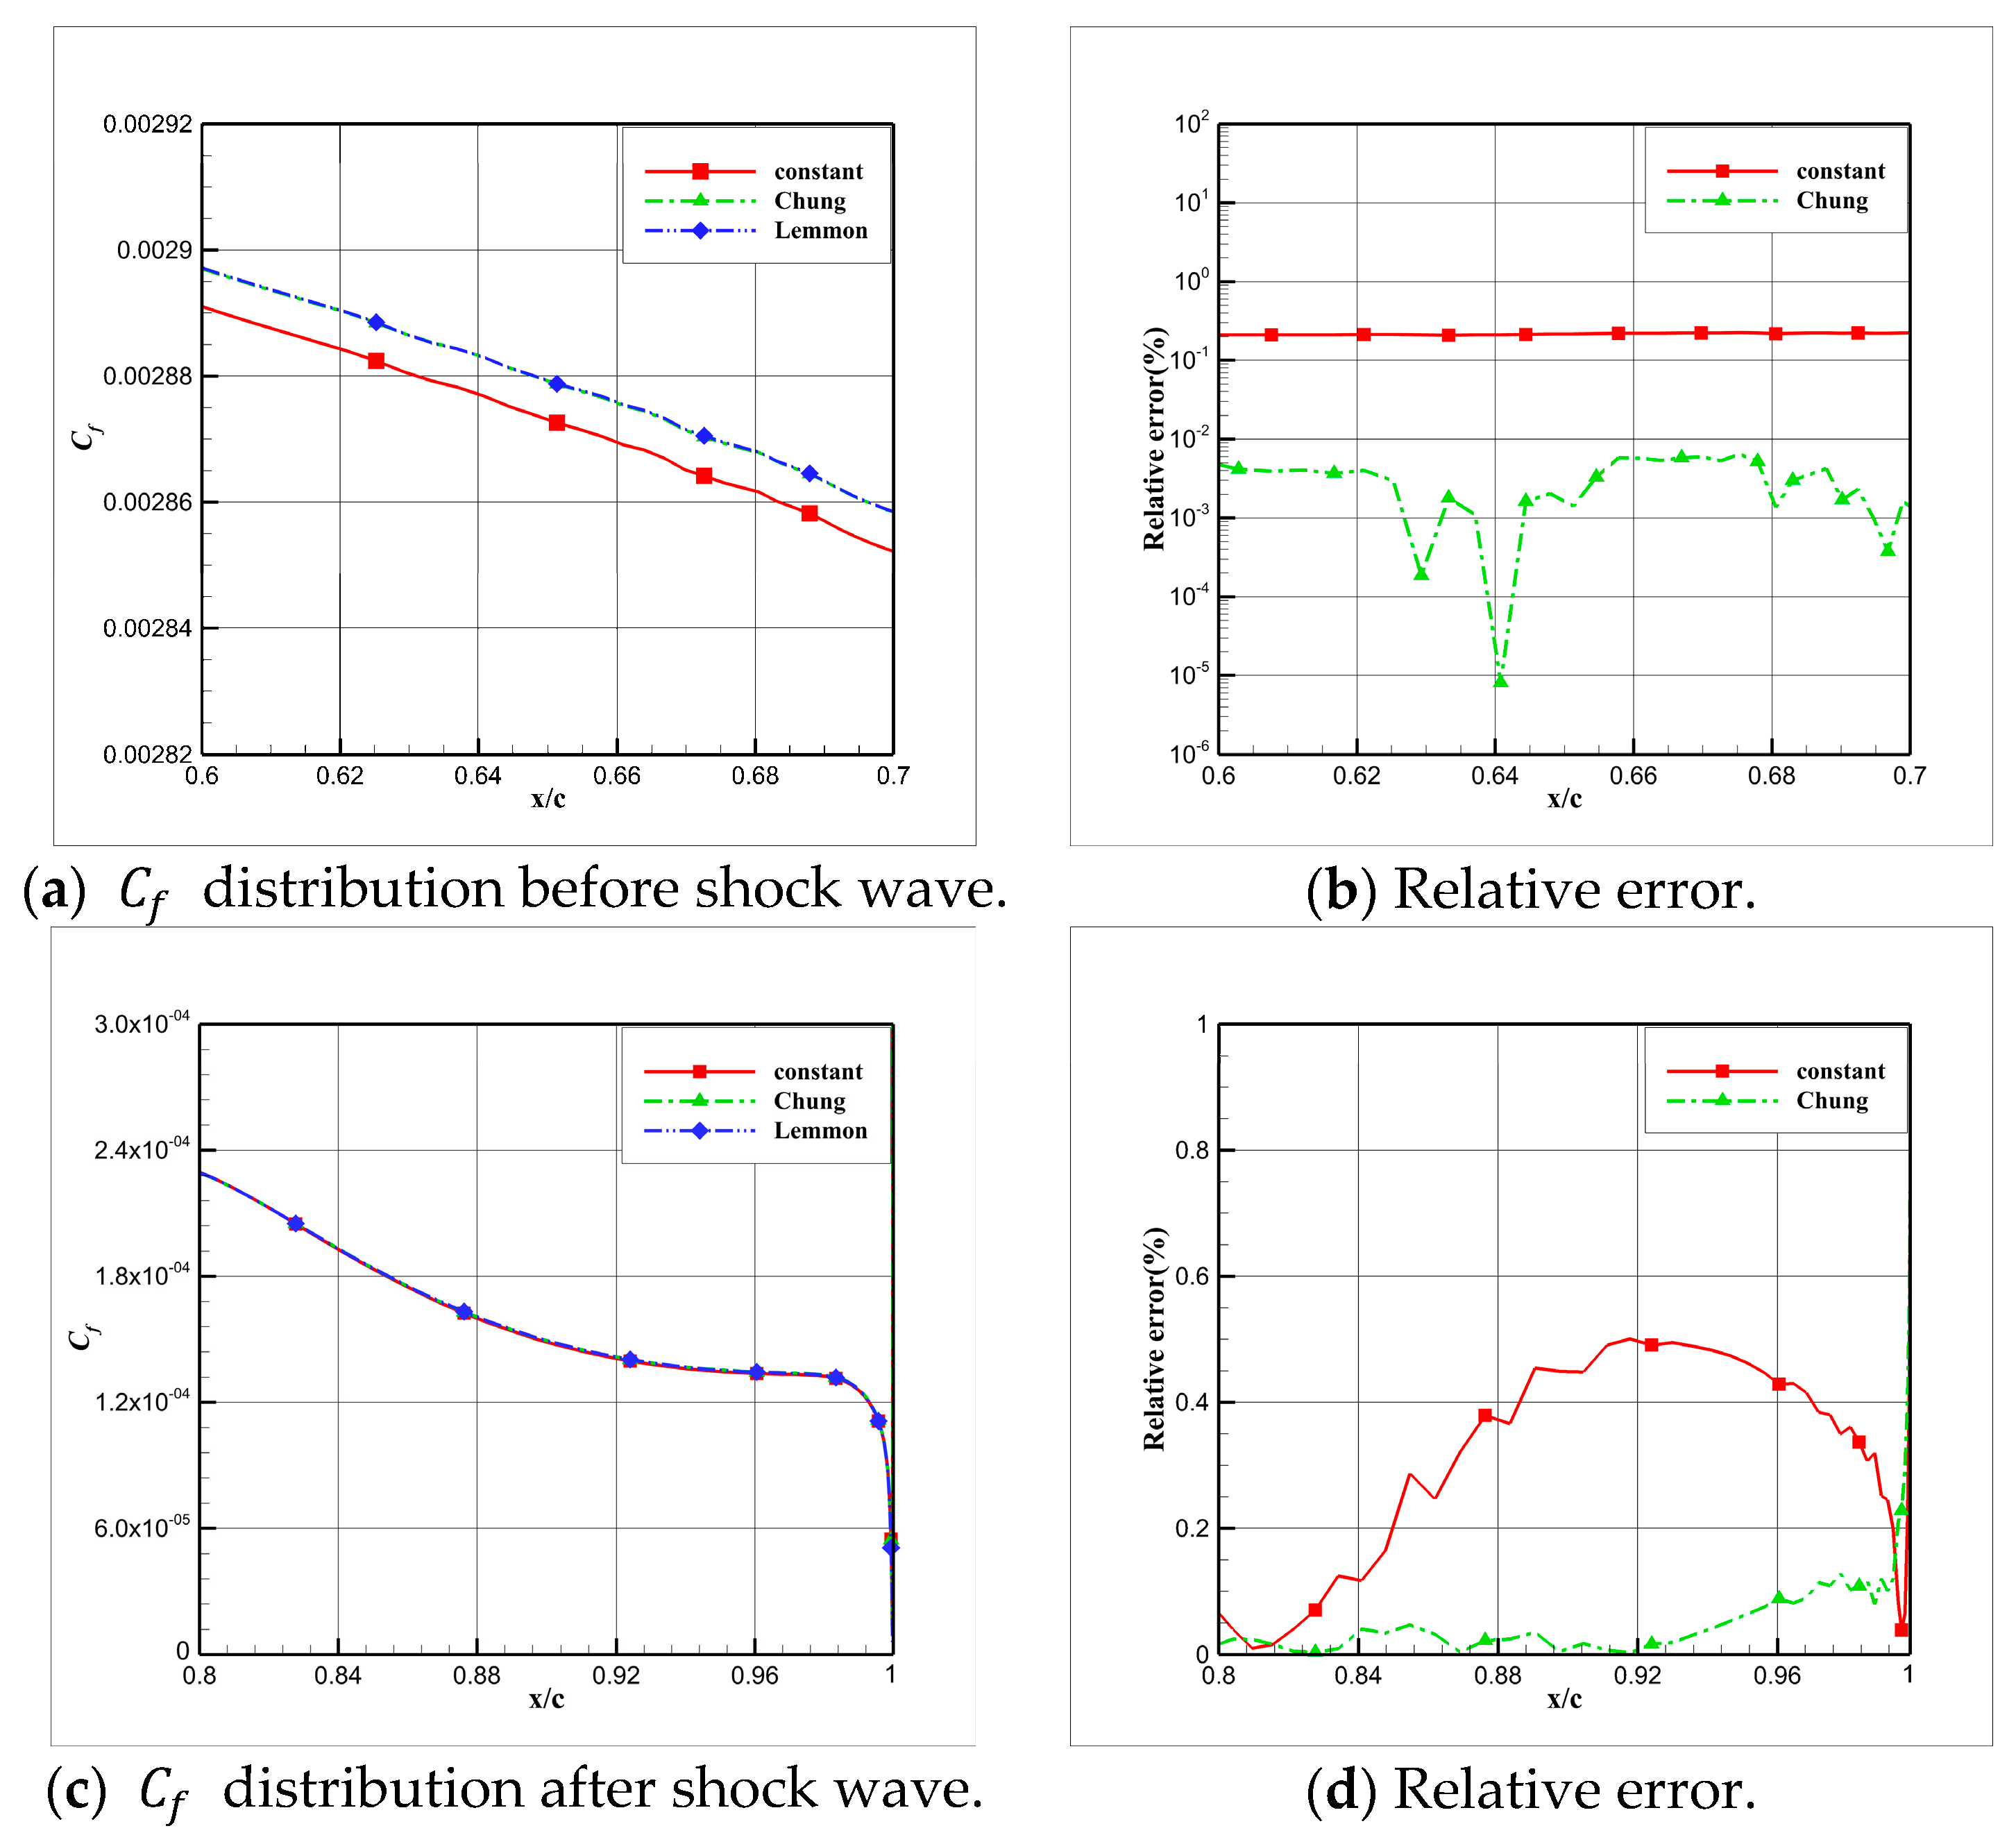
An analysis of Figure 25 and Figure 26 reveals that the selection of different thermal conductivity models exerts a relatively minor impact on C d , p and C d , v . Using the outcomes derived from the Lemmon model as a reference benchmark, at R e = 7.35 × 10 6 and with constant thermal conductivity, the relative error for C d , v approximates 2‰, while the relative error for the results obtained from the Chung model remains below 1‰. As R e increases, the relative errors of C d , p and C d , v obtained with constant thermal conductivity progressively diminish. For more comprehensive insights, the skin friction coefficient and its relative variations before and after a shock wave, using a relative position, are presented in Figure 27. In this context, the results obtained from the Lemmon model are considered the reference standard.
As depicted in Figure 27, it becomes apparent that there is a certain deviation in the skin friction coefficient calculated using different thermal conductivity models. Similar to Figure 24, Figure 27a,b illustrate the distribution of C f before the shock wave and its relative error, while Figure 27c,d present the results after the shock wave. In comparison to Figure 21 and Figure 24, it is noticeable that the thermal conductivity models induce a minor deviation, with the maximum relative error being 0.2% before the shock wave and 0.5% after the shock wave when employing the constant thermal conductivity model for the calculation.

5. Conclusions

Different gas models were tested to assess their impact on CFD calculations for nitrogen flow in a cryogenic wind tunnel. The aerodynamic properties of an NACA 0012-64 aerofoil in cryogenic environment were calculated and compared. An analysis of the flow fields and the aerofoil’s aerodynamic performance led to the following conclusions:
(1)
The isentropic relations of cryogenic nitrogen flow exhibit variations, and combining the ideal gas EOS with the real gas specific heat ratio can result in significant errors, potentially leading to the mistaken belief that the real gas effect is pronounced.
(2)
For cryogenic nitrogen flow, the impact of EOSs, viscosity models, and thermal conductivity models on aerodynamic properties like C d , p and C d , v is relatively small. However, noticeable differences arise when considering the skin friction coefficient, primarily due to the presence of shock waves, with the ideal gas EOS causing the most significant deviation.
This study predominantly focuses on the cryogenic transonic flow over a two-dimensional model’s surface without considering the influence of three-dimensional effects on the model’s aerodynamic characteristics. Future research will explore three-dimensional problems. Additionally, when considering the influence of heat transfer on the surface temperature and other model parameters under cryogenic conditions, leading to changes in aerodynamic characteristics, further research is necessary to investigate the impact of cryogenic surface heat transfer on the flow.

Author Contributions

Conceptualization, Y.C. and R.H.; methodology, Y.C., R.H. and S.T. software, S.T.; validation, R.H. and J.W.; formal analysis J.W.; investigation, R.H. and S.T.; resources, S.T.; data curation, R.H. and Y.C.; writing—original draft preparation, R.H.; review and editing, R.H. and S.T. All authors have read and agreed to the published version of the manuscript.

Funding

This research was funded by the National Numerical Wind Tunnel Project (Grant No. NNW2019ZT7-B31).

Data Availability Statement

The data that support the findings of this study are available from the corresponding author upon request.

Acknowledgments

The work was financially supported by National Numerical Wind Tunnel Project (Grant No. NNW2019ZT7-B31). This research was also supported in part by the Priority Academic Program Development of Jiangsu Higher Education Institutions.

Conflicts of Interest

The authors declare no conflict of interest.

References

  1. Hall, R.M.; Adcock, J.B. Simulation of Ideal-Gas Flow by Nitrogen and Other Selected Gases at Cryogenic Temperatures; NASA: Washington, DC, USA, 1981.
  2. Adcock, J.B.; Kilgore, R.A.; Ray, E.J. Cryogenic nitrogen as a transonic wind-tunnel test gas. In Proceedings of the 13th Aerospace Sciences Meeting, Pasadena, CA, USA, 20–22 January 1975. [Google Scholar]
  3. Lutz, T.; Kleinert, J.; Waldmann, A.; Koop, L.; Yorita, D.; Dietz, G.; Schulz, M. Research Initiative for Numerical and Experimental Studies on High-Speed Stall of Civil Aircraft. J. Aircr. 2023, 60, 623–636. [Google Scholar] [CrossRef]
  4. Lutz, T.; Gansel, P.; Waldmann, A.; Zimmermann, D.-M.; Hülse, S.S.A. Prediction and Measurement of the Common Research Model Wake at Stall Conditions. J. Aircr. 2016, 53, 501–514. [Google Scholar] [CrossRef]
  5. Hensch, A.K.; Guntermann, P.; Longo, R.; Klein, C.; Risius, S.; Schaber, S.; Quest, J.; Okfen, P. Investigation of Hybrid Laminar Flow Control (HLFC) on a 2D-Model in the Cryogenic Pilot European Transonic Windtunnel (PETW). In Proceedings of the AIAA Scitech 2019 Forum, San Diego, CA, USA, 7–11 January 2019. [Google Scholar]
  6. Klein, C. Boundary layer transition detection on wind tunnel models in PETW during continuous pitch traverse. In Proceedings of the AIAA Scitech 2019 Forum, San Diego, CA, USA, 7–11 January 2019. [Google Scholar]
  7. Rivers, M.; Quest, J.; Rudnik, R. Comparison of the NASA Common Research Model European Transonic Wind Tunnel test data to NASA National Transonic Facility test data. CEAS Aeronaut J. 2018, 9, 307–317. [Google Scholar] [CrossRef]
  8. Vrchota, P.; Prachař, A. Using wing model deformation for improvement of CFD results of ESWIRP project. CEAS Aeronaut J. 2018, 9, 361–372. [Google Scholar] [CrossRef]
  9. Wang, X.; Wu, J.; Chen, J.; Li, Y.; Zhao, Z.; Liu, G.; Tao, Y.; Xiong, N. Numerical Study of Nonadiabatic Wall Effects on Aerodynamic Characteristics of CHN-T1 Standard Model. Aerospace 2023, 10, 372. [Google Scholar] [CrossRef]
  10. Magalhães, L.B.; Silva, A.R.; Barata, J.M. Computational Analysis of High-Pressure Nitrogen Jets from Transcritical to Supercritical Gas-Like Conditions. In Proceedings of the AIAA Propulsion and Energy 2021 Forum, Online, 9–11 August 2021. [Google Scholar]
  11. Matheis, J.; Müller, H.; Hickel, S.; Pfitzner, M. Large-Eddy Simulation of Cryogenic Jet Injection at Supercritical Pressures. High-Press. Flows Propuls. Appl. 2020, 260, 531–570. [Google Scholar]
  12. Traxinger, C.; Banholzer, M.; Pfitzner, M. Real-Gas Effects and Phase Separation in Underexpanded Jets at Engine-Relevant Conditions. In Proceedings of the 2018 AIAA Aerospace Sciences Meeting, Kissimmee, FL, USA, 8–12 January 2018. [Google Scholar]
  13. Banuti, D.T.; Hannemann, K. Application of a Real-Gas-Library Multi-Fluid-Mixing Model to Supercritical Single Injector Flow. In Proceedings of the 50th AIAA/ASME/SAE/ASEE Joint Propulsion Conference, Cleveland, OH, USA, 28–30 July 2014. [Google Scholar]
  14. Hall, R.M.; Ray, E.J. Investigation of Minimum Operating Temperatures for Cryogenic Wind Tunnels. J. Aircr. 1977, 14, 560–564. [Google Scholar] [CrossRef]
  15. Inger, G.R. On the Simulation of Transonic Shock-Turbulent Boundary Layer Interactions in Cryogenic or Heavy Gas Wind Tunnels. In Proceedings of the 10th AIAA Aerodynamic Testing Conference, San Diego, CA, USA, 19–21 April 1978. [Google Scholar]
  16. Inger, G.R. Transonic Shock-Boundary-Layer Interactions in Cryogenic Wind Tunnels. J. Aircr. 1979, 16, 284–287. [Google Scholar] [CrossRef]
  17. Adcock, J.B. Simulation of flat-plate turbulent boundary layers in cryogenic tunnels. J. Aircr. 1980, 17, 284–285. [Google Scholar] [CrossRef]
  18. Wagner, B.; Schmidt, W. Theoretical Investigations of Real Gas Effects in Cryogenic Wind Tunnels. AIAA J. 1978, 16, 580–586. [Google Scholar] [CrossRef]
  19. Hall, R.M. Preliminary Study of the Minimum Temperatures for Valid Testing in a Cryogenic Wind Tunnel; NASA: Washington, DC, USA, 1975.
  20. Sun, W.; Xu, T.; Hou, Y.; Ma, Z.Y.; Zhang, L.T. Numerical investigation of nitrogen condensation flow over airfoil in cryogenic wind tunnel. Cryogenics 2020, 111, 103165. [Google Scholar] [CrossRef]
  21. Ma, J.; Liu, H.S.; Liu, L.; Xie, M.Z. Simulation study on the cryogenic liquid nitrogen jets: Effects of equations of state and turbulence models. Cryogenics 2021, 117, 103330. [Google Scholar] [CrossRef]
  22. Cengel, Y.; Boles, M. Thermodynamics: An Engineering Approach, 8th ed.; McGraw-Hill Education: New York, NY, USA, 2015; pp. 51–111. [Google Scholar]
  23. Aungier, R.H. A Fast, Accurate Real Gas Equation of State for Fluid Dynamic Analysis Applications. J. Fluids Eng. 1995, 117, 277–281. [Google Scholar] [CrossRef]
  24. NIST Standard Reference Database Number 69. Available online: http://webbook.nist.gov/chemistry/ (accessed on 2 October 2023).
  25. Span, R.; Lemmon, E.W.; Jacobsen, R.T.; Wagner, W.; Yokozeki, A. A Reference Equation of State for the Thermodynamic Properties of Nitrogen for Temperatures from 63.151 to 1000 K and Pressures to 2200 MPa. J. Phys. Chem. Ref. Data 2000, 29, 1361–1433. [Google Scholar] [CrossRef]
  26. White, F.M. Fluid Mechanics, 8th ed.; McGraw-Hill Education: New York, NY, USA, 2014; pp. 15–39. [Google Scholar]
  27. Poling, B.E.; Prausnitz, J.M.; O’Connell, J.P. Properties of Gases and Liquids, 4th ed.; McGraw-Hill Education: New York, NY, USA, 2001; pp. 455–623. [Google Scholar]
  28. Lemmon, E.W.; Jacobsen, R.T. Viscosity and Thermal Conductivity Equations for Nitrogen, Oxygen, Argon, and Air. Int. J. Thermophys. 2004, 25, 21–69. [Google Scholar] [CrossRef]
  29. Lankford, D.; Powell, S.; Hand, T. Implementation of Real Gas Effects in the Wind-US Flow Solver. In Proceedings of the 43rd AIAA Aerospace Sciences Meeting and Exhibit, Reno, NV, USA, 10–13 January 2005. [Google Scholar]
  30. Carlson, J.R. Assessment of Using Ideal Gas for Predicting Boattail Flow at Cryogenic Temperatures. In Proceedings of the AIAA SCITECH 2023 Forum, Washington, DC, USA, 23–27 January 2023. [Google Scholar]
Figure 1. Classification of gas properties.
Aerospace 10 00986 g001
Figure 2. Thermodynamic properties of an ideal gas and a real gas (pure nitrogen). (a) Specific heat ratio. (b) Density.
Aerospace 10 00986 g002
Figure 3. Variation in the specific heat ratio and isentropic expansion coefficient at different pressures. (a) Specific heat ratio. (b) Isentropic expansion coefficient.
Aerospace 10 00986 g003
Figure 4. Variation in the stagnation-to-static ratio and relative error obtained from different isentropic relations. (a) Stagnation-to-static ratio. (b) Relative error.
Aerospace 10 00986 g004
Figure 5. Variation in the density of different EOSs at different pressures. (a) p = 101,325   P a . (b) p = 303,975   P a . (c) p = 506,625   P a .
Aerospace 10 00986 g005
Figure 6. The variation in relative error across different EOSs under varying pressure conditions. (a) p = 101,325   P a . (b) p = 303,975   P a . (c) p = 506,625   P a .
Aerospace 10 00986 g006
Figure 7. Variation in viscosity of different viscosity models at different pressures. (a) p = 101,325   P a . (b) p = 303,975   P a . (c) p = 506,625   P a .
Aerospace 10 00986 g007
Figure 8. Variation in relative error of different viscosity models at different pressures. (a) p = 101,325   P a . (b) p = 303,975   P a . (c) p = 506,625   P a .
Aerospace 10 00986 g008
Figure 9. Variation in thermal conductivity among different thermal conductivity models at varying pressure levels. (a) p = 101,325   P a . (b) p = 303,975   P a . (c) p = 506,625   P a .
Aerospace 10 00986 g009
Figure 10. Variation in relative error of different thermal conductivity models at different pressures. (a) p = 101,325   P a . (b) p = 303,975   P a . (c) p = 506,625   P a .
Aerospace 10 00986 g010
Figure 11. Computational domain and grid generation. (a) Computation domain. (b) Grid generation.
Aerospace 10 00986 g011
Figure 12. The comparison of pressure coefficient using different grids.
Aerospace 10 00986 g012
Figure 13. Variation in the pressure drag coefficient and the relative error associated with different isentropic relations with the total pressure. (a) Pressure drag coefficient. (b) Relative error.
Aerospace 10 00986 g013
Figure 14. Variation in the viscous drag coefficient, relative error, and uncertainty related to different isentropic relations in connection with the total pressure. (a) Viscous drag coefficient. (b) Relative error.
Aerospace 10 00986 g014
Figure 15. Pressure coefficient of different isentropic relations under different R e   v a l u e s . (a) R e = 7.35 × 10 6 . (b) R e = 21.85 × 10 6 . (c) R e = 36.05 × 10 6 .
Aerospace 10 00986 g015
Figure 16. Pressure coefficient of Method 3 under different R e   v a l u e s .
Aerospace 10 00986 g016
Figure 17. Skin friction coefficient calculated via different isentropic relations.
Aerospace 10 00986 g017
Figure 18. Relative error of the skin friction coefficient before and after shock waves calculated using different isentropic relations. (a) Before shock wave. (b) After shock wave.
Aerospace 10 00986 g018
Figure 19. Variation in the pressure drag coefficient and relative error of different EOSs with R e . (a) Pressure drag coefficient. (b) Relative error.
Aerospace 10 00986 g019
Figure 20. Variation in the viscous drag coefficient and relative error of different EOSs with R e . (a) Viscous drag coefficient. (b) Relative error.
Aerospace 10 00986 g020
Figure 21. Skin friction coefficient and relative error before and after shock wave, calculated using different EOSs. (a) C f distribution before shock wave. (b) Relative error. (c) C f distribution after shock wave. (d) Relative error.
Aerospace 10 00986 g021
Figure 22. Variation in the pressure drag coefficient and relative error of different viscosity models with R e .
Aerospace 10 00986 g022
Figure 23. Variation in the viscous drag coefficient and relative error of different viscosity models with R e .
Aerospace 10 00986 g023
Figure 24. Skin friction coefficient and relative error before and after shock wave, calculated using different viscosity models.
Aerospace 10 00986 g024aAerospace 10 00986 g024b
Figure 25. Variation in the pressure drag coefficient and relative error of different thermal conductivity models with R e .
Aerospace 10 00986 g025
Figure 26. Variation in the viscous drag coefficient and relative error of different thermal conductivity models with R e .
Aerospace 10 00986 g026
Figure 27. Skin friction coefficient and relative error before and after shock wave, calculated using different thermal conductivity models.
Aerospace 10 00986 g027
Table 1. Coefficient of RK EOS and modified forms.
EOS α b c δ ε
RK α 0 T c 0.5 T 0.5 0.08664 R T c p c 0 b 0
SRK α 0 1 + n 1 T T c 0.5 2 0.08664 R T c p c 0 b 0
PR α 0 1 + n 1 T T c 0.5 2 0.07780 R T c p c 0 2 b b 2
ARK α 0 T T c 0.4986 + 1.1735 ω + 0.4754 ω 2 0.08664 R T c p c c = R T c p c + α 0 v c ( v c + b ) + b V c b 0
For RK EOS, SRK EOS, and ARK EOS, α 0 = 0.42747 R 2 T c 2 p c , while α 0 = 0.457247 R 2 T c 2 p c if PR EOS is used.
Table 2. Calculation conditions.
ComparisonIsentropic RelationEOSViscosityThermal Conductivity
Conditions
M a 0.85
p 0 ( P a ) 101,325/303,975/506,625
R e ( × 10 6 ) 7.35/21.85/36.05
EOSDetailed in Table 2DifferentARKARK
Viscosity modelLemmonLemmonDifferentLemmon
Thermal conductivity modelLemmonLemmonLemmonDifferent
Isentropic relationDetailed in Table 2(5)(5)(5)
Wall conditionAdiabat
Table 3. Detailed calculation condition of isentropic relationship.
Method123
Condition
EOSNIST dataIdeal gasIdeal gas
Isentropic relationEquation (5)Equation (3)Equation (3)
Expansion coefficient α γ of real gas γ = 1.4
Table 4. Mach number contours calculated using different isentropic relations at different R e values.
Method R e = 7.35 × 10 6 . R e = 21.85 × 10 6 R e = 36.05 × 10 6
1Aerospace 10 00986 i001Aerospace 10 00986 i002Aerospace 10 00986 i003
2Aerospace 10 00986 i004Aerospace 10 00986 i005Aerospace 10 00986 i006
3Aerospace 10 00986 i007Aerospace 10 00986 i008Aerospace 10 00986 i009
Disclaimer/Publisher’s Note: The statements, opinions and data contained in all publications are solely those of the individual author(s) and contributor(s) and not of MDPI and/or the editor(s). MDPI and/or the editor(s) disclaim responsibility for any injury to people or property resulting from any ideas, methods, instructions or products referred to in the content.