1. Introduction
Aircraft maintenance can be defined as a combination of all technical, administrative, and managerial actions during the aircraft life cycle intended to retain or restore it to a state in which it can perform its required function [
1]. The purpose of aircraft maintenance is to keep the aircraft in a serviceable and reliable condition to generate revenue while maintaining its current and future value, minimizing the physical deterioration throughout its life, as stated by Rodrigues et al. [
2]. Aircraft maintainability is the ability of the aircraft to meet operational objectives with a minimum expenditure of maintenance effort under the operational and environmental conditions in which scheduled and unscheduled maintenance are performed [
3].
Aircraft maintenance approaches can be discerned depending on a present or probable future maintenance requirement (failure). Maintenance performed for an existing reason is commonly called reactive or corrective maintenance; whereas, maintenance performed for possible future reasons is called proactive. According to Fei et al. [
4], reactive maintenance steps into action after the occurrence of a failure. On the other hand, proactive maintenance consists of preventive and predictive maintenance. Preventive maintenance is performed in predetermined intervals to reduce the probability of failure or performance degradation, according to Guillén et al. [
5]. Predictive maintenance replaces or repairs components or systems based on determining future in-service equipment conditions [
5]. Predictive maintenance is currently at the cutting edge of aircraft maintenance research, sometimes referred to holistically as prognostics and health management (PHM). Goebel et al. [
6] define the role of state prediction in aircraft and other technical systems during health management as predicting the required time to realize a future event or condition. Future state prediction is the basis of prognostic approaches used for maintenance decision making. Future state prediction determines the observed part or system’s remaining useful life (RUL), consequently determining maintenance requirements. Elattar et al. [
7] describe PHM in aircraft maintenance as a process that determines the RUL of an aircraft part, component system, or subsystem.
The prognostics and health management process is applied to aircraft maintenance depending on the aircraft type and the type of intended operation.
Non-complex aircraft for non-commercial operation, otherwise known as aircraft for sport and recreational purposes, are defined by Regulation (EU) 800/2013 as European Light Aircraft (ELA) and are divided into categories named ELA 1 and ELA 2. Aircraft named ELA 1 are airplanes, sailplanes, powered sailplanes under 1200 kg maximum takeoff mass (MTOM), and balloons, which are differentiated by their hot air, gas, and tethered gas volume. ELA 2 aircraft have a higher MTOM of ≤ 2000 kg applied to airplanes and sailplanes; they also include balloons not classified as ELA 1 and simple, very light rotorcraft (MTOM ≤ 600 kg) that have no more than two occupants, are not powered by turbine or rocket engine, and are restricted to operations under visual flight rules. This research focuses on light aircraft, mainly aircraft used for sport and recreational flight. Within this domain, sports and recreational aviation include a variety of aircraft, with De Voogt and van Doorn [
8] recognizing their scope within general aviation. The Federal Aviation Administration (FAA) defines and regulates ultralight aircraft, emphasizing the role of industry self-regulation, with organizations like the Experimental Aircraft Association (EAA) and the United States Ultralight Association (USUA) overseeing certification processes.
According to the Statistical Office of the European Union (Eurostat) [
9], there were 147 fatalities recorded in 2022 in aviation accidents on the European Union (EU) territory involving EU-registered aircraft. Eurostat states that most air accident fatalities in 2022 (83%) concerned general aviation aircraft under 2250 kg. This includes a range of aircraft from small airplanes to hot air balloons. Research by De Voogt and van Doorn [
8] gives variations in accident rates across different aircraft within sport and recreational aviation. The highest number of accidents was found with gliders; however, the highest relative number of fatal accidents came from ultralight aircraft and gyroplanes [
8].
A significant part of sports and recreational aviation is amateur-built aircraft. A study performed by Nelson and Goldman [
10] displayed that between 1983 and 2001, the total number of amateur-built aircraft accidents was 3752, including a 30% fatality rate, as opposed to 19% fatalities in other general aviation aircraft flying in the USA. Nelson and Goldman [
11] conclude that amateur-built aircraft are a particular risk in sports and recreational aviation. As reported by the Aviation Policy and Plans General Aviation and Air Taxi Activity Survey of 2000 [
11], the ratio of accidents and the number of aircraft in operation is much higher when observing amateur-built aircraft than other general aviation aircraft. The distinctiveness of amateur-built aircraft is that one individual often carries out design, construction, modifications, and maintenance without requiring a background in aviation.
Another significant part of sport and recreational aviation is ultralight aircraft. Similar to amateur-built aircraft, ultralights allow specific maintenance procedures to be performed by the aircraft owner. Depending on the relevant aviation regulations, an ultralight aircraft owner can also be the pilot and the maintenance technician, provided they have the appropriate pilot’s license and technical ability according to the aviation regulations [
12]. Authors Pagán et al. [
13] determined a threshold of about 40 h of flying experience where pilots with less experience had a significantly higher chance of being involved in the loss-of-control-related accidents.
In contrast, pilots with more than 40 h of flying experience had a higher chance of engine failure and other maintenance-related accidents. The study [
13] found that research assisting ultralight accident prevention is scarce. The authors [
13] concluded that the most significant problems causing ultralight aircraft accidents are lack of experience, inadequate maintenance skills, and unfamiliarity with the aircraft.
Based on the literature findings presented in this chapter, a light aircraft prognostic method for structural parts is proposed. The outcome of the proposed method is the RUL of light aircraft structural parts. The remainder of this paper is structured as follows.
Section 1 and
Section 2 emphasize this study’s significance and highlight the challenges with implementing existing aircraft structural prognosis in light aircraft maintenance.
Section 3 introduces the proposed method, generalized for all structural parts, and details a case study for method validation.
Section 4 presents and interprets the case study’s results, outlining key conclusions. In concluding
Section 5, the method’s potential for light aircraft maintenance improvement is discussed, highlighting overlooked impacts on structural part maintenance, stating method limitations, and suggesting further research paths.
2. The Problem with Implementing PHM in Light Aircraft Maintenance
In the first chapter, the fundamental concepts and context surrounding aircraft maintenance were established, focusing on the significance of PHM as a cutting-edge approach. This chapter laid the foundation for understanding the complexities of aircraft maintenance and introduced the concept of predicting the RUL of aircraft structural components. In the second chapter, the challenges of implementing PHM in the specific context of light aircraft maintenance will be observed. The limitations and unique characteristics of light aircraft will be explored, shedding light on the obstacles faced when applying PHM in this domain. By examining the issues related to data acquisition, maintenance scheduling, and the lack of advanced sensor technology, the critical need for a specialized approach to ensure the safety and reliability of light aircraft operations is highlighted.
As stated by Qi and Zhang [
14], the primary functions of PHM are achieved by data acquisition, data analysis, fault diagnostics, health assessment, life prediction, and maintenance decisions. This framework facilitates better failure prevention, repair planning, and maintenance scheduling. The authors Qi and Zhang [
14] also state that data collection is performed with the help of various transducers, such as sensors.
However, fleet databases and advanced sensor technology are not common in light aircraft, inhibiting the first step in prognostics and health management—data acquisition. As stated by Pagán et al. [
13], the most significant problem facing light aircraft, especially when observing aircraft used for sport and recreation, is that many pilots either lack experience or are unfamiliar with their aircraft’s proper maintenance and configuration. The authors acknowledge that maintenance of various parts and systems in sport and recreational aircraft is primarily undertaken by the pilots themselves.
Light aircraft often have a hard-time maintenance schedule that disregards the aircraft’s usage conditions. The same aircraft model is often used by a single pilot for recreational purposes in excellent weather conditions, when taking off and landing on a smooth asphalted surface, for pilot licensing purposes, and when carrying two pilots and taking off and landing on a rough grass runway. Consequently, the RUL of affected parts, with the same hard-time maintenance interval, is different. Implementing a simple prognostics and health management system capable of warning the maintainer of the need for early part replacement could increase the safety of light aircraft operations. Prognostics and health management in light aircraft maintenance implies that data acquisition is the first step for PHM implementation.
Light aircraft, especially those used for sport and recreation, are not equipped with numerous sensors and supporting systems for collecting, storing, and analyzing data that could be used for prognostic purposes. However, all light aircraft operations are accompanied by operational and maintenance records, including parameters that can be used for prognosis.
Some of the aircraft mandatory documents have information directly related to the specific operation, representing an opportunity for PHM application, such as the aircraft logbook and mass and balance sheets.
The aircraft logbook contains general information, such as the aircraft’s manufacturer and type, the year of manufacture, and the serial number necessary for accurate data management and sorting during data acquisition. Additionally, the aircraft logbook contains information on the flight date, location of takeoff, location of landing, time of takeoff, and time of landing. The aircraft logbook also contains operation history information like total airframe flight hours, the number of takeoff and landing cycles, observed malfunctions, and damage to the aircraft or its components.
The aircraft mass and balance sheets provide detailed information on load distribution. This includes the aircraft’s dry and operating mass, along with the corresponding position of the center of gravity. It also covers the cargo mass, fuel mass, and the overall aircraft mass. The sheets indicate the position of the center of gravity during takeoff, landing, and in a fuel-free state. Additionally, they provide loading information and details on cargo distribution.
Determining the RUL of any aircraft structural part requires the application of appropriate prognostic methods. Data acquisition for prognostic method application depends on the relevant RUL deterioration mechanism or mechanisms and the availability of deterioration-relevant data. For example, material fatigue is a significant light aircraft landing gear RUL deterioration factor. Feng et al. [
15] discuss aircraft landing gears by focusing on several factors, such as the importance of safety and maintenance, complexity in fatigue monitoring, potential for enhanced predictive maintenance, representation in system health indicators, and transferability of findings. According to Campbell and Lahey [
16], aircraft material fatigue was the direct cause of 2240 deaths and 1885 general aviation aircraft crashes, respectively, from the start of recording to 1984. Campbell and Lahey identified the two aircraft systems with the highest failure rates due to material fatigue as the propulsion and landing gear systems. The research showed that an average of 100 aircraft accidents occur annually due to material fatigue, of which 18 are a direct consequence of the material fatigue of metal parts. Pfingstl et al. [
17] proposed a fatigue damage index as a motivation for predicting aircraft decommissioning; they chose material fatigue based on the IATA’s best industry practices for aircraft decommissioning [
18]. Material fatigue is primarily dictated by the amplitude and frequency of the load acting on the observed part and environmental conditions. The amplitude of the load is dictated by the mass of the aircraft and the way the aircraft is operated while the frequency of the load is defined only by how the aircraft is used. While environmental conditions are not always part of sports and recreational aircraft flight records, and the aircraft must perform the operations for which it is intended, aircraft mass and mass displacement are regularly recorded information relevant to fatigue deterioration.
From the above sources, and depending on the prognostic method, it is possible to extract one or more quantitative parameters that unambiguously define the current condition of the observed structural part or component and enable condition prognosis. Maintenance actions are applied when the observed quantity reaches a predetermined threshold representing a critical value, i.e., a favorable moment for applying maintenance procedures.
3. Design of An Expert System for RUL Prediction
Recent studies state that the field of structural RUL prediction, in general, is in its early developmental stages, for example, Galanopoulos et al. [
19]. However, operational and maintenance records can be utilized to achieve this goal. Expert systems can offer a systematic structure and logic to derive valuable insights.
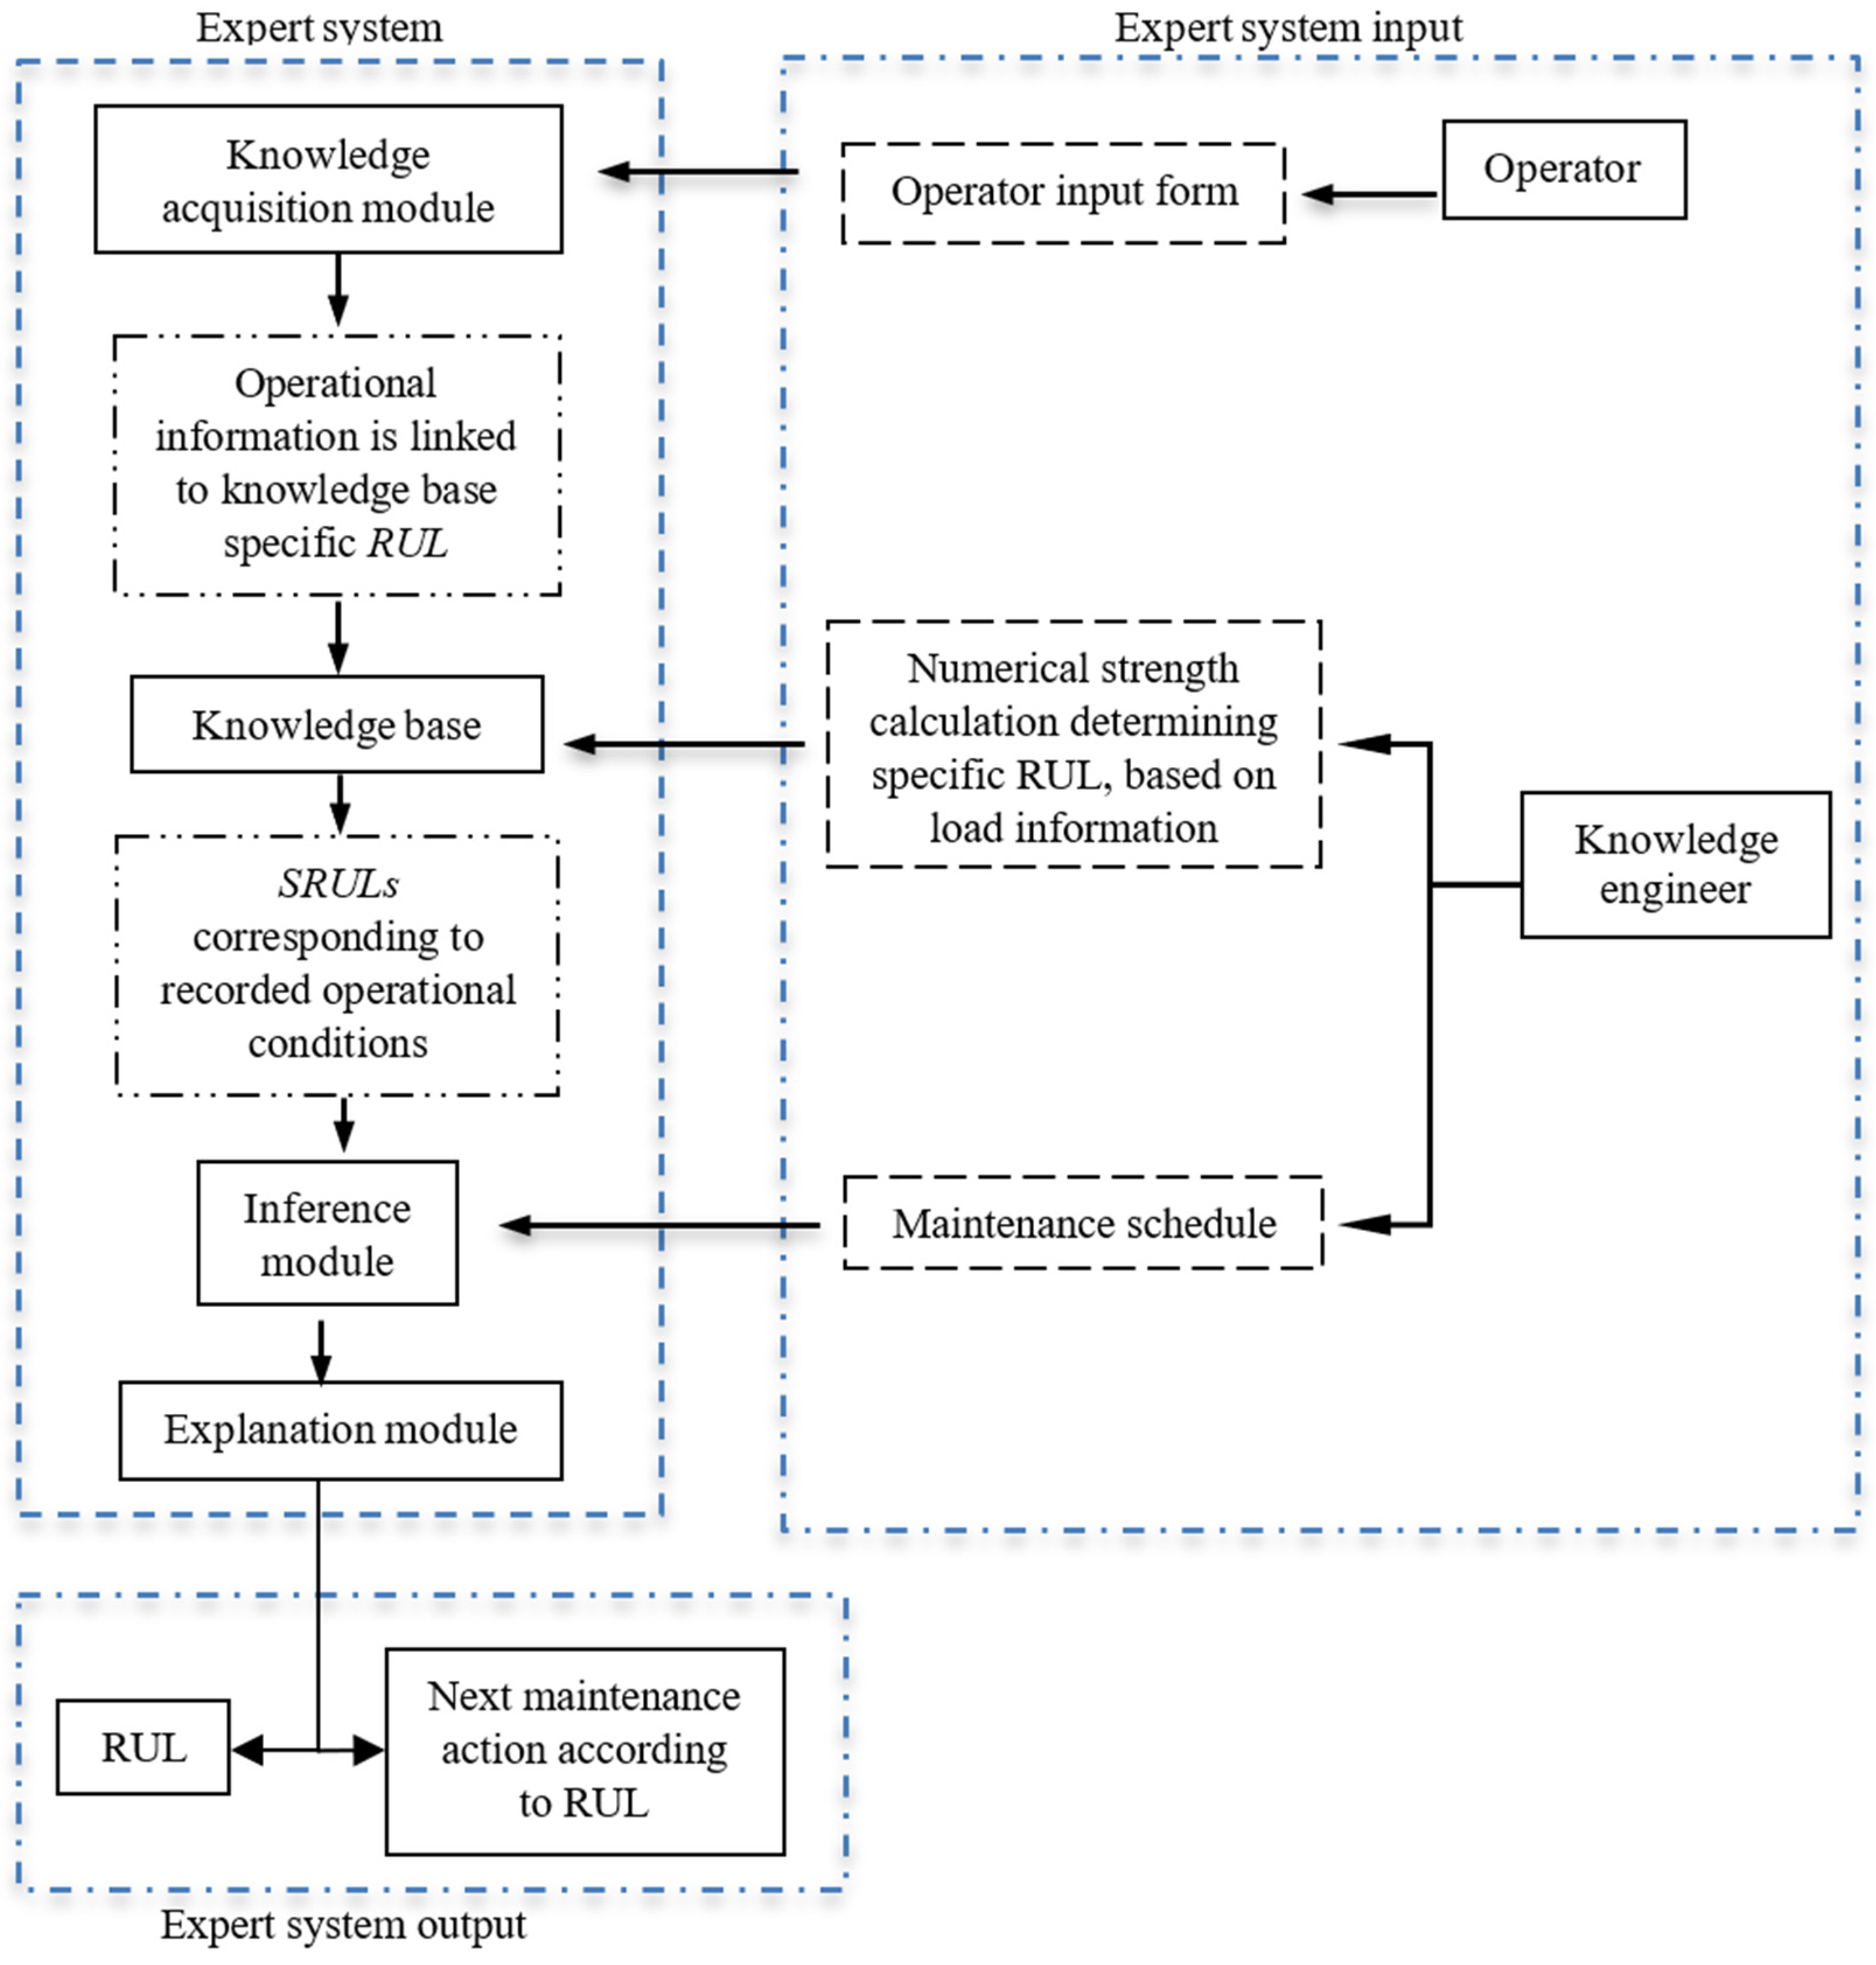
The development of an expert system for light aircraft structures requires careful consideration of each module’s autonomy and its interdependence on neighboring modules for accurate input data. To address this modular characteristic, we chose an incremental development strategy that allows us to gradually build the expert system. For accurate assessments of the RUL of a light aircraft structural part, an expert system must draw from input knowledge provided by both the operator and aircraft manufacturer. Tailored modifications to this general architecture can be implemented to accommodate various aircraft components, as depicted in
Figure 1.
It consists of several distinct modules, each designed with a unique function.
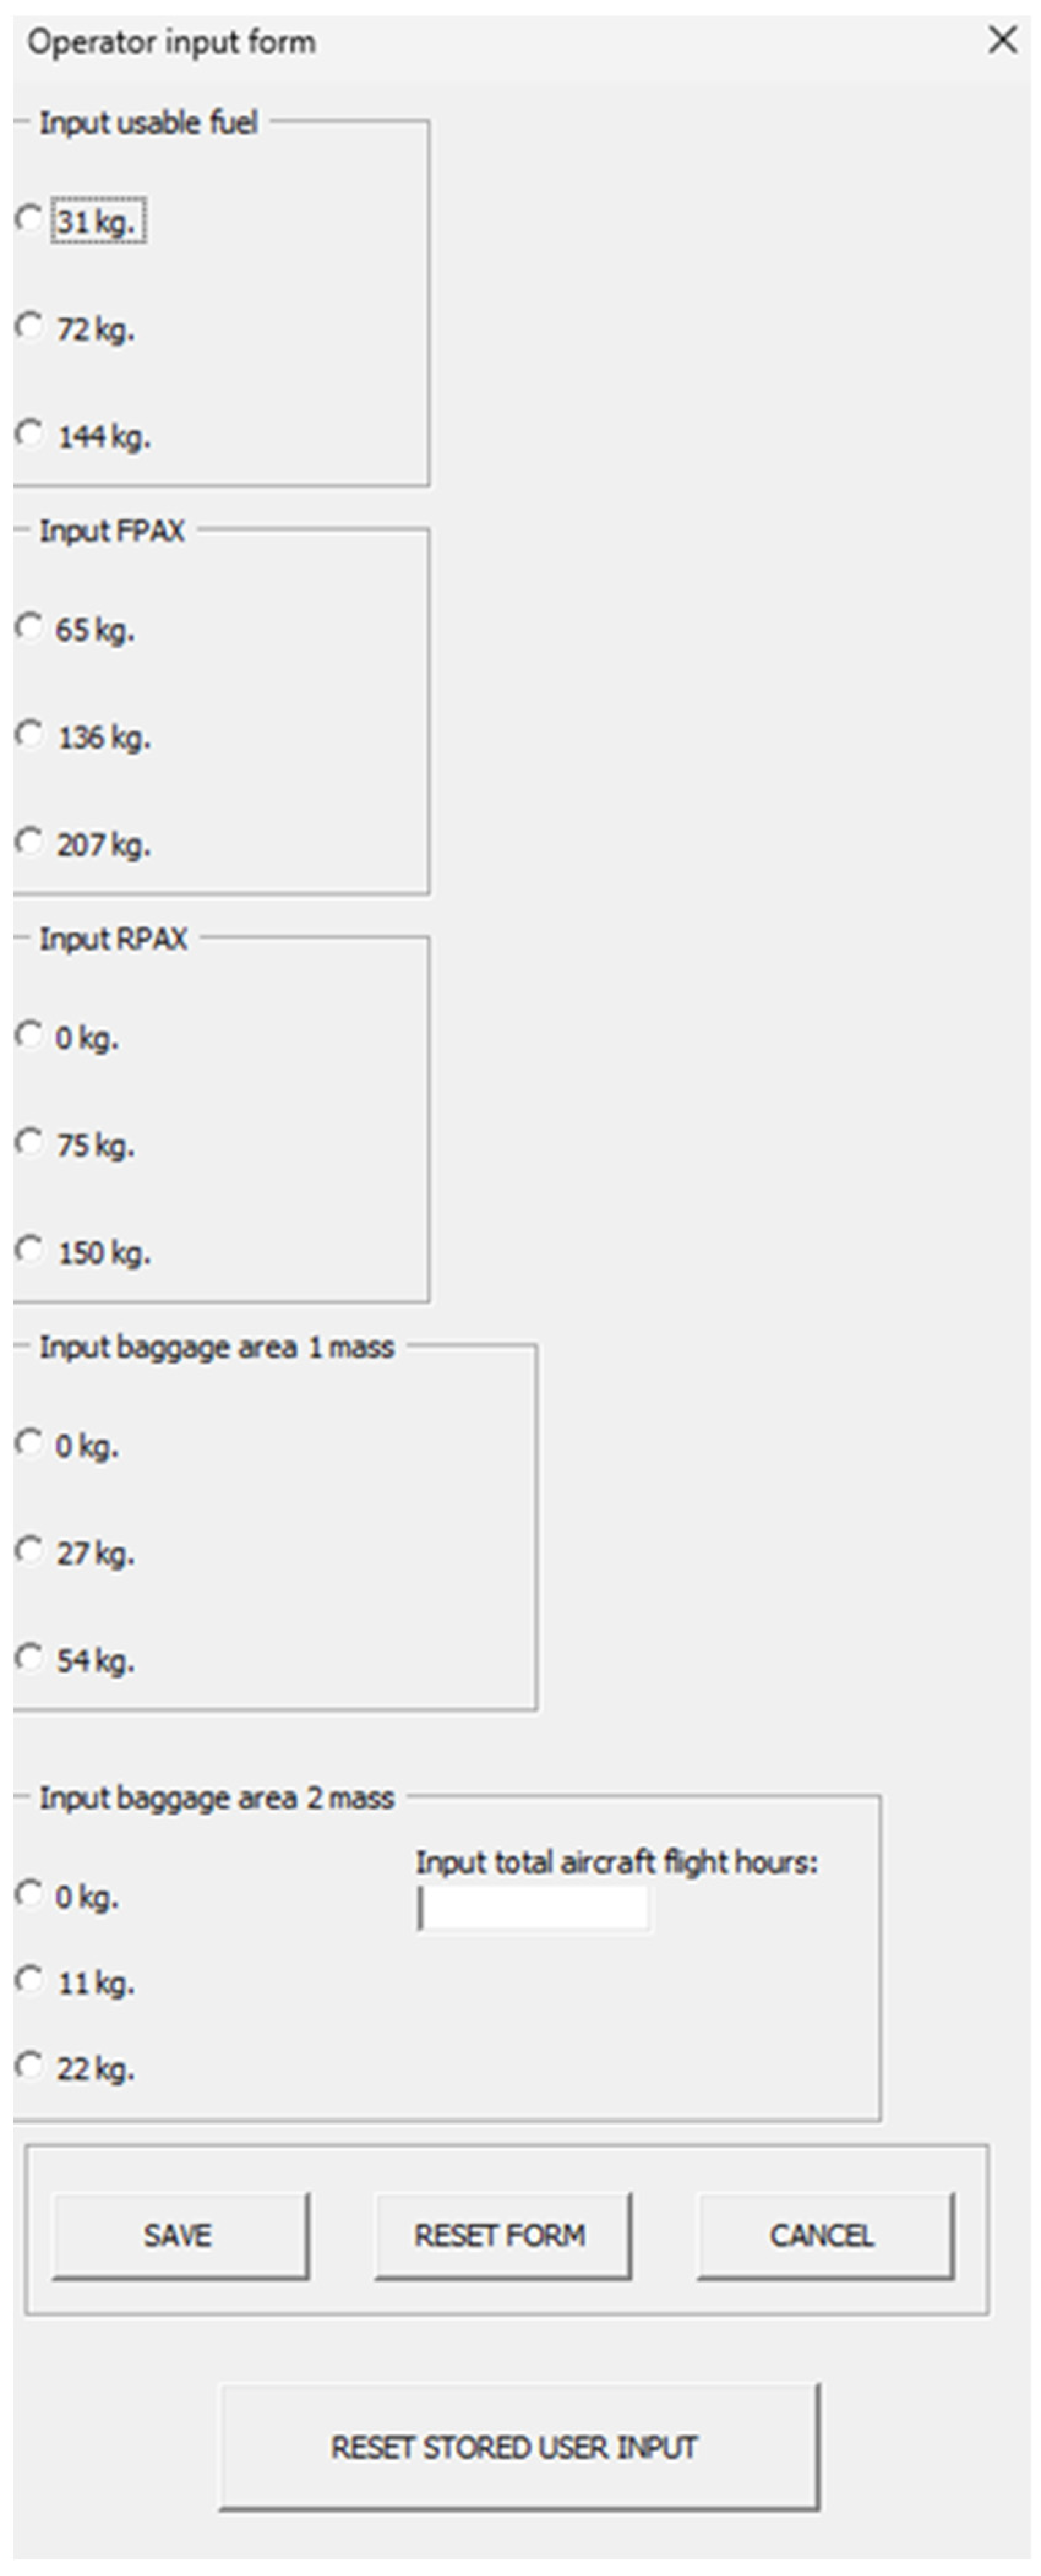
Knowledge acquisition module is responsible for gathering data from sources relevant to the RUL, which will later be used for information extraction from the knowledge base. When applied to light aircraft structures, such as landing gear parts, this module would include an input form enabling the part degradation of the relevant data input. An example of this input form is shown in
Figure 2.
Knowledge base stores the specific remaining useful lives (SRULs) of the observed part. For example, the RUL of a part affected by material fatigue is influenced by the variability of operational loads it experiences. To predict RUL, an average of these variable loads is computed and used to determine the SRUL by means of numerical strength calculation. The knowledge base contains a repository of these SRULs, each corresponding to the RUL of the part under distinct load profiles and operational conditions. By inputting actual operational data from mandatory records into the system, the expert system finds the corresponding SRUL values and calculates the part’s RUL.
Inference module pulls relevant SRUL values from the knowledge base based on information stored in the knowledge acquisition module and calculates the part’s RUL based on a cumulative damage rule.
Explanation module articulates the calculated RUL to the end user, simultaneously suggesting the required or next maintenance action according to the observed parts maintenance schedule considering the calculated RUL.
The expert system sequence starts with operator input, capturing essential operational data. These data are subsequently stored within the knowledge acquisition module, enabling the identification of the corresponding RUL from the knowledge base. Within this base, expert knowledge is stored, categorizing the RULs of components by their specific operating conditions, further refining the distinction based on unique loads placed on monitored aircraft structures. The RULs corresponding to each operation SRUL enable the calculation of the total damage accumulated during a series of operations (called accumulated damage or accumulated fatigue damage in case fatigue deterioration is the primary RUL degradation mechanism). The accumulated damage is calculated in the inference module. Lastly, the explanation module links the calculated accumulated damage to the aircraft’s structural maintenance program, proposing the following maintenance action according to the observed part’s RUL (which is a consequence of the accumulated damage).
It was decided upon to create the expert system in Microsoft 365 Excel version 2309, using Excel’s integrated visual basic for applications.
By employing a logical “if-then-else” framework, the system aligns operational details with the associated RUL in the knowledge base. After that, the inference module calculates the cumulative RUL for the given structural part based on cumulative RULs for various operational conditions the aircraft has experienced so far. Following this computation, the explanation module maps the determined RUL to the maintenance agenda, identifying the required maintenance activities in line with the calculated RUL and the preset maintenance schedule.
3.1. The Knowledge Acquisition Module
The design of the knowledge acquisition module ensures comprehensive data collection to facilitate accurate RUL determinations based on operational and maintenance histories. For accurate prognosis, the primary RUL degradation mechanism must first be identified. Degradation-relevant parameters are essential factors for RUL prognosis [
19]. Although operational loads are often the primary cause of degradation, other factors, such as part corrosion, should also be considered. Parts showing signs of corrosion must be replaced or repaired to ensure their safety. Based on findings from previous research [
20] and the reasoning stated in
Section 2 of this paper, this study focuses on material fatigue as a significant deterioration mechanism.
The case study of the Cessna 172R main landing gear leg demonstrates the method’s practical application, showing how material fatigue predominates as the degradation mechanism, influenced by load intensity, orientation, direction, and time variability. These influences, called ‘load profiles’ for clarity, significantly affect landing gear leg lifetime.
Aircraft load profiles vary significantly depending on the operational phase, especially for landing gear legs. During ground operations, the intensity of loads can differ based on the aircraft’s mass and acceleration relative to the observed part. The aircraft mass, which includes fuel, crew, passengers, and baggage, can be sourced from the mass, balance sheet, or aircraft logbook. Acceleration measurements are a viable source of data required for load profile calculation, even if they are not specific to the observed aircraft. Generalized acceleration measurements can suffice given the similarity in performance data across similar aircraft types with a similar aerodynamic layout, mass, and engine performance. The maximum allowable load factors are also provided in the aircraft’s flight manual limitation section. These load factors, together with operator experience, can be used to estimate the average acceleration values required to calculate the load profile for the observed part.
An operator input form was created to validate methods in the case study. The form, as shown in
Figure 2, enables data extraction from mandatory mass and balance sheets and/or aircraft logbooks.
If the load profile was not relevant to the observed parts’ deterioration, then the operator input form would have to be adjusted accordingly, enabling available information input relevant to the main deterioration mechanism.
With access to data on the mass distribution within an aircraft, we can effectively compute the loads that are being exerted on a particular component, provided we have access to details regarding the aircraft’s acceleration. The information input by the operator is then stored in the knowledge acquisition table, as depicted in
Table 1. The first column represents the load profile from LP1 to LPn. The U.FUEL represents the fuel mass in the aircraft’s fuel tanks. The FPAX represents the mass in the aircraft’s front-row seats. The RPAX represents the mass in the rear seats. The BGA1 and BGA2 represent the mass in the aircraft’s baggage compartments.
If the aircraft mass and mass distribution were not relevant to the observed parts’ deterioration, then the knowledge acquisition table would have to be adjusted to accommodate available information input relevant to the main deterioration mechanism.
A visual basic code establishes the connection between
Table 1 and the knowledge base. As the operators input flight data from the mandatory operational records, the system links this data to the corresponding RUL in the knowledge base. This enables the system to accurately determine the suitable load profile for the specific part under observation and provide the necessary details to the RUL algorithm in the inference module.
3.2. The Knowledge Base
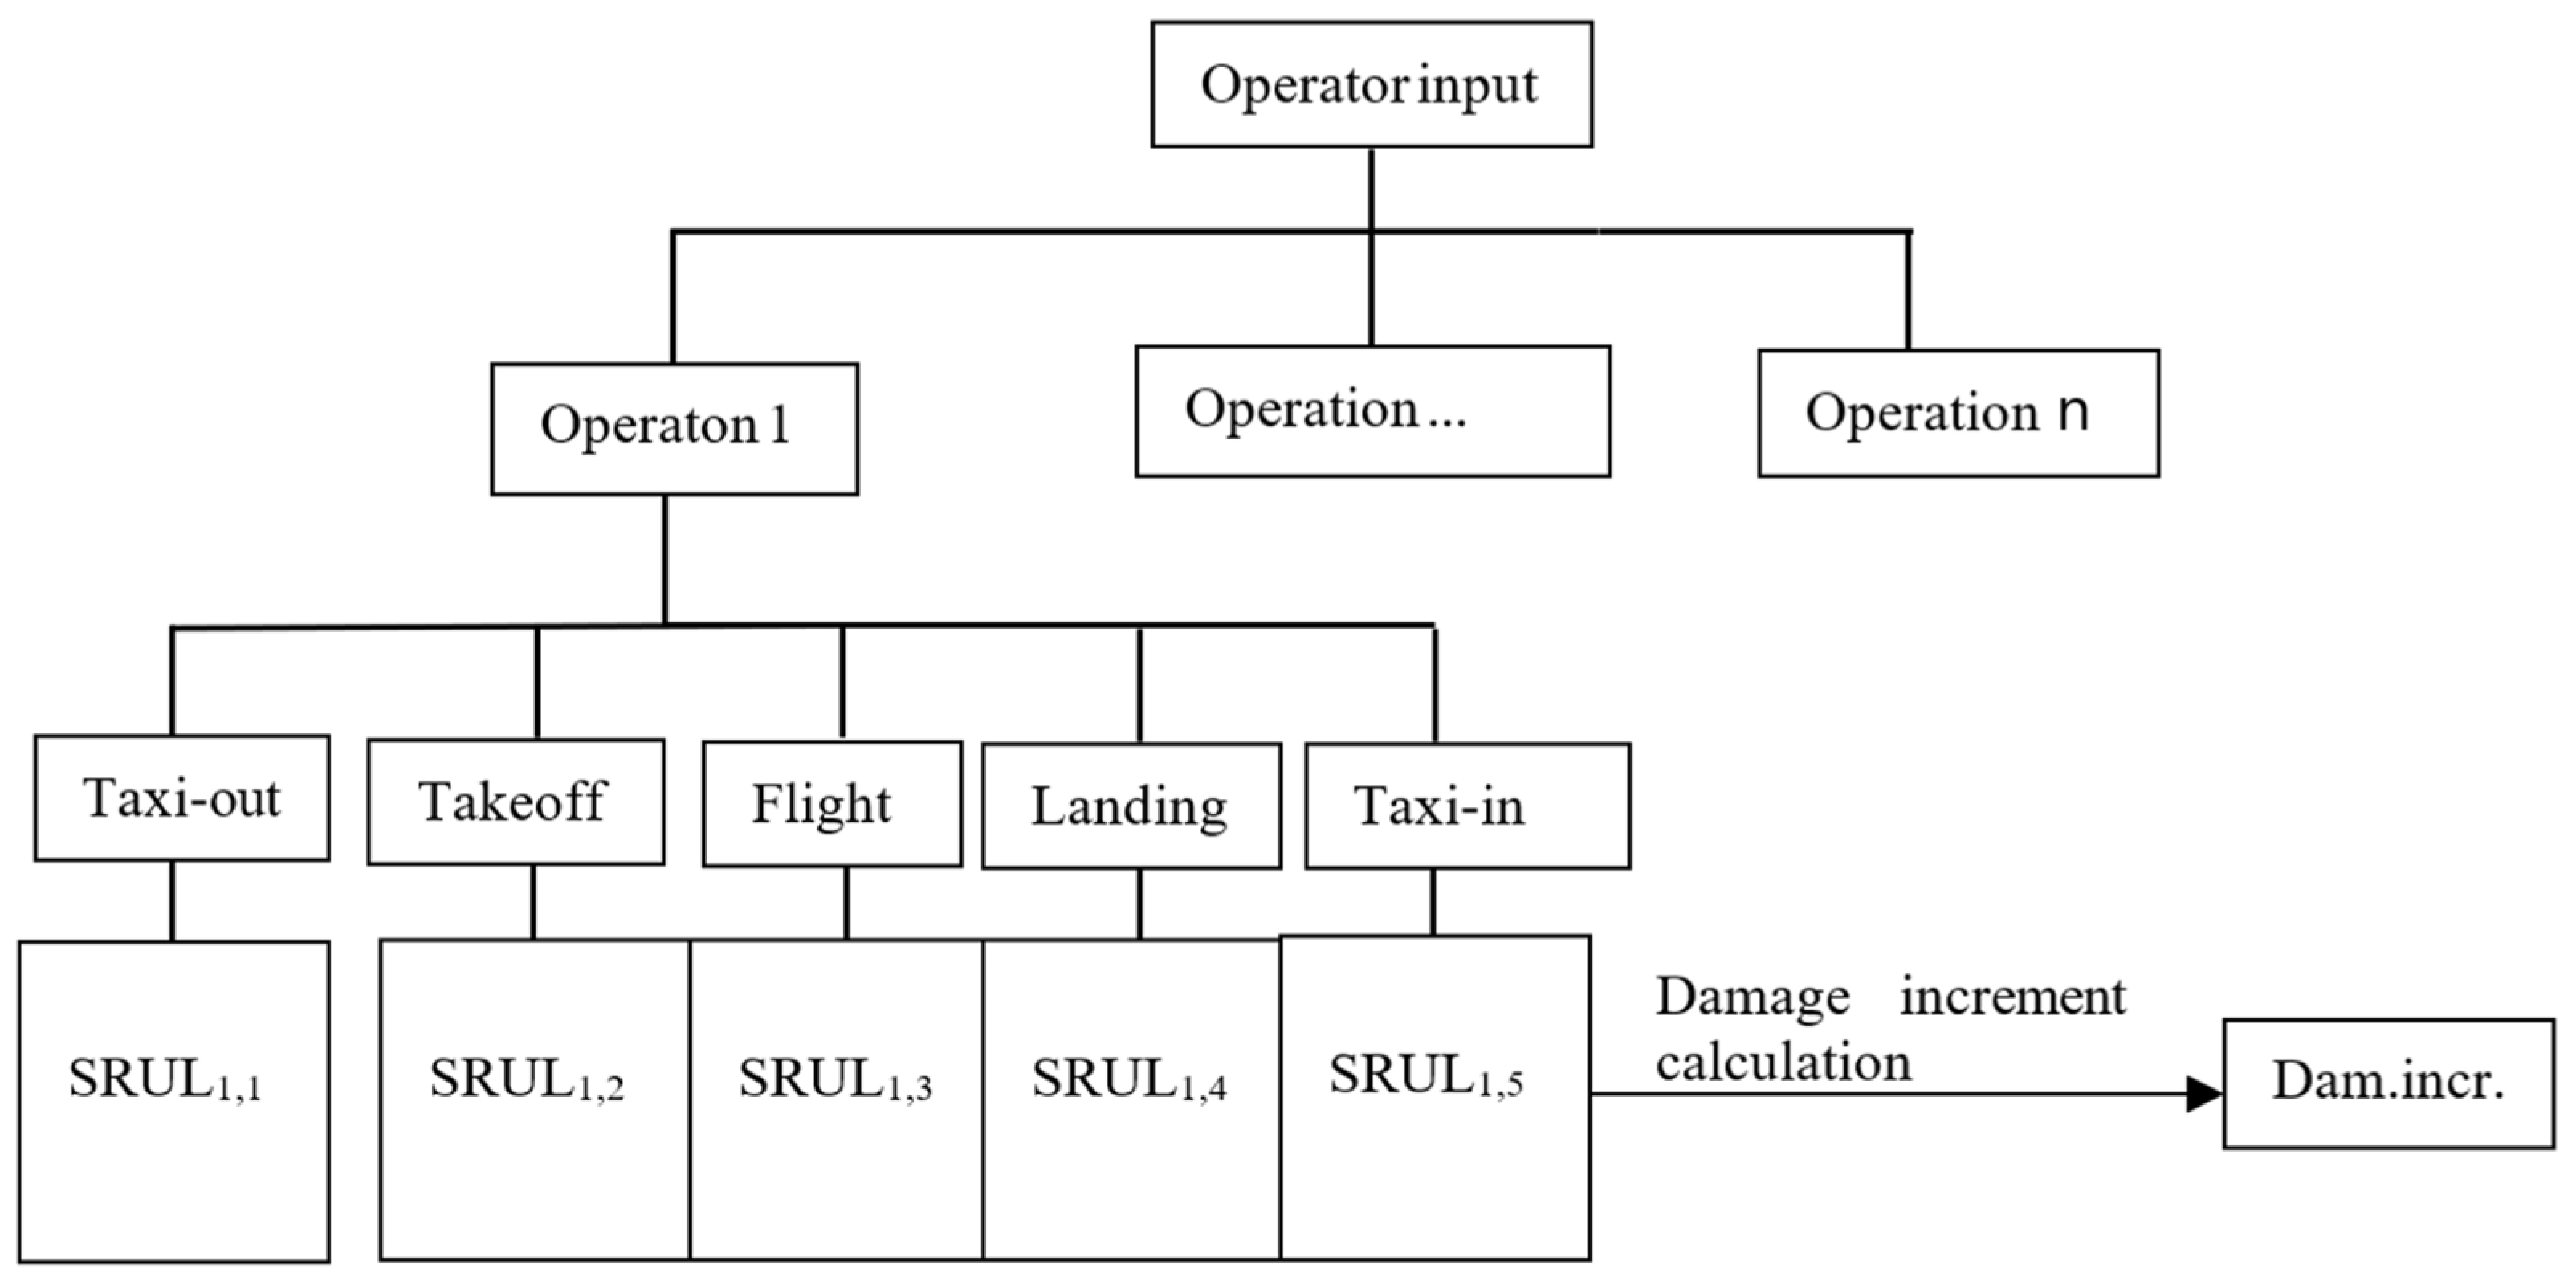
The knowledge base stores the SRUL data required for predicting the RUL of aircraft landing gear based on distinct load profiles. Each SRUL represents the RUL of the observed structural part under a particular load profile that is defined by load distribution, intensity, direction, and time variability. The knowledge base is a sorting and storage unit that stores previously calculated SRULs in a RUL table. The knowledge base organizes SRULs according to operator input information on mass and mass distribution, making extracting data for cumulative damage calculation easier. The SRULs are stored in a table based on the load profile, with rows labeled by a code representing mass and mass distribution corresponding to the operator input form. The columns of the RUL table are divided by the relevant load profiles, distinguished by the following flight phases: taxi-in, taxi-out, takeoff, flight, and landing. The taxi-out phase of the operation represents the load profile of the aircraft while taxiing to the runway, loaded with the starting fuel amount. The taxi-in phase of operation is when the aircraft has landed and taxis from the runway to its standstill position, loaded by a lesser fuel mass due to fuel consumption during operation. The operator inputs landing gear structure RUL-relevant information in the form of mass value and distribution according to the limitations defined in the weight and balance sheets.
To extract SRULs from the knowledge base RUL table for use in the expert system’s inference module, a visual basic (VBA) code was written. The corresponding RUL value is selected from the knowledge base RUL table based on the combination of the mass inputs determined from the knowledge acquisition table. Any given knowledge acquisition table input combination is linked to the appropriate SRUL through the VBA knowledge base code, representing the RUL of the landing gear structure under the corresponding specific loading conditions.
Figure 3 provides an example of the sorting logic for a Cessna 172R main landing gear leg.
The SRUL values are calculated using numerical strength analysis, which involves using the finite element method in a computer-aided design and testing environment. A fatigue life-related RUL analysis for the Cessna 172R main landing gear leg was conducted using Ansys Workbench 2023 R1 (student version). The damage increment in
Figure 3 represents the damage accumulated in the observed landing gear structural part during a single operation consisting of operation phases, each phase causing a SRUL. The damage increment is calculated by applying Equation (1). Equation (1) was created based on the Palmgren-Miner linear damage rule. The equation allows quantification of the fatigue damage for each mass value and distribution scenario, denoted by the index
i, which corresponds to the five operation phases.
The symbols in Equation (1):
is the damage increment for the i-th observed mass distribution scenario, [-];
is the number of times the i-th mass distribution scenario was performed, [-];
is the SRUL value for one of the five operation phases defined by the observed mass distribution scenario, [-].
The RUL table in
Table 2 stores SRULs and sorts them in rows labelled by mass value and distribution combinations and the rest of the columns are discerned by operation phases. The mass value and distribution combinations in the first column of
Table 2 consist of five numbers, consecutively representing aircraft fuel mass, the mass on the aircraft’s front seats, the mass on the aircraft’s rear seat, and the masses on the two existing baggage compartments. Taxi-out is the RUL of the landing gear when subjected solely to taxi-out phase loads. Taxi-in is the RUL of the landing gear under only taxi-in phase loads. Takeoff is the RUL of the landing gear if exposed exclusively to takeoff phase loads. Landing is the RUL of the landing gear under only landing phase loads. Flight is the RUL of the landing gear when subjected solely to flight phase loads.
For the case study, there were 141 mass value and distribution combinations in the RUL table (
Table 2) presented in the first table column and based on the observed three masses in each mass position. The reason for having exactly 141 mass value and distribution combinations is that a mass and balance check was performed on all possible combinations using a mass and balance calculator created for the case study. The mass value and distribution combinations that resulted in an unstable airplane, meaning the flight would have been prohibited, were excluded from observation.
If the aircraft’s phases of operation were not relevant to the observed parts’ deterioration, then the knowledge base module RUL table would have to be adjusted for operation phases relevant to part deterioration.
Since the subject expert system is focused on prognosing the RUL of a light aircraft structural part, expert knowledge includes the RUL for various flight conditions that could be encountered during operation. In the case study, the main landing gear leg RUL was calculated based on variable load parameters, such as load distribution, intensity, direction, and time variability. For this purpose, information on the permissible range of mass, distribution, acceleration, and flight nature can be deduced from the pilot operating handbook, the aircraft information manual [
21], or certification specification compliance documents issued by the EASA [
22]. For example, operational restrictions related to the structure’s mechanical integrity, such as the vertical acceleration needed to calculate the load acting on the landing gear structure, can be found in the aircraft flight manual [
21], usually in the limitations section. The aircraft observed in the case study has acceleration restrictions, as presented in
Table 3.
The extracted information on the permissible range of RUL-relevant parameters is required for the knowledge base as the basis for structure-specific RUL determination. The case study’s observed Cessna 172R had two sources of information for SRUL determination. The first information source was the allowable mass combinations considered in the knowledge acquisition module of this method. The total mass supported by the landing gear structure is determined from those combinations. The second source of information is the acceleration measurements taken by Juretić et al. [
23] on the same aircraft this research’s case study was performed on. The measurements used in the case study were validated by comparing them with statistical loads data obtained by Cicero et al. [
24].
3.3. The Inference Module
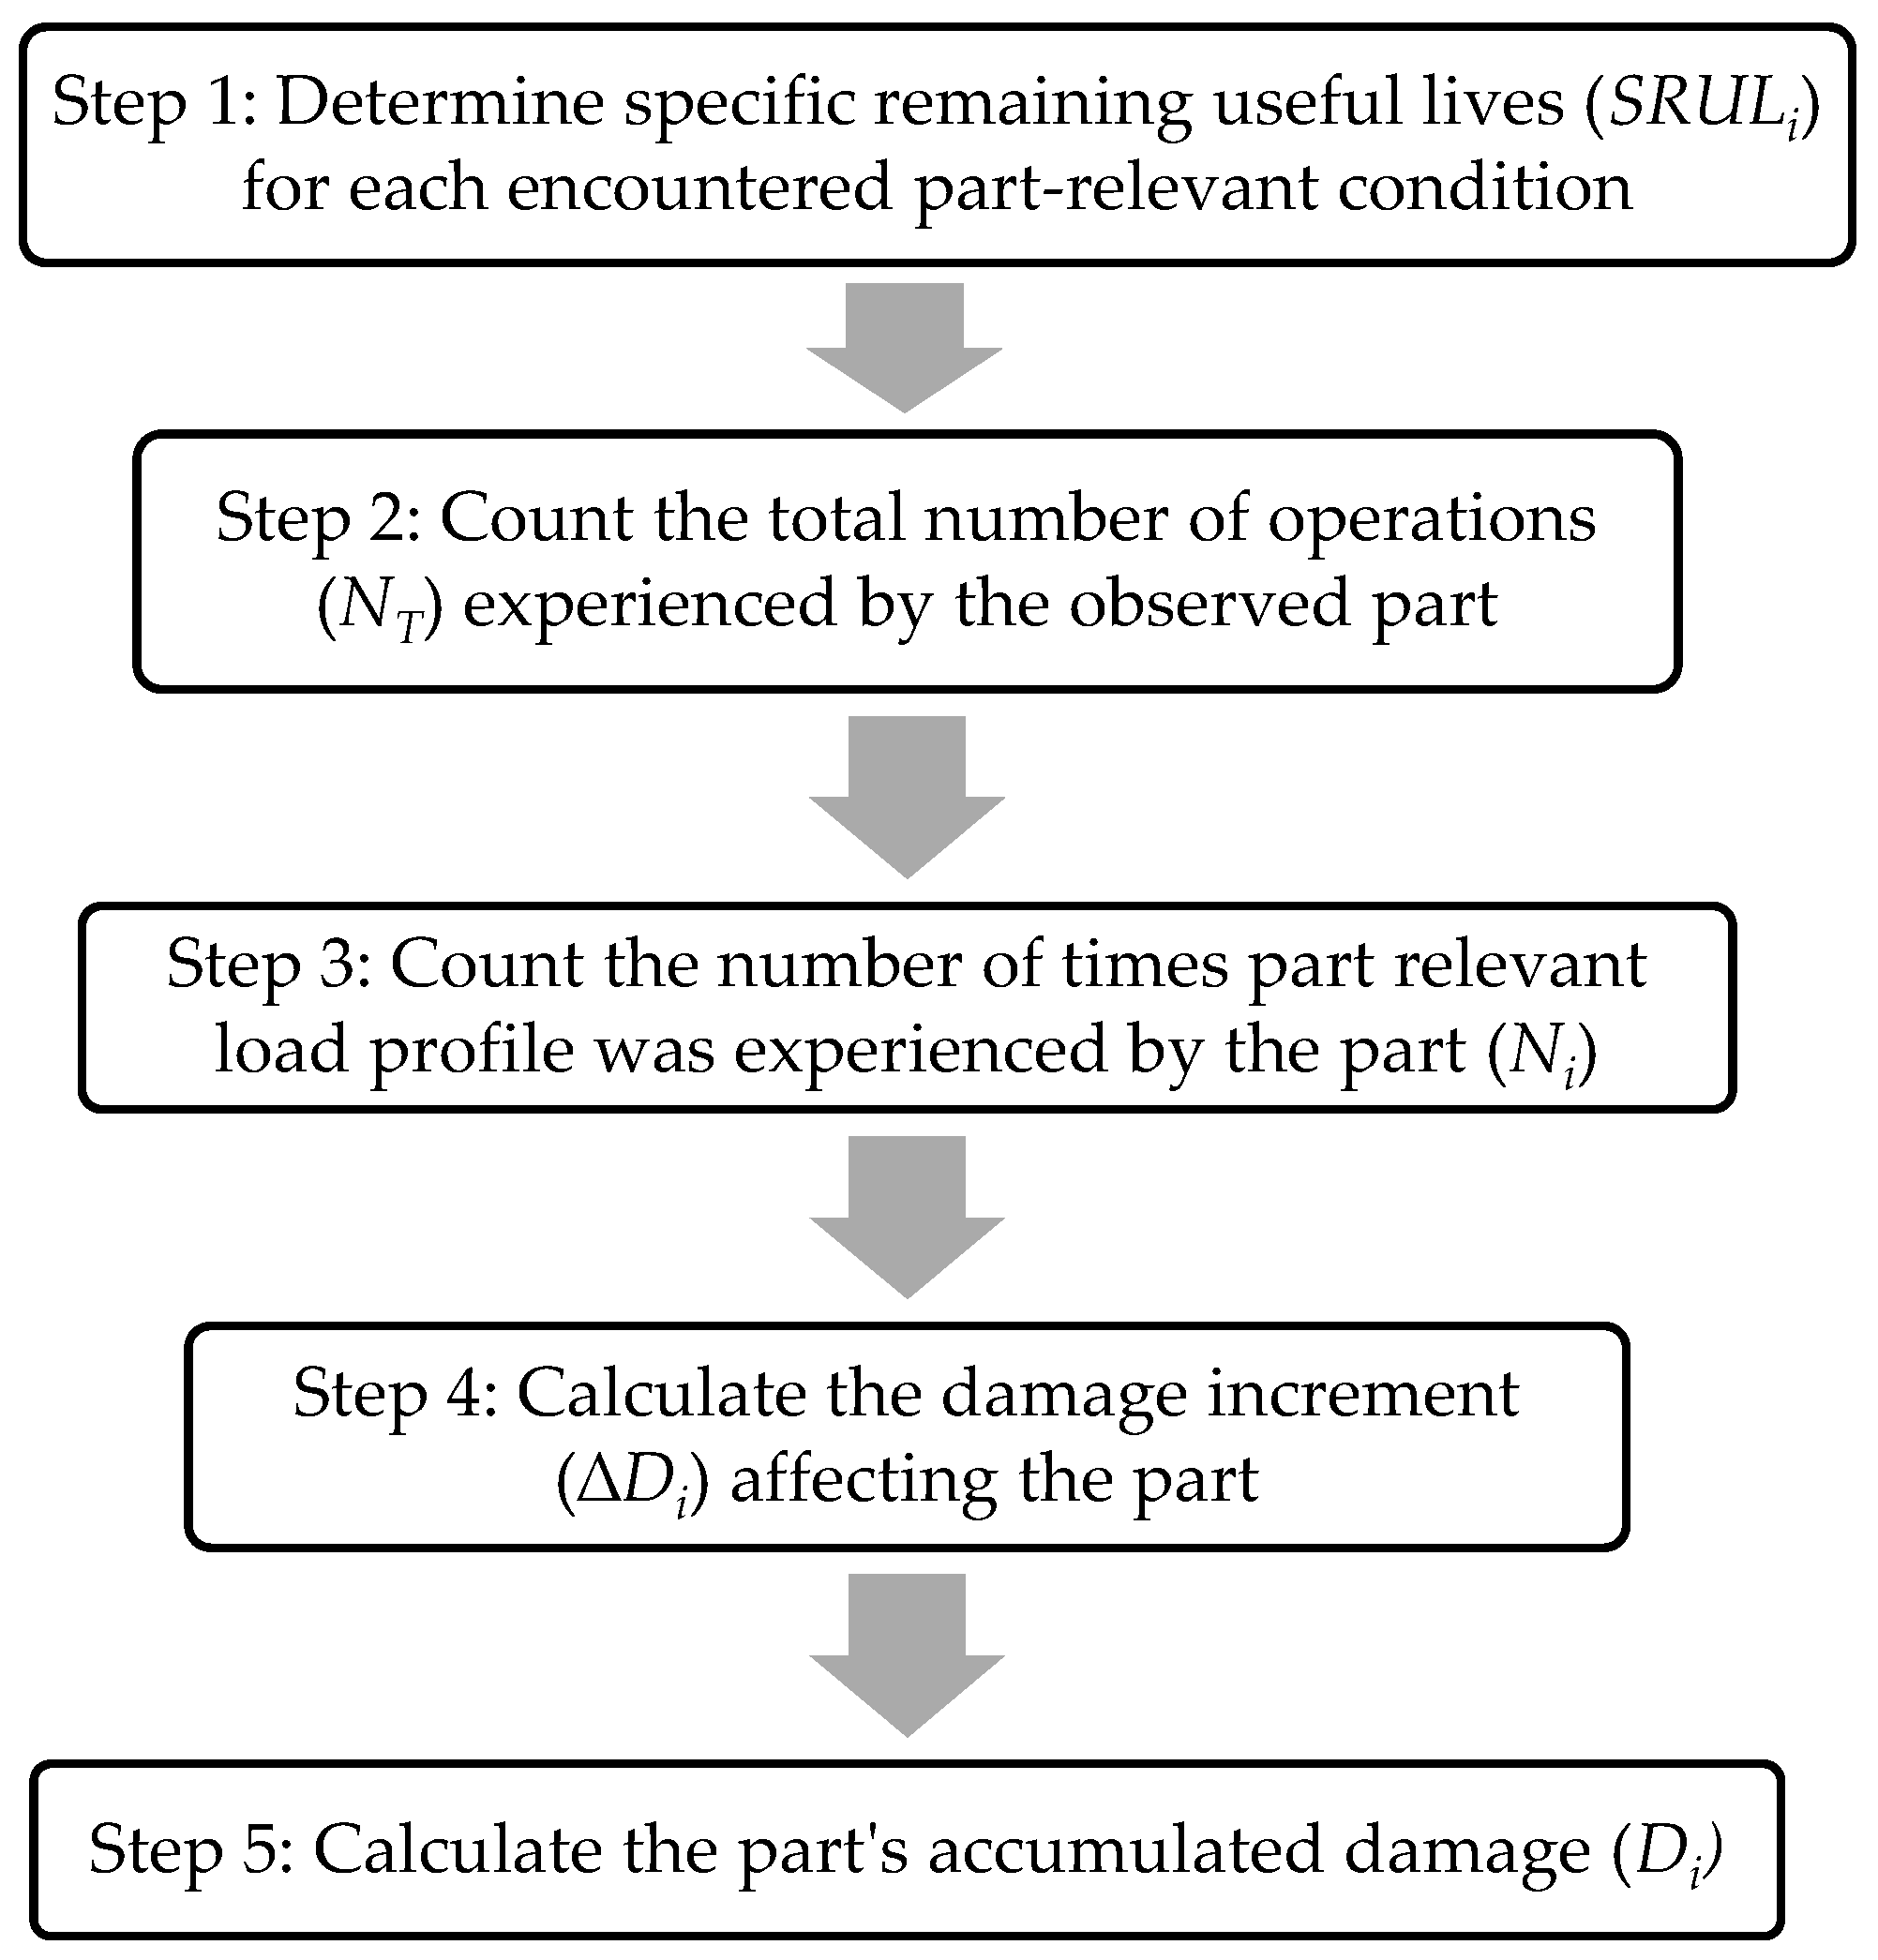
The purpose of the inference module is to calculate the accumulated fatigue damage of a light aircraft’s structural part based on input from the operator. This is achieved by extracting data from the knowledge acquisition table and linking it to the damage increment value determined and stored in the knowledge base. The accumulated fatigue damage is then calculated following the Palmgren-Miner cumulative damage rule. Accumulated fatigue damage represents the accumulated damage in the observed structural part regarding user input based on mass and balance information. Accumulated damage is a product of the damage increment, which results from fatigue damage accumulation due to the effect of one mass value and distribution scenario representing one single aircraft operation. After calculating several damage increments corresponding to several observed operations, the accumulated fatigue damage can be determined. The accumulated fatigue damage unit of measurement is dimensionless, varying between 0 (no useful life left) and 1 (100% of the useful life is available). For example, if the observed part can withstand 100,000 cycles at a given cyclic load before failing and has experienced 50,000 cycles at that cyclic load, then the accumulated fatigue damage would be 0.5. This is a direct application of the Palmgren-Miner rule, also known as Miner’s rule, which suggests that the damage accumulated in a structure due to cyclic stress is the sum of the fractional damages from each loading cycle. In this case, the observed part has already withstood half of its total tolerance for these load cycles, effectively using up half of its total life under these conditions. Therefore, its cumulative damage is 0.5 or 50%. According to Miner’s rule, the part is expected to fail when the cumulative damage reaches 1 (or 100%). This approach to calculating accumulated fatigue damage assumes that the damage fraction is proportional to the fraction of the total life consumed at a given cyclic loading. The described approach is linear, which means that it assumes that the accumulation of damage is linearly related to the number of observed parts relevant to load cycles. Lindström et al. [
25] discuss how the relationship between constant amplitude stress and fatigue life is statistically described by a lognormal distribution; it addresses the need to adjust the model to account for various sources of variability like material batch differences and surface conditions. It is important to note that the approach proposed in this paper for calculating accumulated fatigue damage is only an approximation and may not accurately predict the fatigue behavior of the observed aircraft structural part due to various operational circumstances that were not recorded, such as the impact of corrosive environments or undocumented damage due to various operational occurrences.
The inference module extracts damage increment values from the knowledge base based on information from the knowledge acquisition table by choosing the appropriate mass value and distribution according to user input in the operator input form (
Figure 2). The inference module stores the chosen damage increment for each input iteration. The damage increments calculate the accumulated fatigue damage in total (considering all input operations). The accumulated fatigue damage is calculated by adding up all calculated damage increments, according to Equation (2), where
i represents one of 141 mass value and distribution scenarios.
where:
is the accumulated fatigue damage for all observed mass value and distribution scenarios, [-];
is the damage increment for the i-th observed operation, [-].
The stated procedure is presented through a flowchart in
Figure 4.
The VBA code extracts the corresponding RUL from the knowledge base for the knowledge acquisition table test results and stores the information for total RUL calculation.
3.4. The Explanation Module
The purpose of the explanation module is to store information on required maintenance actions, i.e., the maintenance schedule of the observed part, and present this information depending on the calculated total RUL of the observed part. It does this by linking the accumulated damage value to the appropriate required maintenance action according to the aircraft’s maintenance manual or program. The aircraft’s maintenance program lists prescribed maintenance actions according to the observed parts’ operating hours or actual condition based on an inspection performed at predetermined intervals or after operational occurrences compromising structural integrity. The accumulated damage calculated with this method is a reciprocal value of the observed part’s RUL, considering recorded operational information input into the knowledge acquisition module. The prescribed maintenance actions are input into a Macro VBA function, linked to the “View required maintenance action” button displayed in
Figure 5, performing logical tests to determine and present the required maintenance action.
4. Case Study Results
The impact of aircraft system malfunctions on aviation accidents is a significant concern, as evidenced by the National Transportation Safety Board’s general aviation accident data from 2012 to 2021 [
26]. Notably, the landing gear system is implicated in nearly half (46.63%) of all system-related aviation incidents. While more complex landing gear systems consist of numerous elements vulnerable to malfunction, light aircraft, such as the Cessna 172, have simple landing gear systems where the main landing gear leg performs multiple essential tasks. It enables aircraft taxi, take-off, and landing; acts as the primary shock absorber; and attaches the wheel and braking system to the aircraft’s fuselage. Campbell and Lahey [
16] stated that material fatigue is the primary cause of landing gear metal structural part failure.
This chapter details the outcomes of two fatigue life analyses and one von Mises stress analysis performed on the Cessna 172R’s main landing gear leg. These are a subset of the extensive results from a case study conducted to evaluate and confirm the methodology proposed in this paper. There are several reasons why the Cessna 172R aircraft has been chosen for the case study, the first ones being convenience and data availability since the Faculty of Transport and Traffic Sciences possesses two Cessna 172N and one Cessna 172R aircraft. Additionally, the Cessna 172 models are representative light aircraft based on their commonality, being amongst the most produced aircraft of all time with plenty of relevant data, such as [
24]. The two displayed fatigue life analysis results are knowledge base SRULs used in conjunction with other SRULs, corresponding to operator mass value and distribution input and enabling the expert system to determine observed part RUL for various recorded operating conditions. Every SRUL is the RUL of main landing gear leg under specific load profile defined by its intensity, orientation, direction, and time variability. The case study’s SRULs and von Mises stress distribution were determined through numerical strength calculation in Ansys workbench 2023 R1. The results observed in this chapter correspond to load scenarios where mass value and distribution led to one of the lowest and one of the highest numbers of operations before the calculated fatigue failure was imminent. The purpose of choosing those two extremes was to highlight the differences in the observed part’s RUL depending on operating conditions, thereby emphasizing the main problem in light aircraft structural maintenance—neglecting various operating conditions in maintenance decision making.
The stress and fatigue life of the aircraft parts discussed in this chapter are influenced by three main factors: the proportion of the aircraft’s mass that affects the component under study, the aircraft’s acceleration along the direction of the applied force, and the alignment and direction of that force. Mass relevant to the observed leg was calculated for various mass value and distribution scenarios. The accuracy of the calculated masses was confirmed by cross-referencing with actual aircraft mass records. Mass variability during operation was neglected, based on the presumption that the airplane mass does not change significantly during flight, apart from fuel mass changing due to fuel consumption. Acceleration measurements were taken on the same airplane, being part of the research [
23]. The variations in these acceleration measurements reflect different operational conditions and load intensities. Since the acceleration sample was taken during one flight, the values were compared with a substantial measurement sample [
24] to verify that the recorded acceleration values were within a reasonable range. To establish the load vector’s orientation and direction, taxi, take-off, flight, and landing operational phases were considered since each phase exerts unique forces on the aircraft parts. For each phase, the average direction and orientation of the load were identified. Since the existing maintenance standards for light aircraft landing gear legs do not consider actual operating conditions, even average load directions and orientations enabled an improvement in the understanding of the observed part’s RUL.
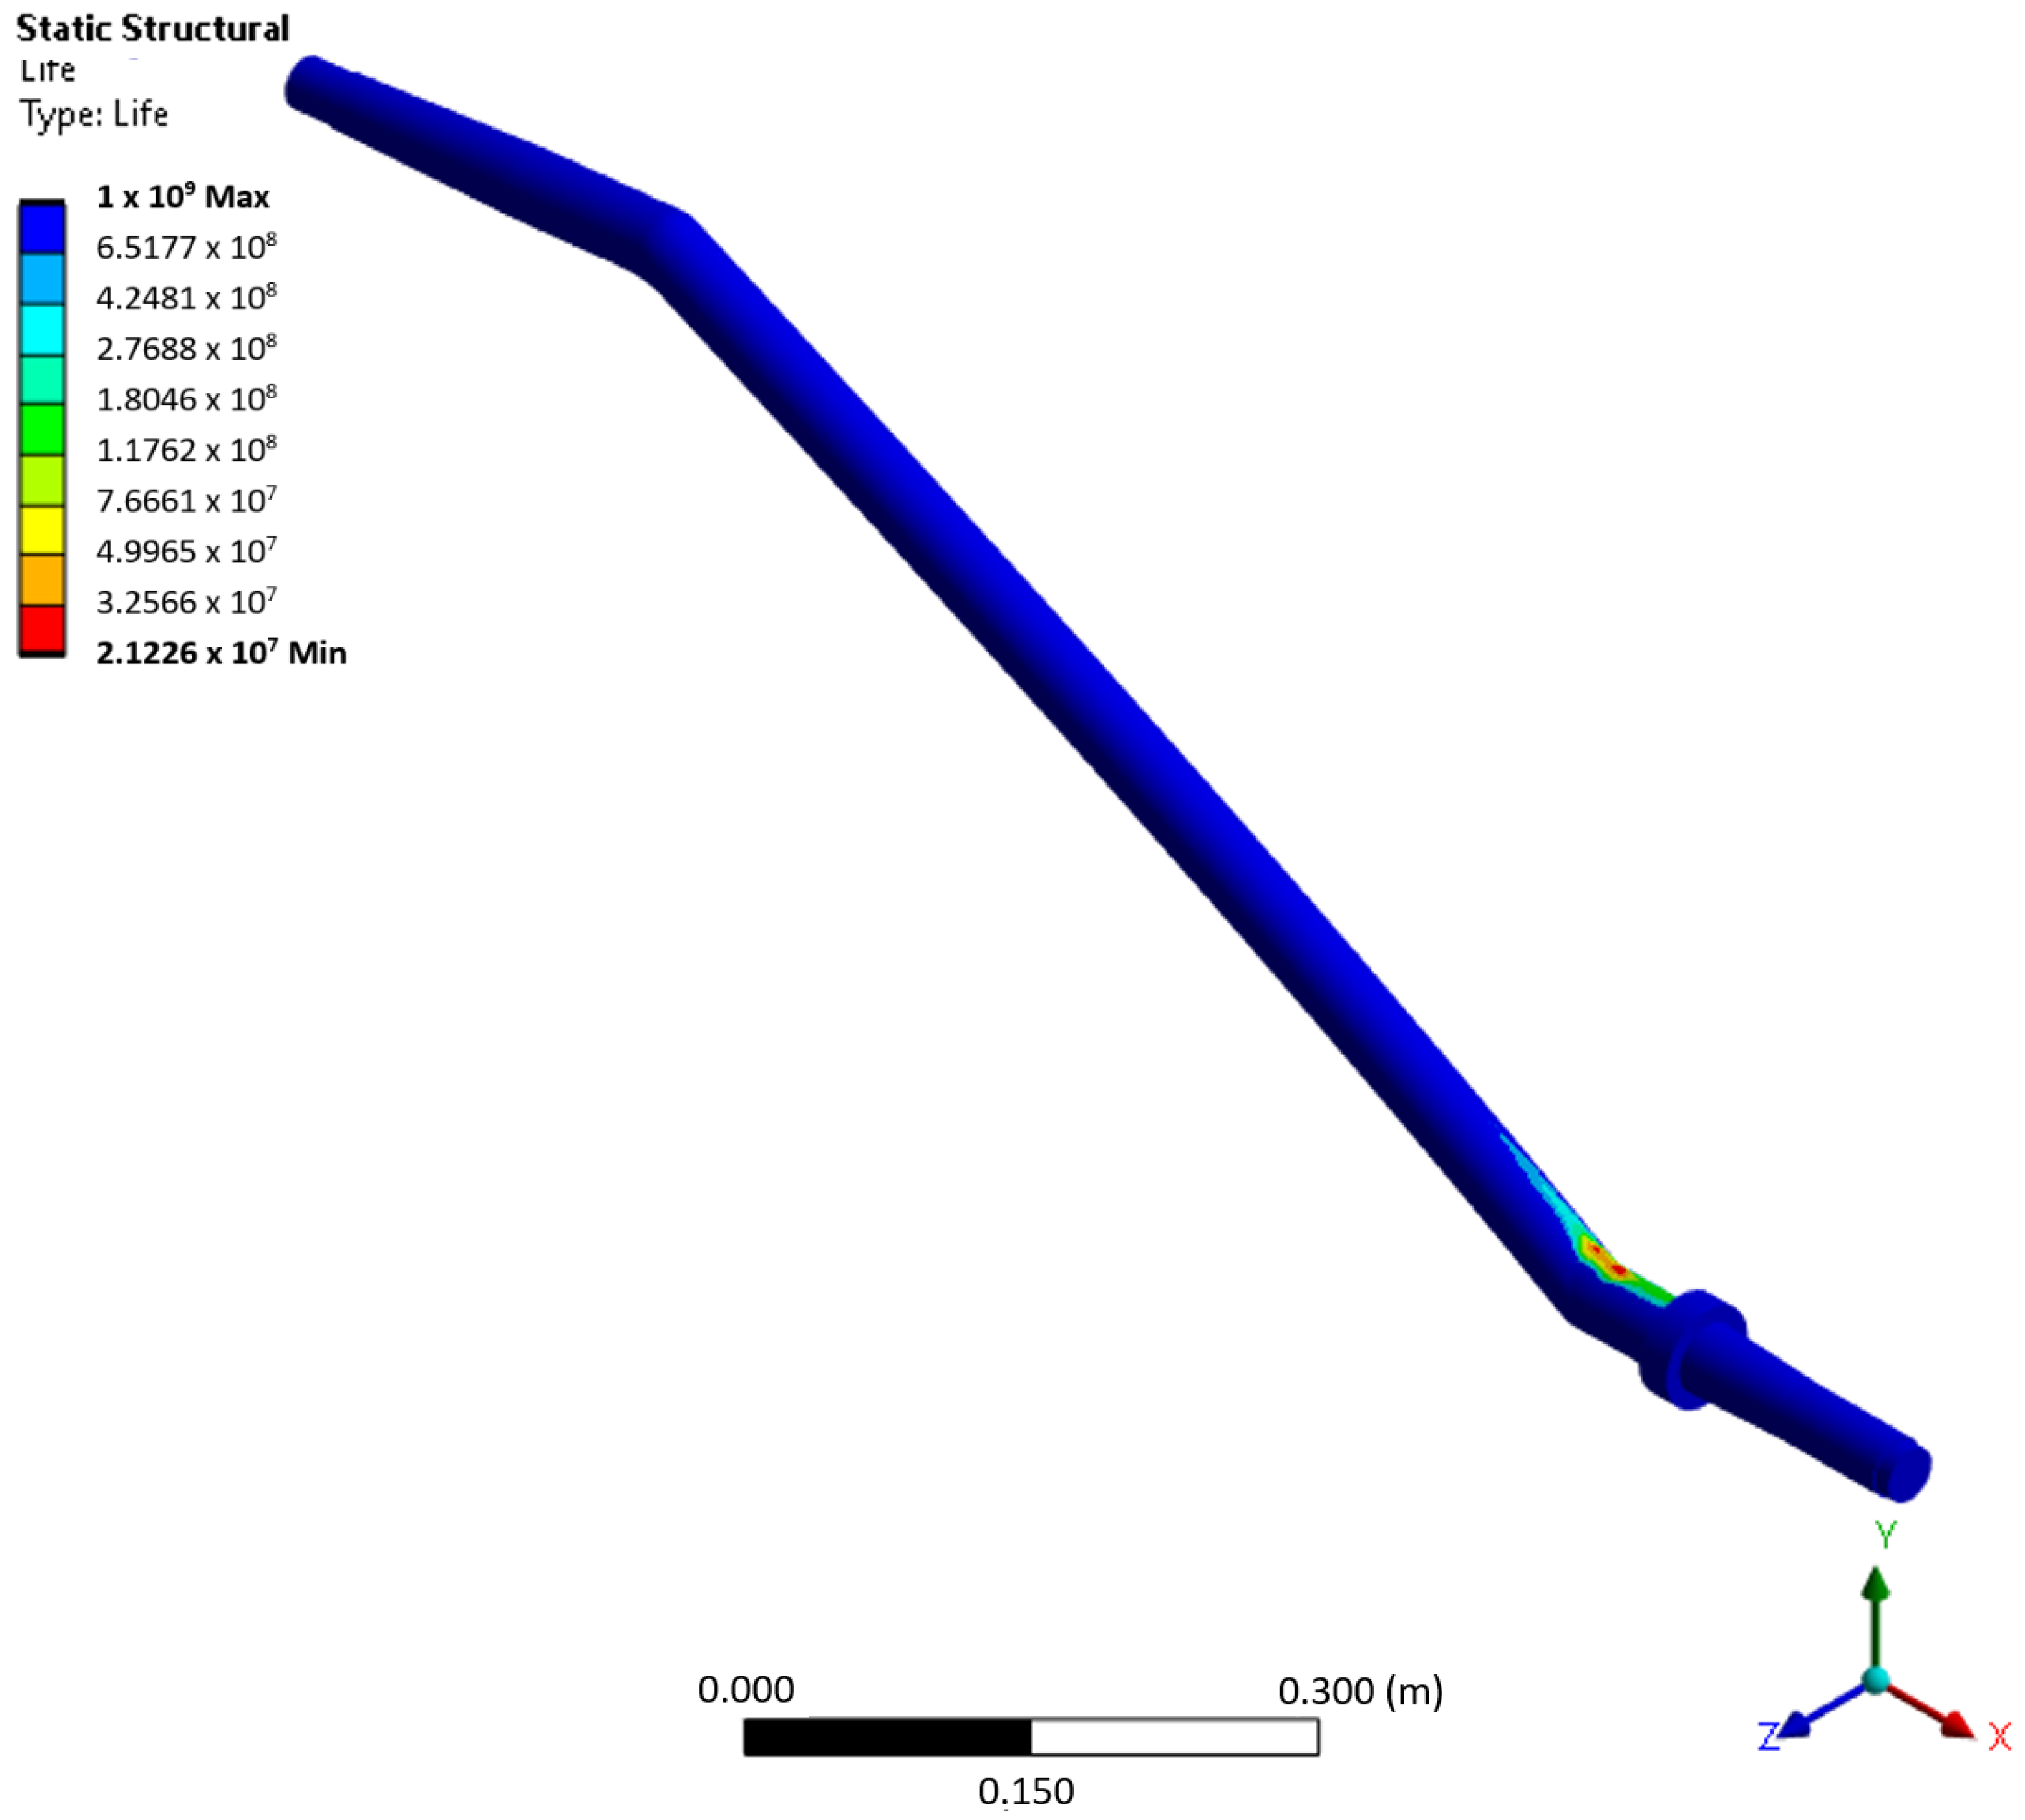
Fatigue life analysis results were first observed for the last phase of operation, namely, the return of the aircraft from the landing strip after landing. This corresponds to a mass value and distribution scenario consisting of 31 kg of fuel in the fuel tanks and 65 kg in the front-row crew seats.
Figure 6 shows the distribution of RUL, having a minimum in the expected location of the observed geometry based on aircraft production and maintenance experience, literature research, and stress analysis results observed later in this chapter. Note that the leg part with the minimum RUL is close to the leg’s fixed attachment position to the aircraft’s fuselage. The material and mechanical properties relevant to strain life curves used to determine the observed landing gear leg RUL made from a 6150 steel alloy, also referred to as the 51CrV4 steel alloy, were determined through rigorous literature research. This involved a review of academic journals, industry publications, and technical reports [
27,
28,
29,
30,
31,
32,
33,
34], leading to the identification of key material fatigue-relevant properties. The properties of this alloy include a density of 7850 kg/m
3, Young’s modulus of 2.038 × 10
11 Pa, Poisson’s ratio of 0.29, strength coefficient of 1.1 × 10
9 Pa, strength exponent of −0.093, ductility coefficient of 0.478, ductility exponent of −0.684, cyclic strength coefficient of 1.476 × 10
9 Pa, cyclic strain hardening exponent of 0.0651, tensile and compressive yield strength of 1.042 × 10
9 Pa, and tensile ultimate strength of 1.2773 × 10
9 Pa. Program-controlled element order and adaptive element sizing, with a maximum element size of 1.4 × 10
−2 m, have culminated in an acceptable RUL regarding prediction expectancy based on the recorded number of airplane landings in the airplane technical logbook.
Figure 6 shows the number of load cycles the observed leg can endure (21,226,000) before experiencing fatigue failure under the specified conditions. This finding suggests that the component is capable of performing well beyond the designed operational lifespan of the aircraft. At the time of writing, the aircraft in question had completed approximately 20,000 operational cycles, implying that the part in question has the potential to withstand up to 1000 times more cycles than it has already endured without failing due to fatigue. This research provides strong evidence that the main landing gear leg design for the Cessna 172R is robust, with a fatigue life that exceeds typical usage expectations.
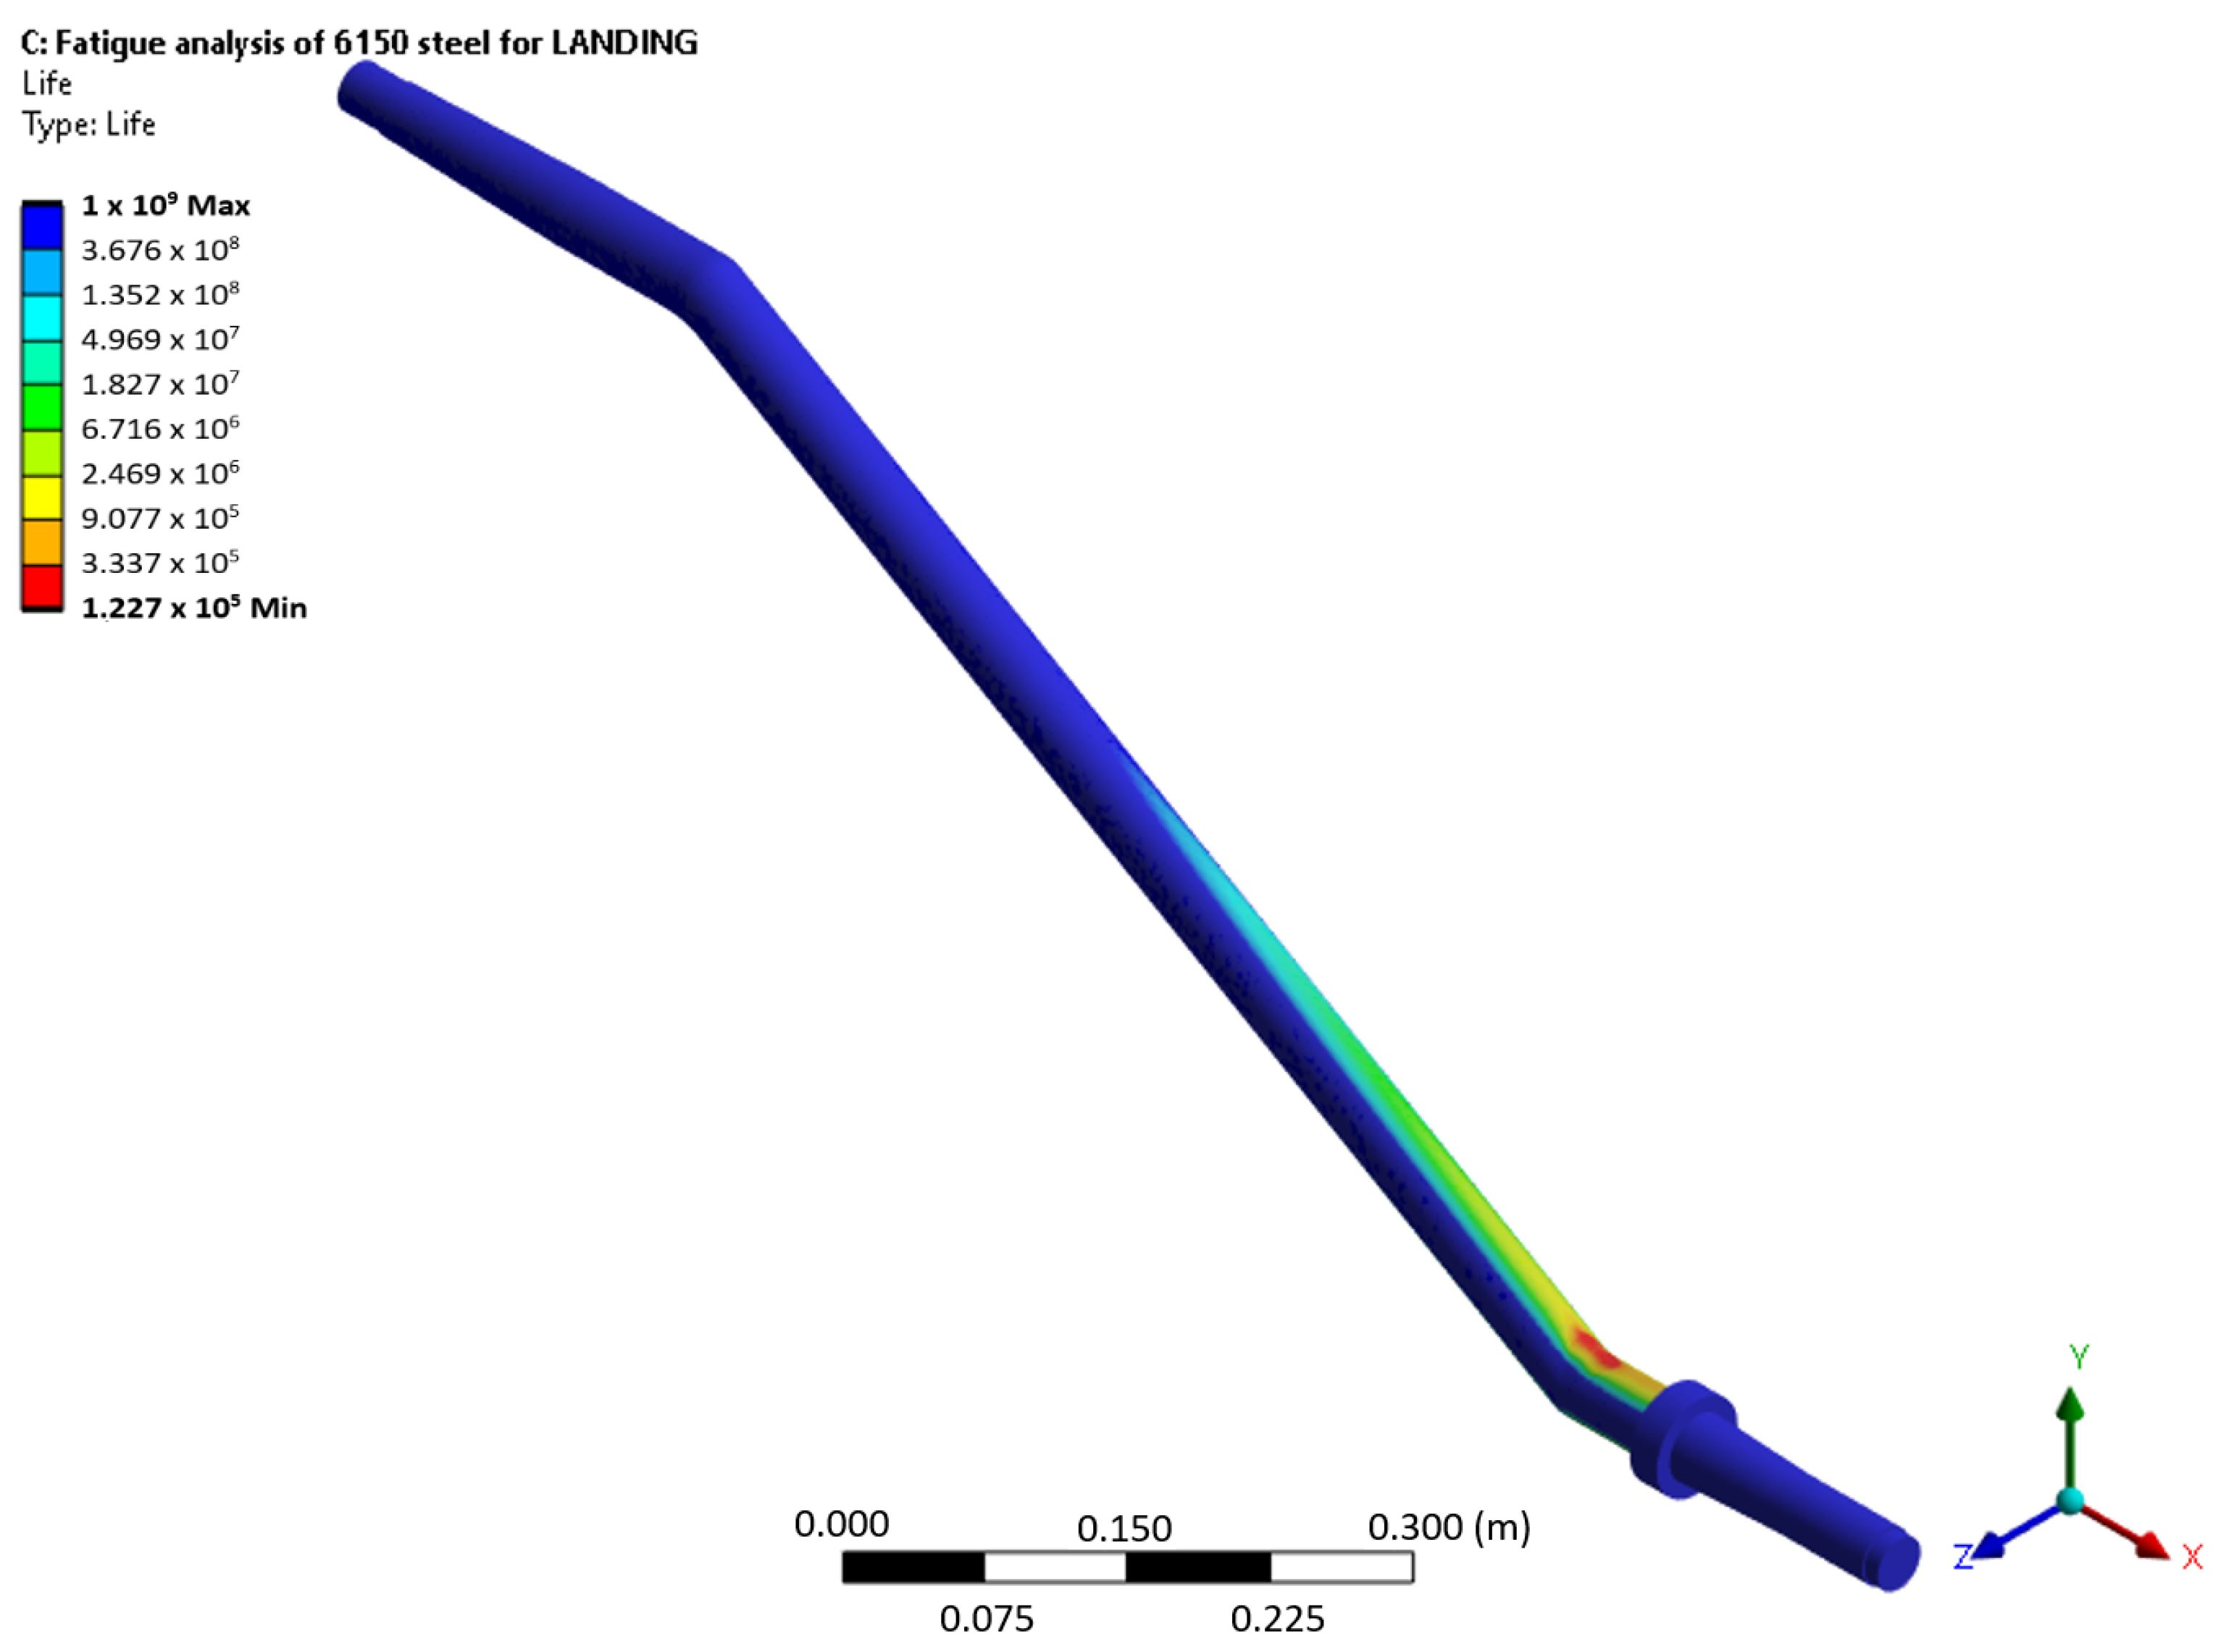
The second observed operation phase (
Figure 7) corresponds to the mass value and distribution scenario of 31 kg of fuel in the aircraft’s fuel tanks, 207 kg in the front-row crew seats, 75 kg in the rear passenger seats, and 27 and 11 kg in the aircraft’s Baggage Areas 1 and 2. This mass distribution scenario resulted in the lowest number of operations until fatigue failure, corresponding to the landing phase of the operation.
The data presented in
Figure 7 indicate that the main landing gear leg of the aircraft can sustain 122,700 landings until fatigue failure for the given mass value and mass distribution conditions. The significant difference between the two scenarios indicates that the landing gear’s fatigue life on the Cessna 172R is greatly affected by the mass and its distribution, with possible variations of up to 173 times.
In addition to the fatigue life projection in
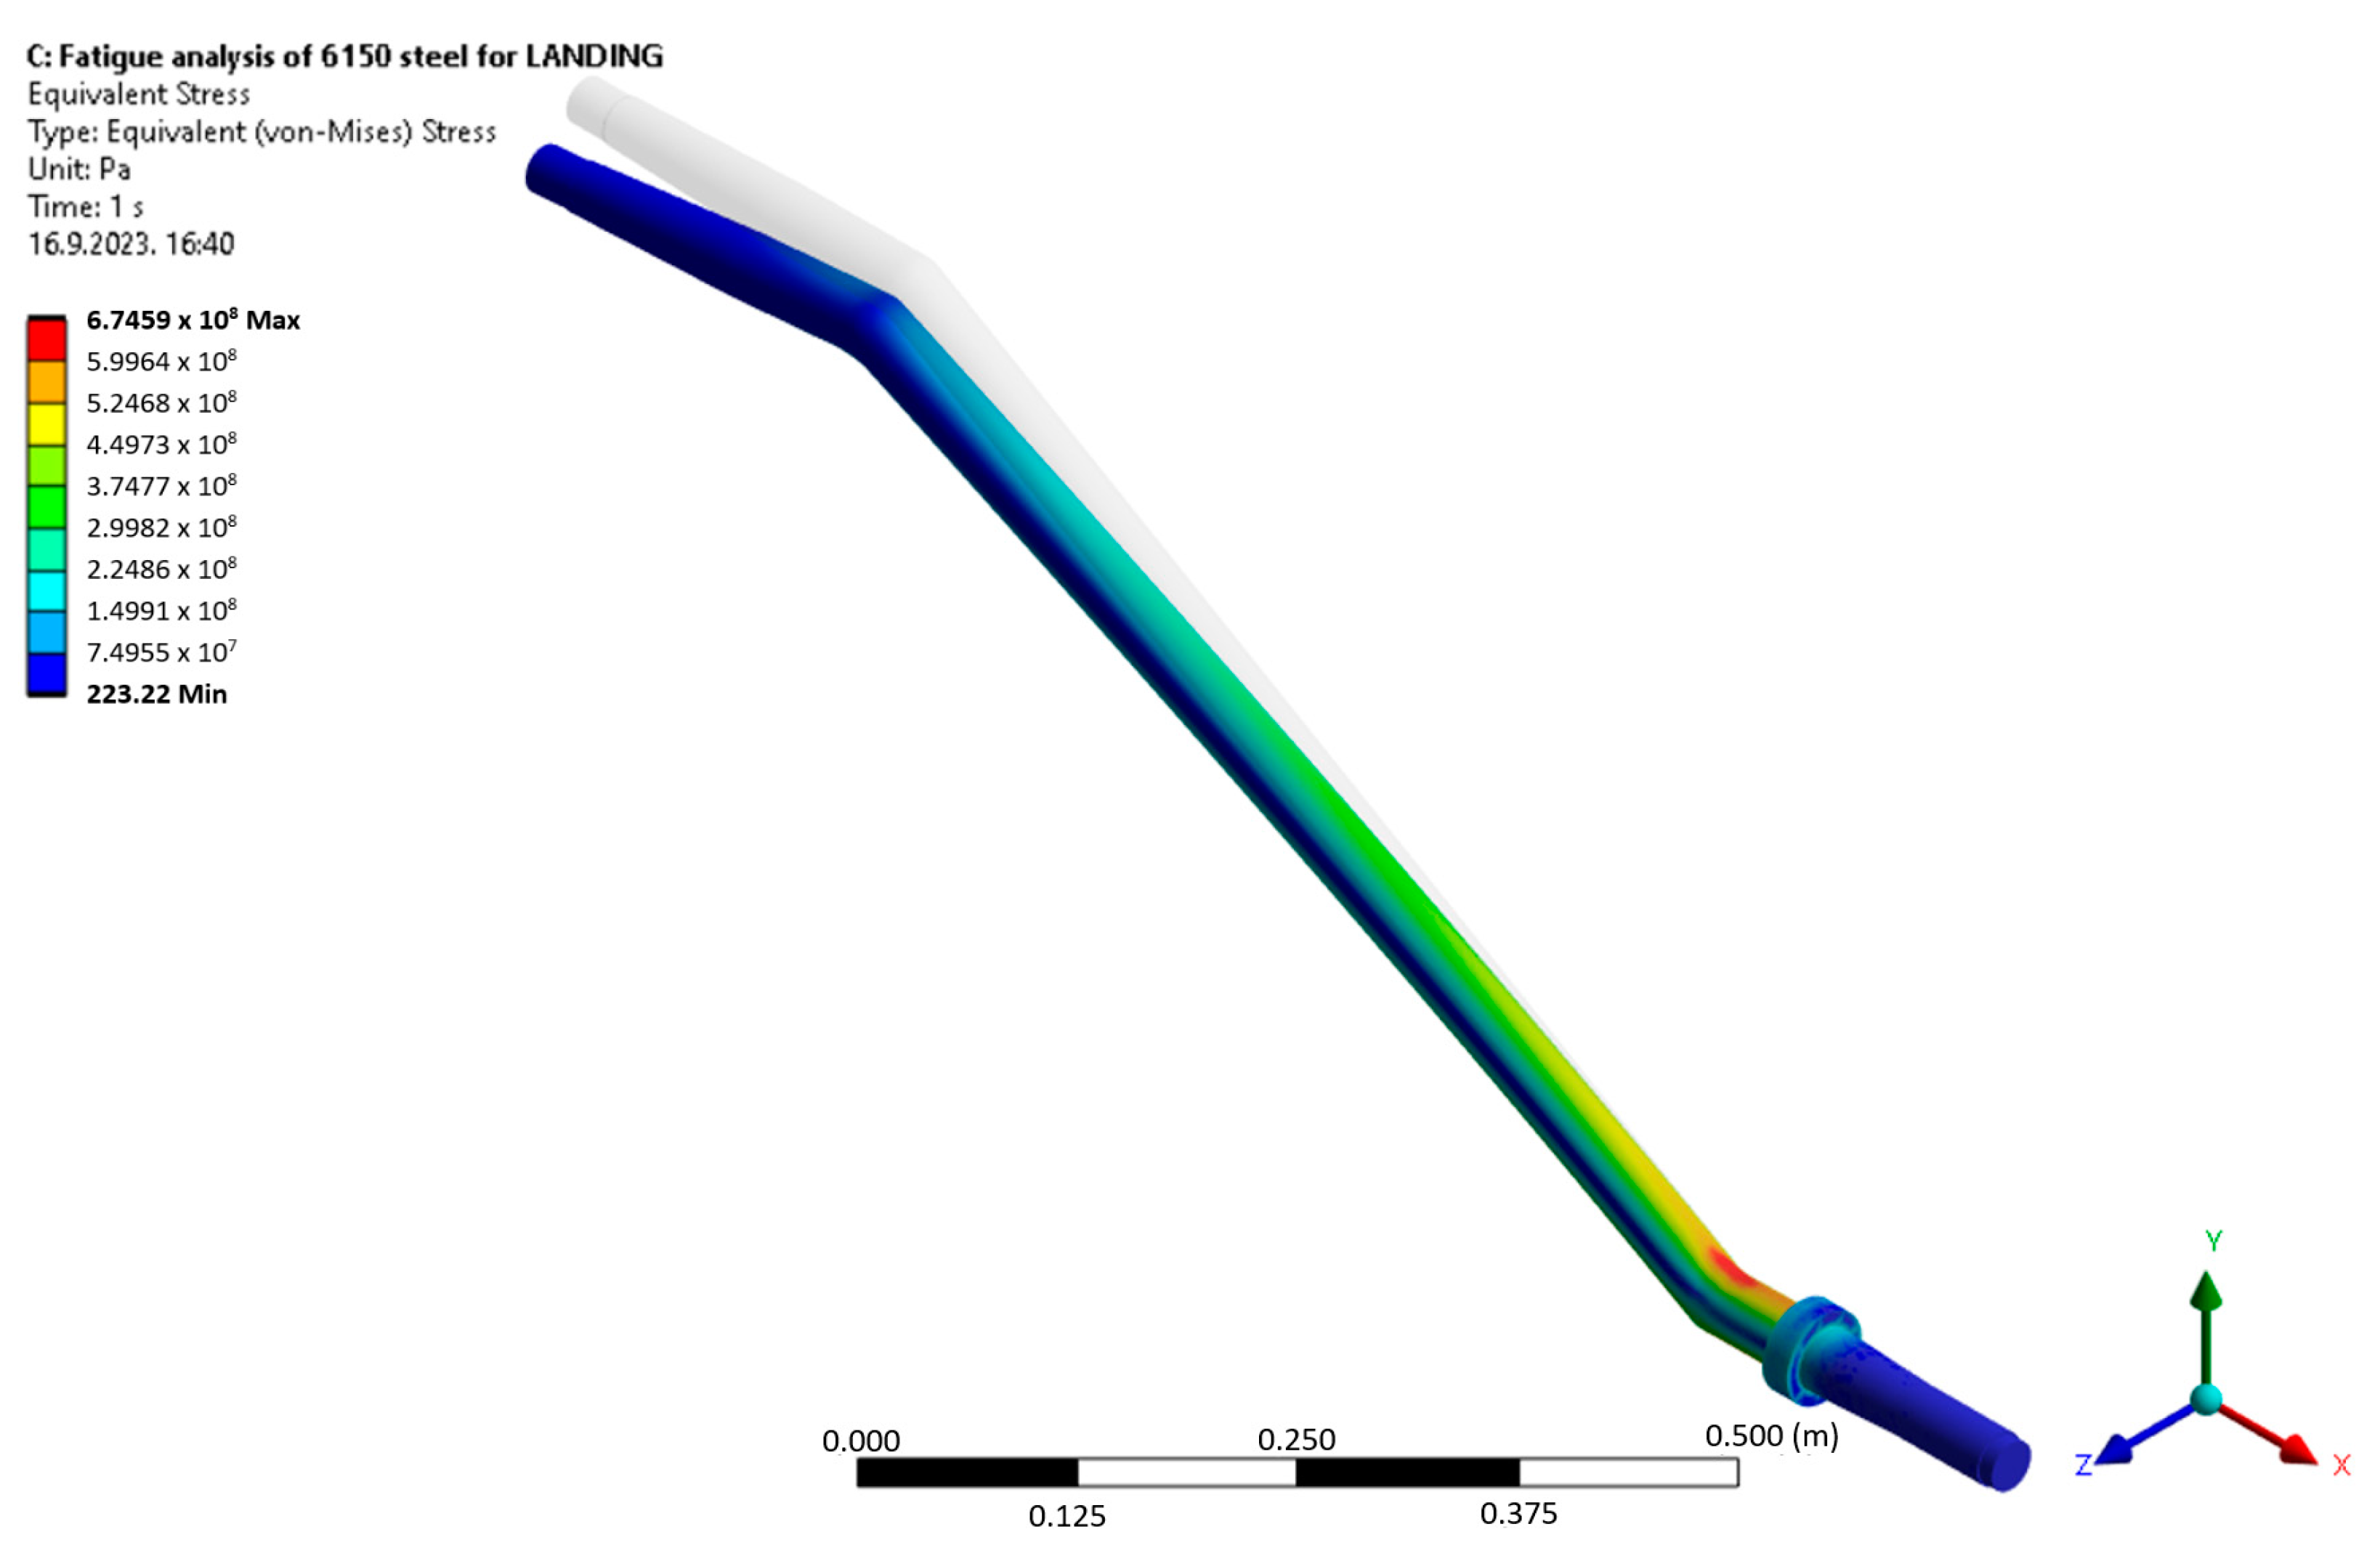
Figure 7, a stress analysis was conducted to visualize the stress distribution on the Cessna 172R main landing gear leg under the loading conditions of the second scenario.
Figure 8 illustrates the stress distribution that occurs during the critical landing phase. The results reveal the area of the highest stress concentration overlaps with the location of the minimum RUL identified in
Figure 7.
The maximum von Mises stress (6.7459 × 10⁸ Pa) was compared to the materials’ yield strength (1.042 × 10⁹ Pa). The comparison provided assurance that, under the observed conditions, the leg’s structural integrity was maintained without permanent deformation, as it should be considering the leg’s fatigue failure history and the fact that the applied loads are still within operational boundaries.
This chapter observed a method case study focusing on the Cessna 172R’s main landing gear leg. The focus was justified by the high incidence of landing-gear-system-related aviation accidents. The importance of accounting for variable operating conditions in light aircraft landing gear system maintenance was highlighted by demonstrating significant discrepancies in landing gear RUL based on different load scenarios, directly impacting maintenance planning. The expert system used in this case study can be used to prognose the RUL of the main landing gear leg for any Cessna 172R if the mass value and mass distribution data are available.
5. Conclusions
In this paper, an expert system for predicting the RUL of light aircraft structural parts was introduced. A case study of the Cessna 172R main landing gear leg served to demonstrate the method. This approach significantly diverges from traditional maintenance practices, which typically involve reactive maintenance or scheduled part replacements. Instead, it predicts structural part RUL by using maintenance and operational data.
The case study revealed that operational conditions could vary RUL by up to 173 times. This study successfully identified the probable locations of fatigue failures, confirming expectations based on maintenance history and engineering judgment. The landing gear structural integrity during landing was assessed for the maximum aircraft take-off mass. This assessment involved comparing the maximum von Mises stress with the material’s yield strength, ensuring that permanent deformation remains unlikely under operational load conditions.
These insights emphasized the necessity for maintenance planning that accounts for individual aircraft operating conditions. The proposed method challenges standard light aircraft maintenance approaches, which usually overlook the impact of variable operating conditions on structural part RUL. Implementing the proposed method could significantly reduce the incidence of landing gear system failures, which represent nearly half of all aircraft system malfunctions. The proposed method can be applied to any light aircraft structural part, provided the knowledge engineer can determine the SRULs for the knowledge base module RUL table and the mechanism of damage accumulation is linear in nature.
However, the method has its limitations. The accuracy of our predictions depends on the completeness and quality of the available maintenance and operation records. The method assumes a linear accumulation of damage due to fatigue, which may oversimplify the actual complex behavior of the materials under stress. Furthermore, it does not consider other forms of deterioration, such as corrosion or impact damage, which also influence RUL.
Light aircraft maintenance standards prescribe regular checks for damage and corrosion on landing gear parts, mitigating some risks of failure and highlighting fatigue-related failure. Future research could explore ways to improve the data quality and availability, incorporate nonlinear damage models, and account for other deterioration factors in the RUL prediction of light aircraft structural parts.
