1. Introduction
According to the International Energy Agency (IEA), over the next three decades, the use of air conditioners (ACs) is set to soar, becoming one of the top drivers of global electricity demand [
1]. Global energy demand from ACs is expected to triple from around 2000 terrawatt-hours (TWh) today to 6200 TWh by 2050, adding the equivalent electrical capacity of the United States (U.S.), European Union (EU) and Japan combined. Between 2015 and 2018 alone, AC consumption in the world’s most 20 prosperous nations increased by around 400 TWh [
2]. The IEA has identified this growing demand for air conditioners as one of the most critical blind spots in today’s energy debate [
1].
The U.S. National Oceanic and Atmospheric Administration (NOAA) recently reported that Earth’s average temperature in July 2019 was about 1 degree Celsius (°C) above its twentieth-century average, making it the warmest month on record. The previous five years were also the five warmest on record. Every 1 °C rise in the Earth’s average temperature is estimated to increase AC electrical consumption by around 15% [
2]. In developing countries, this rate of growth is expected to be greater, as higher incomes allow more consumers to purchase AC units.
The focus of the climate policy community is often on average global temperature changes, such as the 1.5 °C or 2 °C target, which can lead to an underappreciation of local warming trends, especially in summer. For example, The European Centre for Medium-Range Weather Forecasts’ (ECMWF’s) dataset shows that areas in the Middle East and North Africa (MENA) region have already experienced average warming greater than 2 °C for July. It also shows that, in the last 10 years, regions in Australia, Africa, Europe and the Americas have experienced average July temperatures of between 1 °C to 2 °C higher than those from 1880–1900 [
3].
In the Middle East and many other regions, average summer temperatures are also rising faster than yearly averages, which may lead to an underappreciation of the maximum temperatures that may be experienced in hotter months. Local trends in temperature rises in the hottest months of the year are likely to be more meaningful when planning for weather extremes locally than global or even local yearly averages. This highlights the need for research that explores warming trends at the city or regional level and the implications this has for AC as an adaptation measure to maximum summer temperatures.
Three main factors drive the use of AC and its impact on electricity consumption: the area and number of rooms in a dwelling to be cooled, the thermostat or temperature setting and the number of hours the AC is used. The amount of cooling demanded is thus a function of temperature, AC unit efficiency, and other factors such as size and type of dwelling and subjective perceptions of comfort.
Families in Saudi Arabia tend to live in relatively large villas with many AC units. Studies suggest that around 73% of people in the Kingdom use their air conditioners between 10 and 24 h a day throughout the year, with most people leaving them on non-stop from May through to September to counter the extremely hot summer conditions [
4,
5].
This paper provides a case study of how Saudi Arabia is managing the twin demands of adaptation to a hot and warming climate while grappling with the increasing demand for electricity from AC units and their associated carbon dioxide (CO2) emissions. It also seeks to provide insight on how Saudi Arabia can improve the sustainability of its AC use.
The paper uses the latest ECMWF ERA5 high-resolution dataset [
6] to illustrate the climatic warming trend for Saudi Arabia over a 40 year period. The seasonal relationship between temperature and electrical generation within a typical year (2015) is then assessed using hourly electricity generation data provided by the Saudi Electricity Company (SEC). Next, annual data on the contribution of cooling to electricity demand is used to explore trends in electrical consumption. The electricity CO
2 profile is then analyzed using fuel input data. This provides the basis for an assessment of the policies that have been introduced in the last few years to improve sustainability and control the historically fast growth of CO
2 emissions from the power sector and AC demand.
This paper is set out in three parts. The first covers the literature and basic characteristics of temperature, AC and the sustainability of electricity demand in Saudi Arabia. This includes a review of the key measures the Kingdom has recently taken to control its historically fast-growing electricity demand, focusing on AC energy efficiency, electricity price increases and fuel mix decarbonization. To our knowledge, this study provides one of the first assessments of electricity and AC trends since this reform program significantly gathered pace in 2016.
The second section is an empirical analysis covering (1) climatic warming trends over the last 40 years; (2) the relationship between temperature and electricity generation within a typical year; (3) trends in the contribution of AC to electricity demand; and (4) shifts in the fuel mix of electricity demand and associated CO
2 emissions. Our results suggest that AC energy efficiency, higher consumer electricity prices and fuel mix changes have contributed to a stabilization of the historically rapid growth in electricity demand and CO
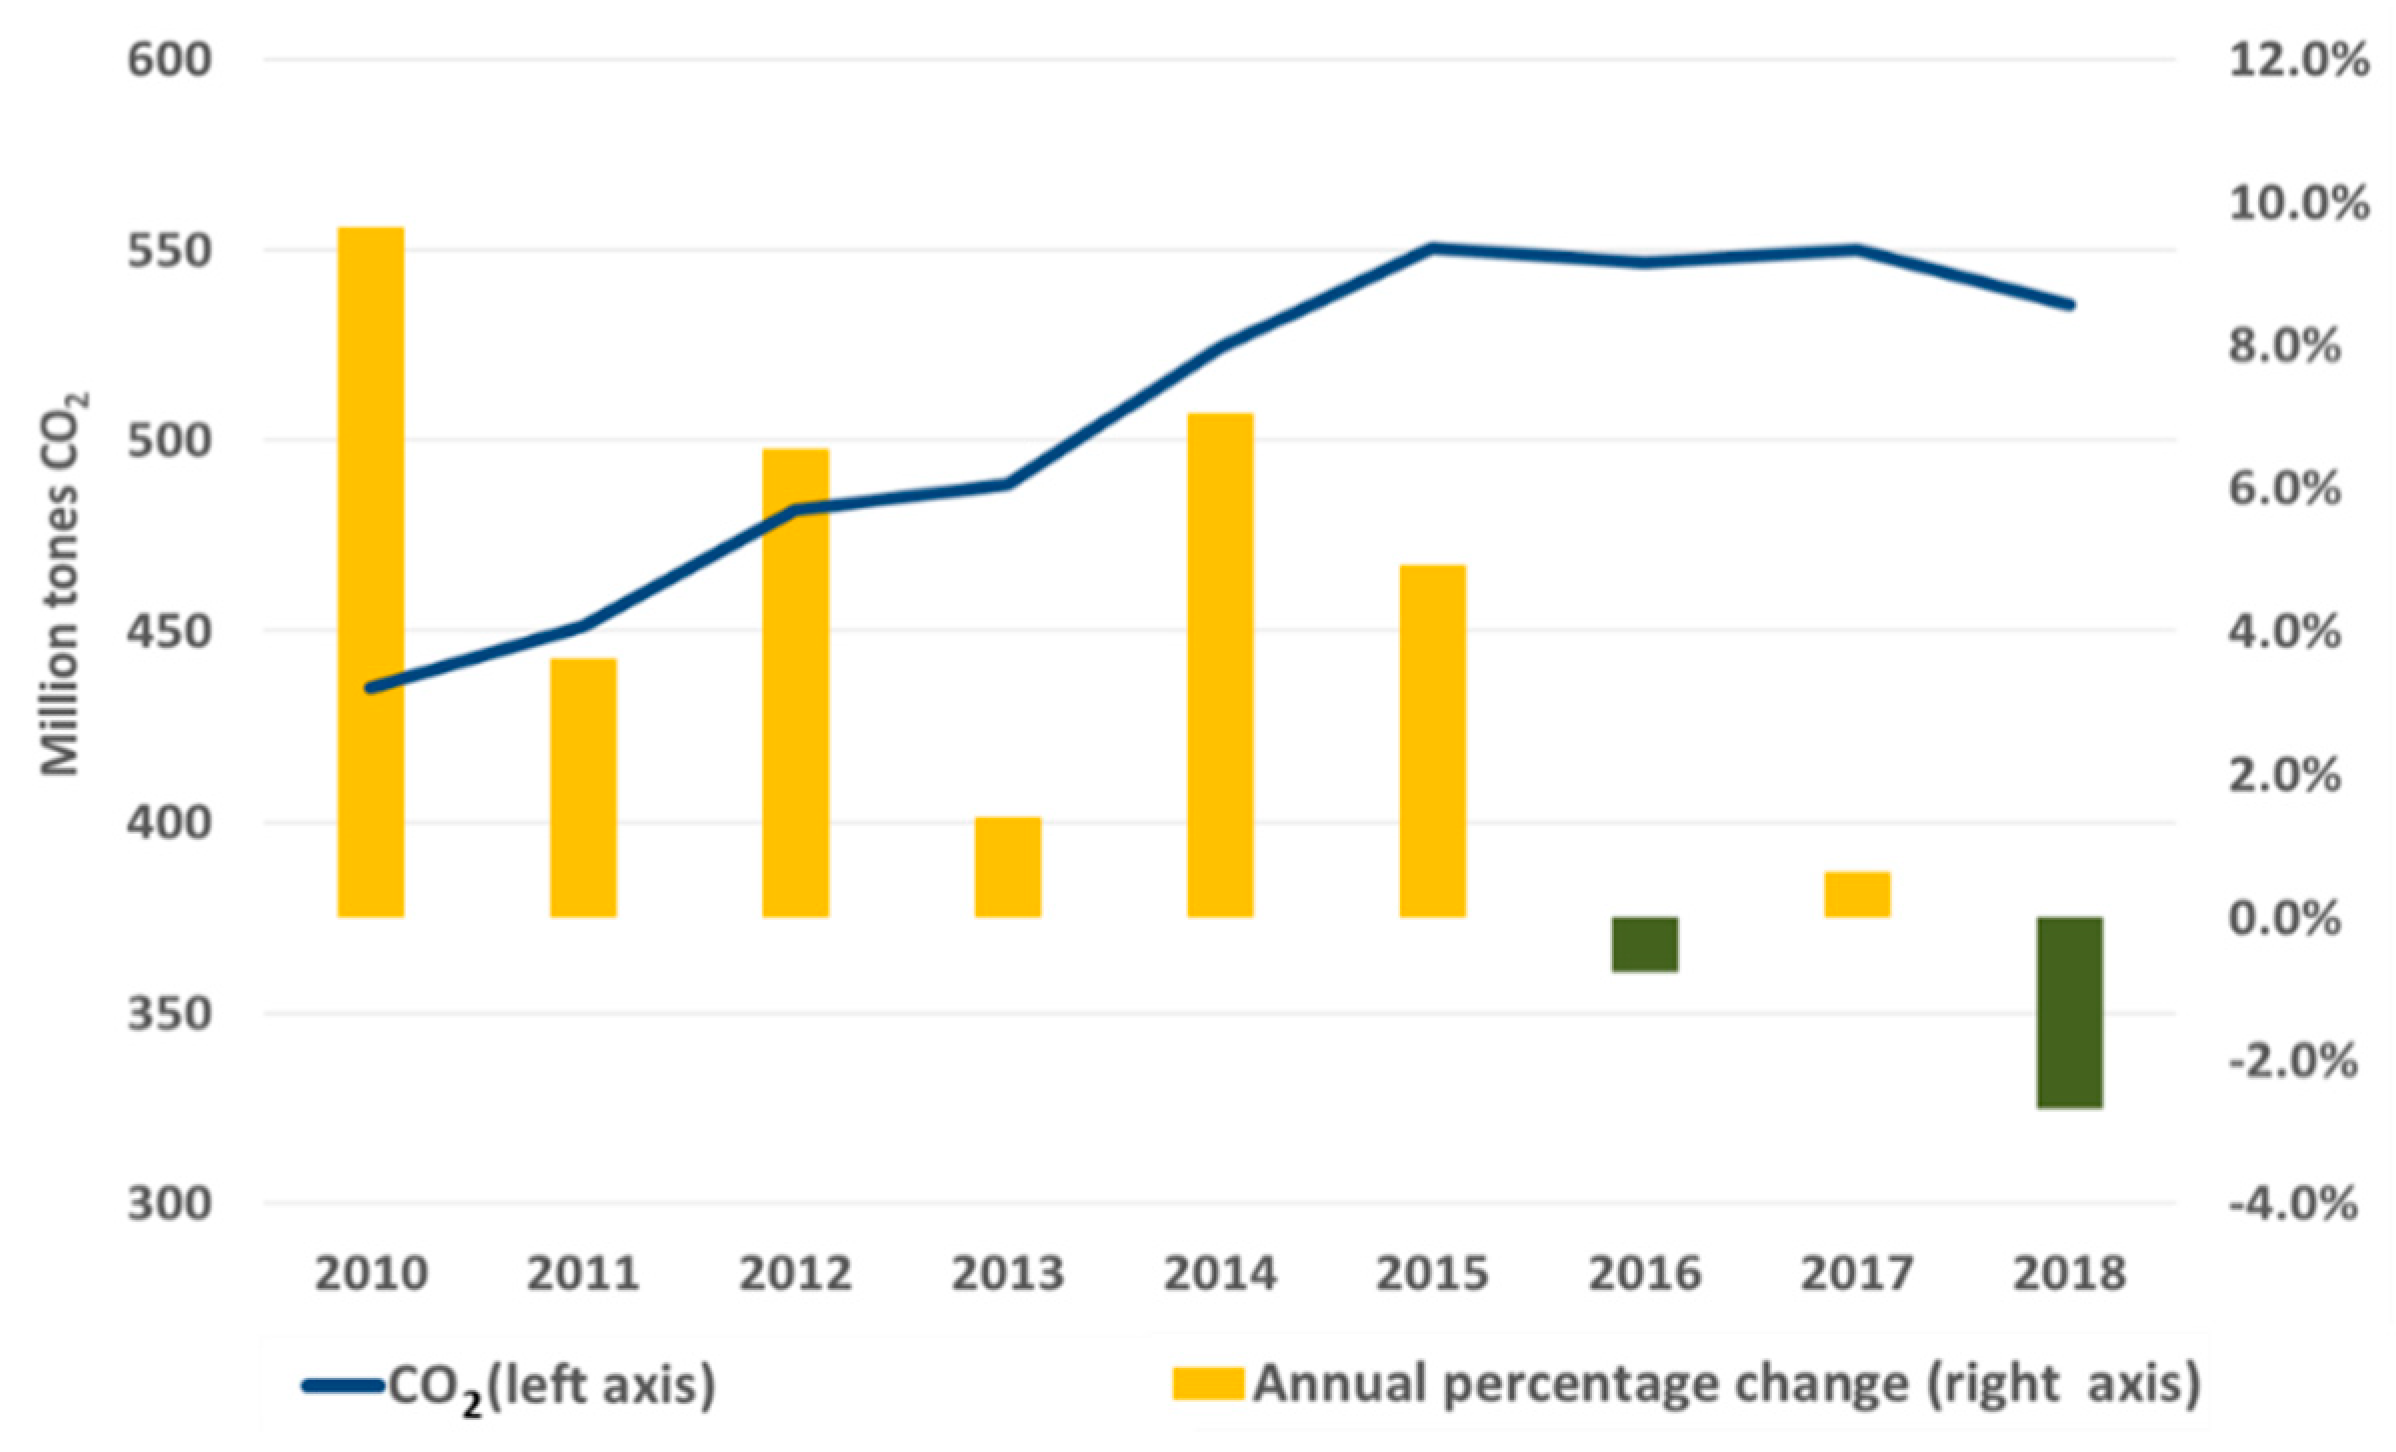
2 emissions. Indeed, this stabilization of emissions in the power sector helped contribute to the first major fall in total CO
2 emissions in the Kingdom’s history in 2018 (
Figure A1 and
Figure A2 in
Appendix A).
In the final section, we discuss our results in light of previous studies and summarize the key areas to improve the sustainability of cooling identified in the paper.
2. Review of Past Work on Temperature, Air Conditioning and Sustainability in Saudi Arabia
2.1. Temperature Characteristics of Saudi Arabia and the Need for Cooling
Hasanean and Almazroui [
7] describe the scientific knowledge relating to the climate and climate change in Saudi Arabia as being scattered, incomplete and limited, highlighting the need for research in this area. Literature on the Arabian peninsula describes a wide spectrum of conditions, including the snows of the Asir Province, the intense humidity of the Arabian Gulf, the monsoon rains of the Qara mountains in Dhofar [
8,
9,
10], and the scorching heat of the Rub Al Khali, the largest continuous expanse of desert in the world. Irregular, heavy rainstorms happen only a few days a year, with 80% of precipitation occurring during the wet season (November to May) and focused only in some areas.
For building and energy modelling purposes, several studies have classified regions in the Kingdom according to air temperature, relative humidity, wind speed and solar radiation. Between three to five distinct climatic zones have been identified, ranging from hot dry desert conditions to hot humid maritime areas and cooler mountain zones in the south [
11,
12,
13,
14].
While already very hot, studies suggest that the climate in Saudi Arabia is getting hotter and extreme temperature events are becoming more frequent [
15]. For example, Almazroui et al. [
16] reported an increase in temperature of 0.65 °C per decade.
Alghamdi and Harrington [
17] point out that 1338 heatwave events were recorded over a recent 35-year period. They define heatwave events as two consecutive days with daily maximum temperatures equal to or higher than the 90th percentile of the monthly maximum of the decade in question, and with a daily minimum equal or higher than the 85th percentile of the monthly minimum for the decade in question. Almazouri [
18] found that the Hijaz region on the coast of the Red Sea would be affected by an increase in extreme rainfall events.
Tarawneh and Chowdhury [
19] assess temperature, rainfall and climate change trends using linear regression. They show the mean summer temperatures in most cities to be around 2.5 times higher in summer than in winter. Some areas in the southwest, where the seasonal difference is around 5 °C, are an exception. Using 30 years of data, they identify a warming trend for Riyadh for both summer and winter of 0.0583 °C per year and 0.0427 °C per year, respectively.
Lelieveld et al. [
20] suggest that by the end of the century the magnitude of warming in the Middle East and North Africa (MENA) region during the summer is expected to be about twice as much as during the winter. They also estimate that the Kingdom could expect an average temperature increase above 6 °C for the summer months by 2081–2100, relative to averages from 1986–2005.
Saudi labour law already prohibits outdoor work between 12:00 a.m. and 15:00 p.m. from June to mid-September [
21]. Temperatures may soon rise to the extent that it is unsafe to spend a significant amount of time outside an air-conditioned building during most summer days. Higher temperatures also are likely to lead to increases in water demand, with one study conducted for Phoenix, Arizona suggesting every 1 °C increase in temperature is associated with an increase in water demand of 6.7% [
22].
Studies have also investigated the relationship between temperature and energy consumption in Saudi Arabia. Building on the work of Al-Hadhrami [
23] and Indraganti and Boussaa [
24], Atalla et al. [
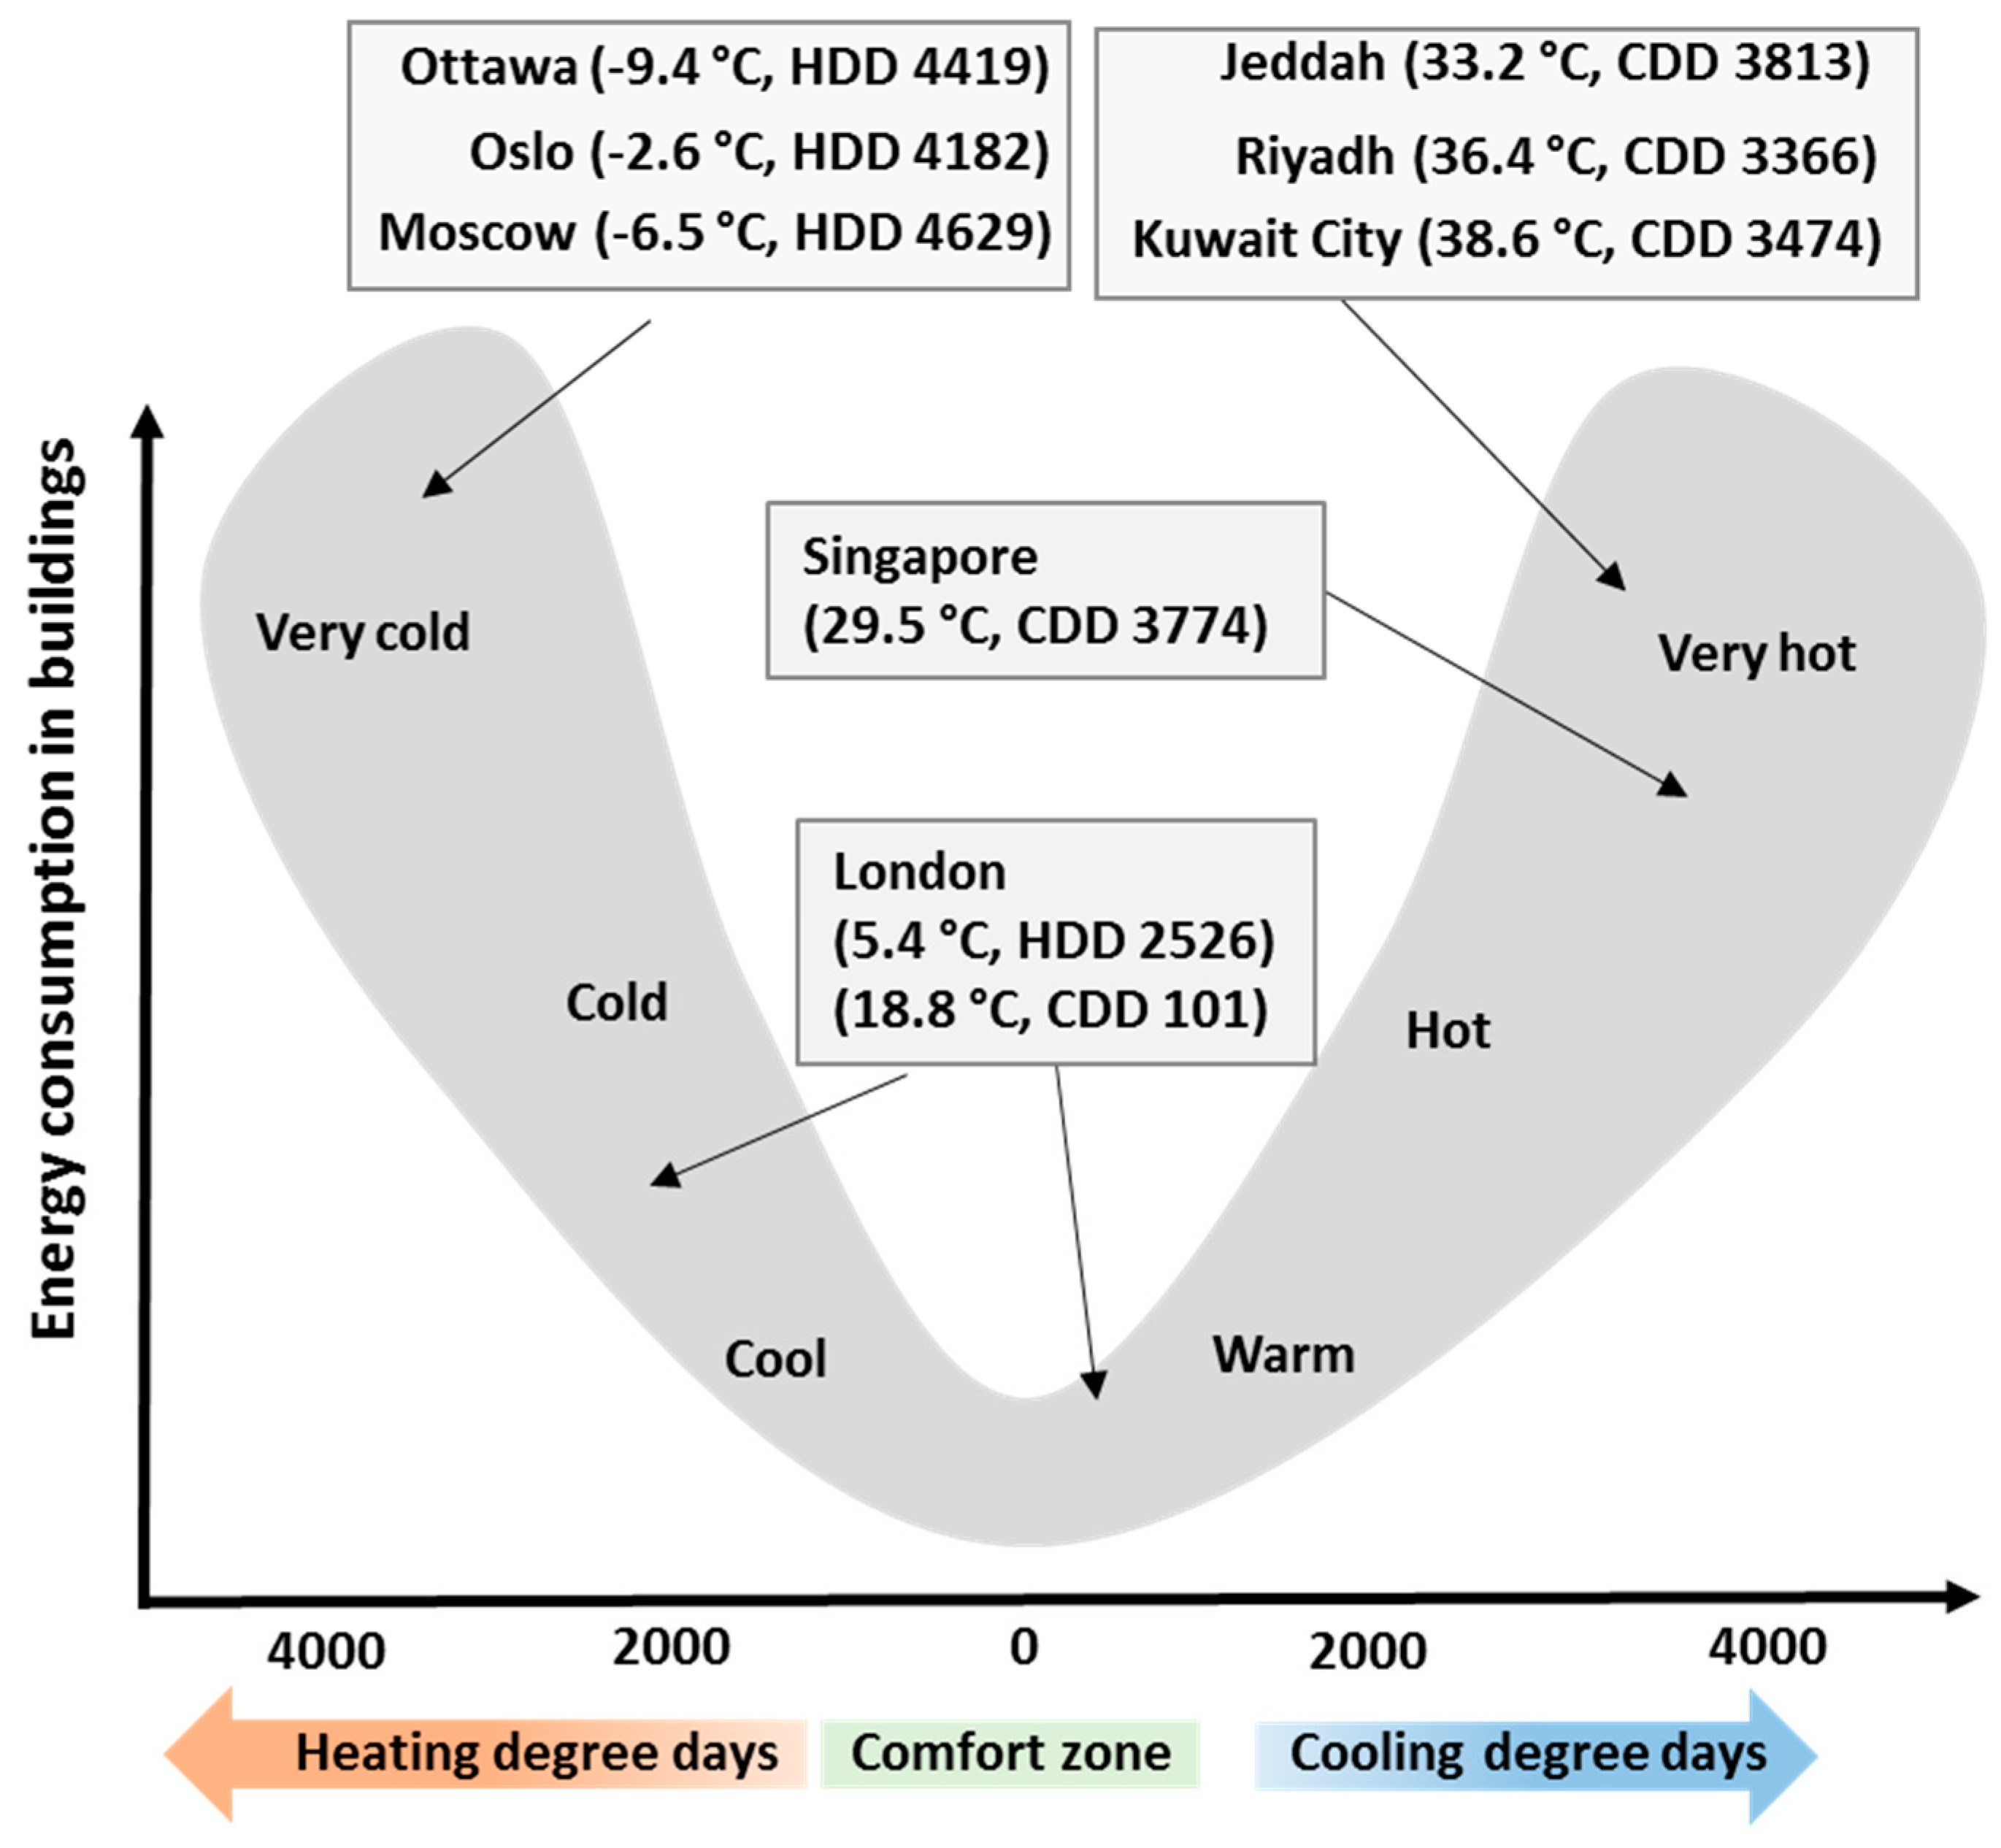
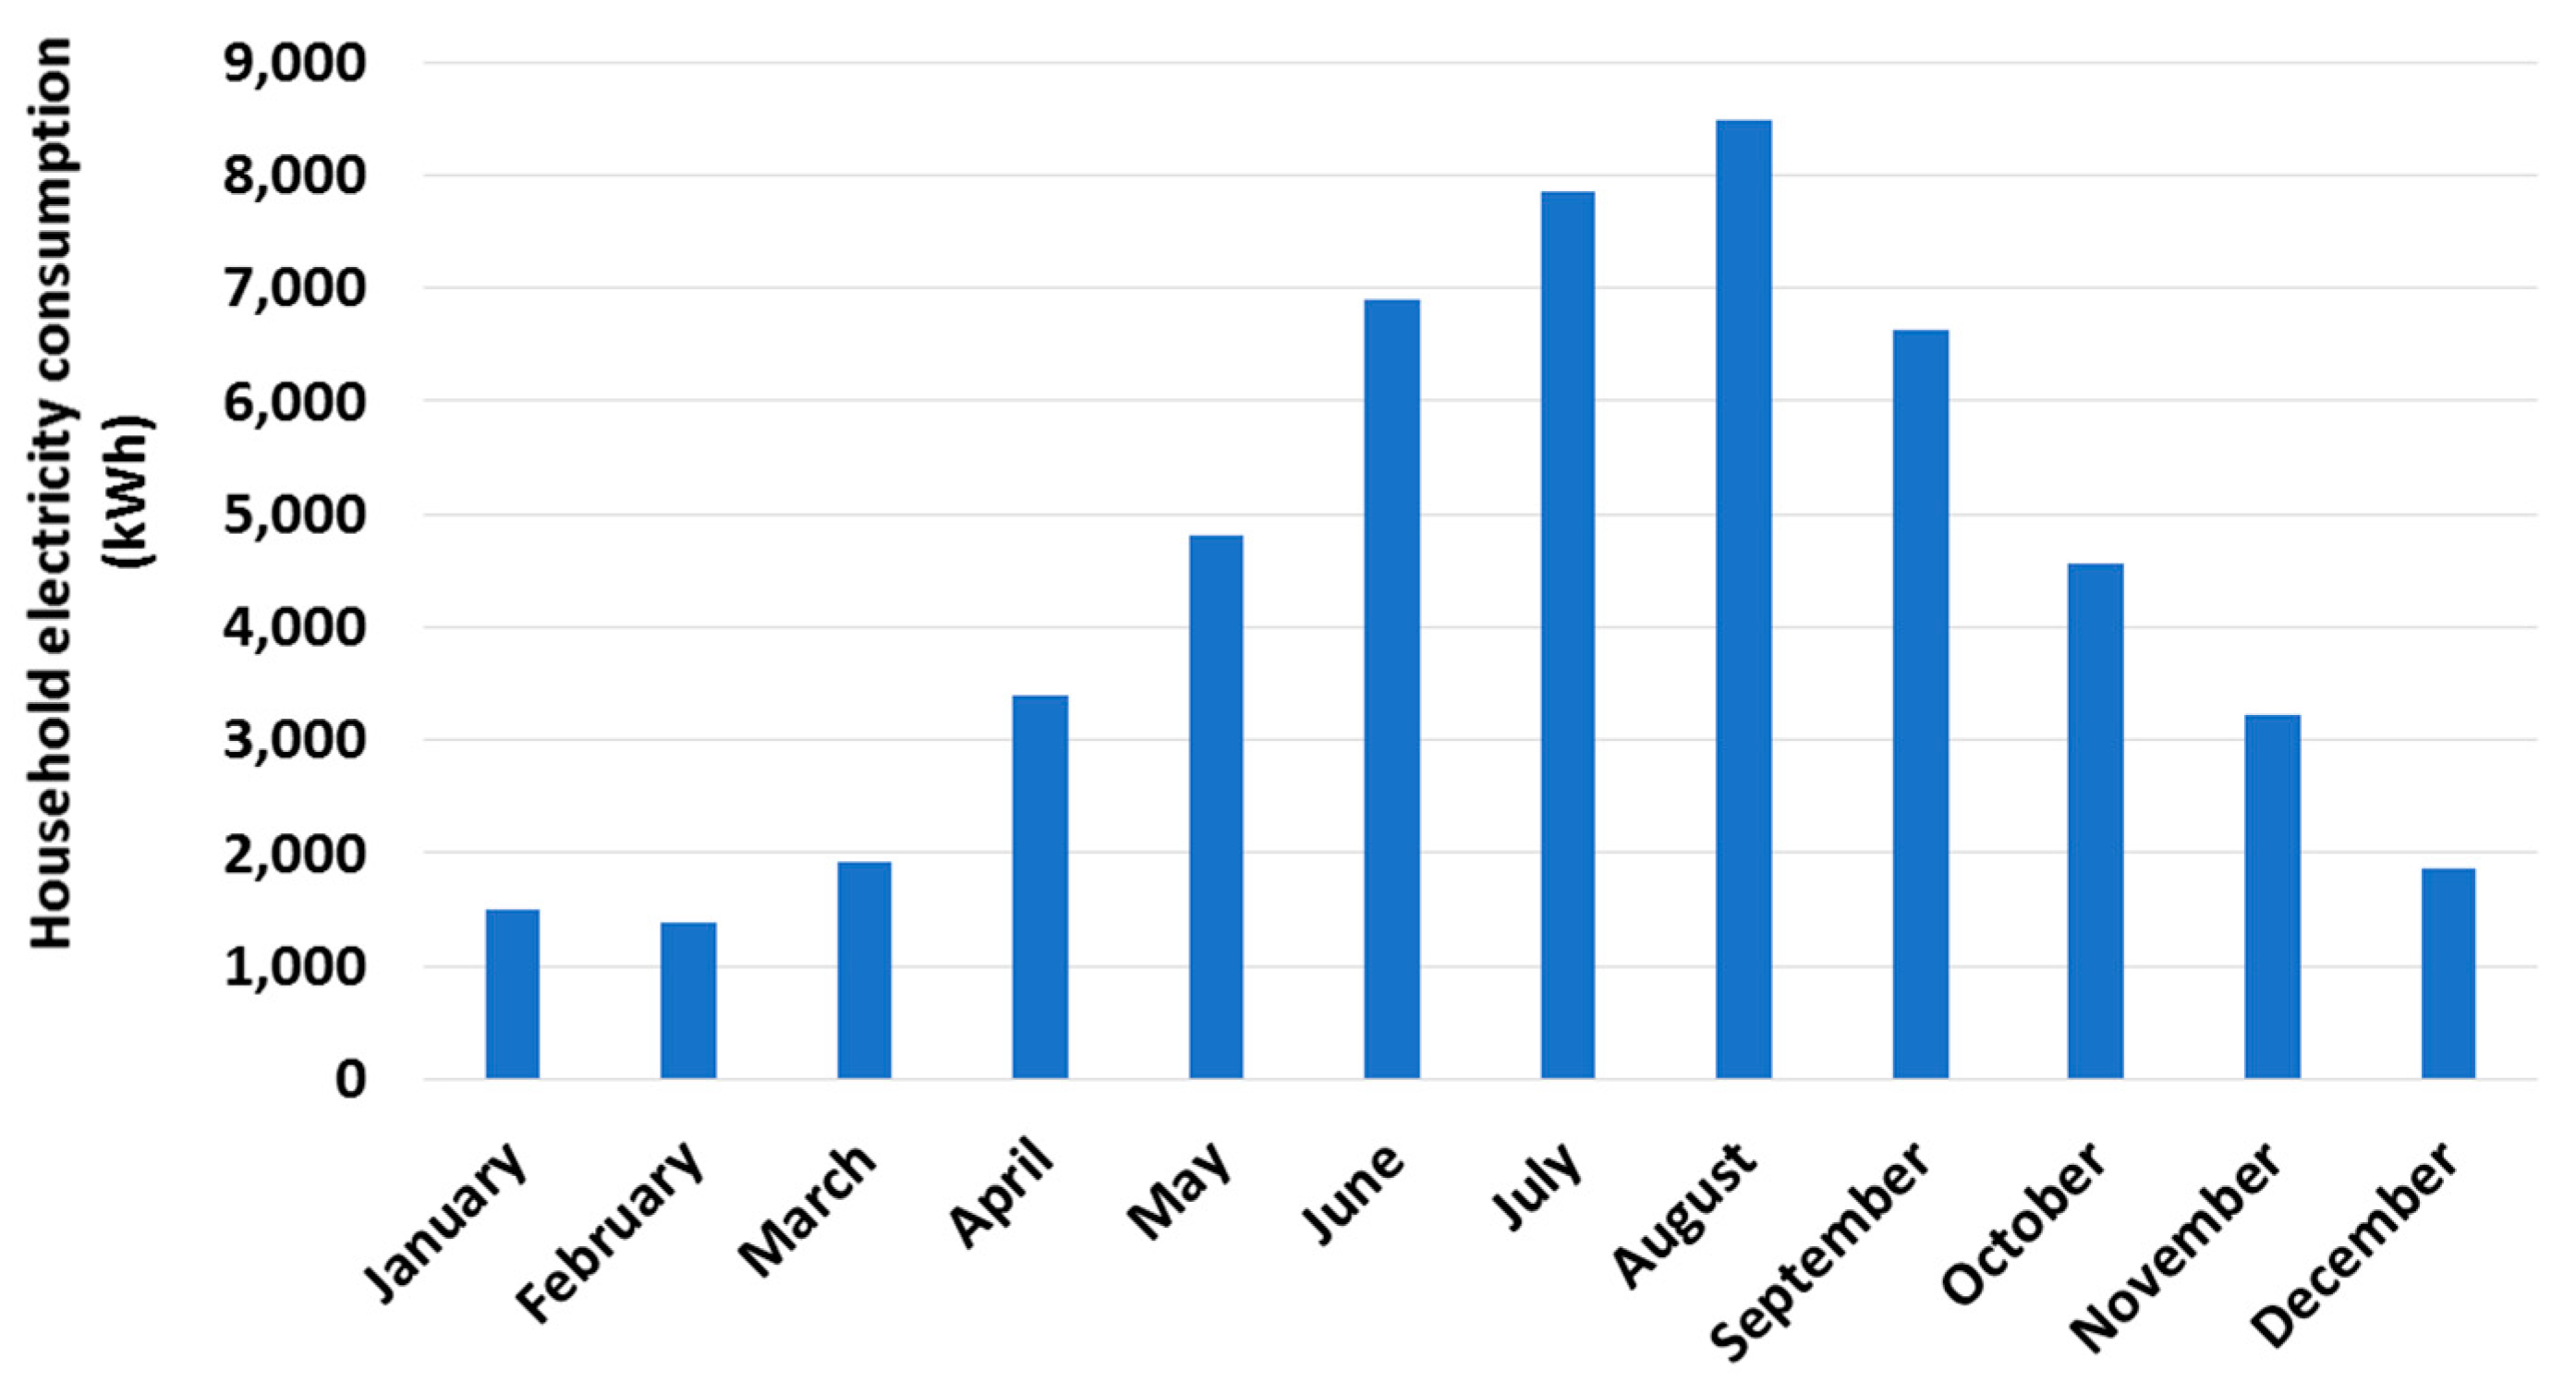
25] calculated a degree day dataset and suggested that around half of the Kingdom’s electricity consumption can be attributed to cooling demand. These studies used a degree-day methodology where the number of cooling (or heating) degree days refers to the number of degrees that a day’s average temperature is above (or below) a reference temperature (e.g., 18 °C). A general finding of these studies is that the energy consumed by buildings for heating and cooling follows a U-curve (
Figure 1).
Howarth et al. [
26] conducted an international benchmarking of sectoral energy demand for Saudi Arabia based on per capita energy consumption (1980–2015). While per capita buildings electricity consumption (the dominant fuel source for air conditioning) is relatively high in Saudi Arabia, overall per capita energy consumption from buildings is roughly in line with other countries such as the U.S. and Canada once other fuels such as gas (used for heating) are factored in. They also found that per capita energy demand from buildings in Saudi Arabia rose at a faster rate than OECD countries during the period under consideration, where it was falling or stable.
Research conducted by the IEA [
1] suggests that in countries with over 3000 cooling degree days (CDD), household ownership of air conditioners rises to virtually 100% once the average per capita GDP of around
$26,000 USD in 2015 purchasing power parity (PPP) terms is achieved. In countries such as Saudi Arabia, Brazil, Egypt, India, Thailand, Indonesia and Venezuela, cooling is almost essential for people to live and work in comfort. All major cities in Saudi Arabia have CDDs above 3000. According to the World Bank, in 2017, Saudi Arabia’s per capita gross domestic product (GDP) was US
$54,000 in 2015 PPP terms. As such, it is perhaps unsurprising that the use of air conditioners in Saudi Arabia is among the highest in the world.
Enerdata [
2] describes Saudi Arabia as having the world’s highest share of air conditioning in household electricity, at 70%. This compares with 57% in the United Arab Emirates, 25% in the U.S., 20% in Malaysia, 18% in India, 13% in Mexico and 12% in Egypt. This suggests that when compared with other countries with a similar climate in the same region, Saudi Arabia is at the extreme end of AC use and raises serious questions regarding sustainability.
2.2. Sustainability and Electricity Demand Growth
A well-established electricity sustainability challenge for Saudi Arabia has been identified on two main levels. Rapidly increasing AC demand has led to increasing amounts of oil being consumed domestically for power generation. This has been seen as a threat to oil export revenue and government spending for public services [
30,
31]. While not usually seen as the primary driver of policy, the latter relates to rising CO
2 emissions associated with fast electricity demand growth [
32,
33,
34].
In their report “Burning Oil to Keep Cool” Lahn and Stevens [
35] suggest that, with stable oil production and rising domestic consumption, Saudi Arabia could switch to being an oil importer by 2040 and face “intractable” fiscal deficits by 2022. In a similar vein, Abubakar and Aina [
36] warned of oil demand growth reducing Saudi Arabia’s oil export capacity, possibly resulting in a shortage of funds to provide essential public services.
Fattouh [
37] used monthly data from the Joint Organisations Data Initiative (JODI) to highlight the summer swings in domestic oil demand due to AC use and the potential for this to influence global oil prices. The author describes how between 2003 and 2012 electricity sold increased by 78%, from 128,629 million kilowatt-hours (kWh) to 240,288 million kWh. During the same period, the peak load increased by 117% from 23.9 gigawatts (GW) to 52 GW. In 2012, the domestic consumption of oil rose from 1.682 million barrels per day in January to 2.619 million barrels per day in July due to the summer demand for AC.
Fattouh goes on to describe the strategic decision to use oil or gas to fuel electricity and how a royal decree in 2006 stipulated that power plant capacity expansion should prioritize the use of crude oil. This saw the share of natural gas in the power sector fall from 52% in 2007 to around 39% in 2012. Other significant fuels used for power generation in 2012 were crude oil (35%), diesel (20%) and heavy fuel oil (HFO) (6%).
Drawing on official Electricity & Cogeneration Regulatory Authority (ECRA) statistics, Farnoosh et al. [
38] highlight that electricity consumption in Saudi Arabia grew at 8% in 2013, driven by population growth of around 2.3% per annum and the highly subsidized cost base of utilities. Algarni and Nutter [
39] note how building new homes also increased the floor space requiring cooling and, hence, energy consumption.
Exacerbating these energy consumption trends is the Kingdom’s old and poorly insulated building stock, with studies suggesting that around 70% of buildings are not insulated. Furthermore, there is a huge demand for air conditioning because of heat transmission through walls and roofs [
5,
40].
2.3. Energy Efficiency and Air Conditioning
Krarti et al. [
26] suggest that the biggest demand for electricity is from buildings, with 76% of total power demand; industrial use accounts for 19%. Residential users make up around 50% of total electricity demand, followed by commercial users (16%) and governmental offices (11%). The authors suggest that AC accounts for about 60% to 70% of total household electricity consumption, depending on the city. This contrasts with the study conducted by Proctor Engineering and AMAD [
41] which suggested that AC accounts for around 46% of electricity consumption on average across the country. One possible reason for this difference is that [
41] refers to residential AC consumption as a proportion of total electricity consumption, which includes commercial and industrial uses. Such differences are common in the literature and most likely relate to whether the proportion of AC is based on primary electricity generation or final electricity consumption and whether it incorporates commercial as well as residential AC use.
Krarti et al. [
26] suggest that combining more efficient air conditioners with improvements to insulation and air leakage could offer consumers energy savings of up to 50%. However, the authors highlight that householders are unlikely to make the necessary investments without stronger energy efficiency regulations and significant increases in electricity prices.
The Saudi Energy Efficiency Center (SEEC) was established in 2010 and launched the Saudi Energy Efficiency Program (SEEP) in 2012. As an important part of its mandate, SEEC has strengthened building code regulations for high- and low-rise buildings, introducing 14 insulation standards and standards for small and large AC units. Its enforcement of these standards means no new building can now be connected to the grid unless it complies with the building codes [
42].
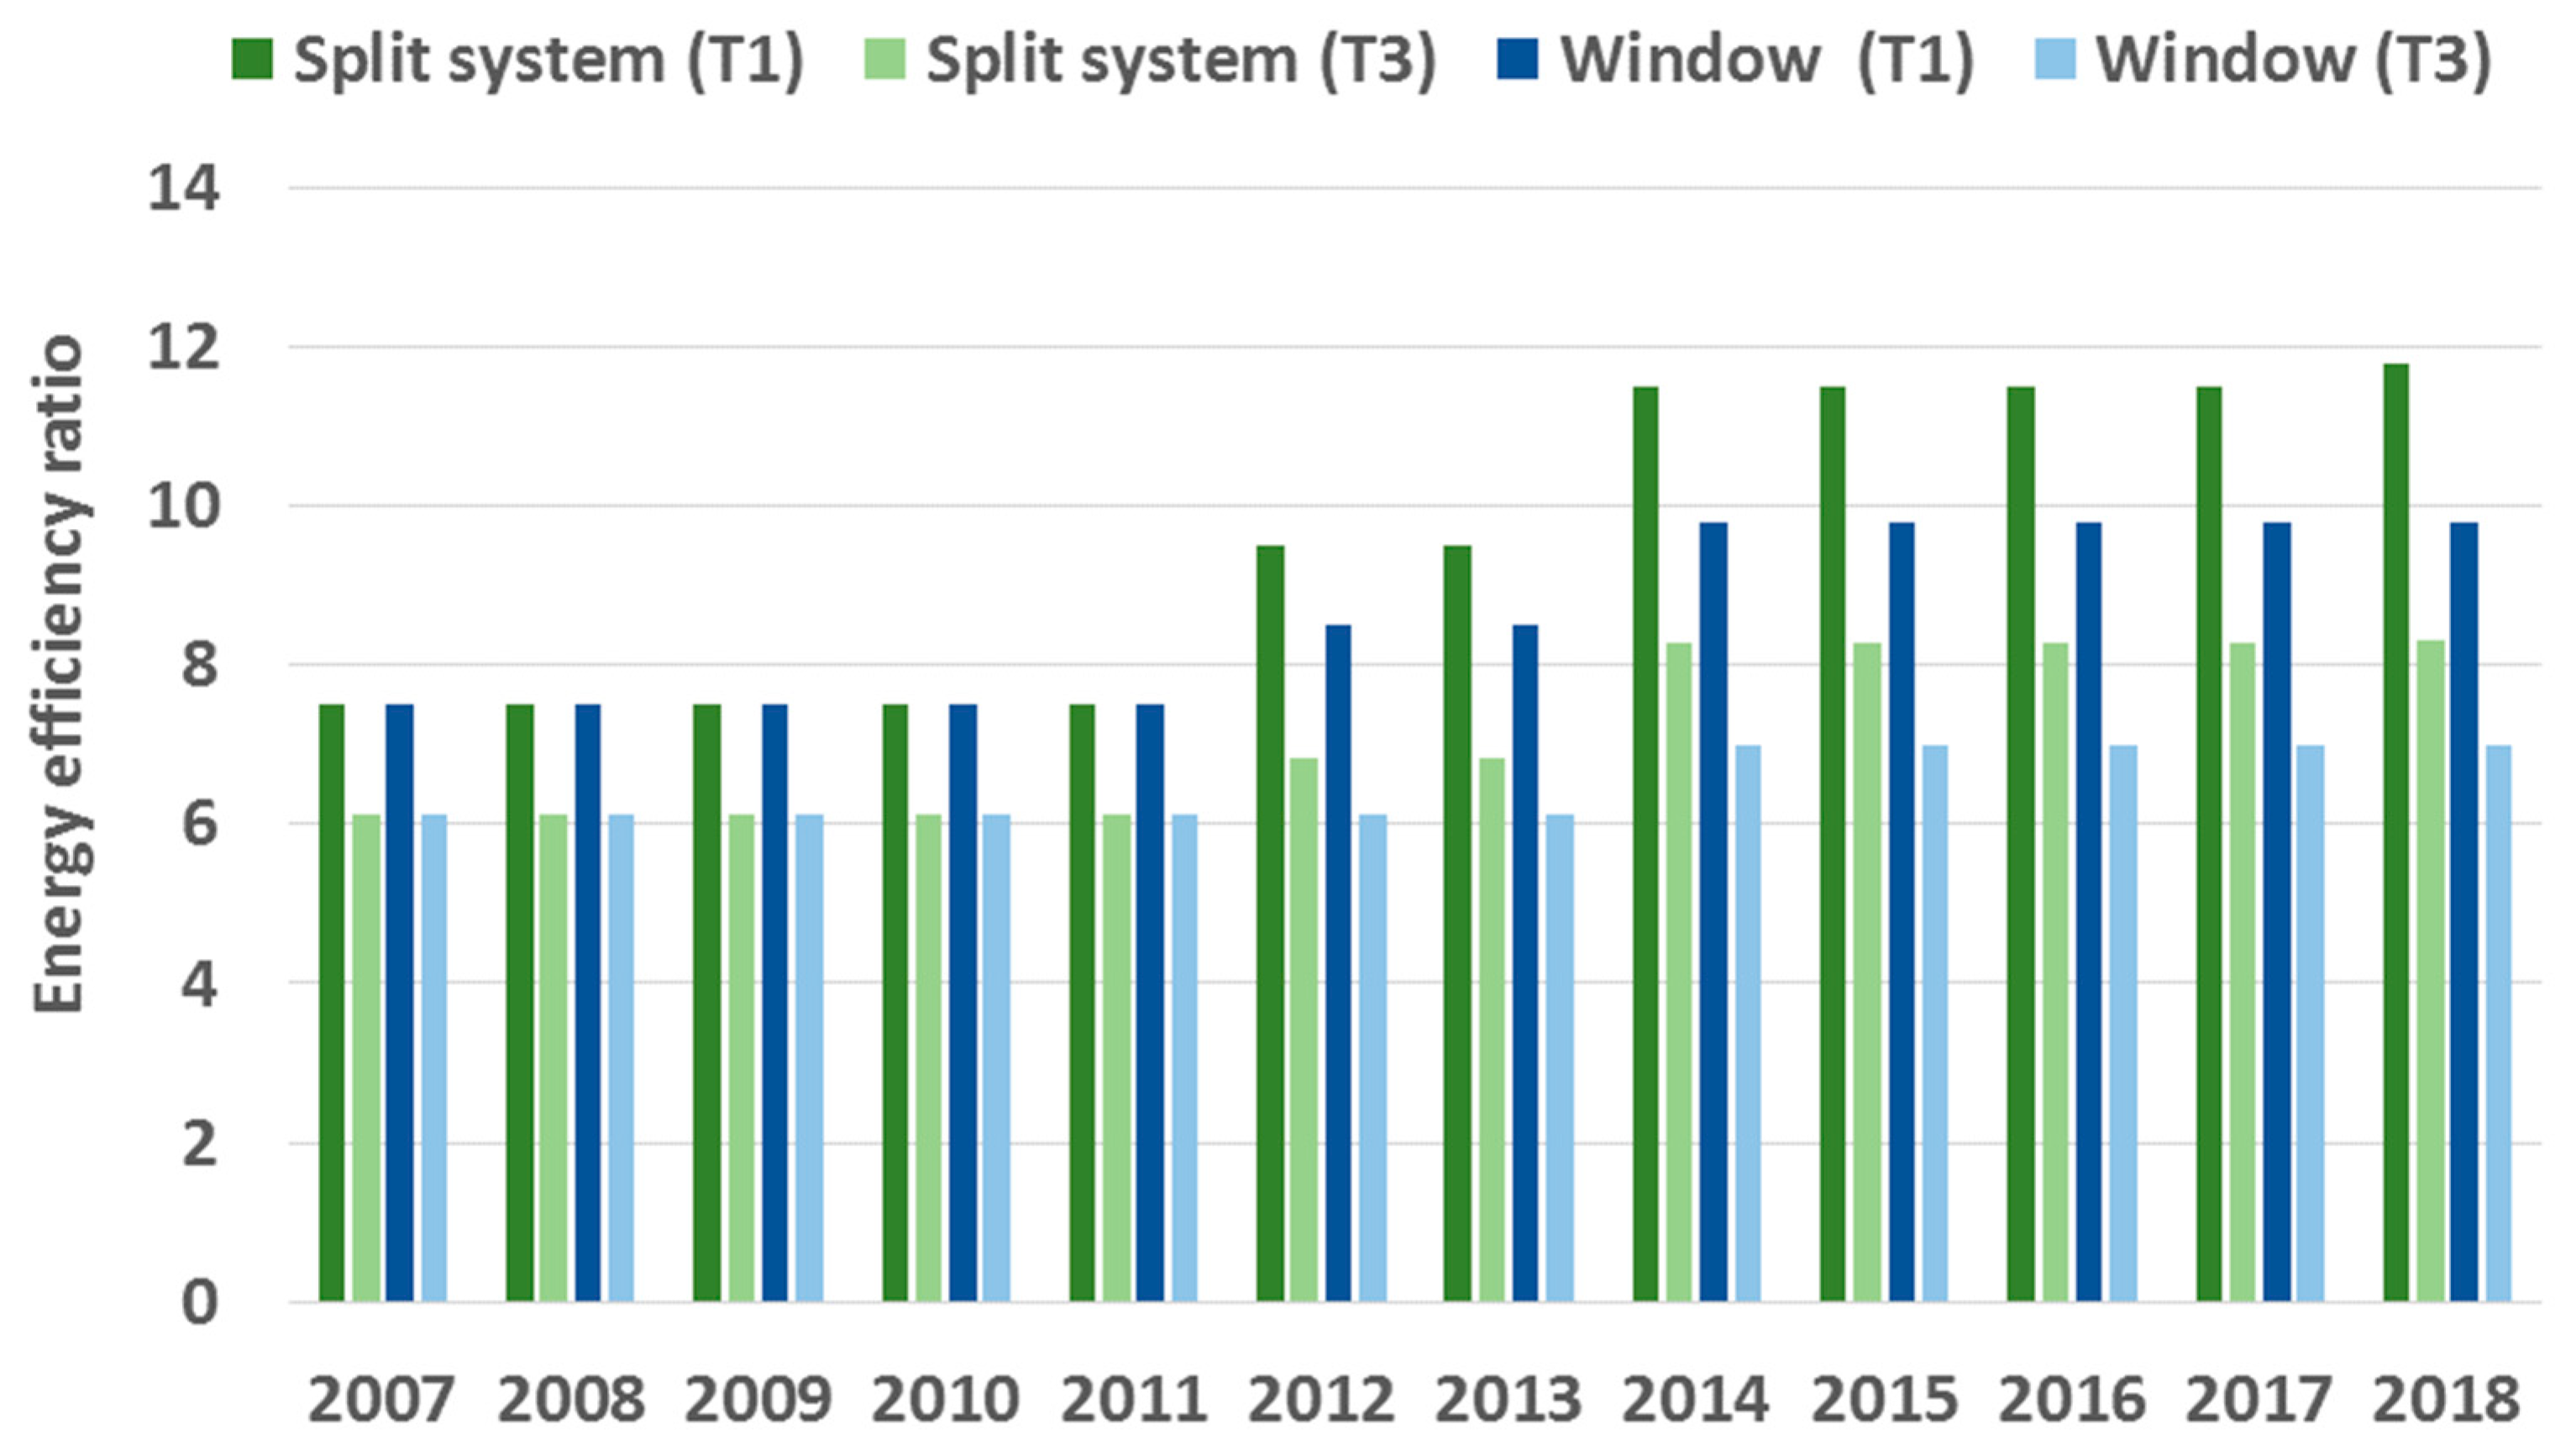
SEEC has also been steadily increasing the minimum energy efficiency rating (EER) standards of all major AC types (
Figure 2). Since 2007, the minimum EER for split type AC units has risen from 7.5 to 11.8, and the EER for window type units from 7.5 to 9.8. The current EER standard for commercial chillers is 9.7, and variable refrigerant flow (VRF) is 11.2 [
42,
43]. The government has also instituted a price discount scheme for the purchase of highly efficient split system AC units with EERs of 13.8 or higher. This program offers a 900 Saudi riyal (SAR) (US
$240) rebate for each unit sold, up to a maximum of six units per household [
41].
The IEA [
1] reviewed EERs across selected countries and found large differences between the best available units on the market and the EER for the average unit bought, including in Saudi Arabia. For example, the minimum standard for window units is the second-lowest ‘F’ rating on a scale from A to G.
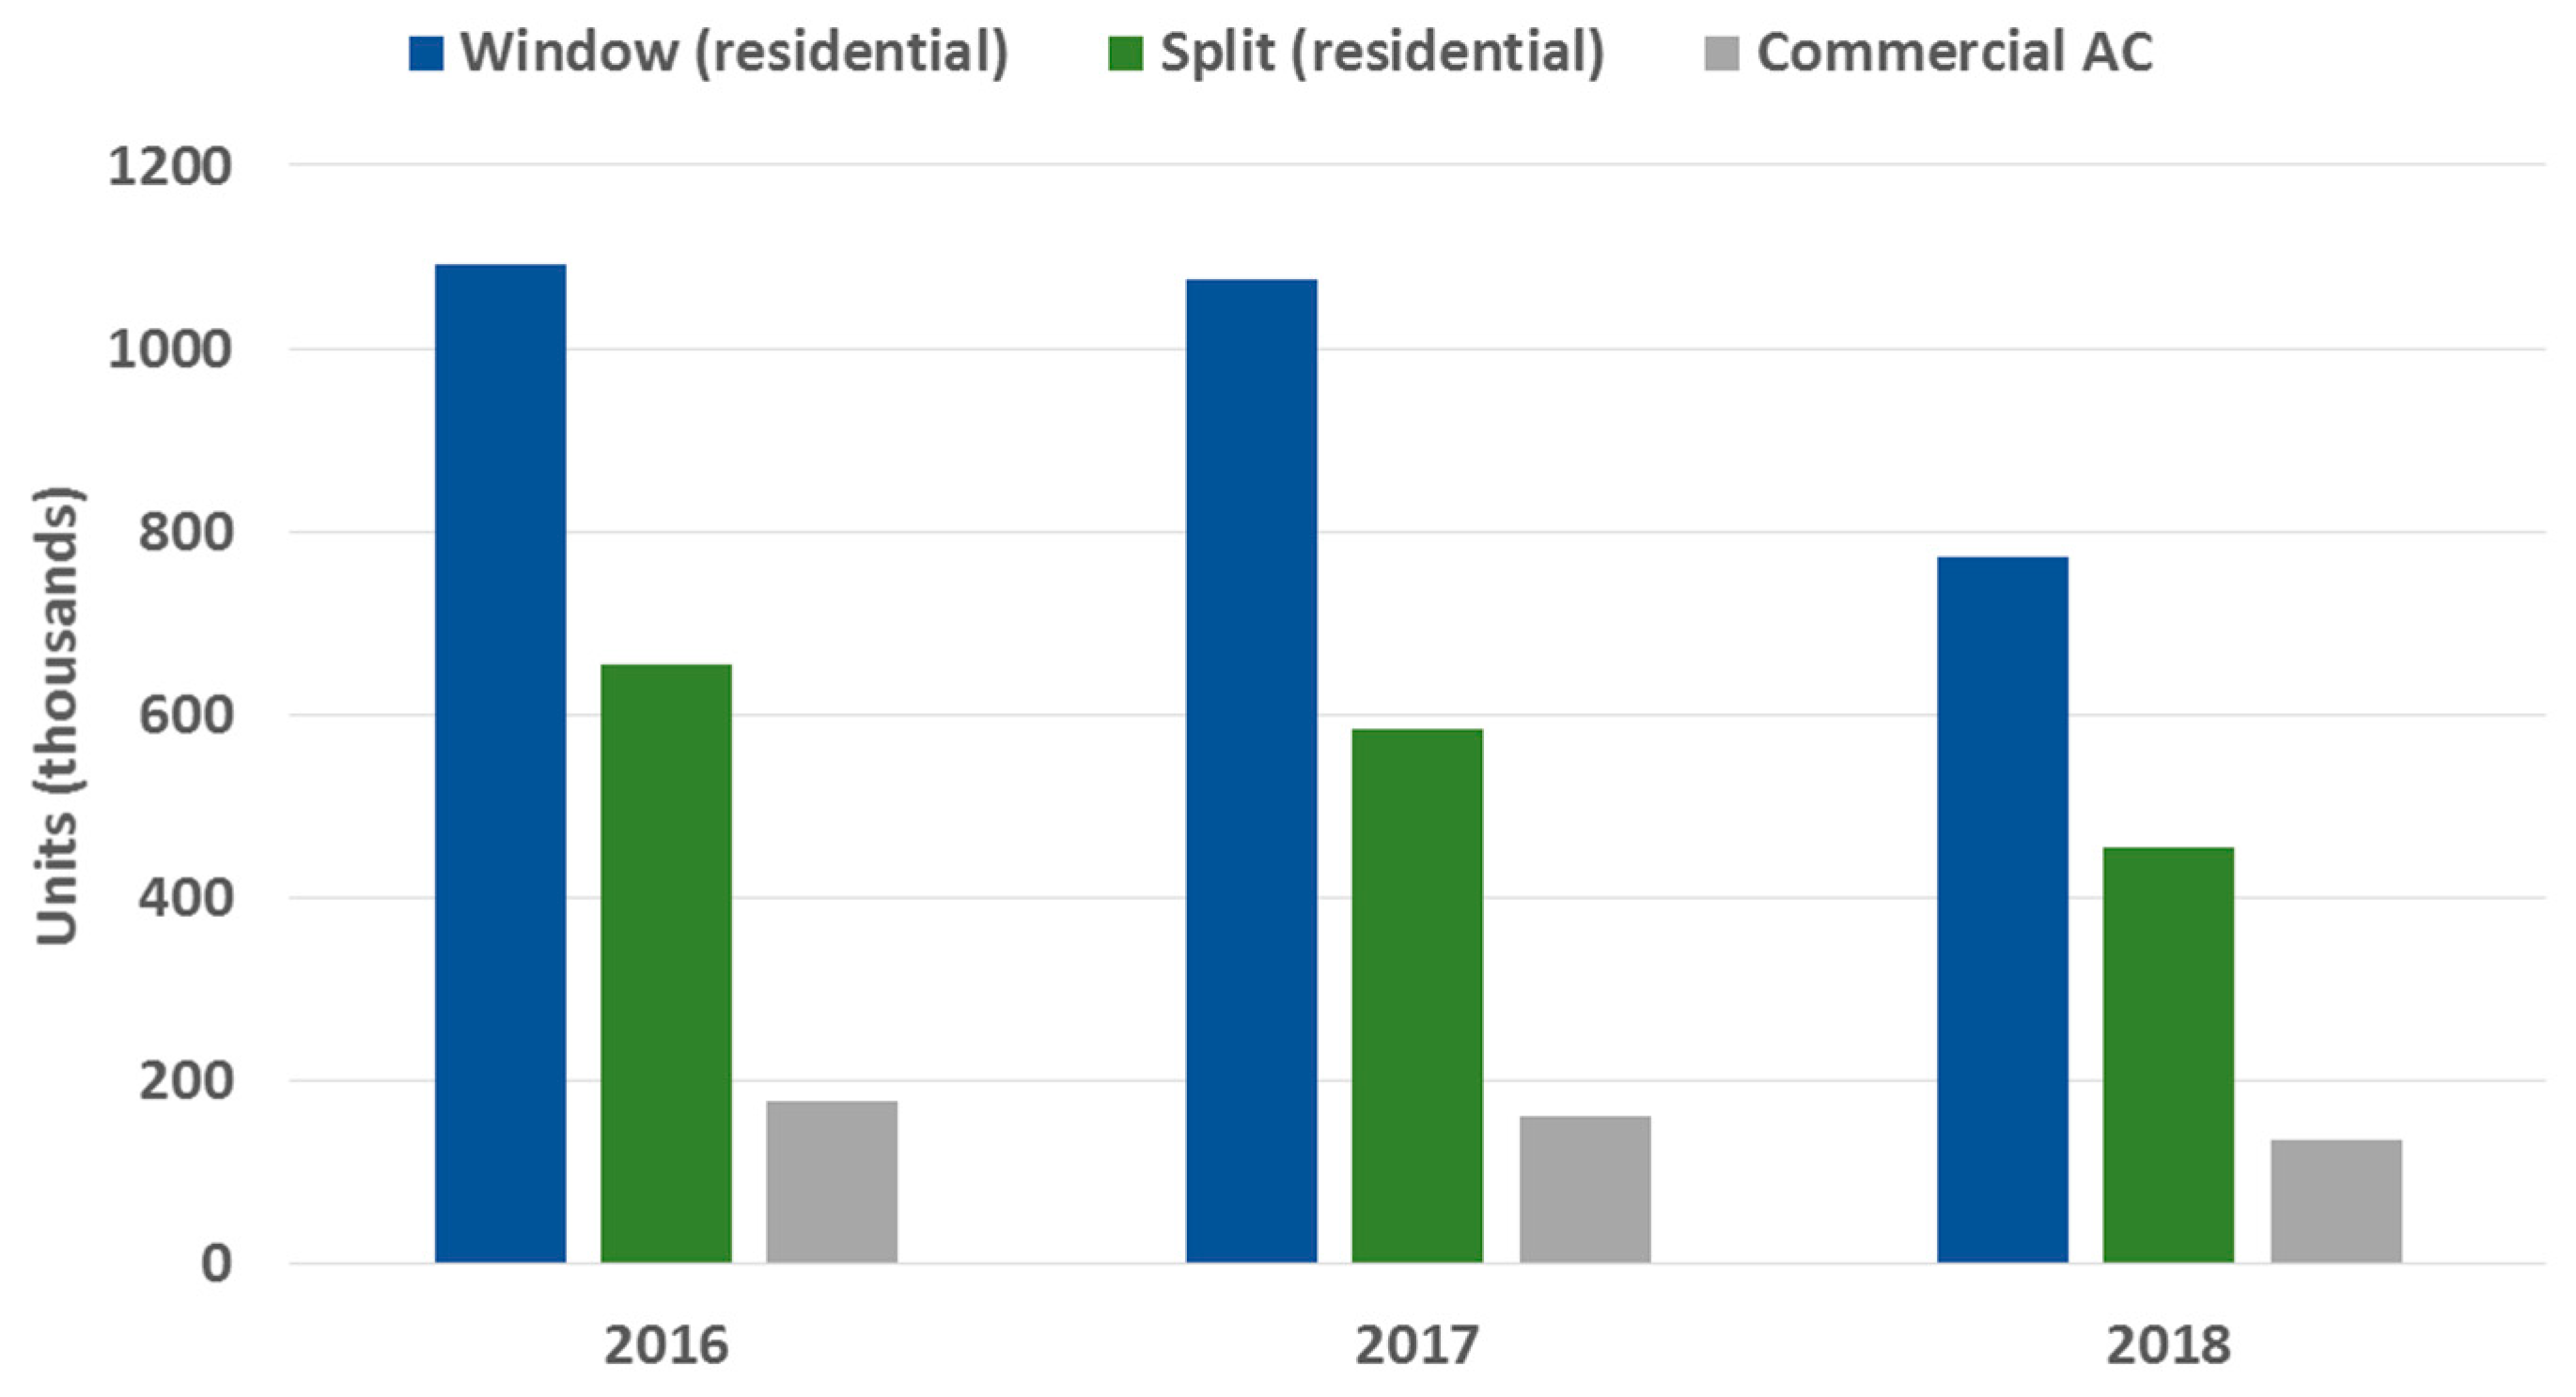
The Japan Refrigeration and AC Industry Association (JRACIA) provides an overview of world AC demand by region, including for Saudi Arabia (
Figure 3). The relatively inefficient but cheaper upfront cost window units comprised 63% of the residential market in 2018, with 772,000 units sold compared with 455,000 for the more efficient split system units. The number of residential units sold each year has also been declining, with unit sales falling by 28% for window units and 22% for split system units in 2018.
By way of comparison, the JRACIA statistics [
44] show that window AC sales constitute less than 1% of sales in China and Japan, 11% in the rest of Asia, 1% in Europe, 90% in the U.S., 41% across the Middle East and 5% in Australia.
Proctor Engineering and AMAD [
41] made several recommendations in their review of the potential for higher EER AC units. First, they recommended differential standards for AC units in dry areas such as Riyadh, where little dehumidification is required, and evaporative cooling is more efficient than standard vapour compression units. Reducing the number of relatively inefficient and cheap window type AC units sold was another priority—a challenge, given a standard window unit is around half the cost of a split unit and is less complicated to install. Other recommendations included (i) providing incentives to local manufacturers to switch from producing window units and upgrade the efficiency of units produced; (ii) improving the enforcement of SASO minimum performance standards; (iii) equipping units with sensors which switch the unit off if no-one is in a room or dwelling; and (iv) using more field tests and ongoing monitoring studies to assess the actual performance of units in specific local temperature and humidity conditions.
Another issue that has been identified is the uptake of inverter (variable speed drive) technology [
43]. While more expensive than simple on-off type motor regulation systems, inverters (used in split systems) offer the possibility of the AC unit running at a lower intensity to maintain a level of thermal comfort and could offer energy savings of up to 30%. Adopting a seasonal energy efficiency rating (SEER) rather than a standard rating (EER) is seen as one way to promote inverter units as estimated energy savings are higher for inverter units on energy performance labels under the SEER.
The potential for solar photovoltaic (PV) and solar thermal air conditioning has also received attention [
45,
46,
47,
48,
49,
50]. While the practical application is rare, it is an important area for research and deployment. This is particularly relevant in the context of the Kingdom’s plans to increase the share of renewable energy in its electricity grid.
The King Abdulaziz City for Science and Technology (KACST) has a major focus on efficient air conditioning and sustainability [
51]. In 2019 the King Abdullah University of Science and Technology (KAUST) launched a cooling initiative focusing on solar energy utilization as well as developing and testing highly efficient non-vapour compression air conditioners. King Fahd University of Petroleum and Minerals’ (KFUPM) Center of Excellence in Energy Efficiency also has a strong focus on cooling.
2.4. Energy Price Reform Policies
Fattouh [
37] provides a snapshot of the large energy subsidies which were in place in 2012, represented by the gap between the price paid by local power producers and the international prices paid for fuels. Reforms to remove subsidies from fuel inputs to electricity generation has seen prices for natural gas increase 66% from
$0.75 per million British thermal units (MMBtu) in 2015 to
$1.25 MMBtu in 2018. Diesel fuel prices increased 77% from
$9.11 a barrel in 2015 to
$16.15 a barrel in 2018. Arab light crude increased 50% from
$4.24 a barrel to
$6.35 a barrel, and Arab heavy crude increased 65% from
$2.67 a barrel in 2015 to
$4.4 a barrel in 2018 [
52].
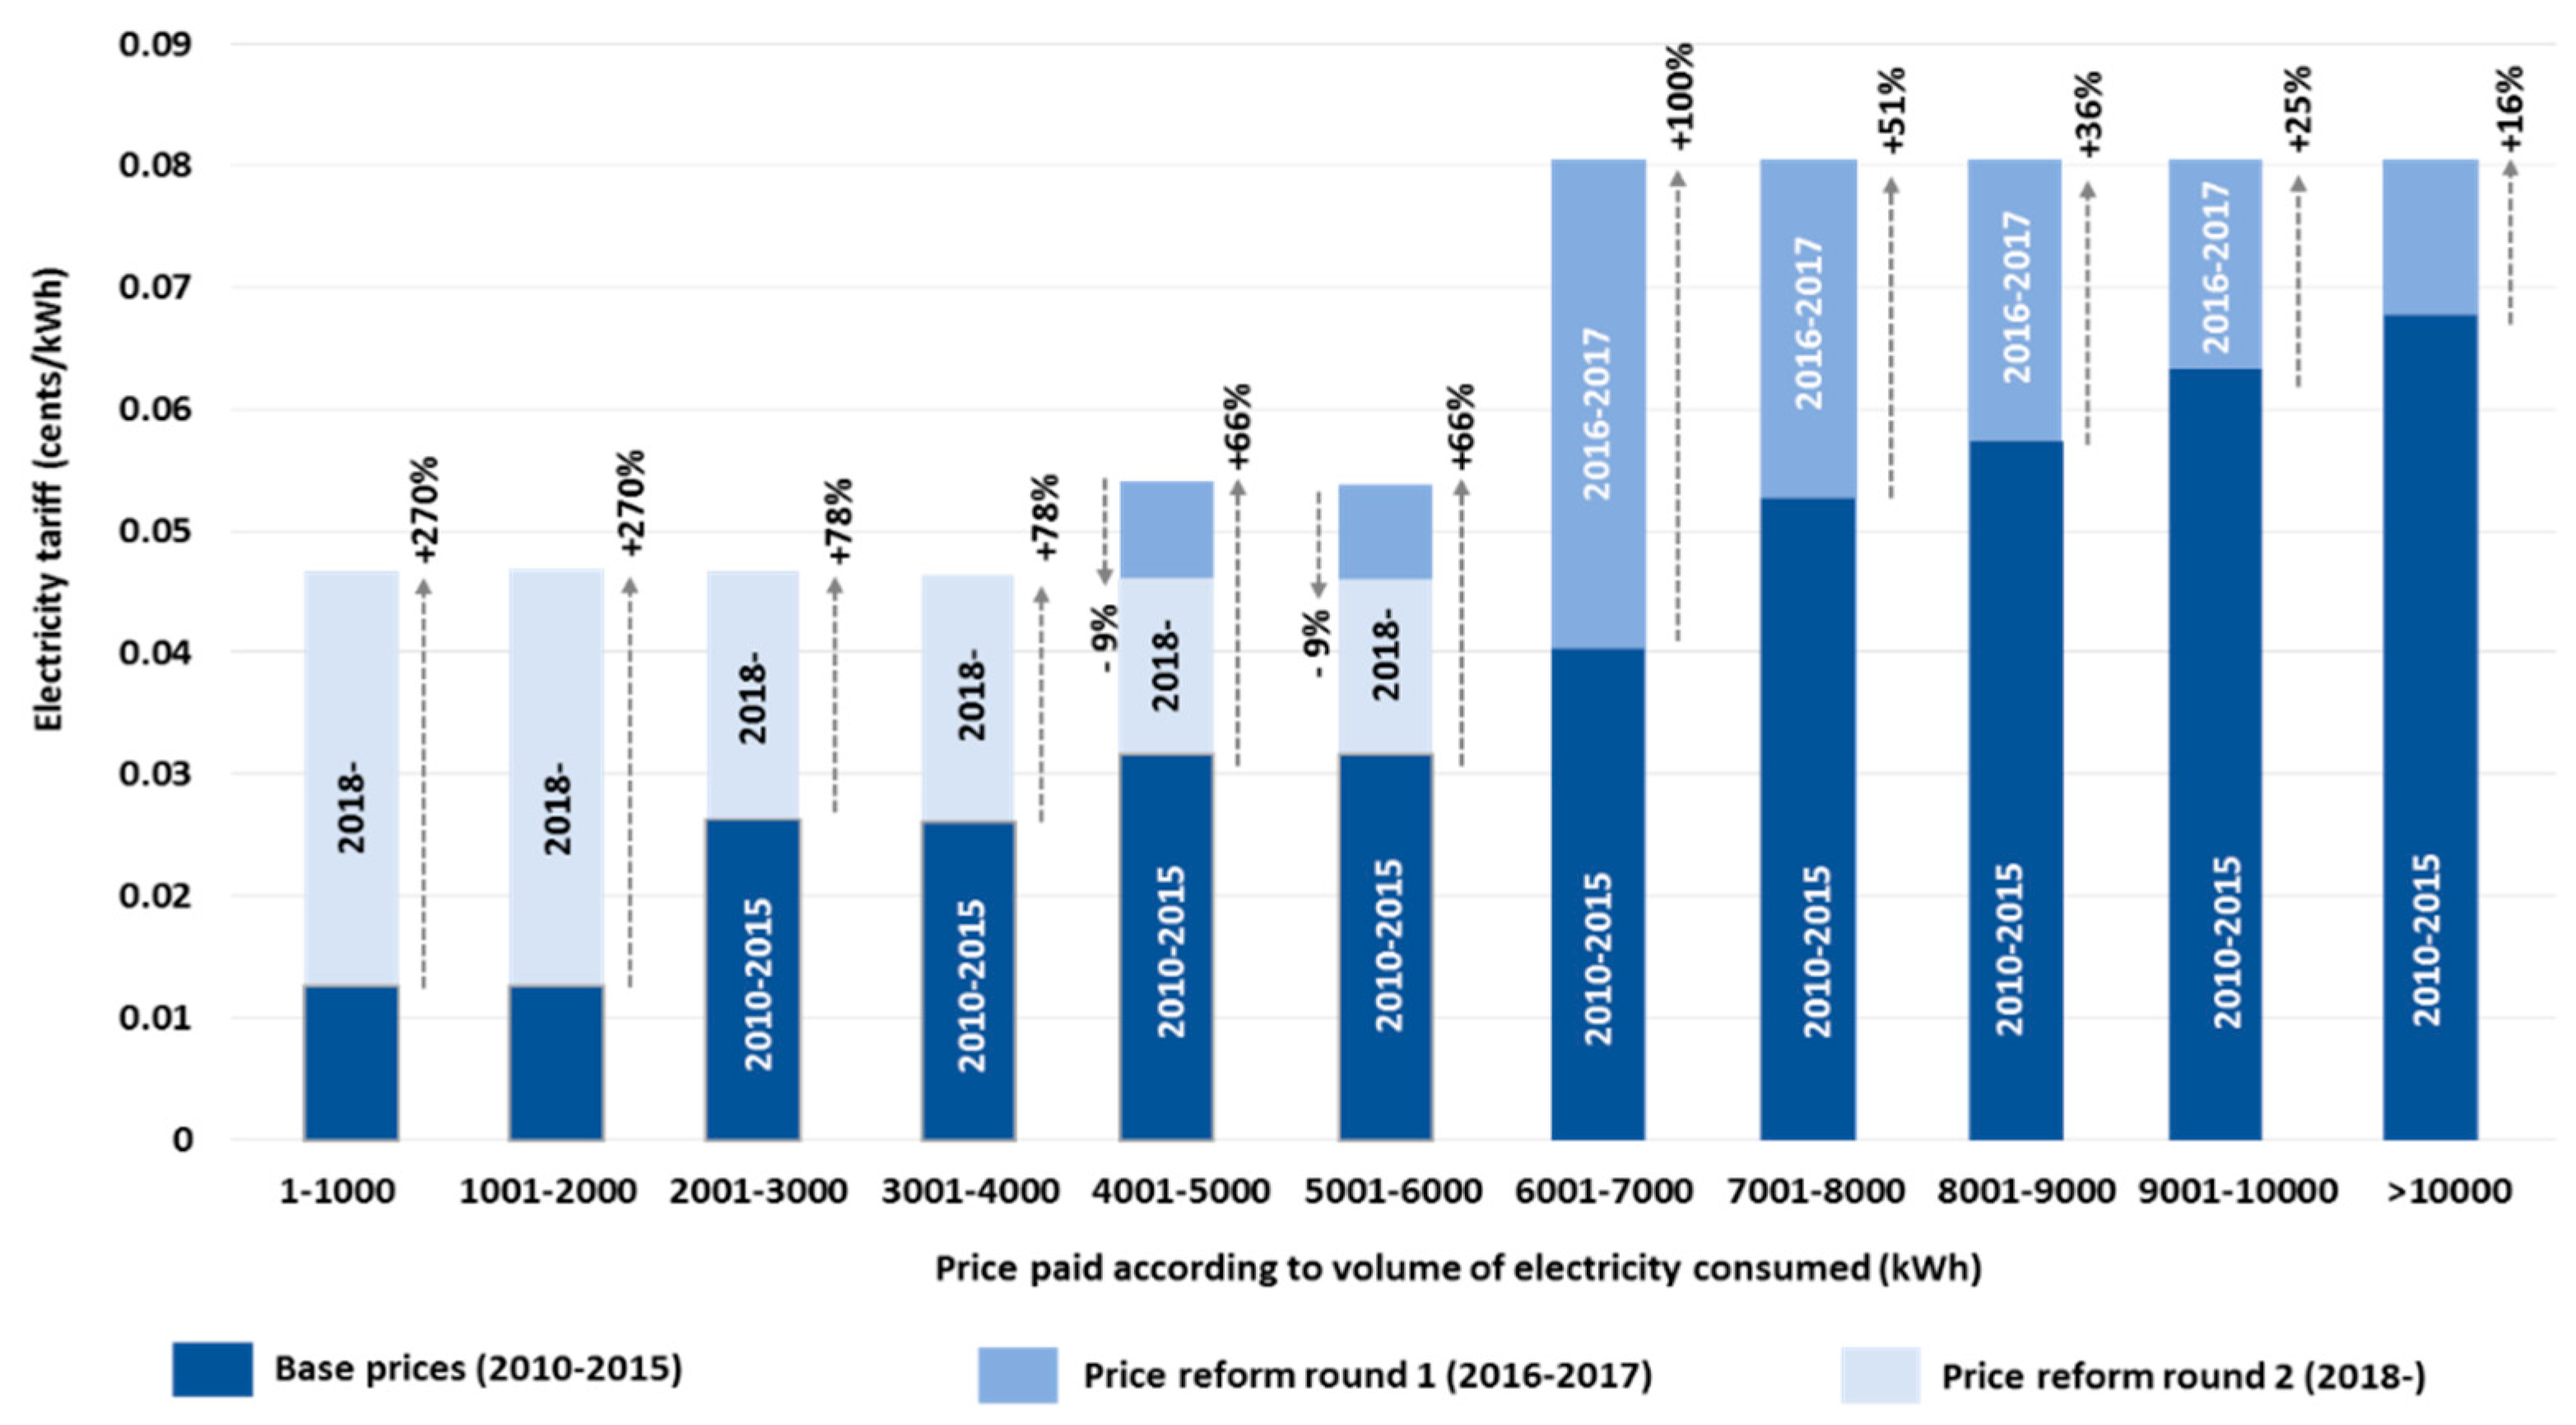
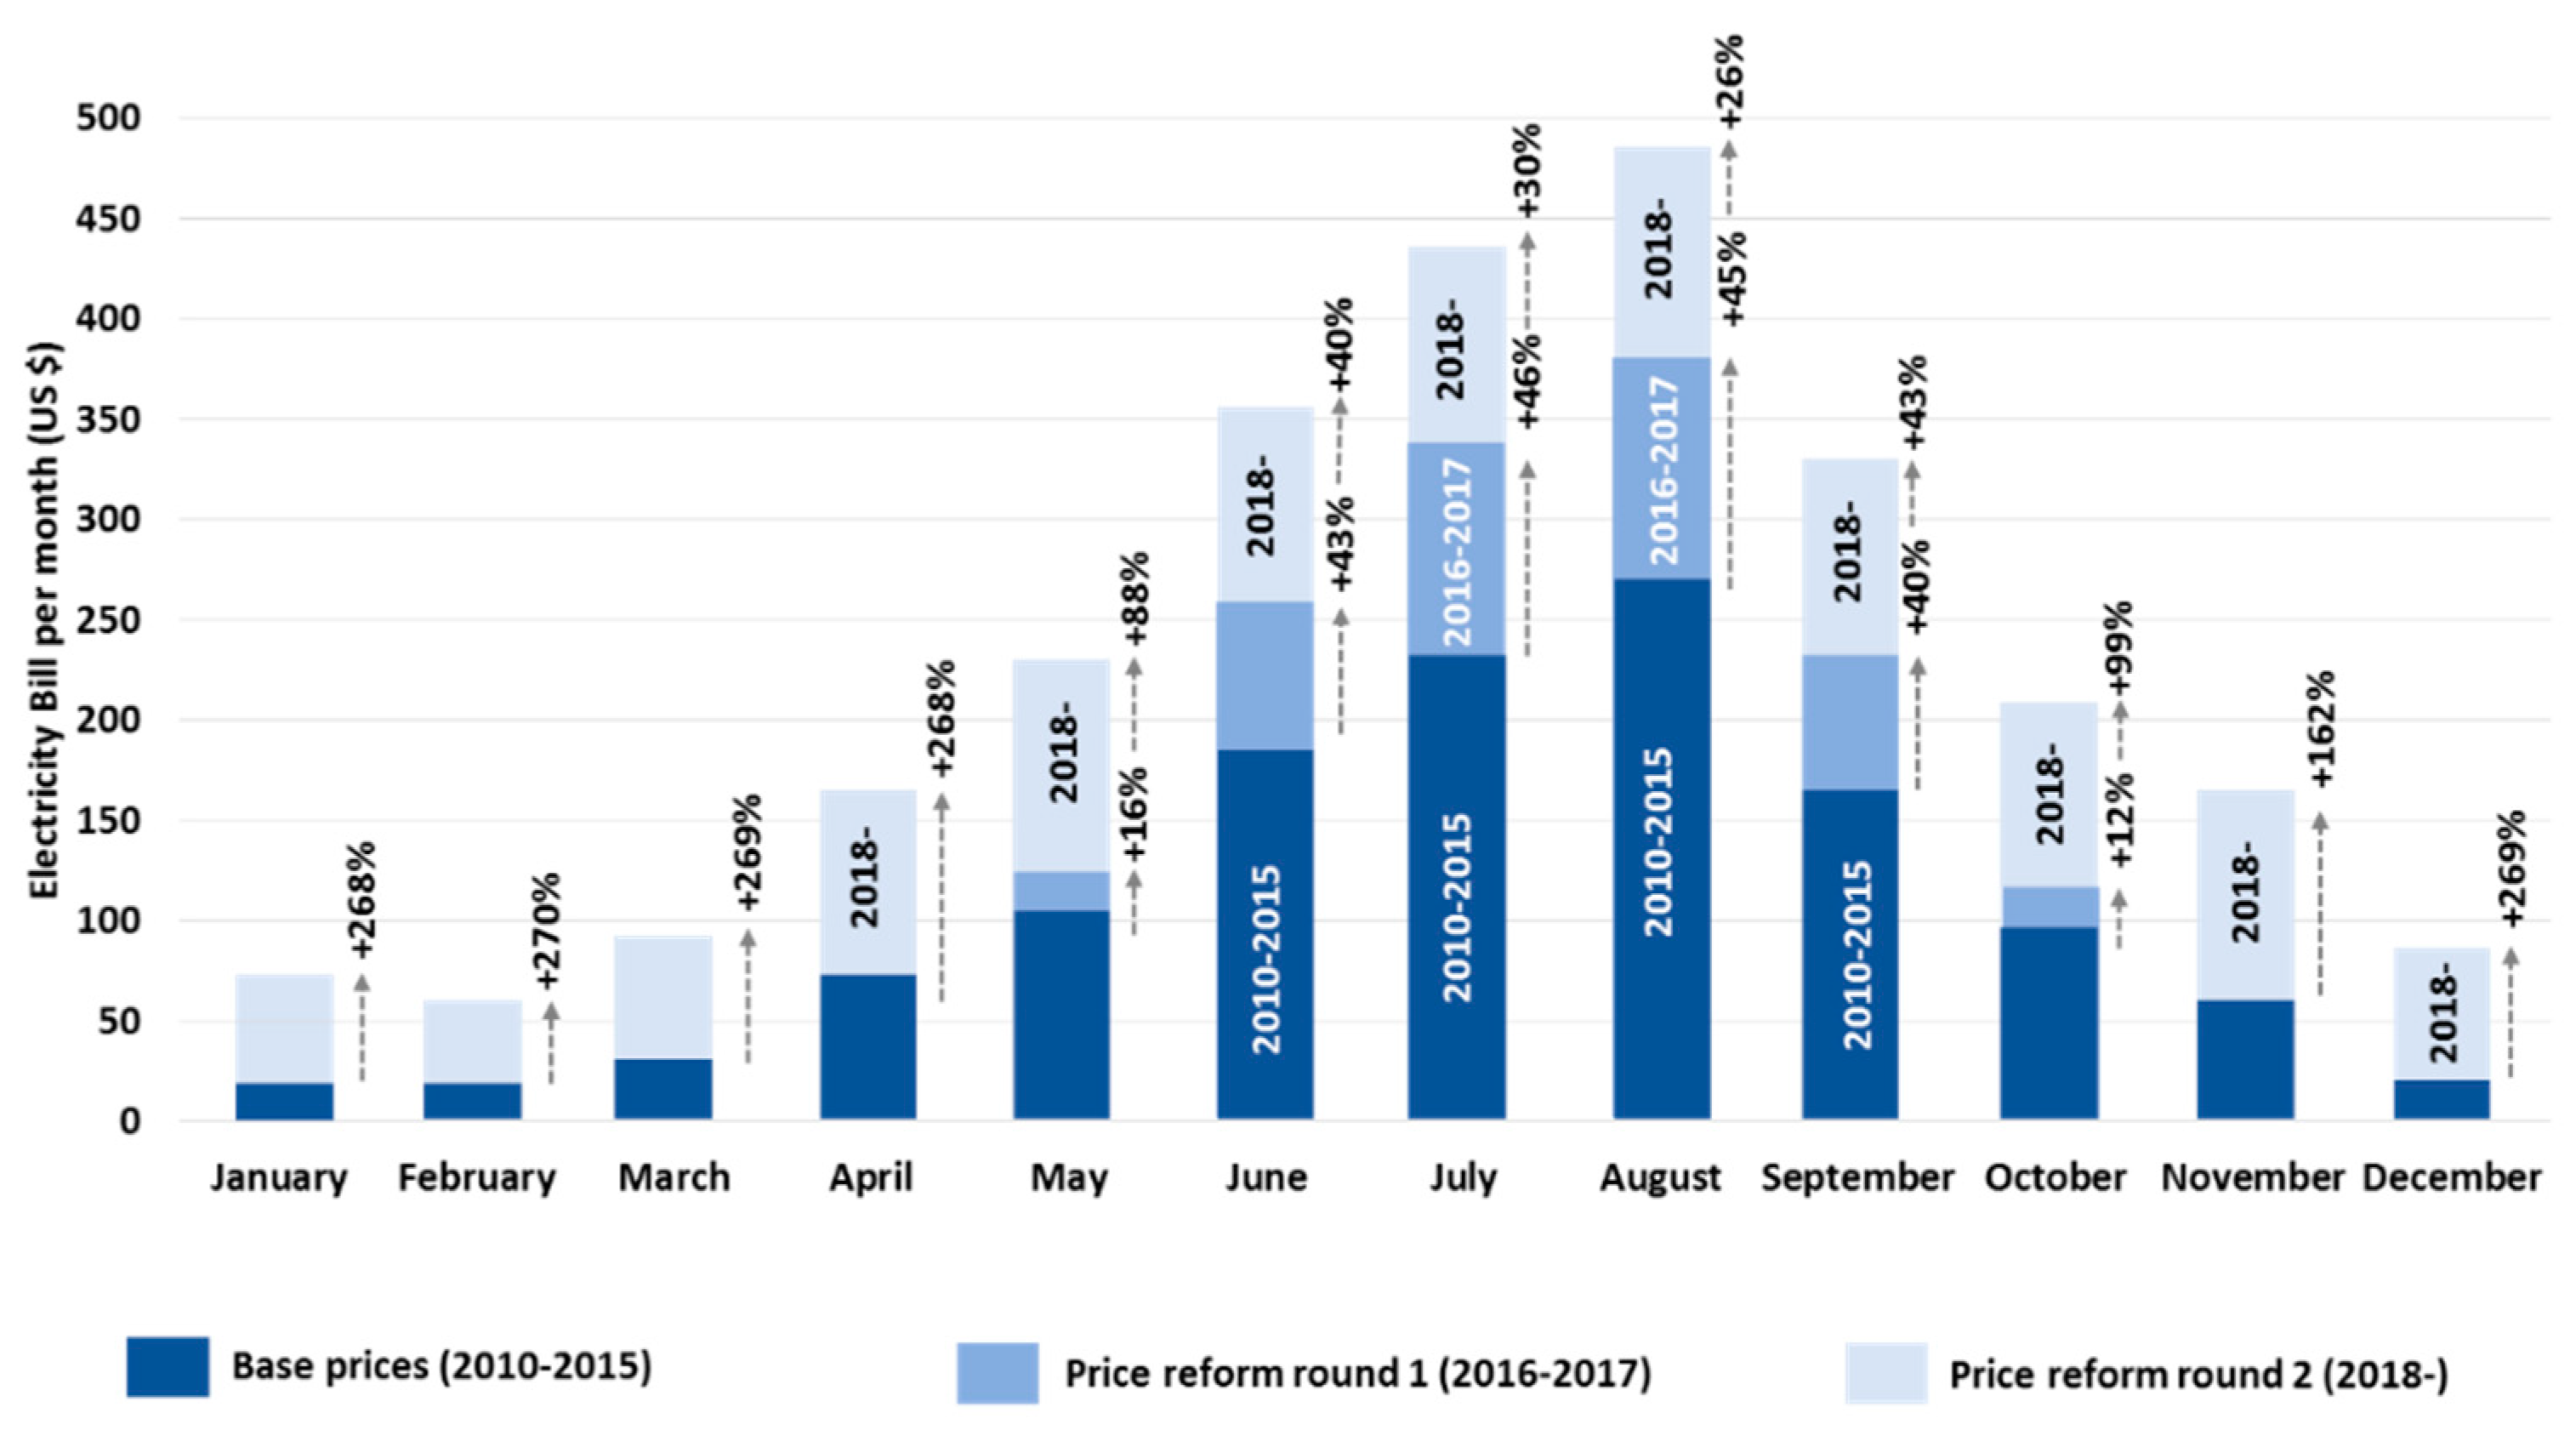
The SEC increased tariffs in 2016 and 2018 (
Figure 4), passing on these higher fuel input costs to the consumer. The winter bill for an indicative household has risen from around US
$20 to US
$70 per month (268%) and summer bills from around
$250 USD to
$450 USD per month (75%) (
Figure 5 and
Figure A3 in the
Appendix A).
To help offset increased living costs from higher energy and water prices and the introduction of a 5% value-added tax (VAT) (from January 2018), the Kingdom introduced a system of means-tested payments through its newly-established Citizens Account Program [
54,
55]. The monthly payment citizens are eligible for is dependent on income, financial assets and the number of family dependents.
As of April 2019, the total number of Citizen Account Program accounts opened was 3.76 million, split between accounts for entire households (61%) and accounts for individuals (39%). The Program had made 17 monthly payments, amounting to 40 billion SAR ($10.7 billion USD).
The figures released in April 2019 also included an attribution of the payments for different cost of living components. From the 40 billion SAR distributed, electricity constituted 28%, gasoline 25% and other (including VAT) 47%, meaning 53% of the Citizen Account payments compensate energy price reform.
The highest income band to qualify for the payments is 20,159 SAR (US $5375) per month, and the average monthly payment has been 1000 SAR (US $267). It is also important to note that the payment does not go up or down with living costs due to the seasonality of electricity bills.
Providing monthly cash payments has helped avoid the popular anger seen in other parts of the world when implementing similar reforms, such as in France with the ‘gilets jaune’, or ‘yellow vests’ movement. However, energy prices in Saudi Arabia are still low compared with other countries, and the price reform process is ongoing. For example, average household electricity prices in Australia are around US
$0.2485 per kWh, US
$0.1289 per kWh in the U.S., but only US
$0.048 in Saudi Arabia [
56].
Higher electricity prices in Saudi Arabia, initiated by the start of the energy price reform in 2016, represent a major shift in the relationship between the state and its citizens and how the country’s natural wealth is shared. They also represent an important natural experiment regarding energy prices and energy use. After briefly laying out our materials and methods, the next sections present our empirical analysis and results, which give some insight into the impact of such policies.
3. Materials and Methods
3.1. Data Sources
To investigate the temperature change in Saudi Arabia, the ECMWF ERA5 dataset [
6] has been used for the years 1970 to 2018. ERA5 is the latest and fifth generation of global climate reanalysis produced by ECMWF. The greatest advantages of this dataset include the provision of hourly data and fine spacial resolution (0.25 degrees latitude/longitude, or what is about 25 kilometres for Saudi Arabia). ERA5 reanalysis can thus be used to track atmospheric conditions at city levels and has found practical application in various climate change-related studies such as one conducted for the BBC [
3].
The dataset provides atmospheric, land-surface and sea-state parameters. This study uses the air temperature at 2 m above the surface of land, sea or in-land water. Temperature trends were obtained by plotting a linear rate of change over the sample period for geographical coordinates of key cities. The linear trend was fitted to yearly mean temperatures (the mean of monthly means of daily temperature means). A trend for summer temperature changes was obtained in the same way, where sample data included mean summer temperatures for each year from 1979 to 2018.
The SEC power generation data divides the Kingdom into four regions, with the majority of generation in the Western, Central and Eastern regions (
Figure 6).
Hourly electricity data was available for 2011–2015, except for 2012. Electricity data includes demand from all sources, the main groupings being buildings and industrial uses. SEC is the largest provider of electricity in the Kingdom, with a share of 66% of Saudi Arabia’s total electricity capacity [
57]. The SEC data excludes some independent electricity power generation produced by some large industrial users, such as cement plants and refineries. The SEC data also relates to the total amount of primary generation before transmission, distribution and other losses. For example, according to Enerdata [
56] in 2018 the total primary electricity generation was 351 TWh while total final electricity consumption was 285 TWh, implying losses of 19%.
The main portal for our annual energy data is Enerdata [
56,
58] downloaded as of September 2019. This sources primary information from the IEA [
59] and national sources including the Saudi Arabian Monetary Agency (SAMA) and the Saudi Energy Efficiency Center (SEEC) and is updated regularly as new information is released to inform the most recent year of estimates.
One important distinction between the hourly SEC data and Enerdata’s annual data for residential and commercial energy consumption [
58] is that the later is based on final electricity consumption after transmission and distribution losses. Final consumption data has an advantage over the hourly primary SEC generation data by being able to distinguish electricity use by each sector (buildings and industry). Within the buildings sector the use of electricity it is disaggregated into residential users and commercial (services) users. For example, in 2018 total final electricity consumption of 285 TWh comprised of 41 TWh used for industry (14%), 144 TWh used for residential buildings (51%) and 100 TWh used for the services sector (35%). This suggests around 86% of the total final electrical demand comes from buildings.
Enerdata then further disaggregates buildings electricity consumption according to end use (cooling, lighting, hot water, cooking, etc.) using information supplied by SEEC. For example, in 2018 the total electricity demand from cooling for the residential and services sectors was 101 TWh and 70 TWh respectively constituting around 70 of the total electrical demand for each sector.
Annual data on electricity fuel inputs and CO
2 emissions from electricity were obtained from [
56]. The two main fuel inputs are natural gas and oil-based liquid fuels. Oil-based fuels include crude oil, heavy fuel oil, diesel as well as some other oil products. While the dynamics of these individual fuels can be assessed using monthly data from the Joint Oil Data Initiative (JODI) it was beyond the scope of this paper to evaluate these trends. This would be a useful exercise for future research on the Kingdom’s changing CO
2 emissions.
3.2. Analytical Approach
The capital, Riyadh [24.75° N 46.75° E] was chosen as a representative location for temperature evaluation in the Central region, as the majority of the Central region population is concentrated in this city. Temperatures for each of the rest of the regions were identified by averaging temperatures in their respective key cities. The temperature in the Eastern region was determined by the average across Dammam [26.50° N 50.00° E] and Dhahran [26.25° N 50.00° E]. The temperature in the Western region was determined by the average across Jeddah [21.50° N 39.25° E] and Mecca [21.50° N 39.75° E]. The Southern region temperature was estimated as the average across Al Baha [20.00° N 41.50° E], Abha [18.25° N 42.50° E], Khamis Mushait [18.25° N 42.75° E], Najran [17.50° N 44.25° E] and Jazan [17.00° N 42.75° E]. National temperature changes were obtained by averaging the temperature data points from ERA5 on a latitude/longitude grid inside the boundaries of the Kingdom. We took into account latitude cosine correction, as the distance between each degree of latitude decreases as the distance from the equator increases. This accounts for the fact that points further from the equator should be assigned less weight when calculating countries’ average weather values.
We used hourly data from the ECMWF ERA5 dataset and paired it with the SEC’s hourly electricity generation data to perform correlation analysis between temperature and power. We performed the correlation analysis for each individual year using a Pearson correlation test in Matlab including 8760 paired data points in each year and selected 2015 (the most recent) for illustrative purposes. While total generation increased on average by 6% per year from 2011 to 2015, the correlation coefficients between temperature and power generation were relatively stable (
Table A1 in
Appendix A).
We then used OLS regression to obtain an estimate of the amount of power generation added for each 1 °C increase in temperature throughout the year in each region. We conducted the OLS analysis for each year individually and again selected 2015 for illustrative purposes (for detailed regression results see
Table A2 in
Appendix A). The relationship between hourly temperature and hourly power generation was highly significant in all regions with all
p values very close to zero. In the summary table in the appendix we have shown the relevant t-statistic values. These indicate that the trend of linear regression is significant for all the tests at a 99.99% confidence level. While the strength of the relationship means a simple linear functional form provides a robust general result, further research could explore the evidence of nonlinearity especially in the Eastern and Central regions. It should also be noted that the
values describing the level of power generation added due to temperature change are higher in each subsequent year from 2011 to 2015 reflecting the increase in overall power generation over this period.
To assess post-2016 trends in electricity consumption and the impact of energy price reform, energy efficiency and fuel switching policies we employed descriptive statistical analysis of annual final electricity consumption in the residential and commercial sectors, the fuel mix from primary electrical generation and the associated CO2 emissions from 2010 to 2018.
4. Results
4.1. Local Warming Trends (1979–2018)
The ECMWF ERA5 dataset is consistent with previous studies on temperature characteristics of the Arabian Peninsula.
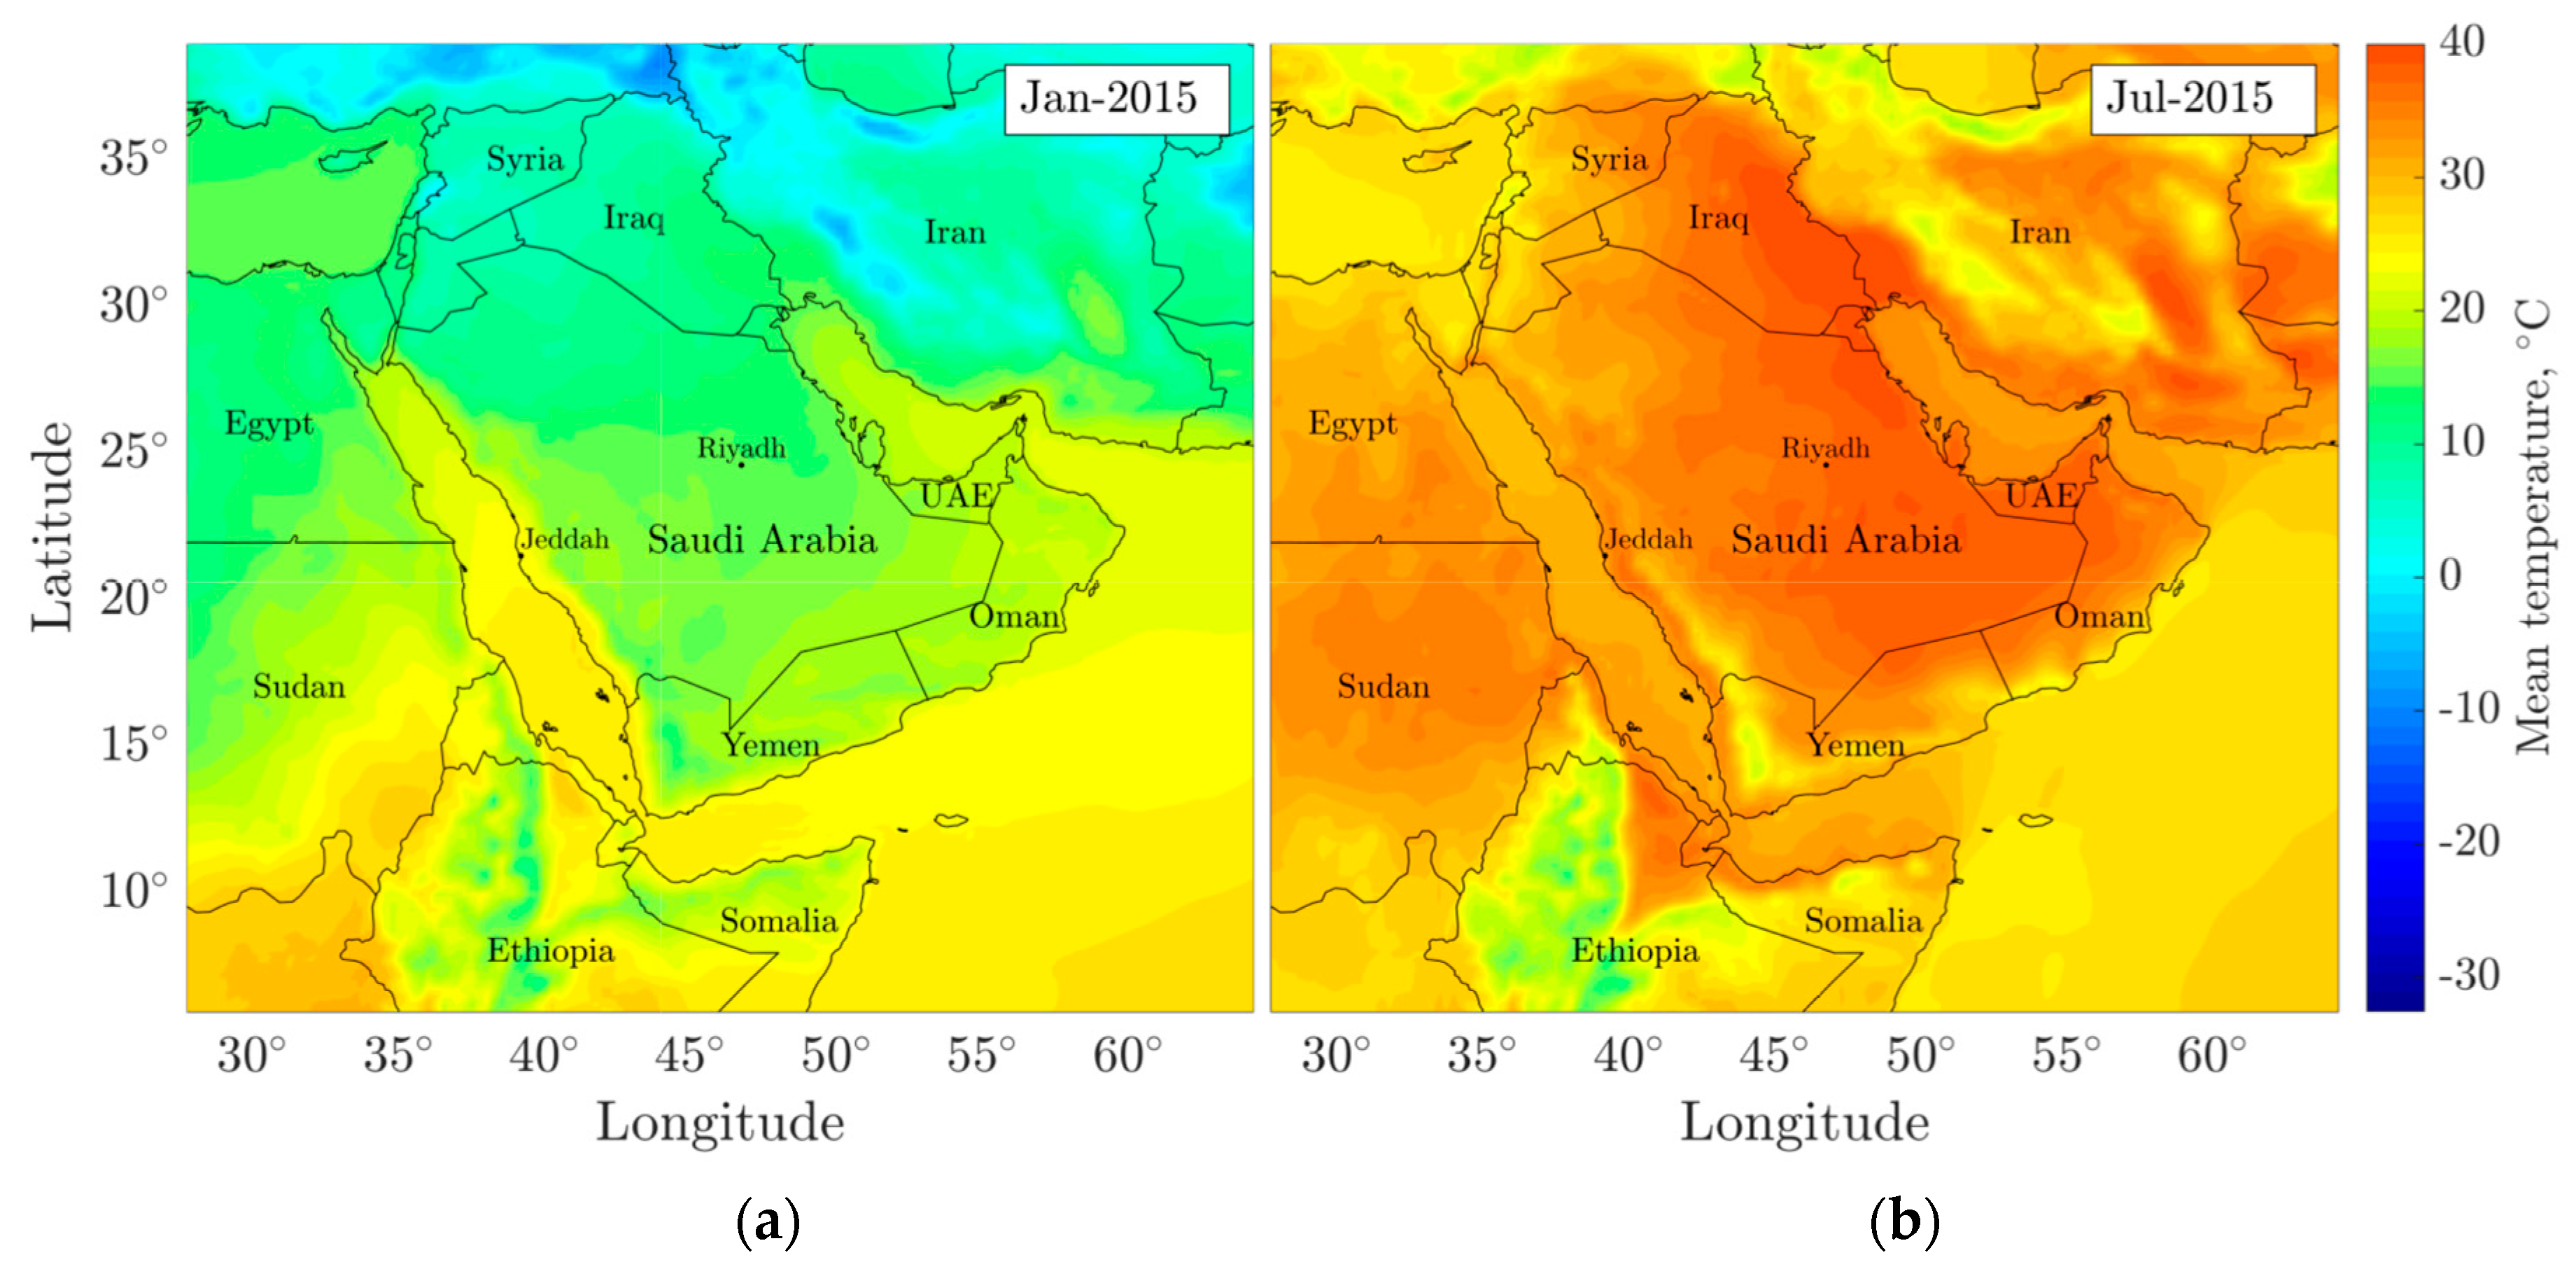
Figure 7 and
Table 1 describe the monthly mean of daily temperature means for January and July 2015, and the key temperature characteristics in each of the four electricity generation regions. We chose 2015 as the representative year as this is the most recent year for the detailed electricity data from the SEC.
In 2015, January temperatures ranged between 15 °C to 20 °C, while July temperatures were within a 30 °C to 40 °C range. About half of all territory in Saudi Arabia, predominantly in the east, experienced summer highs of 45 °C in 2015. Only in very few locations in the south-west and north-west did average temperatures in the summer months stay below 30 °C.
Compared to the previous and following years, 2015 was neither hot nor cold, with annual and summer temperature means close to 2012–2018 averages (
Table 1). This also makes 2015 a good year to use for illustration.
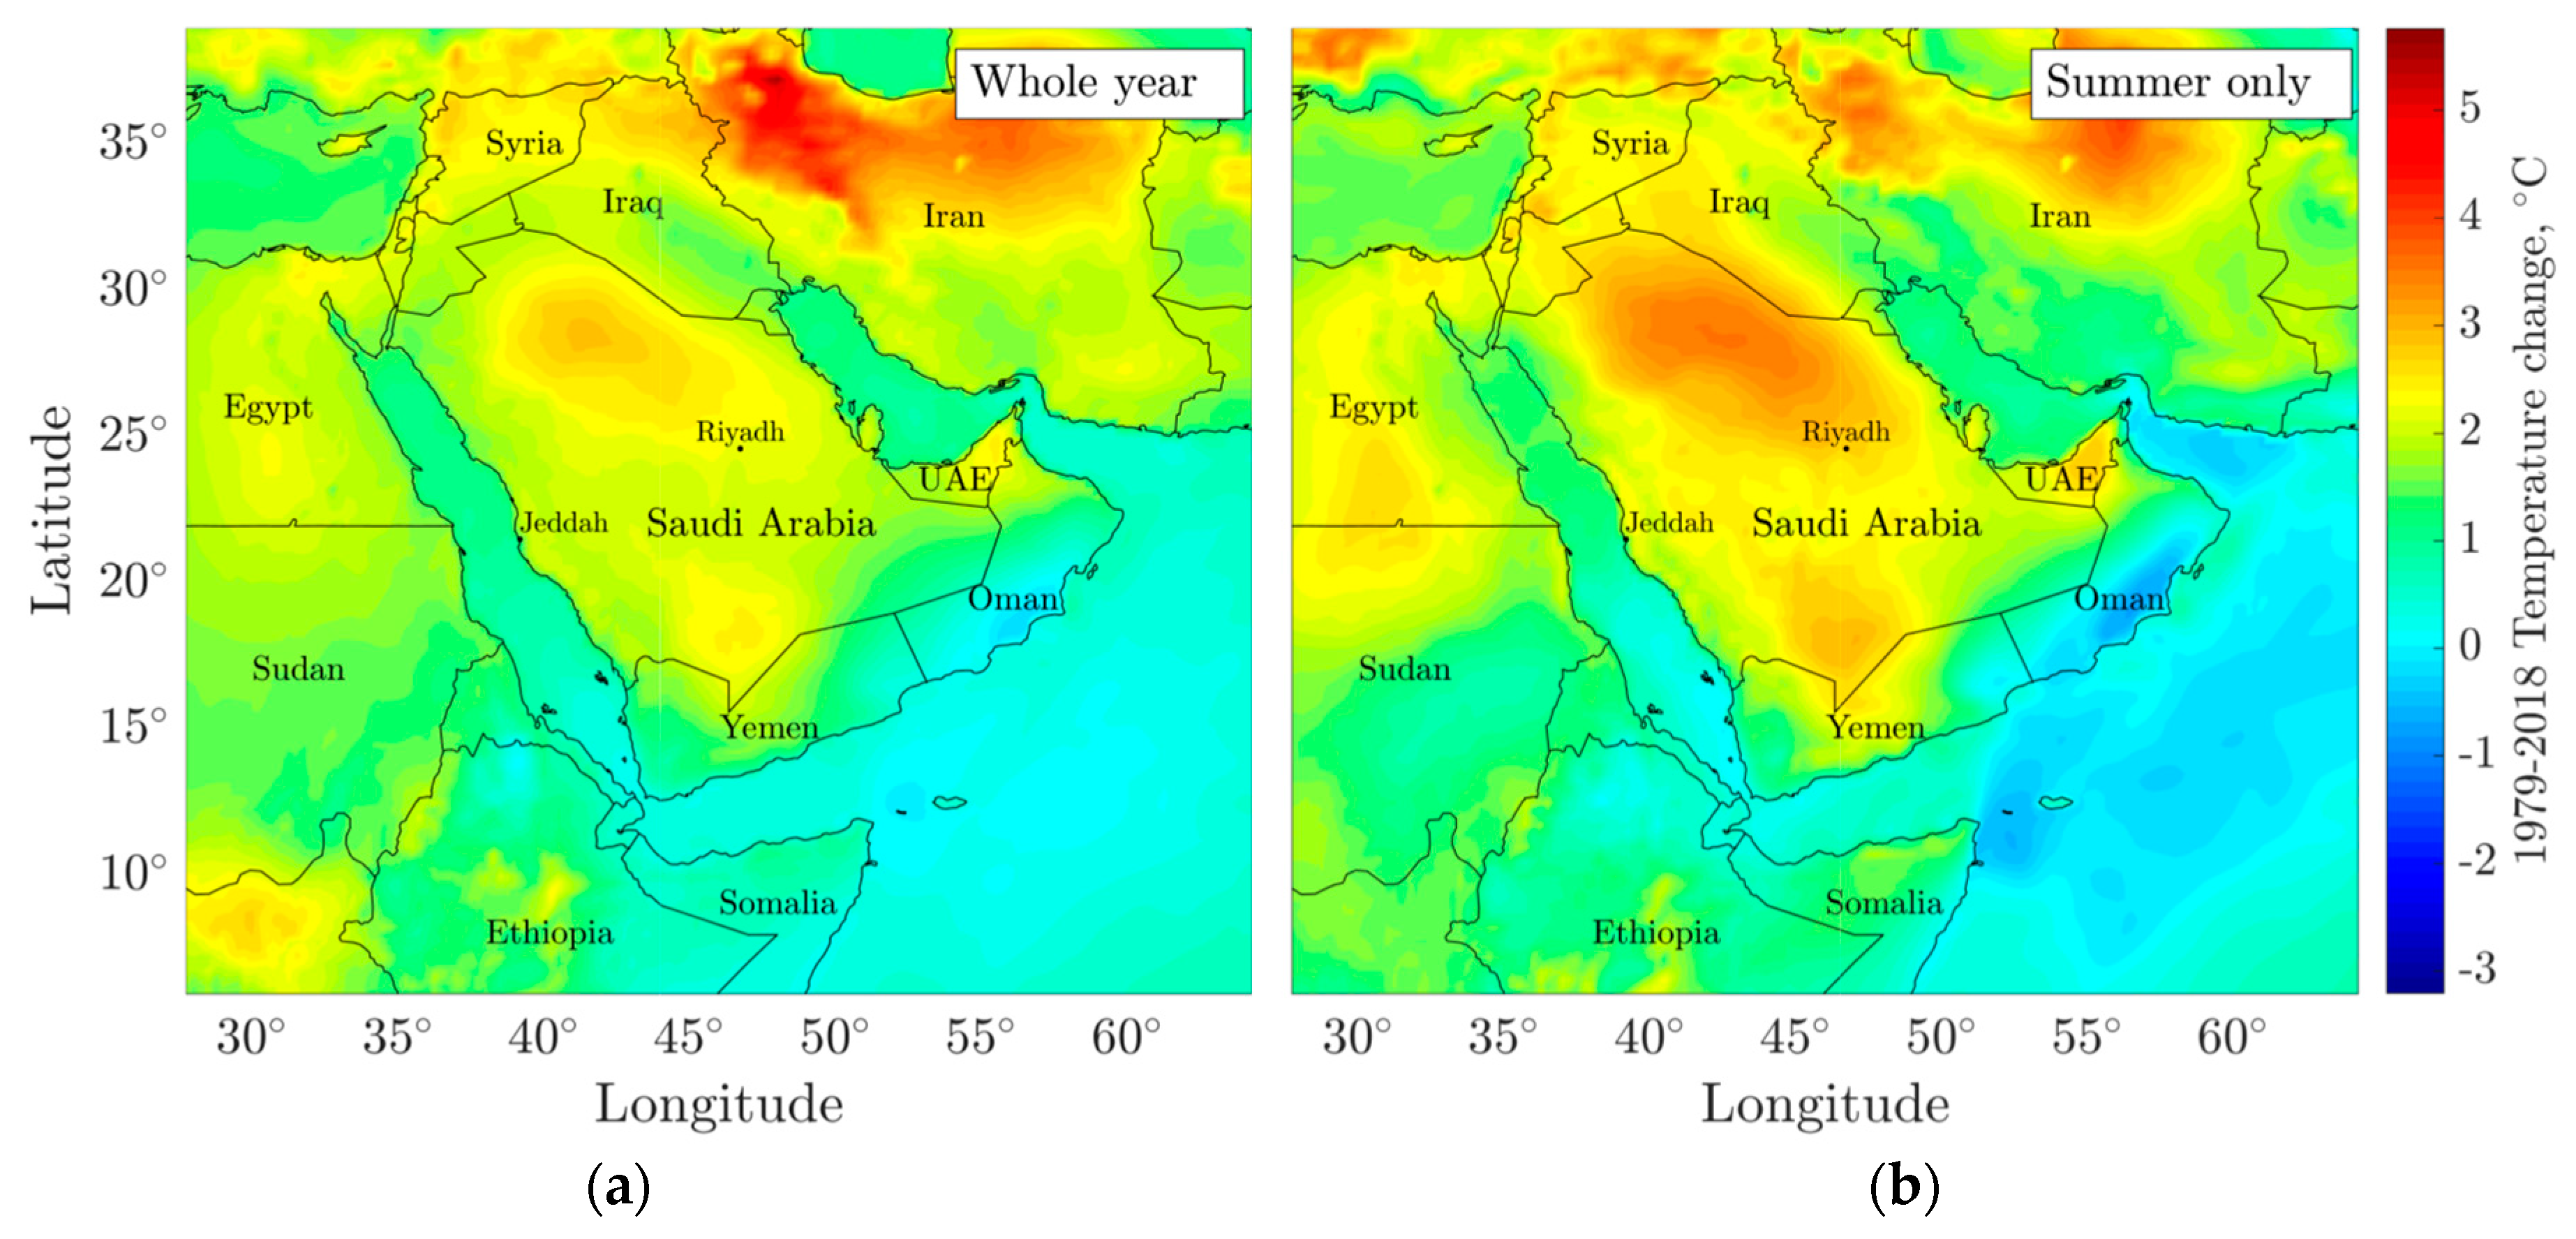
Figure 8 and
Figure 9 use historical data from the ECMWF ERA5 dataset to show the temperature changes across the Arabian Peninsula and the surrounding regions for the 40 years from 1979–2018. On average, Saudi Arabia has warmed by about 1.9 °C since 1979, which equates to around 0.471 °C per decade or 0.047 °C per year. Mean summer temperatures increased at faster rates for most of the country. If only summer months are considered, the warming is 2.2 °C degrees on average across the whole country, or 0.557 °C per decade and 0.056 °C per year.
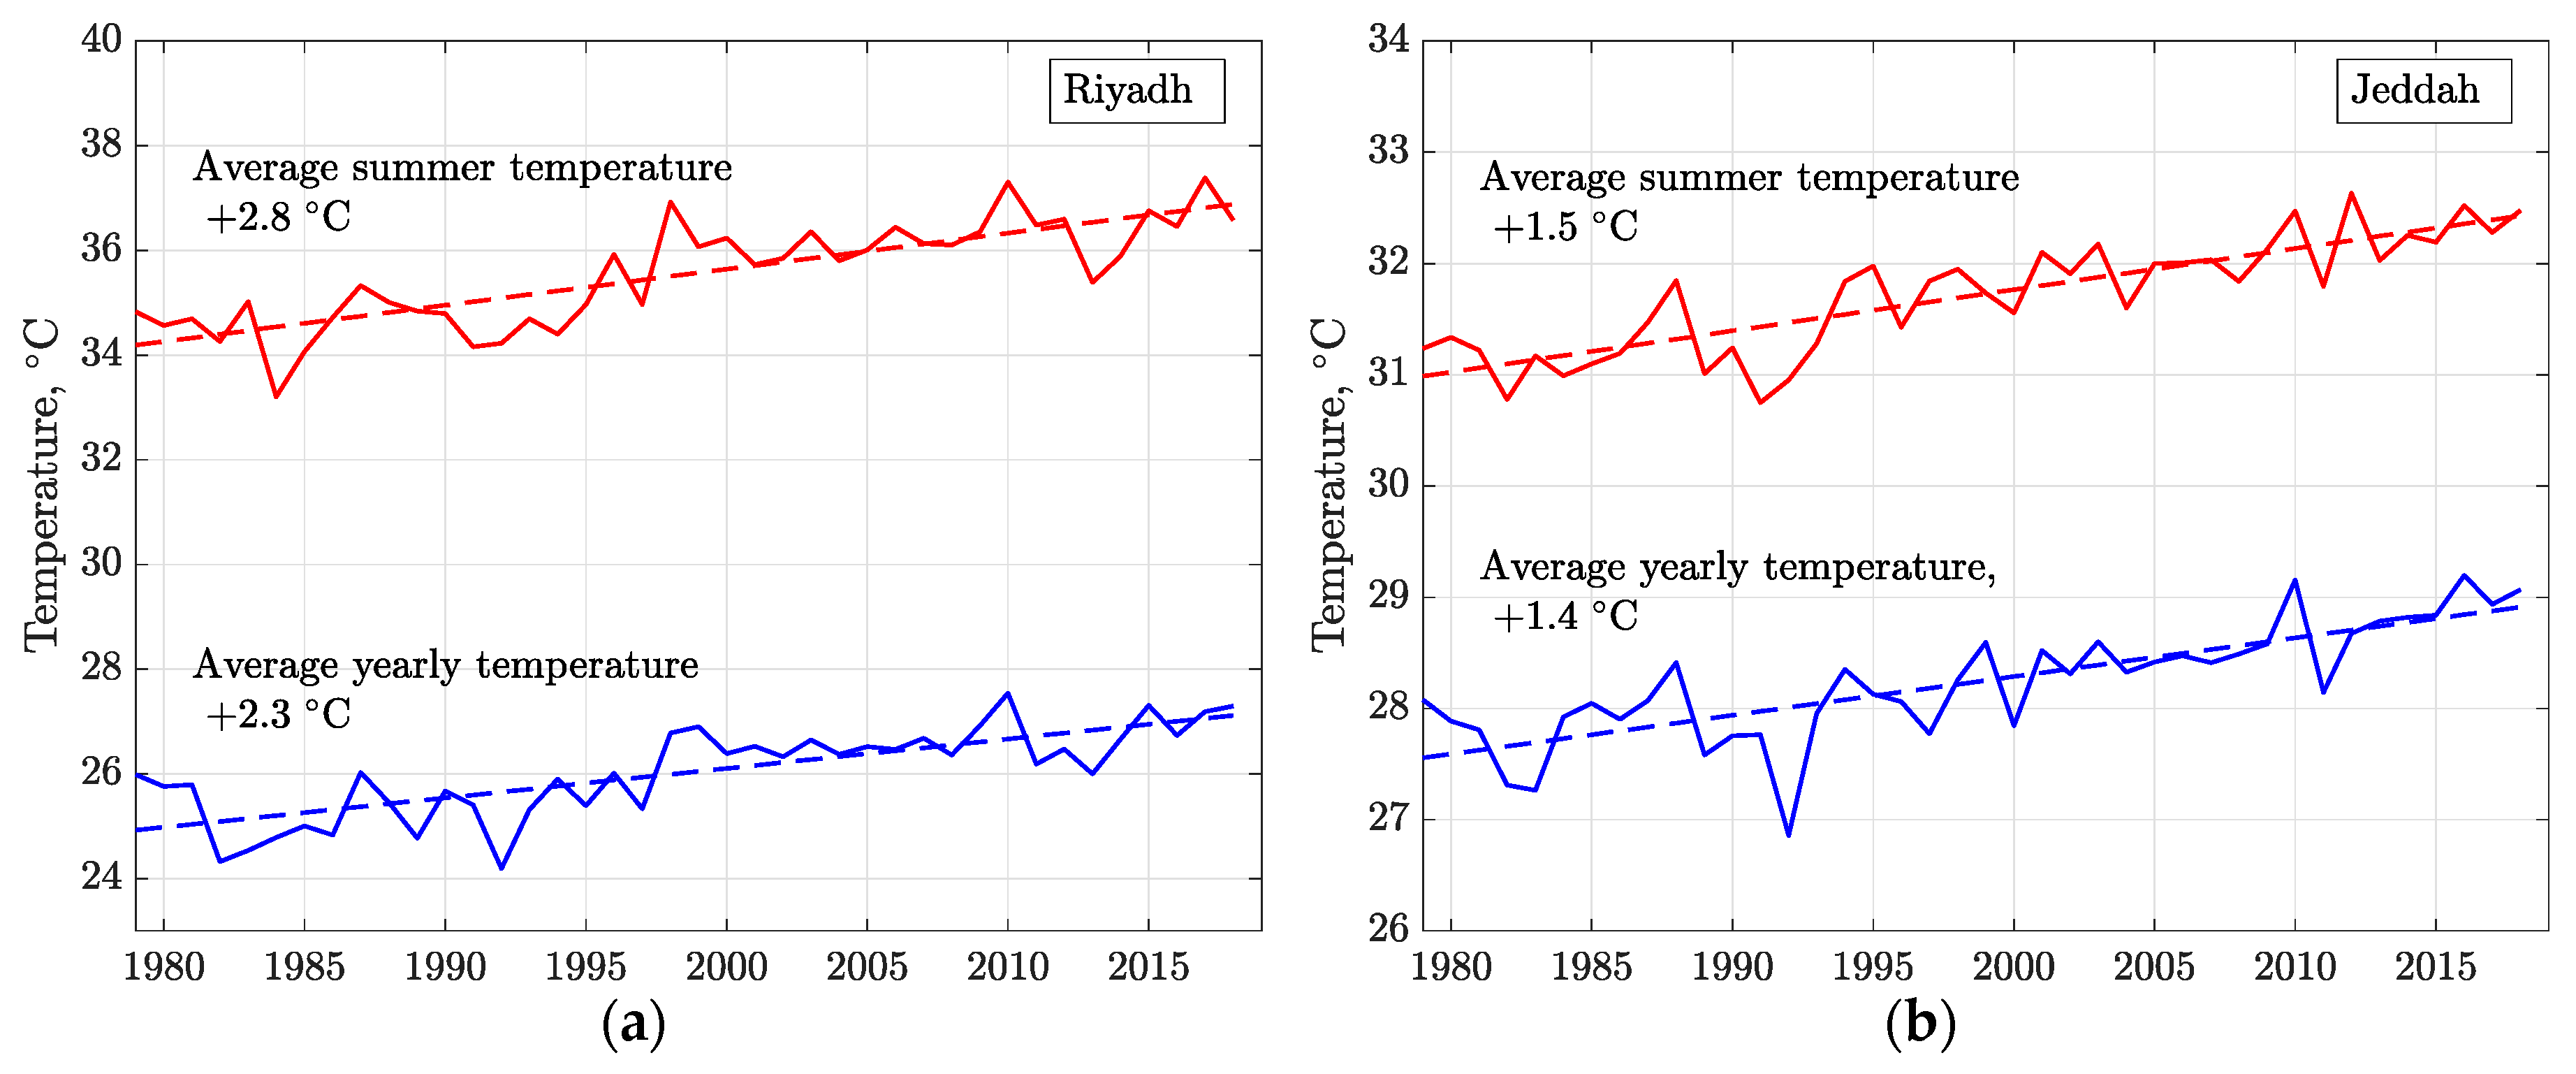
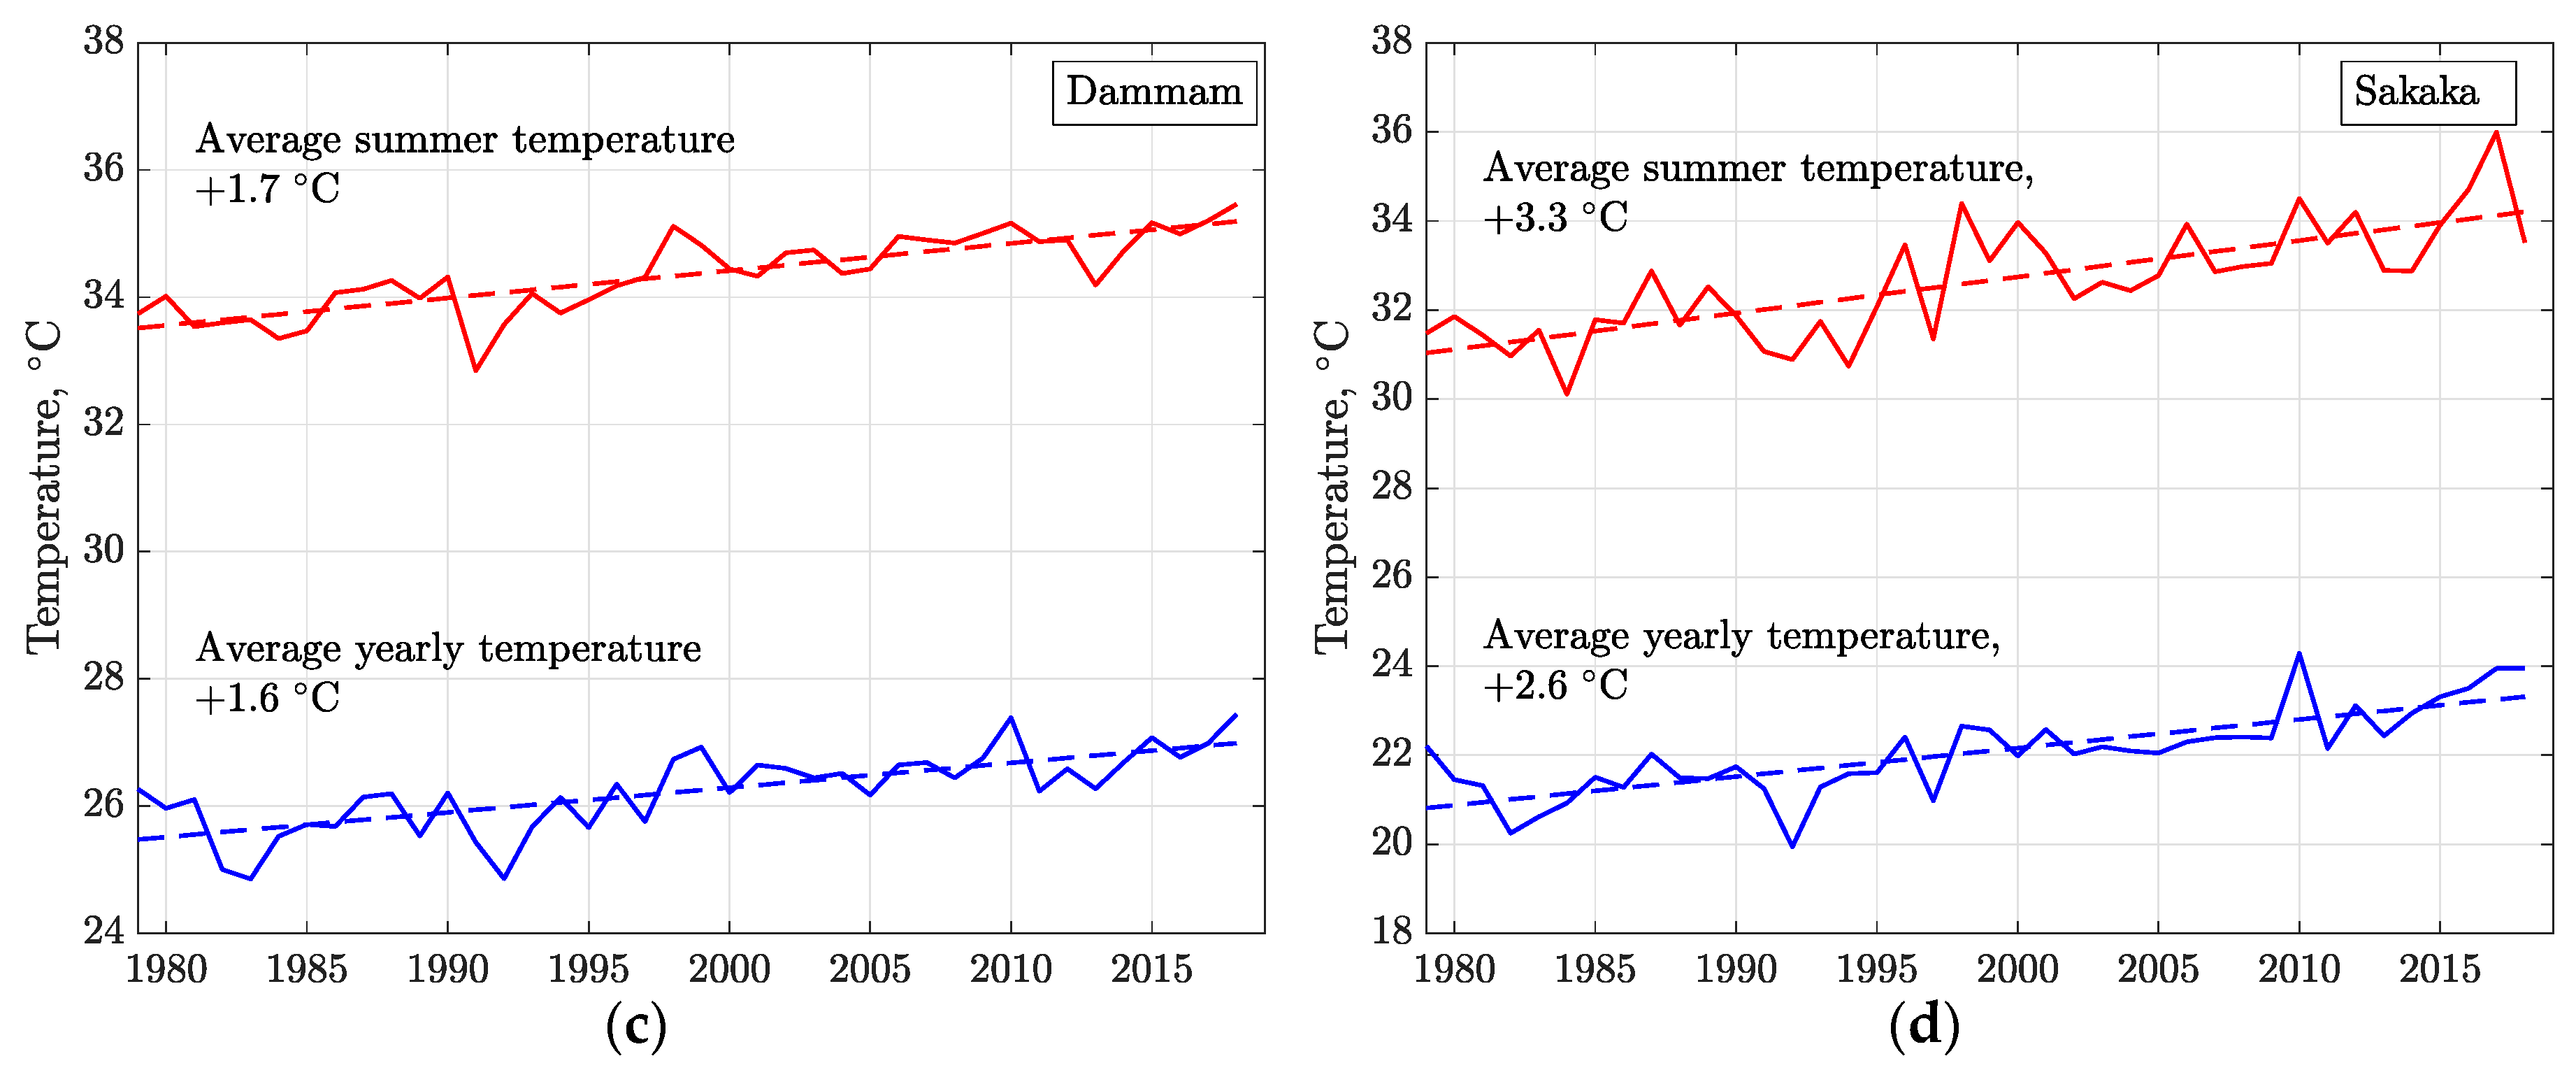
The coastal areas warm less compared with inland areas with the Red Sea providing better thermal regulation compared with the Persian Gulf. For example, in general, Jeddah remains cooler than Dammam. The northern parts of the Kingdom are experiencing the most intense warming, especially during summer. For example, in Sakaka (in the north-west of the country), the average summer temperature has increased by 3.3 degrees since 1979. The capital, Riyadh has also seen dramatic temperature rises, of around 2.3 °C and 2.8 °C for whole years and summer months, respectively (
Figure 9). Warming is most limited in the northwest, southwest and southeast of the country. For example, the Neom project, aiming to be a new ‘city of the future’ on the border with Egypt and Jordan, is in one of these zones.
4.2. Intra-Year Seasonality of Electricity Generation
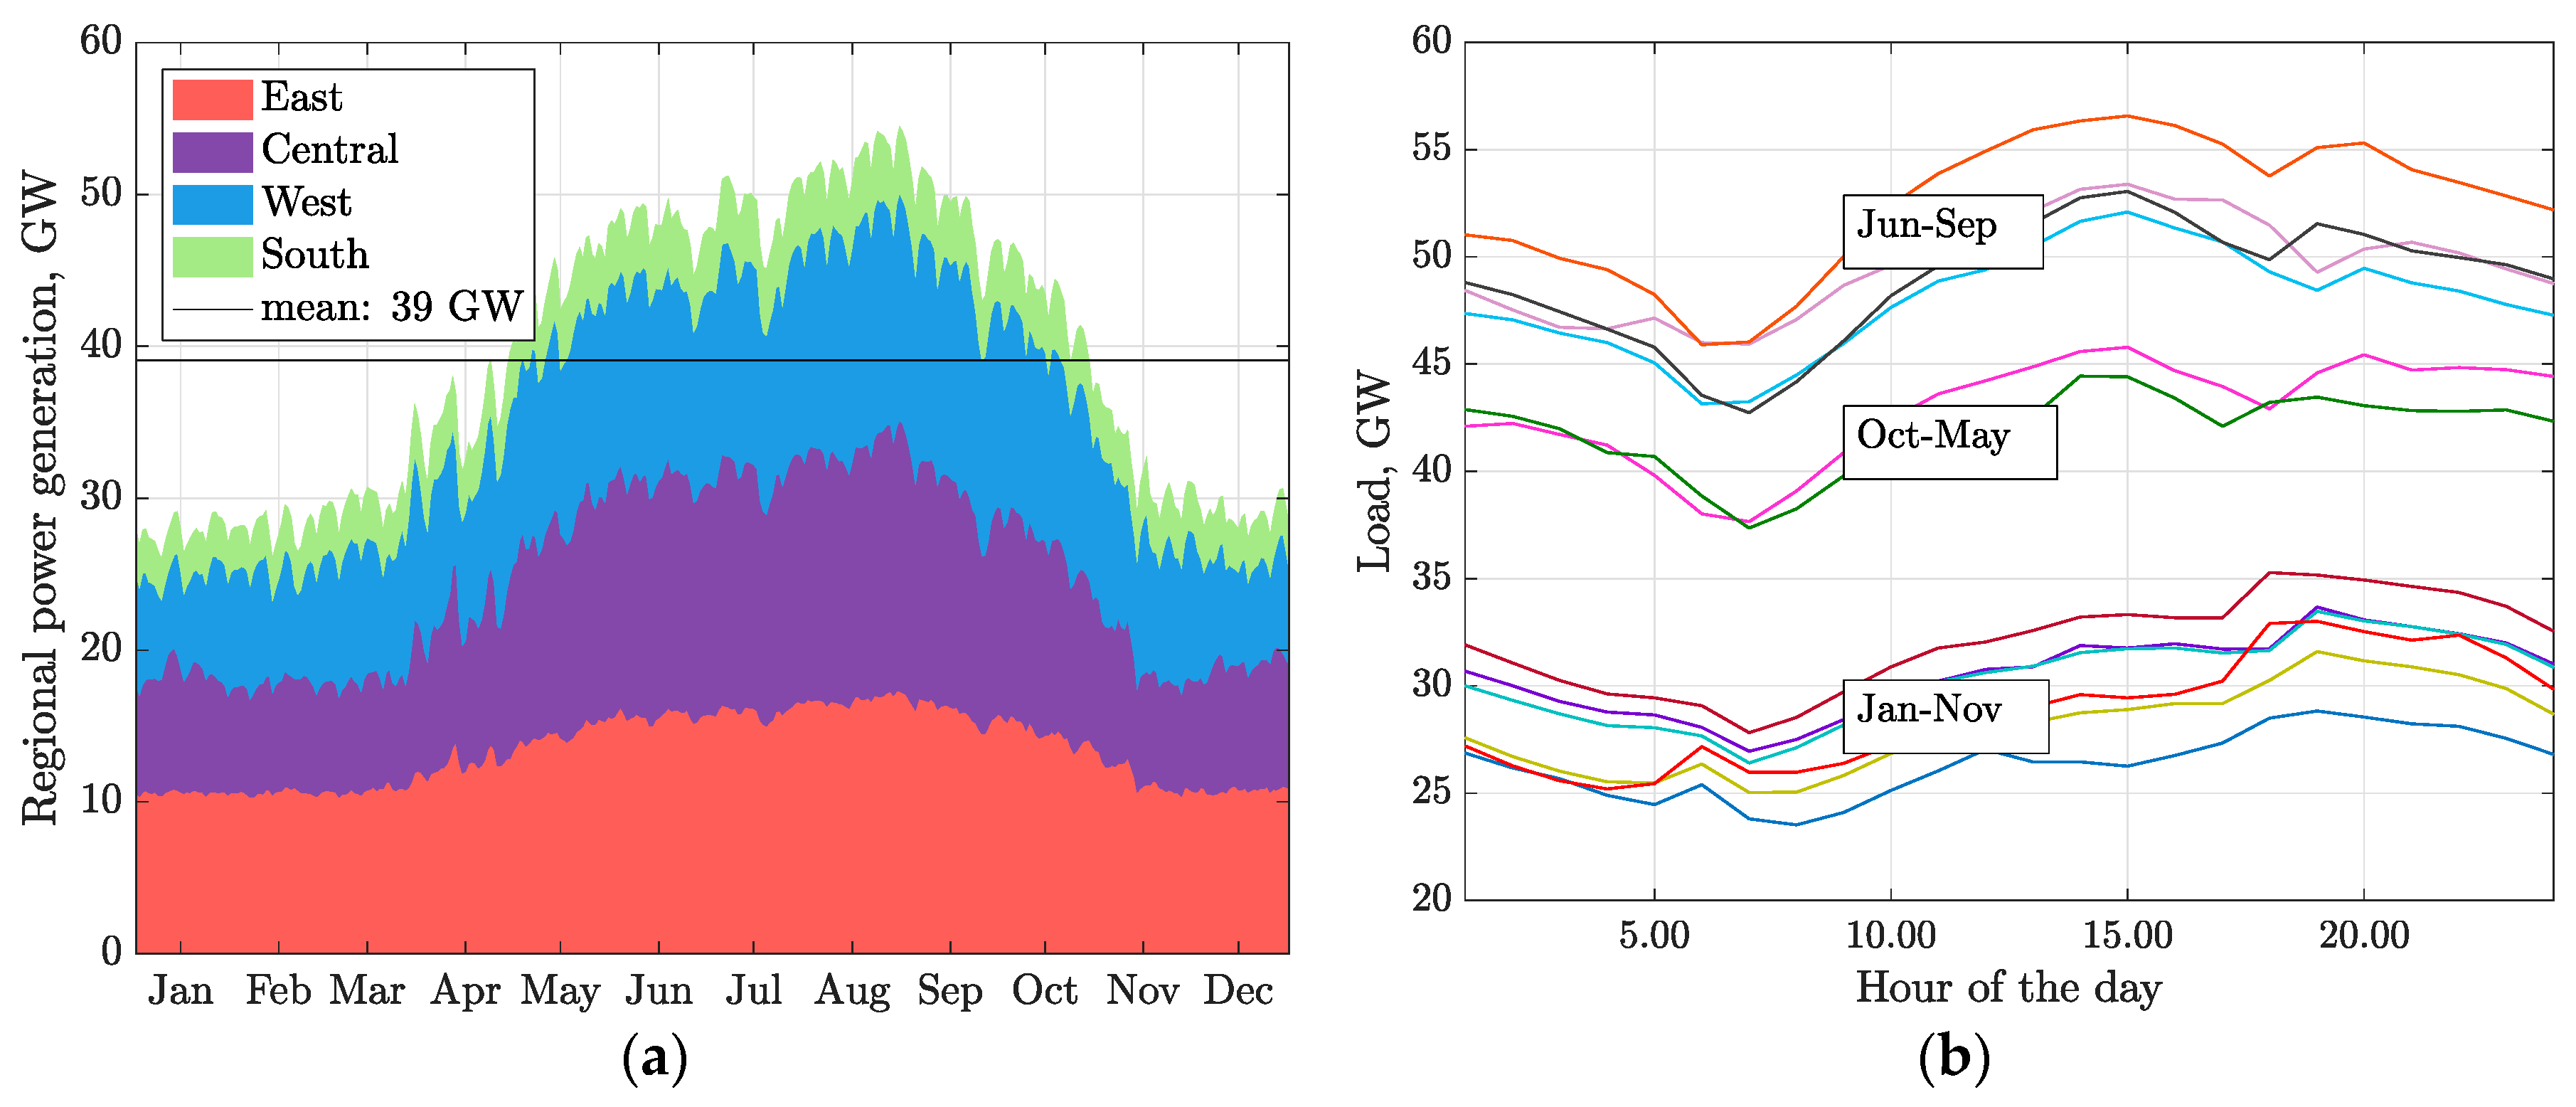
Driven by the extreme shift between winter and summer temperatures within a year and the demand for cooling, daily electricity generation in August or July may be almost two times higher than in December or January (
Figure 10). In 2015, during specific summer days, power generation reached around 60 GW, while during the winter it was as low as 23 GW.
It is also important to note that variations in the daily power load curve profile are the highest during summer, especially in July and August, where the difference between peak and off-peak hours reaches 13 GW. In summer, this accounts for approximately 20% of the SEC’s total capacity. In contrast, during winter in 2015, the difference between peak and off-peak power production did not exceed 9 GW and in some days was less than 5 GW. Such high daily variation in the load profile provides a rationale for load smoothing technologies such as chilled water or ice storage and district cooling to help level peak loads, especially for commercial buildings.
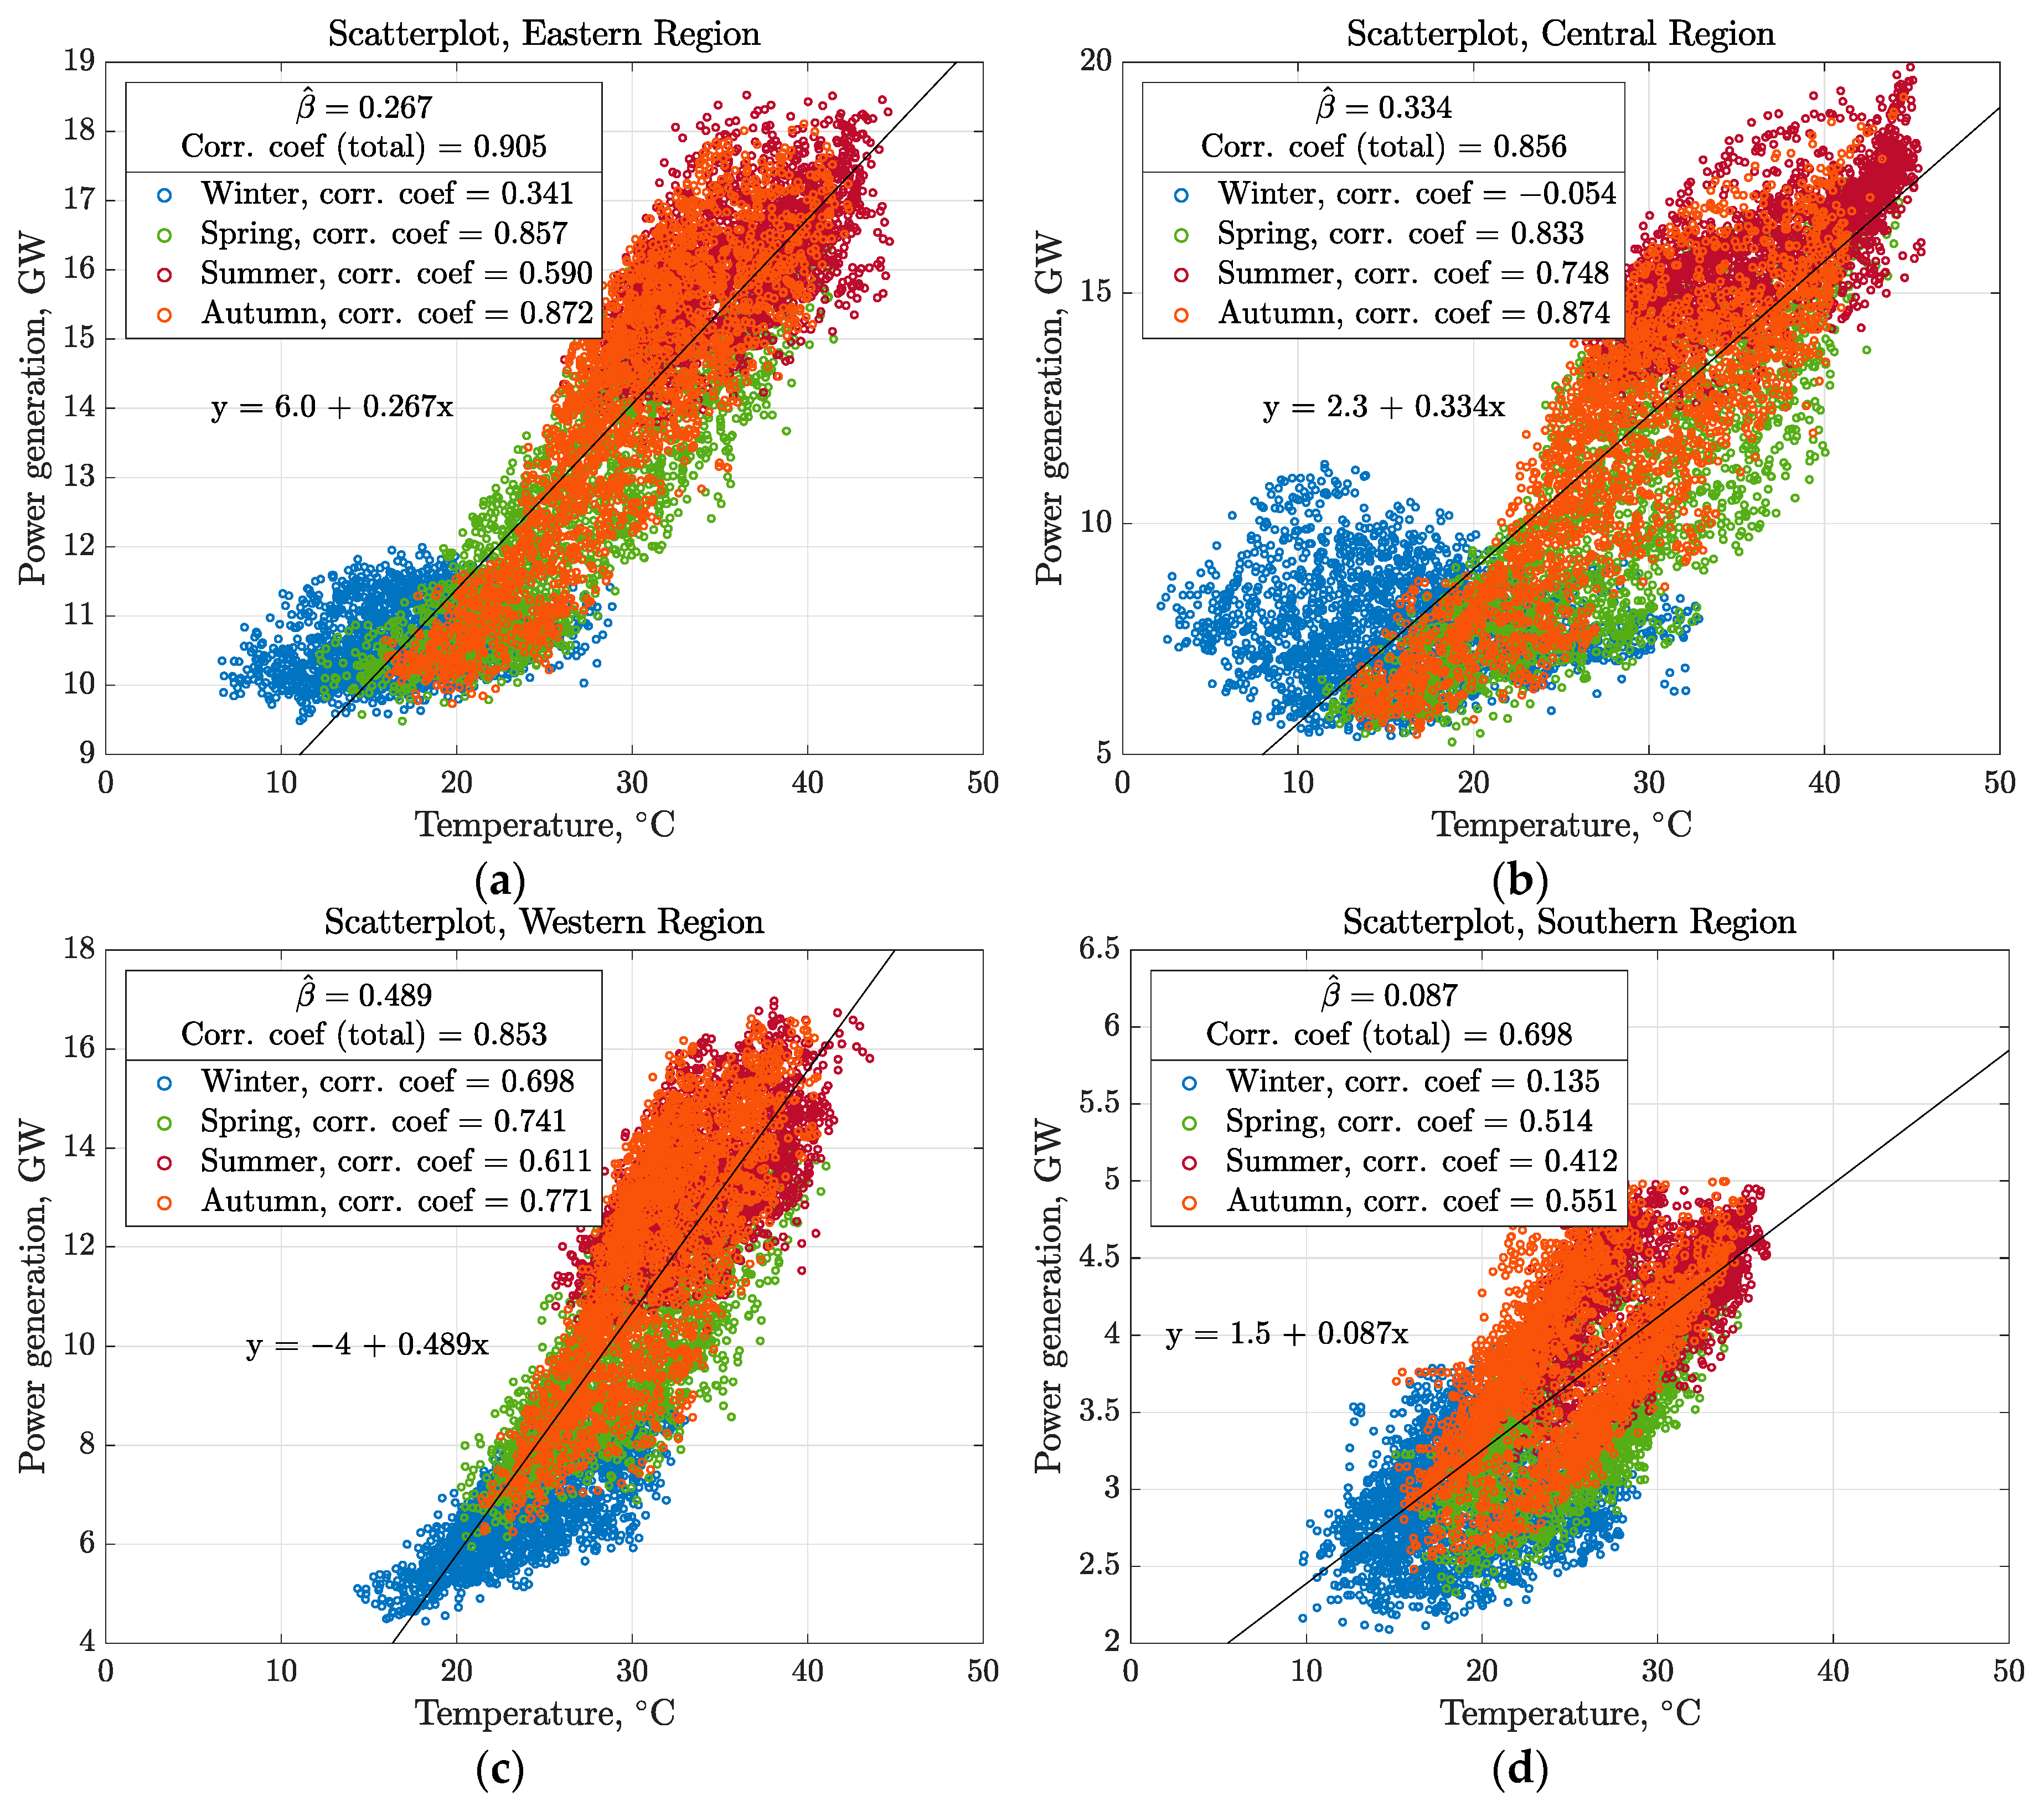
The scatterplots of hourly power generation and hourly temperature for the four regions of Saudi Arabia are shown in
Figure 11 using data from 1 January to 31 December 2015. As expected, temperature and electricity generated are strongly positively correlated in every region. Across the year, the strongest correlation exists in the Eastern, Central and Western regions, where 91%, 86% and 85% of the change in electricity generation is associated with temperature variation. The correlation coefficient is lower in the cooler southern region, where temperature changes are associated with around 70% of the variation of power generation.
The values for the ordinary linear regressions for each region with temperature as an explanatory variable give an indication of the increase in electricity generation associated with each 1 °C of warming, as each region transitions from winter to summer. These are 267 MW for the Eastern region, 334 MW for the Central region, 489 MW for the Western region and 87 MW for the Southern region in 2015. This increase represents around 2.0% of average power generation in the Eastern region, 2.9% in the Central, 4.6% in the Western and 2.4% in the Southern region. The Western region adds the most electricity for each degree of temperature increase suggesting a higher intensity of AC use relative to the rest of the country. Overall, approximately 1.177 GW is added nationally for every 1 °C increase in temperature from winter to summer.
Figure 11 also distinguishes each season, with autumn and spring exhibiting the strongest link between temperature and power generation. A likely reason for this is that people manage their AC loads more actively during these months, depending on the temperature. The lower correlation coefficient for summer is likely because, once temperatures reach a certain level, people leave their air conditioning on continuously—the variation in electricity demand is related to external temperatures and thermostat settings. This provides a rationale for ‘smart’ ACs with networked connectivity to help consumers manage AC usage more actively in hot months, especially when they are not in their dwelling or a particular room.
In winter, we see lower correlation coefficients, especially in the dry Central region, where variations in temperature and power generation are essentially unrelated. This is not the case for the coastal regions where temperature variation still accounts for between 34% and 75% of the change in electricity generation. The lower correlation coefficients may also be due to the use of AC units for heating as temperatures fall below 18 °C.
The Central and Eastern regions show evidence of a non-linear relationship between temperature and power generation, with power generation relatively less responsive to temperature until temperatures of around 22 °C are reached. This contrasts with the Western and Southern regions, where power generation generally increases linearly. This could be due to the higher proportion of industrial electricity demand in the Eastern and Central regions, which is less influenced by temperature.
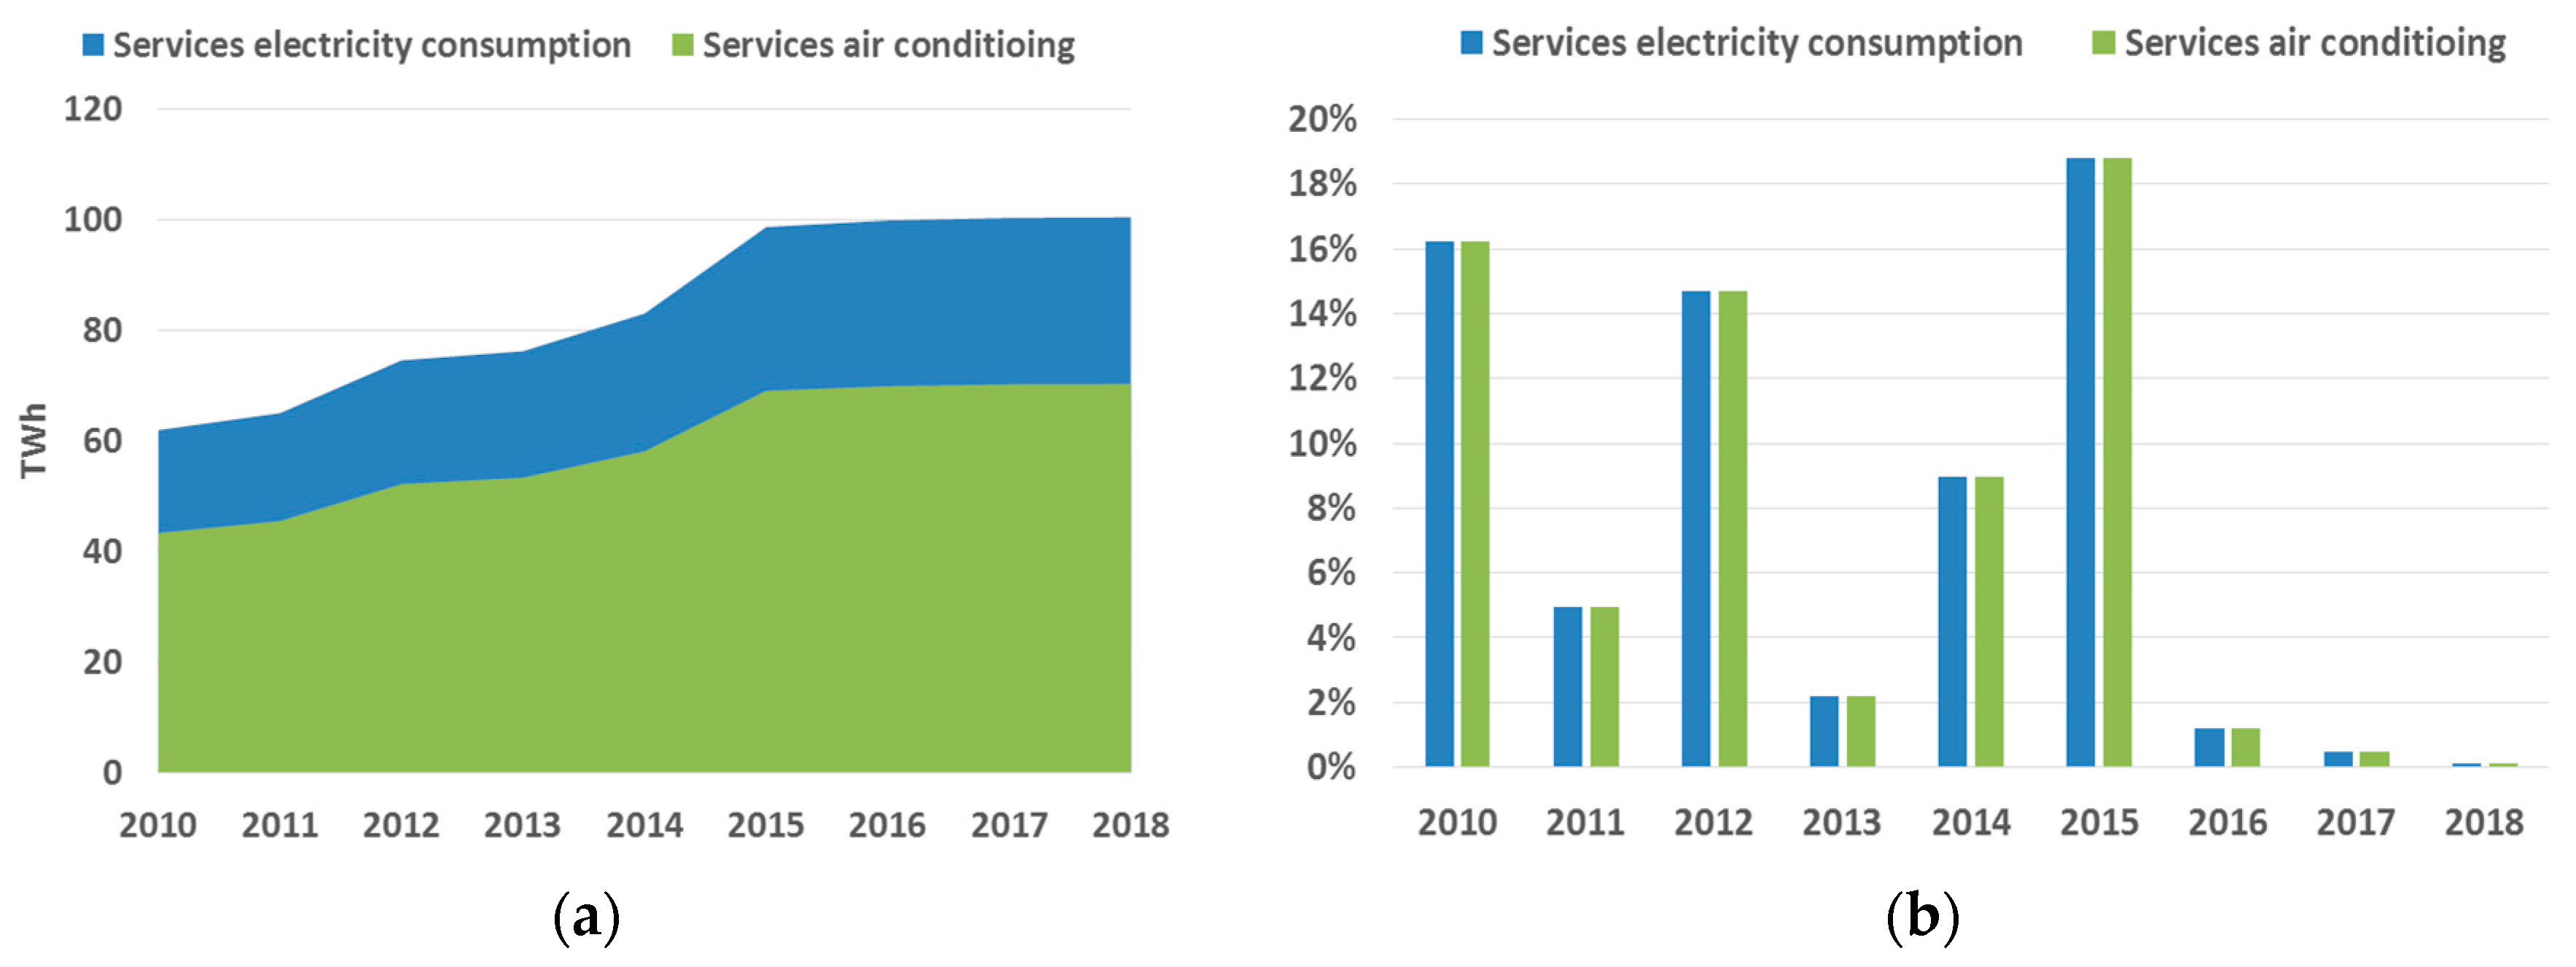
4.3. Share of AC in Total Electricity Demand from Buildings
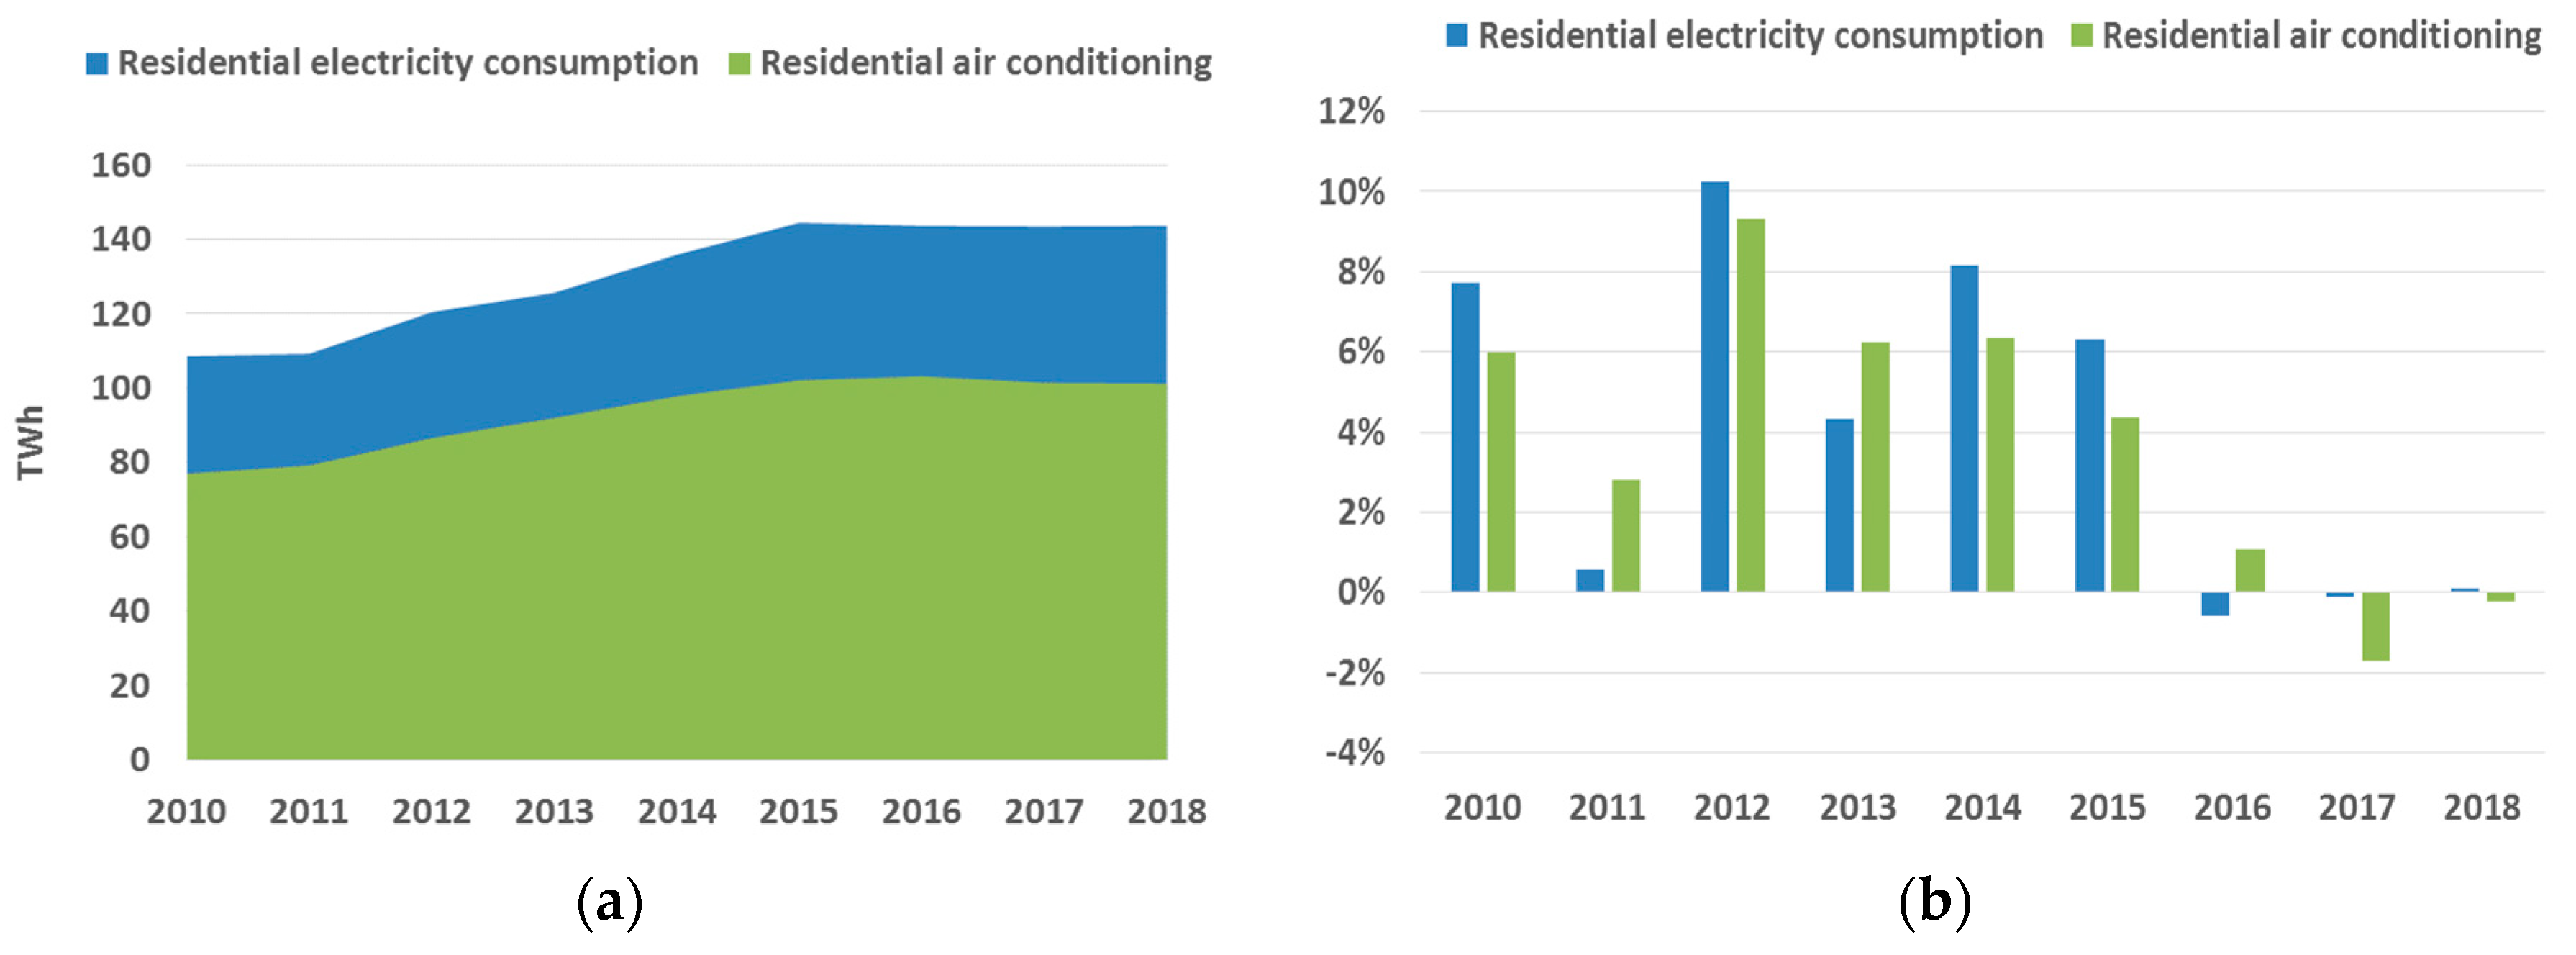
Figure 12 and
Figure 13 show total electrical consumption in TWh for buildings in the residential and services sectors (panel a) and their respective year-on-year percentage changes (panel b). In 2018 total electricity consumption in buildings was around 244 TWh, with residential uses accounting for 144 TWh (59%) and services (the commercial sector) 100 TWh (41%). In 2018, air conditioning consumed 101 TWh in the residential sector and 70 TWh in the services sector. During the period under analysis, the share of air conditioning in total final electricity demand from buildings was relatively stable at 70% for both the residential and commercial sectors.
Between 2010 and 2015 annual growth in electricity demand in the residential sector was approximately 6% on average, and 11% for the services sector. From 2016 there was a distinct shift toward lower rates of growth. For example, in 2016 residential electricity demand fell by 1.7% and registered no significant change in 2017 and 2018. Commercial demand increased by 1% and 0.5% in 2016 and 2017, respectively and registered no significant change in 2018.
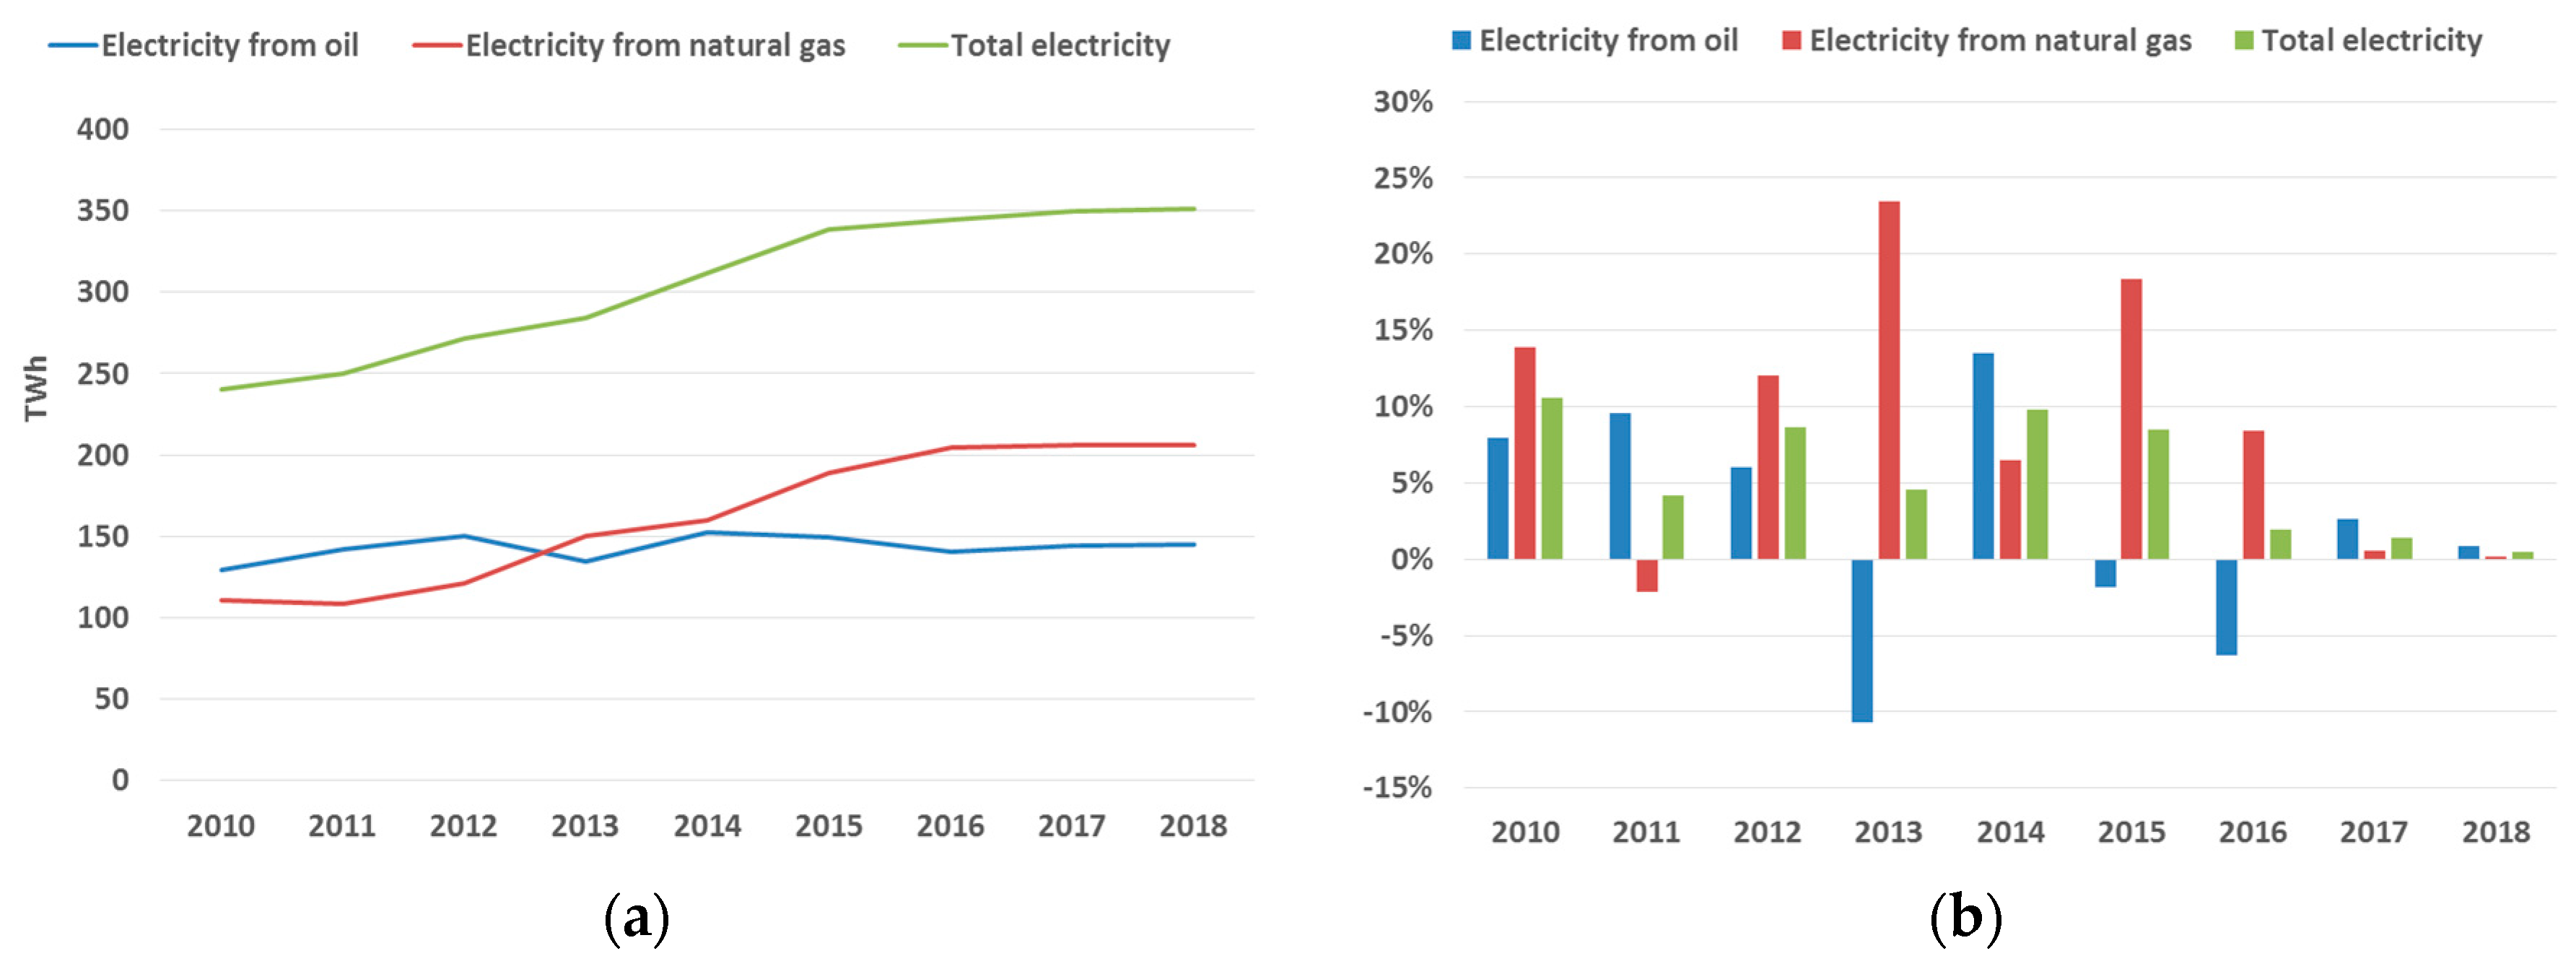
4.4. Electricity Fuel Mix and CO2 Emissions
In 2018, total electricity production was 351 TWh, comprised of 145 TWh generated from oil-based products and 206 TWh from natural gas (
Figure 14). In 2013, gas replaced oil as the primary fuel input for electricity production and increased to 59% of the fuel mix in 2018. Oil has about a 25% higher CO
2 intensity than gas, with 20 kg per gigajoule for oil compared with 15.3 kg for gas. This shift in the fuel mix from oil to gas has consequently had a significant bearing on CO
2 emissions associated with power generation [
60].
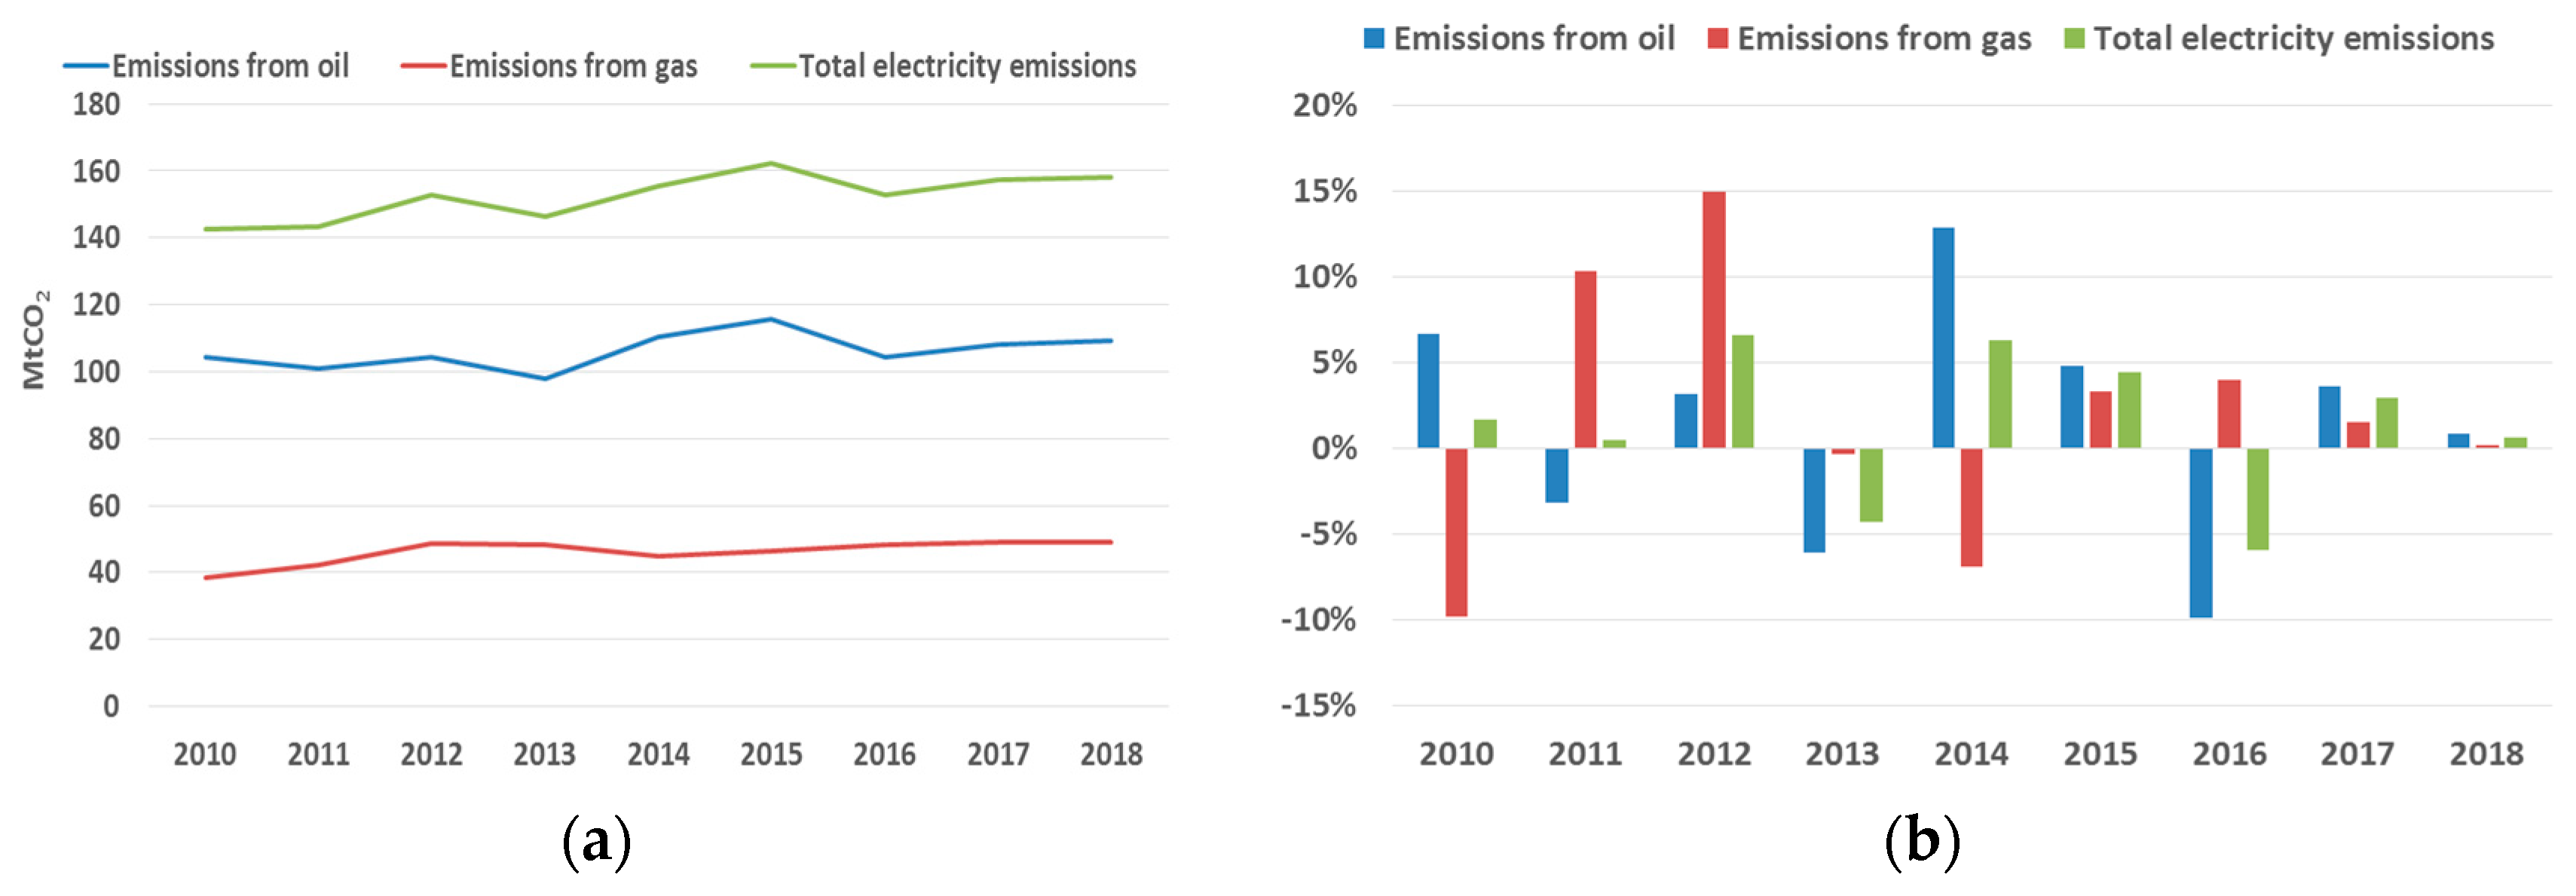
Figure 15 shows that CO
2 emissions from power generation fell by 4% in 2013 and 5.9% in 2016. In 2017, emissions from the power sector rose by 2.9%, while in 2018 emissions from power were stable. One of the major drivers of these changes has been the shift in the use of oil in the fuel mix. Shifts in the use of natural gas resulted in relatively small changes in emissions. Another factor behind the fall in emissions may be that new combined-cycle gas power plants are significantly more efficient than the older simple cycle oil plants they replace. The increased use of gas in more efficient power plants has helped stabilize emissions in the power sector, alongside slowing electricity demand growth as a result of higher prices and increased AC energy efficiency.
5. Discussion of Results in Light of Previous Studies
Existing literature on electricity, temperature and the sustainability of cooling in Saudi Arabia are spread over several methodological or disciplinary fields. While some interdisciplinary research has been undertaken, notably the IEA’s work on cooling [
1], few academic studies have taken an interdisciplinary approach. The sustainability of cooling encompasses temperature change and techno-economic studies of energy use. Accordingly, we feel such an interdisciplinary approach is important to fully understand and manage the sustainability challenge of cooling. We have organized the discussion of our results in this section as they relate to methodological or thematic groupings in the literature. We conclude by summarizing the key insights of the paper.
5.1. Physical Science of Temperature Change in Saudi Arabia
The analysis of temperature change from 1979–2018 using the ECMWF ERA 5 data conducted in this paper suggests average warming across the country of 1.9 °C over 40 years, or 0.475 °C per decade and 0.0475 °C per year. Mean summer temperatures rose faster: by 2.2 °C over 40 years, or 0.55 °C per decade and 0.055 °C per year. The fastest rate of warming was in the summer in the northern central part of the country, including cities such as Sakaka (+3.3 °C) and Riyadh (+2.8 °C). Coastal areas, particularly on the Red Sea and in the region of Neom in the north west of the country, showed more moderate warming (below 2 °C), as did the sparsely populated south east of the country bordering Oman. This distribution, rate of temperature change and the faster rate of warming in the summer season is consistent with the findings of other studies, which identified annual warming in the range of 0.0583 °C to 0.125 °C for summer and 0.0427 °C to 0.0662 °C for winter, depending on the location [
19,
61].
Considering that average global warming since 1880 has been about 1 °C [
62,
63], a 2 °C warming on average over the last 40 years in Saudi Arabia is high, placing the country in a global hotspot of localized warming. This view is supported by a global application of the ECMWF data, which shows that Saudi Arabia has experienced some of the most significant warming trends on the planet over recent decades [
3].
When interpreting this result, it is important to keep two issues in mind. First, two-thirds of global warming since 1880 has occurred in the past four decades, encompassed by our study. Second, the temperature change on land exceeds that of the oceans, which means the average global temperature change is lower if the surface area of the oceans is included. By comparison, the land temperature in the Northern Hemisphere has warmed by around 1.25 °C over the past 40 years, based on a linear trend in yearly average temperature data from NASA GISS [
62,
63].
Our results make a contribution to the field by providing an assessment of local warming trends for Saudi Arabia as a whole and for key cities in different regions. This provides valuable information for utility managers and city planners responsible for infrastructure decisions that can help local populations adapt to changing climatic conditions. It also provides policymakers involved in climate discussions with a clear indication of the direction and magnitude of past temperature changes in Saudi Arabia, and what the implications may be of trends continuing or intensifying. For example, one study has suggested that, if past trends continued, the MENA region could experience another 6 °C of warming in the summer months this century [
20]. Such work highlights the need for adaptation strategies and increased awareness of how climate change affects Saudi Arabia.
5.2. Energy Economics and the Relationship between Temperature and Electricity Consumption
This study provides a detailed assessment of the relationship between electricity generation and temperature in each of the four SEC generation regions of the Kingdom in each season of the year using hourly data. For the country as a whole, ordinary least squares (OLS) regression suggests for every 1 °C of warming, approximately 1.177 GW of power generation was brought on line in the seasonal transition from winter to summer. In 2015, average winter and summer loads were 28.27 GW and 49.75 GW, respectively. To check the OLS result, we can take the average winter temperature of 16 °C and the average summer temperature of 32 °C, with a differential of 19 °C, and compare it to the difference between average winter and summer generation. This implies around 1.13 GW is added for each additional 1 °C of temperature rise within the year. This is consistent with our OLS result.
The result is also consistent with past work that suggested average winter electricity generation is roughly double average summer levels to handle the increased AC load [
23,
24,
25]. In this context, the results of our study provide a more recent and detailed analysis.
While it was beyond the scope of this study to conduct a more in-depth econometric analysis, future work could incorporate multiple years (subject to data availability) and include other variables such as humidity. Seasonal dummy variables could also be used to filter the analysis following similar approaches in studies on other countries [
64,
65,
66]. Alternative functional forms such as log-linear could also be explored, given the evidence of non-linearity between temperature and electricity generation in some regions. An index approach involving cooling degree-days and humidity could also be taken as an alternative to using temperature as the main explanatory variable.
5.3. Studies on the Sustainability of Cooling in Saudi Arabia
Most existing literature on the sustainability of electricity consumption in Saudi Arabia predates the significant energy price reforms that began in 2016 [
35,
36]. Commencing in 2016, significant energy price reforms have been complemented by the intensification of AC energy efficiency standards, stronger building regulations and enforcement, and consumer rebates for high-efficiency AC units.
To our knowledge, this study provides one of the first assessments of electricity and AC trends since such measures came into effect. It also fills a gap in the literature by providing a focused analysis of the contribution of ACs to electricity demand in buildings in Saudi Arabia, the country with the highest share of AC use in household electricity consumption globally [
2].
Our analysis shows that, between 2010 and 2015, growth in electricity consumption ranged between 4–10% per annum in the residential sector and by 2–18% per annum in the commercial sector. Since 2016, there has been a significant break in this trend, with residential electrical consumption falling in 2016 and showing no growth in 2017 and 2018. Commercial electricity consumption stabilized and grew at less than 1% in each year between 2016 and 2018, having fallen from even higher growth rates than residential consumption.
Studies on the sustainability of electricity and cooling in Saudi Arabia have primarily focused on the amount of oil used domestically in power generation and the implications of this for oil exports [
32,
33,
34,
35]. While CO
2 mitigation is seen as a co-benefit, few studies have explicitly analyzed CO
2 emissions. Wogan et al. [
67] is a notable exception and provides a forward-looking assessment of power sector pathways to meet Saudi Arabia’s 130,000 million tonnes of CO
2 (MtCO
2) commitment under the Paris Agreement. While the authors do not consider AC or energy efficiency explicitly, they model a range of renewable energy, nuclear, carbon intensity and energy-price reform policy options through to 2030. The authors conclude that increasing the costs of fuel inputs would be the most effective pathway for reducing CO
2 emissions, a process now underway.
Our results fill a gap in the literature by providing a more detailed view of the electricity-related CO
2 emissions and their drivers in the fuel mix based on historical information (2010–2018). Power sector emissions are highly sensitive to the quantities of oil products used in the generation mix, and any policy or activity that reduces the use of oil products, especially in summer, will have a significant impact on emissions. For example, in July 2013 around one million barrels per day of oil products were added to the electricity generation mix compared with January [
37]. Updating this monthly analysis using data from JODI would be a useful extension to the analysis in this paper and a topic for further research.
While the use of oil products fell relative to gas from 2010–2018, in absolute terms electricity generation from oil has remained constant at around 150 TWh. Future research can explore the barriers and opportunities for decommissioning old, inefficient oil-based generation capacity and substituting this with gas or renewable energy. The latter is likely to be especially important in the Western region, where gas infrastructure is limited.
6. Conclusions
This paper provides an overview of climatic conditions in Saudi Arabia and analyzes temperature changes from 1979 to 2018. According to the ECMWF data, Saudi Arabia is in a global hotspot of localized warming, with average summer temperatures in some cities having risen by over 3 °C and by 2.8 °C in the capital, Riyadh during this 40-year period. Considering global average warming of 1 °C since 1880 and the potential for this to rise to 2 °C or more, the future for local summer temperatures in Saudi Arabia should be an important concern for policymakers. For example, such information is relevant for climate change adaptation strategies and can inform the development of mega projects currently underway, such as Neom, a new city to be located in the milder north west of the country, less exposed to the warming climate.
That Saudi Arabia’s extreme summer temperatures are associated with large increases in electricity demand to power the country’s AC units is an expected result. What is perhaps surprising is that the share of household electricity consumption devoted to AC is so far above that of other countries with similar climatic conditions, such as the United Arab Emirates (UAE). While cultural factors such as larger living spaces and subjective perceptions of comfort may play a role in influencing this, it nevertheless highlights the potential for improvements to be made to the Kingdom’s building stock and its use of AC.
Based on our review of past studies and informed by our empirical analysis,
Table 2 summarizes some of the main areas that could contribute to a more sustainable future for cooling in the Kingdom.
Progress in reducing the CO2 intensity of the power sector, higher consumer prices, stronger AC standards, building codes and public awareness around responsible energy use have all helped put Saudi Arabia’s cooling needs onto a more sustainable path. With increasing temperatures, a growing population and an increasing area of floor space in need of cooling, Saudi Arabia represents an important case study at the extreme end of AC use. This paper fills a gap in the existing literature by drawing attention to the challenge of sustainable cooling and presenting solutions for Saudi Arabia and beyond.


 ,
, 


