Article

Mitigation of CO2e Emissions from the Municipal Solid Waste Sector in the Kingdom of Bahrain

Department of Natural Resources and Environment, Arabian Gulf University, P.O. Box 26671, Manama, Bahrain
Climate 2019, 7(8), 100; https://doi.org/10.3390/cli7080100
Submission received: 19 June 2019 / Revised: 25 July 2019 / Accepted: 14 August 2019 / Published: 20 August 2019

Abstract

:
Mitigating climate change to limit the global temperature increase (relative to pre-industrial temperatures) to 2 °C is receiving considerable attention around the world. Here, historical and future carbon dioxide equivalent (CO2e) emissions from municipal solid waste (MSW) in Bahrain were calculated using the revised Intergovernmental Panel on Climate Change (IPCC) 1996 and IPCC 2006 methods. The extent to which waste-to-energy (WtE) technologies can contribute to climate change mitigation was assessed by performing a multicriteria analysis. The results indicated that CO2e emissions from MSW in Bahrain have been increasing since the Askar landfill was constructed in 1986. Emission recalculations indicated that CO2e emissions from MSW contribute 6.2% of total emissions in Bahrain rather than the 11.6% reported in the second national communication. Methane emissions from MSW in 2030 are predicted to be 22–63 Gg. The WtE technologies anaerobic digestion and landfill gas recovery gave the best and gasification the worst multicriteria analysis model results. A database of WtE plants around the world should be compiled to allow decisions around the world to be based on best practices. The potential for maximizing energy recovery and decreasing costs needs to be investigated to allow WtE plants to compete better with renewable and nonrenewable energy sources.

1. Introduction

Climate change has been receiving considerable amounts of attention in recent years, particularly since the Paris Agreement and subsequent reports of national emissions and commitments to decreasing emissions. Attention has been focused on climate change mitigation and adaptation to climate change. Various sectors can make changes to mitigate climate change, and the sectors with the highest contributions to total carbon dioxide equivalent (CO2e) emissions should be prioritized.
The countries in the Gulf Cooperation Council (GCC), a political and economic alliance of six Arab countries founded in 1981, have relatively high energy and carbon intensities. The energy intensity figures for GCC countries range between 0.12 ton oil equivalent (toe)/thousand USD for the United Arab Emirates and 0.23 toe/thousand USD for Bahrain, with an average of 0.15 toe/thousand USD [1]. The average energy intensity in GCC countries exceeds the world’s average of 0.13 toe/thousand USD [1]. The average carbon intensity in GCC countries is 0.35 kg CO2/USD, which also exceeds the world’s average of 0.3 kg CO2/USD [1]. The GCC countries have mainly focused on decreasing emissions caused by fossil fuel combustion (later called the energy sector). Almost all GCC countries have planned and implemented projects to improve energy efficiency and promote renewable energy [2,3,4]. Now that many of these projects have been implemented, focus is shifting toward mitigating CO2e emissions from other sectors, such as the waste sector.
Globally, CO2e emissions from the waste sector have almost doubled over the period 1970–2010, reaching more than 1400 Mt CO2e in 2010. Emissions from the waste sector make up 2.9% of the world’s total CO2e emissions, while emissions from developing countries are expected to grow over the coming years [5,6]. Several mitigation measures have been identified for the waste sector, including composting, improved landfill practices, recycling, energy recovery, and reducing waste generation [7]. A significant and growing body of literature has investigated the effectiveness of these measures in mitigating CO2e emissions from the waste sector, with a special focus on municipal solid waste (MSW) (e.g., References [8,9,10,11]).
Solid waste materials generated by households and during commercial activities are the main components of MSW [12]. There are >2430 MSW treatment plants and >4500 MSW incineration plants around the world [13]. Waste-to-energy (WtE) technologies can be grouped into thermochemical, biochemical, and chemical technologies, as shown in Figure 1. WtE technologies have been described thoroughly in the literature (e.g., References [14,15,16,17,18,19,20]). The requirements, pros, and cons of WtE technologies are summarized in Table 1. WtE plants give energy recovery efficiencies between 18% and 23% for generating electricity and between 63% and 78% for producing heat, but an energy recovery efficiency of 83% can be achieved by simultaneously producing heat and power [17,21]. Most previous publications have been focused on ex ante assessments of WtE plants in terms of energy recovery potential, environmental impacts, and financial feasibility (e.g., References [19,22,23,24,25,26,27,28,29,30,31,32,33]). Few ex post assessments of WtE plants (e.g., References [21,34]), particularly in terms of whether expected energy recovery rates were achieved, have been published.
Most GCC countries have identified sectors in which CO2e emissions can be mitigated in their nationally determined contributions. In particular, the potential for recovering energy from municipal solid waste (MSW) has been explored as a way of mitigating climate change. Several WtE projects have been planned in GCC countries, the majority in the United Arab Emirates (Table 2). The feasibility of using WtE technologies and the expected effectiveness of establishing WtE plants in GCC countries have been assessed in previous publications. Previous studies of WtE in GCC countries have focused on waste characterization [35,36,37], determining energy recovery potential [23,24,26,38], and selecting suitable WtE technologies [38]. Several methods have been used in the assessments of the waste management practices in GCC countries. A lifecycle assessment [39] and a driver-pressure-state-impact-response framework [40] have been used in Kuwait, a multicriteria analysis (MCA) has been used in Oman [38], and WtE technologies have been assessed in Saudi Arabia [41,42]. Anaerobic digestion (AD) was found to be the most suitable option for Saudi Arabia because of the large contribution of organic material to MSW in Saudi Arabia [43]. An MCA indicated that AD was also most appropriate for Oman [38]. However, a financial analysis indicated that AD was not suitable for the United Arab Emirates and that incineration would have a payback period of 19 years [24].
This paper aims to achieve two main objectives:
  • To calculate historical CO2e emissions and predict future emissions from MSW in Bahrain; and
  • To assess various WtE technologies in terms of effectiveness and appropriateness for use in Bahrain.
The following section provides a brief on the case study, i.e., Bahrain. The methods used to achieve the research objectives are described in the third section. The results of the analysis are presented and discussed in the fourth section. Conclusions are drawn and recommendations are presented in the fifth section.

2. The Case Study: Bahrain

Bahrain, the smallest GCC country by area and population, is the only GCC country that has not proposed mitigating CO2e emissions from the MSW sector either in nationally determined contributions or national communications to the United Nations Framework Convention on Climate Change. CO2e emissions from the waste sector in Bahrain are increasing (Figure 2), and the total amount of waste generated is also increasing by an average of 10% annually (Figure 3). These increases agree with increases in the population and gross domestic product, where the coefficient of determination is 0.922 and 0.814, respectively (Figure 4). MSW contributed ~55% of total waste in Bahrain in 2016. This contribution has been decreasing temporally because the contributions of other types of waste (particularly construction waste) have increased (Figure 3). Nonetheless, the amount of MSW produced has been increasing by 6% per year on average (Figure 3). MSW produced in Bahrain is mainly organic material, plastic, and paper (Figure 5). The contribution of plastic to MSW in Bahrain was considerably higher in 2017 than in previous years (Figure 5). The percentage of organic material in MSW in Bahrain is almost similar to that of other GCC countries (Figure 6). However, the share of the plastic waste in Bahrain is considerably higher and the share of the paper waste is lower than that of other GCC countries.
Most of the MSW produced in Bahrain is sent to the Askar landfill, which is a controlled but not engineered landfill [53]. The Askar landfill will be full in only six years. A waste management hierarchy has therefore been developed. Recycling and energy recovery are important parts of the Bahrain national waste management strategy that was approved by the Cabinet of Ministers in February 2018. The strategy involves eight projects to deal with different types of waste. Four of the projects are directly relevant to MSW. These projects are the following:
  • Recycling paper, aluminum, and iron;
  • Waste-to-energy projects;
  • Converting the remainder of the Asker landfill into a sanitary engineered landfill; and
  • Initiating a center (called Estidama, which means sustainability) responsible for controlling processes related to waste, including monitoring processes, providing statistics, and continuing the implementation of the national waste management strategy.
There have been few peer-reviewed publications that have focused on waste in Bahrain. Studies that have been published have focused on estimating methane emissions from the Asker landfill [58], characterizing waste [53], and identifying suitable locations for new landfills [59]. However, there have been no peer-reviewed articles on the assessment of WtE technologies in Bahrain.
Increasing attention is being paid to MSW in Bahrain in terms of waste management, CO2e emissions, and energy recovery. However, planning to mitigate climate change has only been started in the wastewater treatment sector. A sludge-to-energy project has been proposed in the Bahrain national renewable energy action plan. There are no planned climate change mitigation projects for MSW. A project in Askar was recently suggested, but no progress has been made so far (Table 2). Therefore, this paper is of extreme importance for environmental policymaking in Bahrain, contributing new data on the assessment of WtE technologies.

3. Methods

3.1. Calculating Historical CO2e Emissions and Predicting Future Emissions from MSW

In the second national communication, it was suggested that 124 Gg of methane (equivalent to ~2600 Gg CO2e) is emitted by solid waste disposed on land in Bahrain [49]. The CO2e value was recalculated here to ensure that the value reported in the second national communication was correct and to assess temporal trends in CO2e emissions from waste. Two methods were used in this paper to calculate emissions for the period 1986–2016. The revised Intergovernmental Panel on Climate Change (IPCC) 1996 method was used to validate the second national communication results (for which the same method was used). The IPCC 2006 method was also used because it is the most recent method recommended for calculating CO2e emissions from waste. The revised IPCC 1996 method is based on methane commitments or the total amount of methane generated. The IPCC 2006 method is based on a first-order decay model that requires detailed input data for more than 10 years [60]. Methane emissions were calculated using Equation (1), from the revised IPCC 1996 method [61]:
Methane   emissions   ( Gg / year ) = ( MSW T × MSW F × MCF × DOC × DOC F × F × 16 12 R ) × ( 1 OX ) .
In Equation (1), MSWT is the total amount of MSW generated, MSWF is the fraction of the MSW disposed of in the landfill of interest, MCF is the methane correction factor, DOC is the degradable organic carbon content, DOCF is the dissimilation fraction for the DOC, F is the methane fraction for the landfill gas, R is the amount of methane recovered, and OX is the oxidation factor.
As for the IPCC 2006 method, the following equations were used [62]:
Methane   emissions = [   methane   generated x ,   T R T ] × ( 1   OX T ) .
In Equation (2), T is the inventory year, x is the waste type, RT is the amount of methane recovered in year T, and OXT is the oxidation factor. The generated methane value was calculated using Equations (3)–(6):
DDOCm = W × DOC × DOC f × MCF .
In Equation (3), DDOCm is the mass of decomposable DOC deposited, DOC is the amount of degradable organic carbon deposited in the year of interest as a fraction (Gg C/Gg waste), DOCf is the fraction of DOC that could be decomposed, and MCF is the methane correction factor (as a fraction) for aerobic decomposition in the year the waste was deposited. Equation (4) is
DDOCma T =   DDOCmd T + ( DDOCma T 1 × e k ) .
In Equation (4), DDOCmaT is the accumulated mass (in Gg) of decomposable DOC in a landfill at the end of inventory year T, DDOCmaT-1 is the accumulated mass (in Gg) of decomposable DOC in a landfill at the end of year T − 1, and DDOCmdT is the mass (in Gg) of decomposable DOC in a landfill in year T. Equation (5) is
DDOCm   decomp T =   DDOCma T 1 × ( 1 e k ) .
In Equation (5), DDOCm decompT is the mass (in Gg) of decomposable DOC decomposed in a landfill in year T, and k is the reaction constant calculated using the equation k = In (2)/t1/2 (y−1), where t1/2 is the half-life in years. Equation (6) is
Methane   generated T =   DDOCm   decomp T × F × 16 / 12 .
In Equation (6), F is the methane fraction by volume, and 16/12 is the CH4/C molecular mass ratio.
Projections of CO2e emissions from MSW between 2017 and 2030, using 2016 as the base year, were made applying the IPCC 2006 method and using DOC and MSW generation as the two main variables. The minimum and maximum DOC values identified in previous MSW composition surveys (Figure 5) were used. Future MSW generation was determined using Equation (7):
Future   MSW T =   Per   capita   MSW T × Population   projection .
The mean (1.9 kg/capita/day), minimum (1.6 kg/capita/day), and maximum (2.4 kg/capita/day) amounts of MSW produced per capita between 1986 and 2016 and population projections prepared by the government and the World Bank were used [50,63] (Figure 7). This allowed future CO2e emissions from MSW to be predicted using different assumptions.

3.2. Assessing Various WtE Technologies in Terms of Effectiveness and Appropriateness for Use in Bahrain

The energy recovery potentials for the main WtE technologies were determined using the equations shown below for incineration, AD, gasification, and landfill gas [22,29,64]. The lower calorific values (LCVs) were taken from a previous publication [26] and are shown in Table 3.
The energy recovery potential for incinerating MSW was calculated using the equation
ERP =   M × LCV MSW ×   η ,
where ERP is the energy recovery potential, M is the total mass of solid waste, LCVMSW is the LCV of the waste, and η is the efficiency of the process. Several efficiency values (15%, 22%, 26%, 33%, 35%, and 40%) from previous publications were used to indicate the range of energy recovery potentials that could be achieved.
The energy recovery potential for AD was calculated using the equation
ERP =   f × M OFSW × LCV biogas × η ,
where f is the fraction of organic waste, MOFSW is the amount of methane generated from the organic fraction of the solid waste, LCVbiogas is the LCV for the biogas caused by the presence of methane, and η is the electrical efficiency of the system (20%, 26%, or 40%). The methane generation rate from the biogas was 71 kWh/Nm3 [64], and the LCV for biogas was 21.51 MJ/m3 (i.e., 5.97 kWh/m3) [22].
The energy recovery potential for gasification was calculated using the equation
ERP =   G × R f × LCV MSW × η ,
where G is the amount of waste treated each year, Rf is the percentage of waste rejected after being treated, and η is the electrical efficiency of the system (23% or 30%). The percentage of waste rejected after being treated was 72.51% [22].
The energy recovery potential for landfill gas was calculated using the equation
ERP = LCV biogas × Q CH 4 × γ × η ,
where LCVbiogas is the LCV of the biogas caused by the presence of methane, QCH4 is the amount of methane produced each year, γ is the efficiency of the biogas recovery system (80%), and η is the efficiency of the electricity generation system (33%). The amount of methane was determined from the IPCC 2006 greenhouse gas emissions inventory, as explained above, and the LCV of the biogas was 5.97 kWh/m3 [22].
A multicriteria Analysis (MCA) was applied to assess the effectiveness of WtE technologies. MCA is an approach that has been applied in environmental assessments and policymaking [65,66]. There are several MCA methods, such as linear additive models, outranking methods, multi-attribute utility theory (MAUT), and analytic hierarchy process (AHP). The processes, data requirement, and the results of each MCA method differ. However, the main stages of MCA are almost the same: establishing the context, identifying alternatives, identifying assessment criteria and their weights, and assigning scores to the alternatives against the assessment criteria [66]. The result of an MCA can be a single most preferred alternative, a ranking order of the alternatives, or a shortlist of the alternatives [67].
The adoption of an MCA enables assessments of alternatives to be conducted based on multiple quantitative and qualitative criteria [68,69]. Additionally, an MCA can encompass the results of several methods, including economic analysis and environmental assessments. However, the use of MCAs has a number of limitations. The limitations include possible subjectivity in assigning criteria weights and performance scores, in addition to limitations related to dealing with uncertainty.
In this study, a linear additive model was applied, where a simple MCA matrix was built and WtE technologies were assessed based on four main criteria: environmental, economic, social, and other criteria (Figure 8) (for details on the method, please see Reference [66]). The selection of the assessment criteria and subcriteria was in light of relevant literature [38,70]. The assessment was based on the energy recovery figures calculated using Equations (8)–(11), along with the costs of using WtE technologies and various qualitative criteria, which were taken from published studies [14,16,64,71,72,73]. A scale of 0–100 was used, with 0 meaning that the technology is not recommended and 100 being the highest score (Figure 9).
Several criteria and criteria weights were used to build four sets of MCA, as follows:
  • Equal weights were used for the assessment criteria;
  • Different weights (based on Reference [38]) for the criteria were used to determine whether using different weights for the different criteria would change the ranking order of the WtE options (criteria weights: environmental = 0.45, economic = 0.31, social criteria = 0.05, and other criteria = 0.19);
  • Criteria from Reference [14] were used to reflect the current MSW status in Bahrain using equal weights for the criteria; and
  • Criteria from Reference [14] were used to reflect the MSW status in Bahrain in the near future using equal weights for the criteria.
The aggregated scores were calculated using the equation [66]
S i = w 1 s i 1 + w 2 s i 2 + + w n s in =   j = 1 n w 1 s ij ,
where i is the WtE technology, j is a criterion, n is the number of criteria, s is the score, and w is the weight of criterion j. The WtE technology rank orders were compared using the Friedman nonparametric test. The number of sets was relatively small, but it has previously been suggested that this test could be used [74,75,76].

4. Results and Discussion

4.1. Historical CO2e Emissions from MSW and Predicted Future Emissions

Each calculation method indicated that methane emissions increased over time. Methane emissions from the Asker landfill since the landfill opened in 1986 are shown in Figure 10. The revised IPCC 1996 calculations indicated the total methane emissions expected to be released from MSW, but the IPCC 2006 method involved the assumption that the methane would not be emitted all at once. The two methods therefore gave different annual methane emissions for the landfill.
The revised IPCC 1996 method was used to calculate methane emissions for the second national communication, and it was found that 124 Gg of methane was released in 2000 [49]. However, the value recalculated using the method and data described above was only 67 Gg. This suggests that the original value was an overestimate that implied that the MSW sector should be given more priority than should have been the case. It was reported that solid waste disposed of on land contributed 11.6% of second national communication CO2e emissions, but in fact the value was 6.2%, making the contribution slightly lower than the contribution from the transport sector (6.7%) [49]. These results suggest that CO2e emissions from landfills in 2016 contributed 3737 Gg using the revised IPCC 1996 method and 660 Gg CO2e using the IPCC 2006 method, using a global warming potential of 28 for methane [77]. The methane emissions predictions were more sensitive to the amount of waste produced per capita than to the other variables, but the DOC of the MSW also strongly affected the predicted values. The IPCC 2006 method predicted methane emissions of between 22 and 63 Gg (mean 40 Gg) in 2030 and a mean annual increase of 2.6% (Figure 11). The higher emissions value was 186% of the lower emissions value, and this would clearly be important when deciding which WtE technologies to use in Bahrain to mitigate climate change.

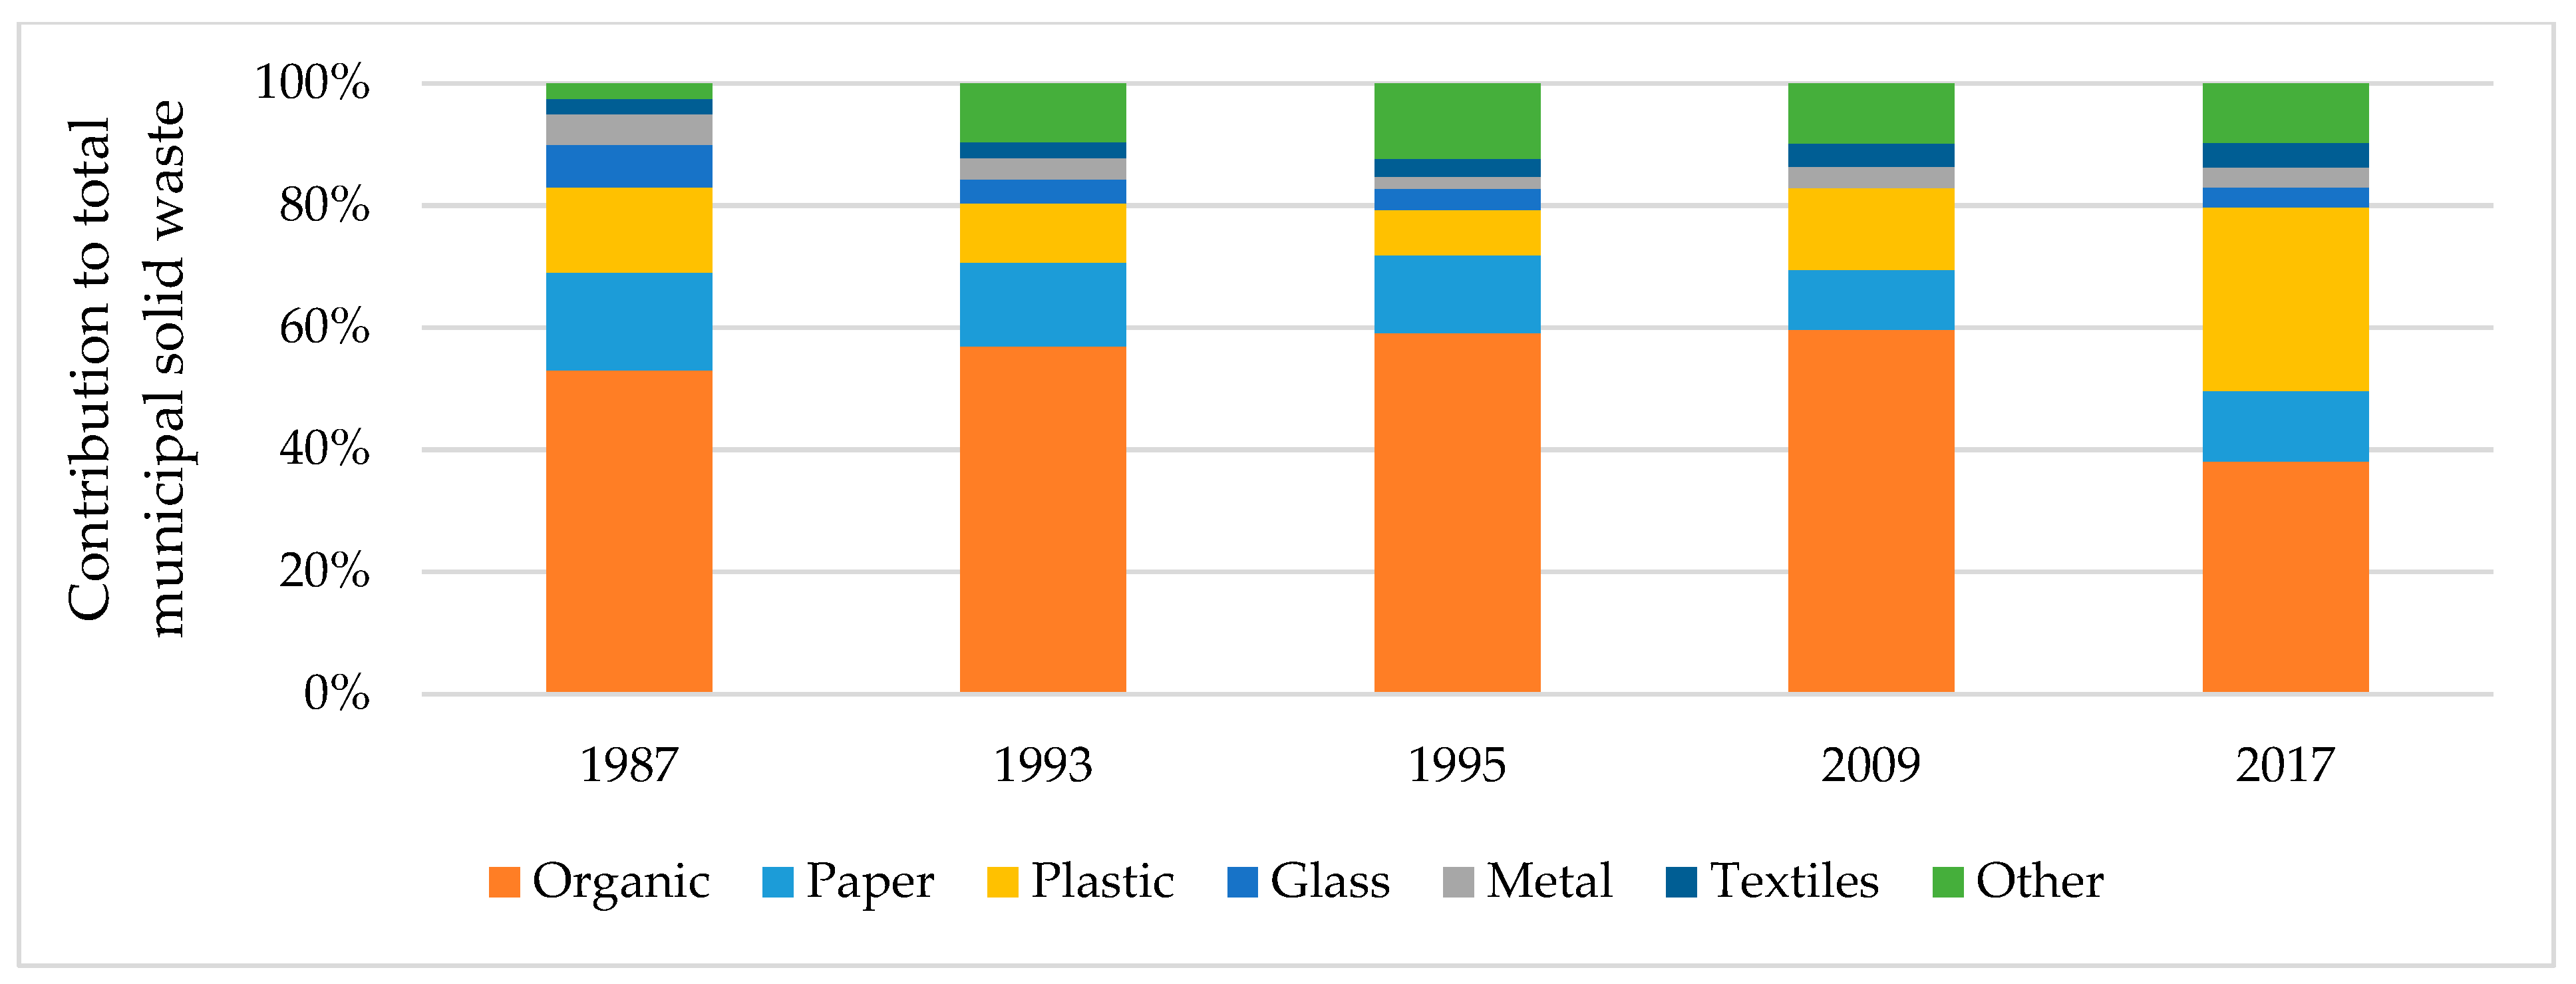
4.2. Assessing Various WtE Technologiess in Terms of Effectiveness and Appropriateness for Use in Bahrain

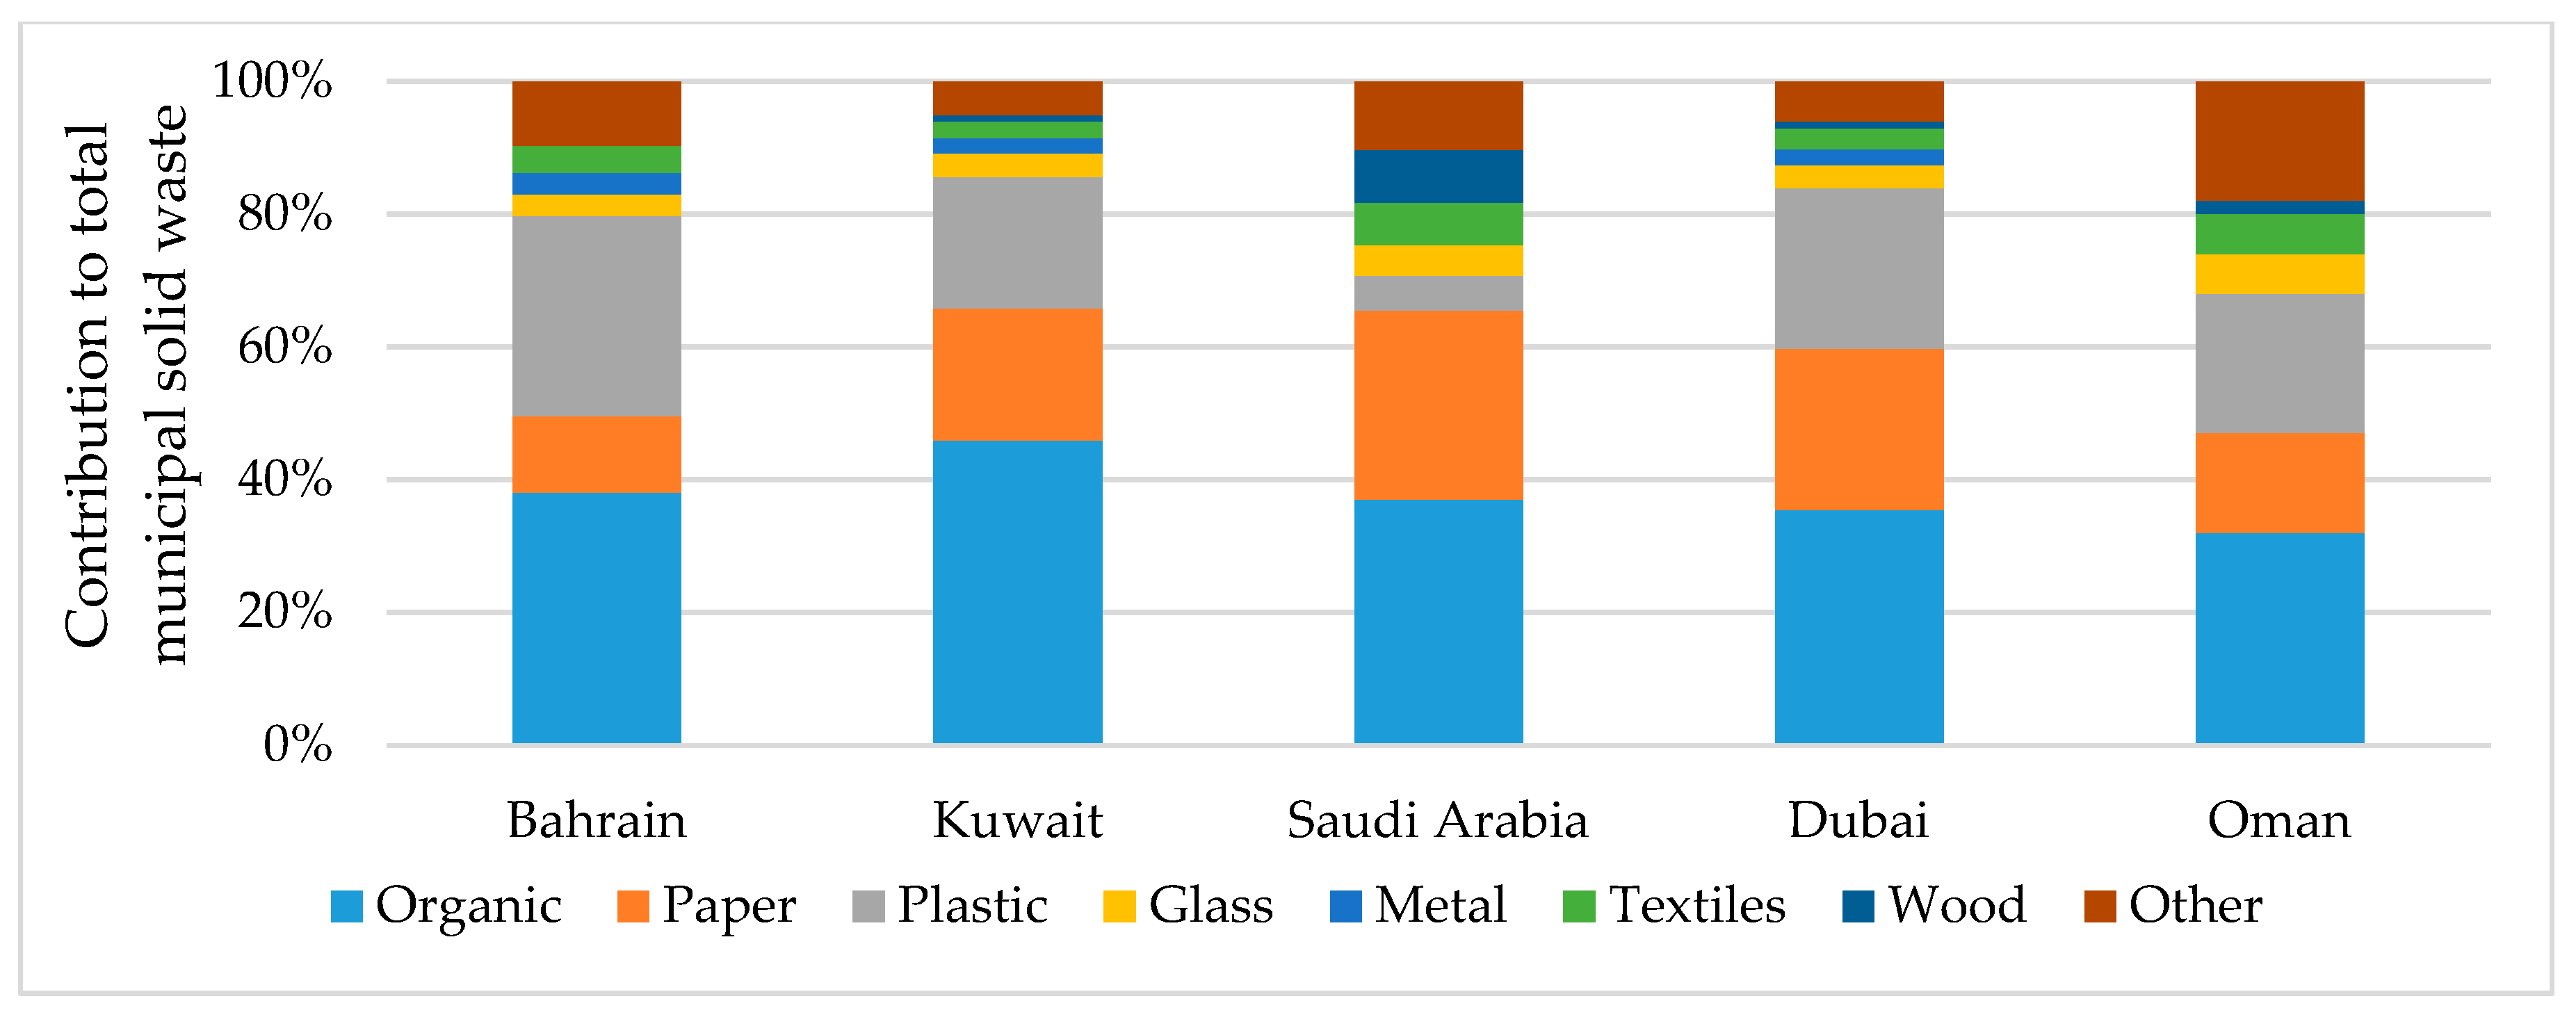
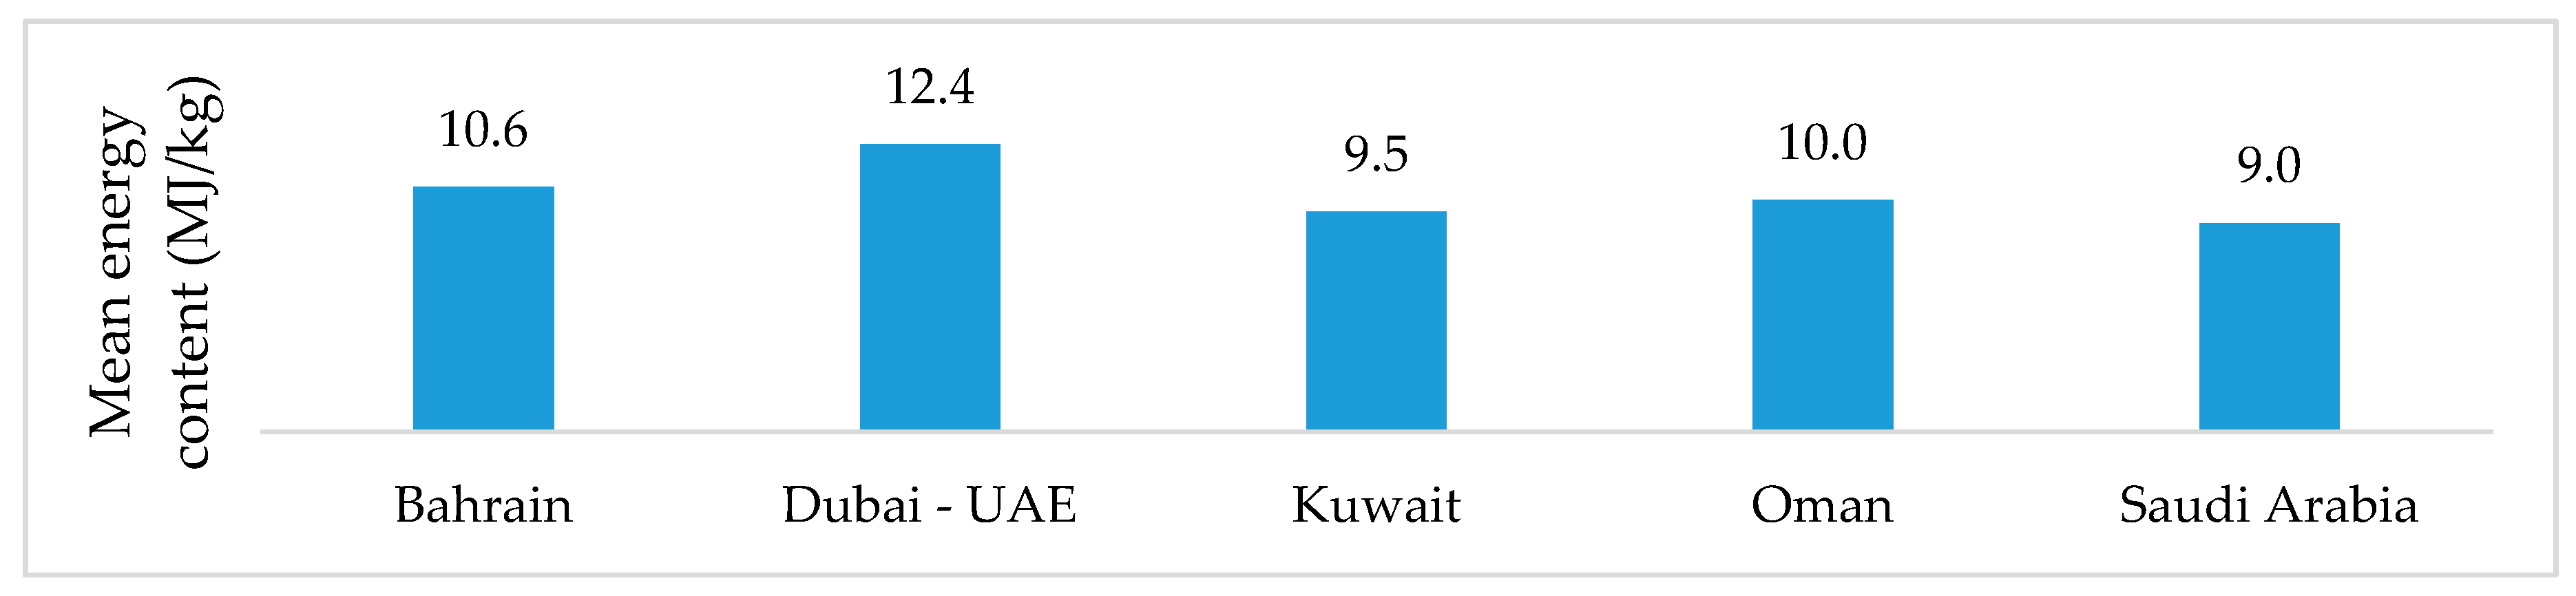
The calculated energy content of MSW in Bahrain was ~10.6 MJ/kg, which is almost similar to the energy contents of MSW in other GCC countries (Figure 12).
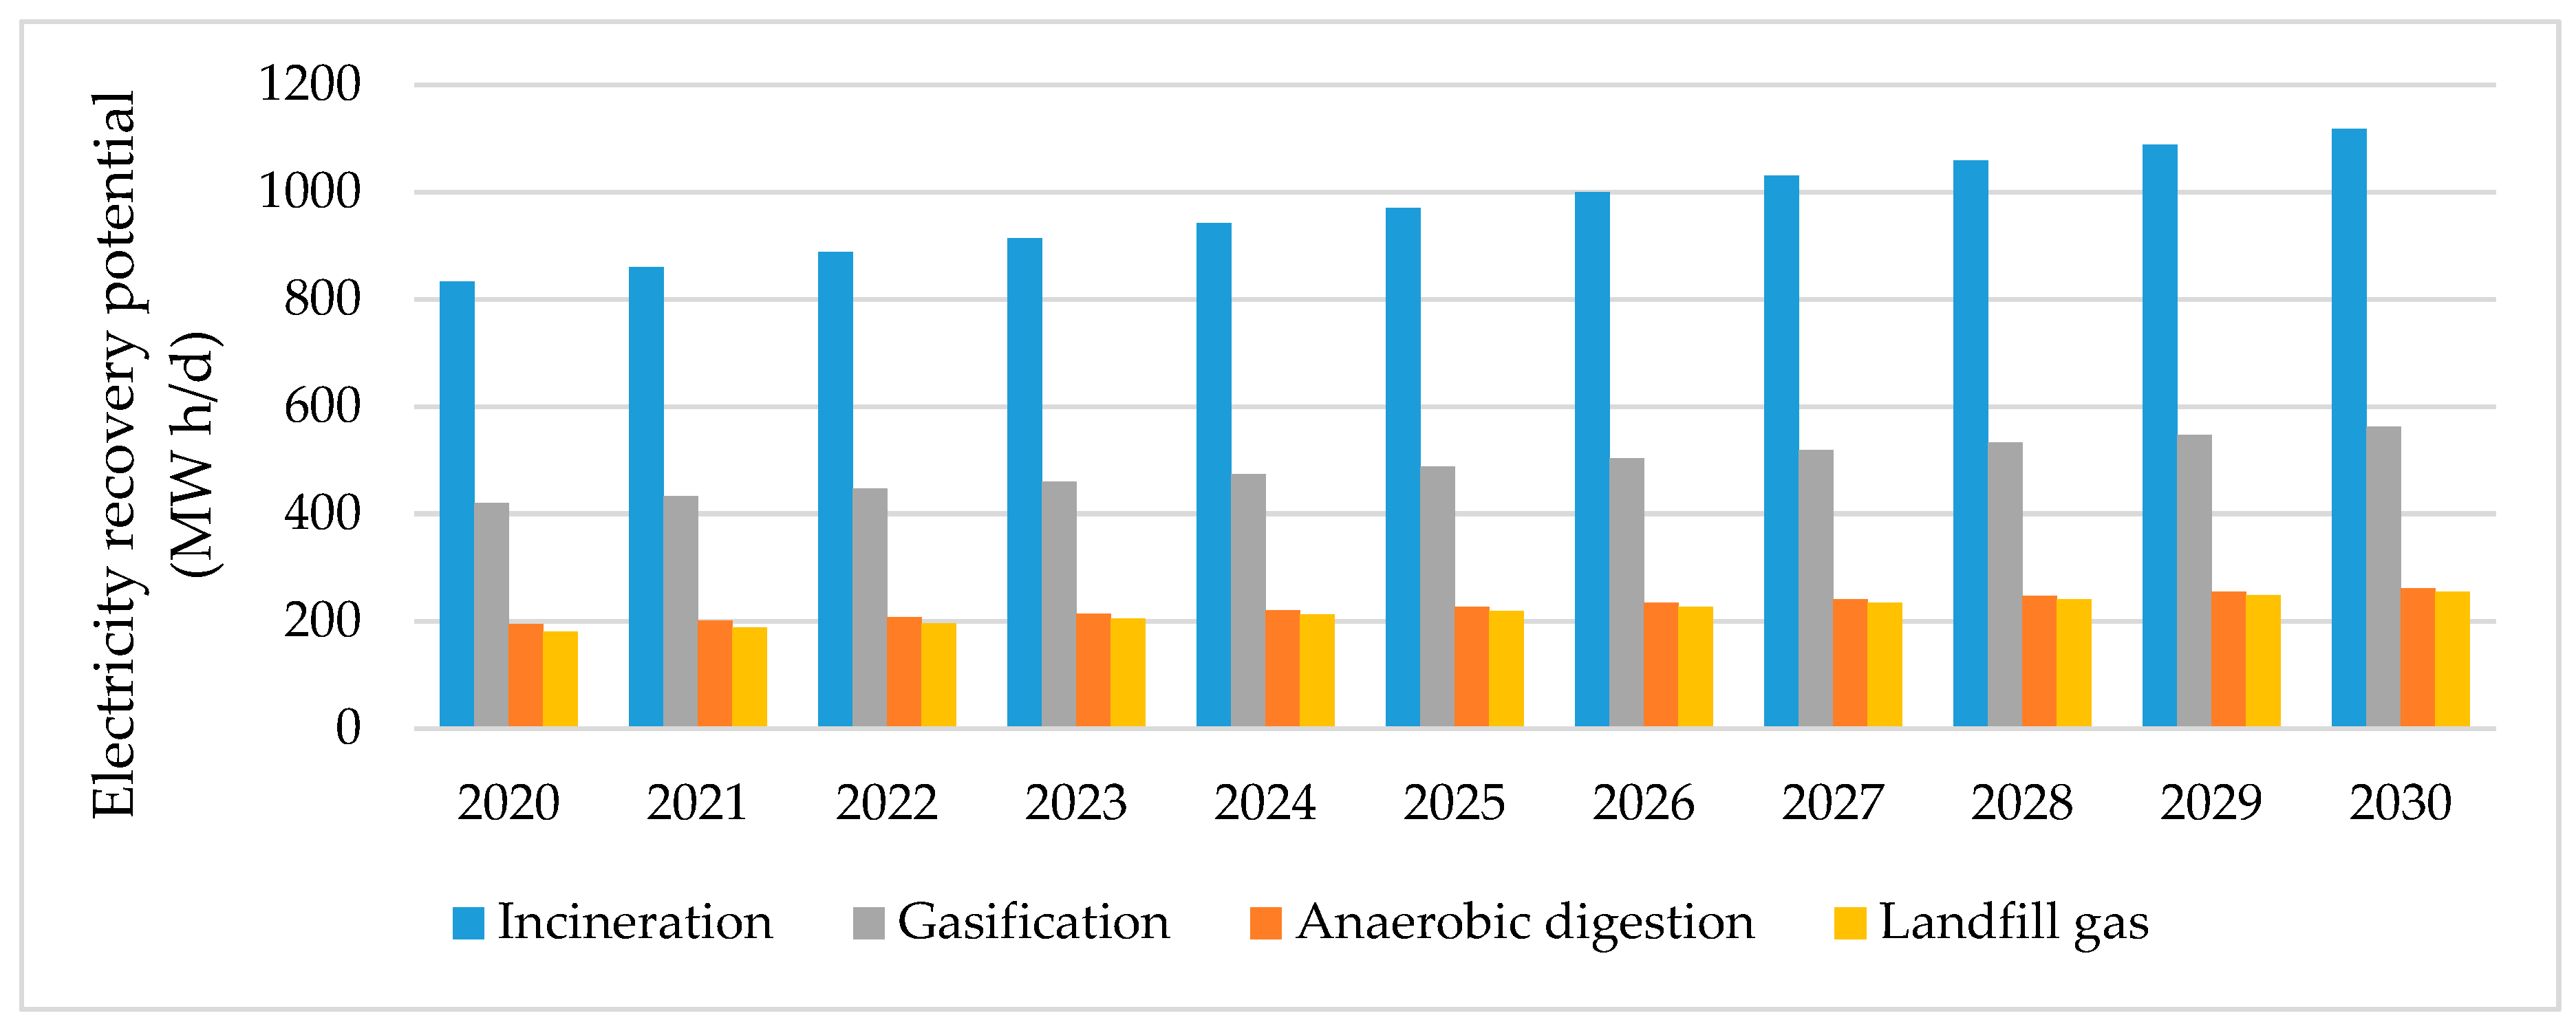
Incineration was found to have the highest electricity generation potential, followed by gasification, AD, and landfill gas recovery (Figure 13). The predicted electricity generation potential for incineration in 2030 was ~1120 MWh/day. The predicted electricity generation potential for landfill gas recovery in 2030 was only ~255 MWh/day. These results roughly indicate the amount of electricity that could be generated from MSW but would otherwise be wasted. The sensitivity analyses indicated that incineration would give the most variable electricity generation potential, implying that changing the amount of waste produced per capita, MSW DOC, waste characteristics, or process efficiency would markedly affect the amount of electricity generated, potentially making the amount generated as low as the amount that could be generated using other WtE technologies (Figure 14). These data are rough estimates of the potential electricity generation values in use by decision-makers comparing the benefits and costs of CO2e mitigation measures for different sectors. The generation of electricity from MSW contributes to climate change mitigation through the elimination of landfill gas and replacing fossil fuel-fired power plants [79].
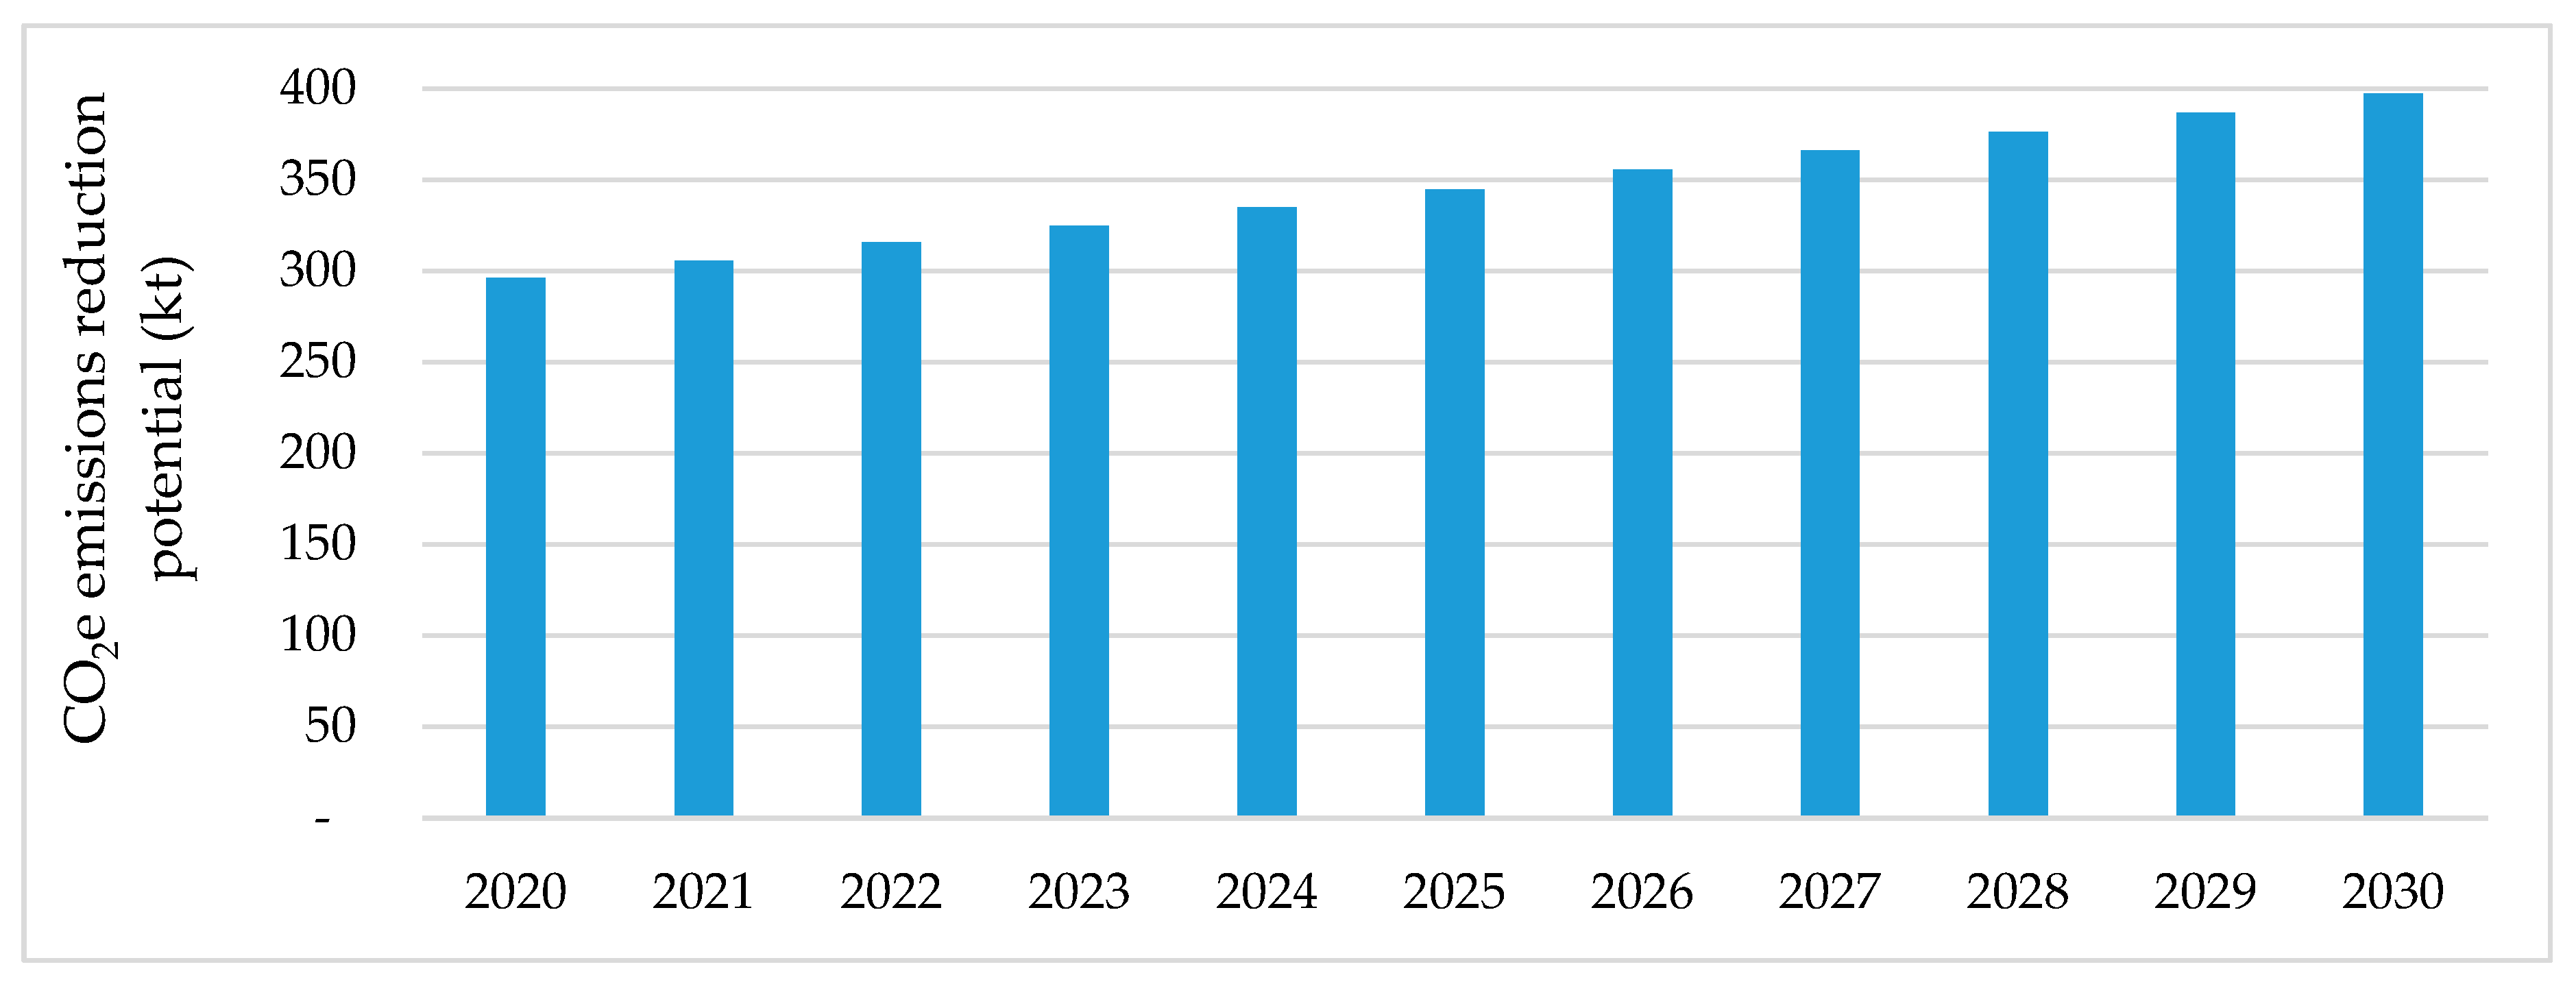
Adopting WtE technologies could contribute to a 400-kt CO2e emissions reduction from MSW in Bahrain in 2030 (Figure 15). The best WtE technology in terms of climate change mitigation is AD, with a potential for emissions reduction ranging between 0.2 and 0.41 t CO2e per tonne of MSW [6,70].
Incineration has the highest capital, operating, and maintenance costs, and gasification the next highest (Table 4). The total annual costs, including capital, operating, and maintenance costs, for the different WtE technologies were found to be 2–330 USD/t of MSW (Table 4). Potential revenues from the electricity generated would decrease the total cost by 3–47 USD/t of MSW (Table 4). Recovering landfill gas could be profitable, but the capital costs of incineration (in particular) and gasification would remain relatively high, indicating that funding would be required for such projects.
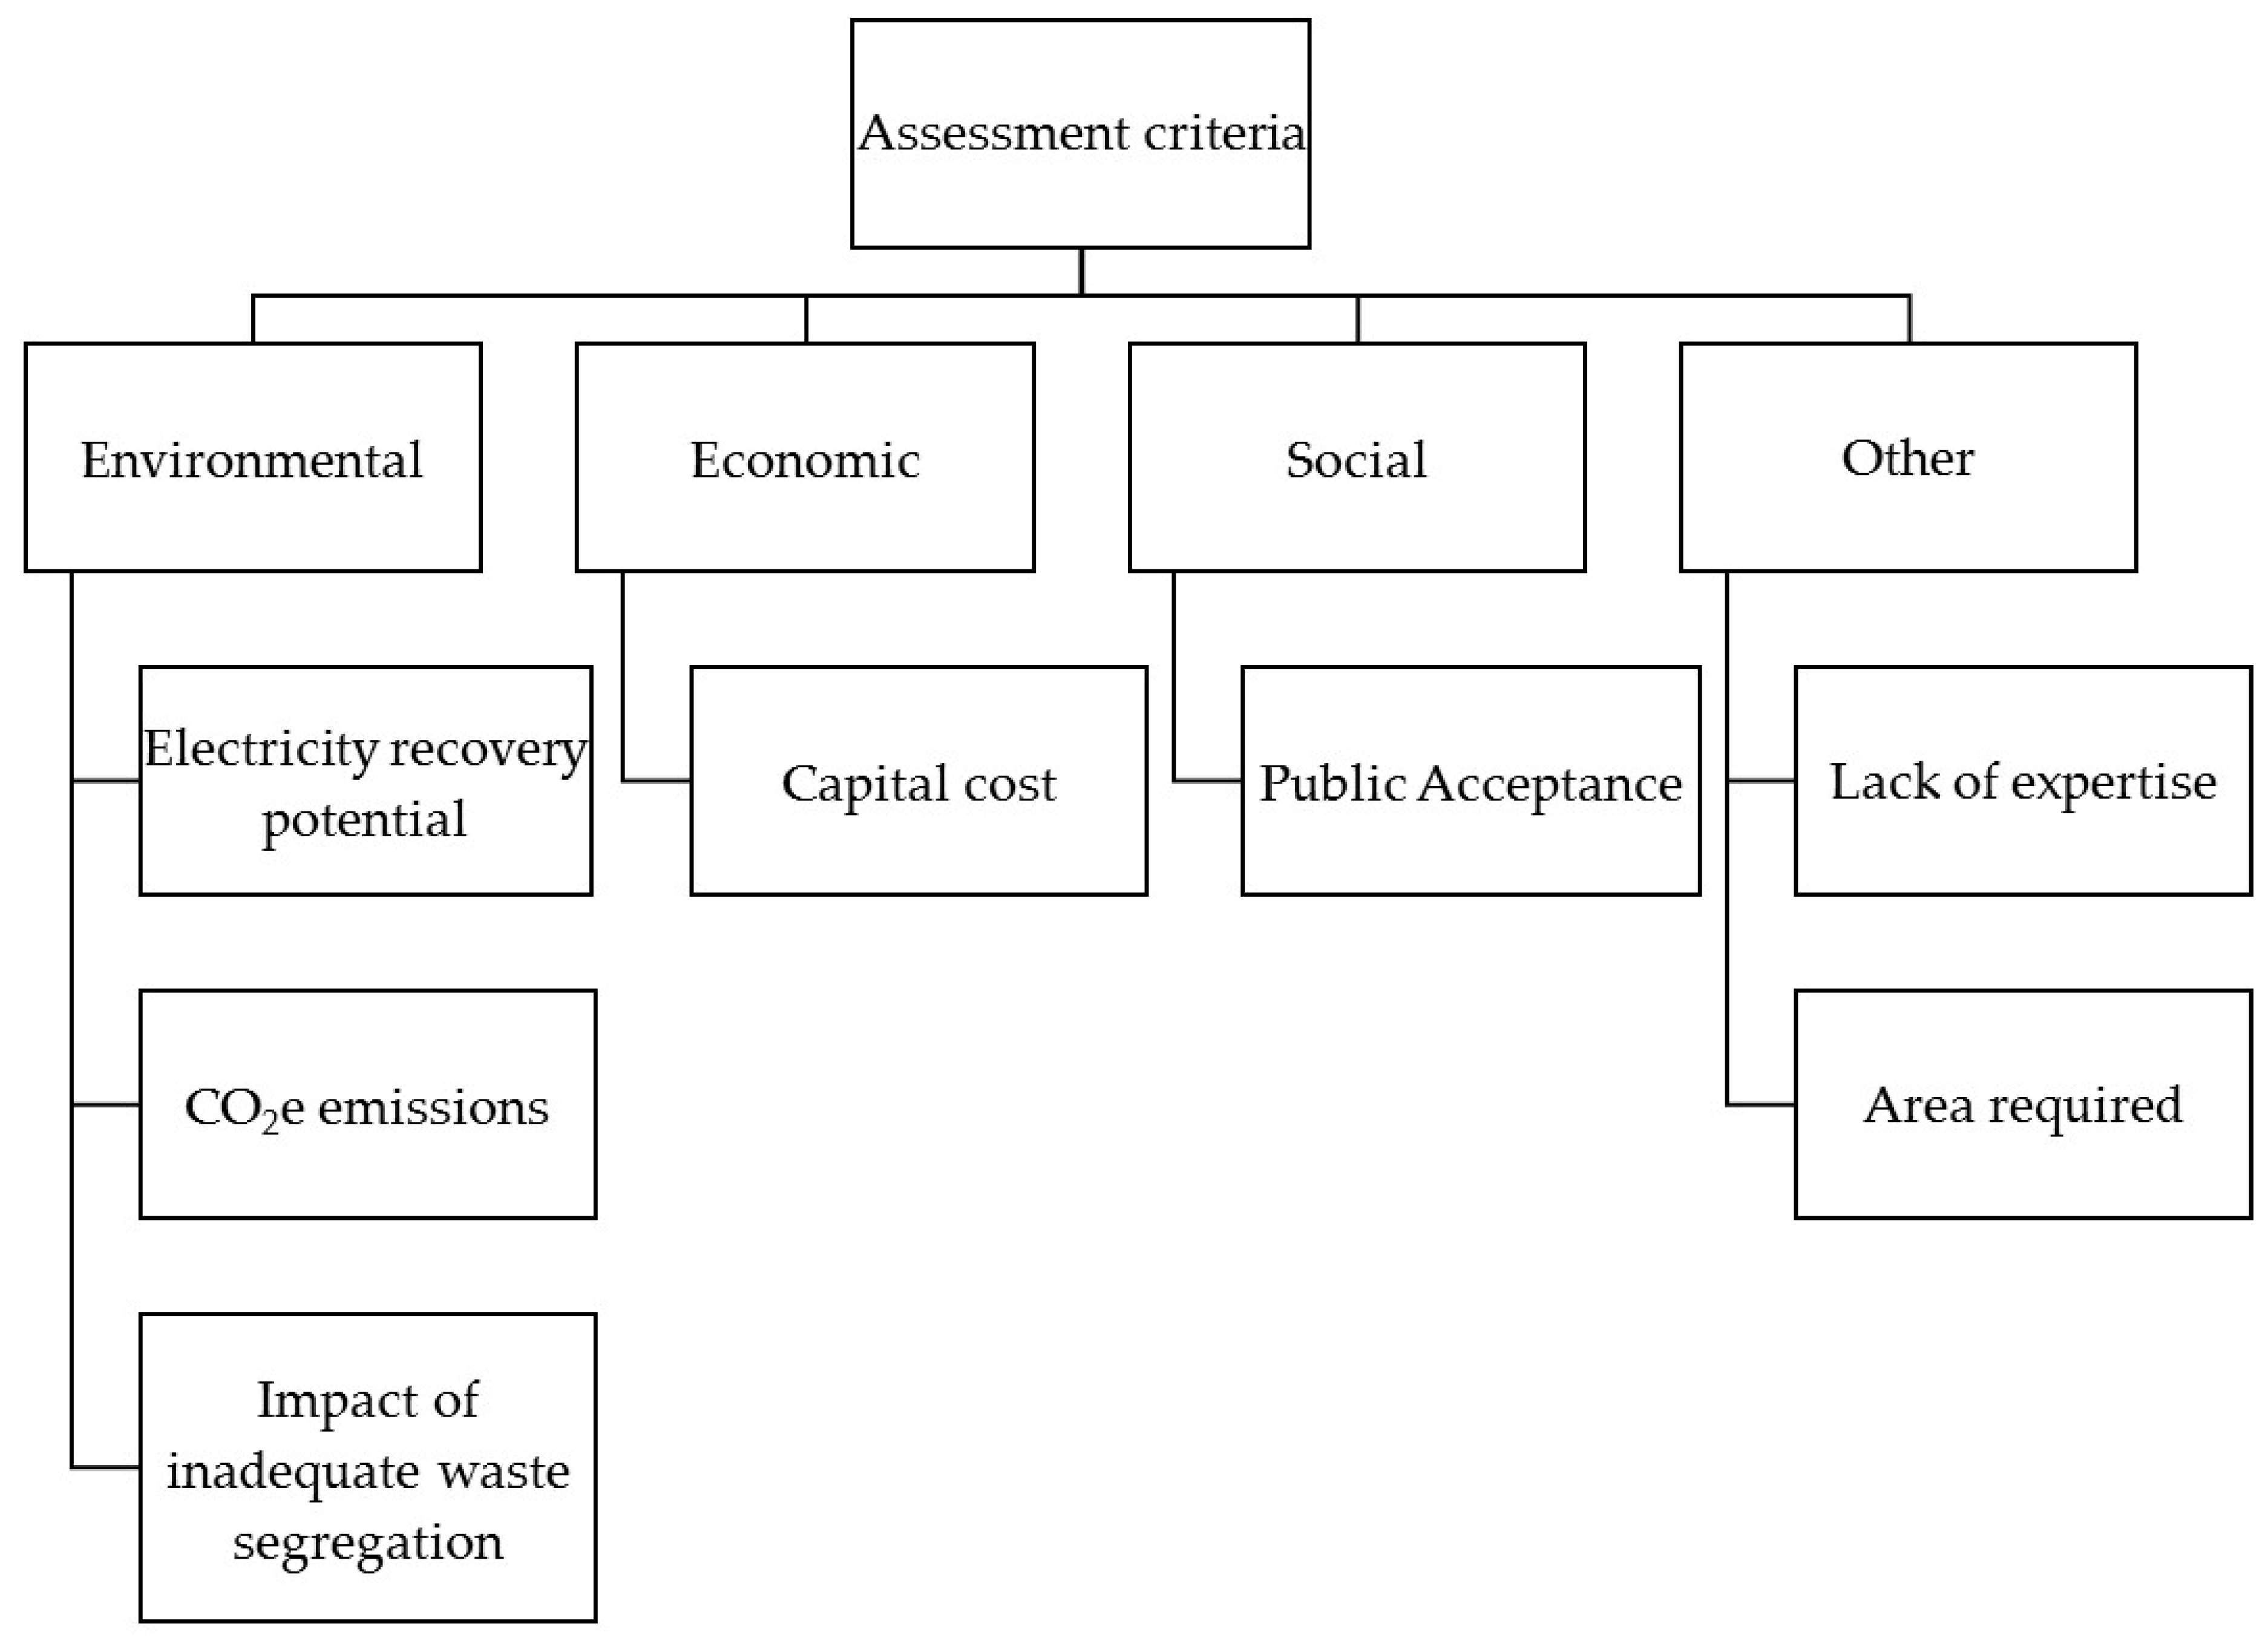
Four MCA models were built using the linear additive model and a simple MCA matrix method. These models differed in the assessment criteria and criteria weights (see 
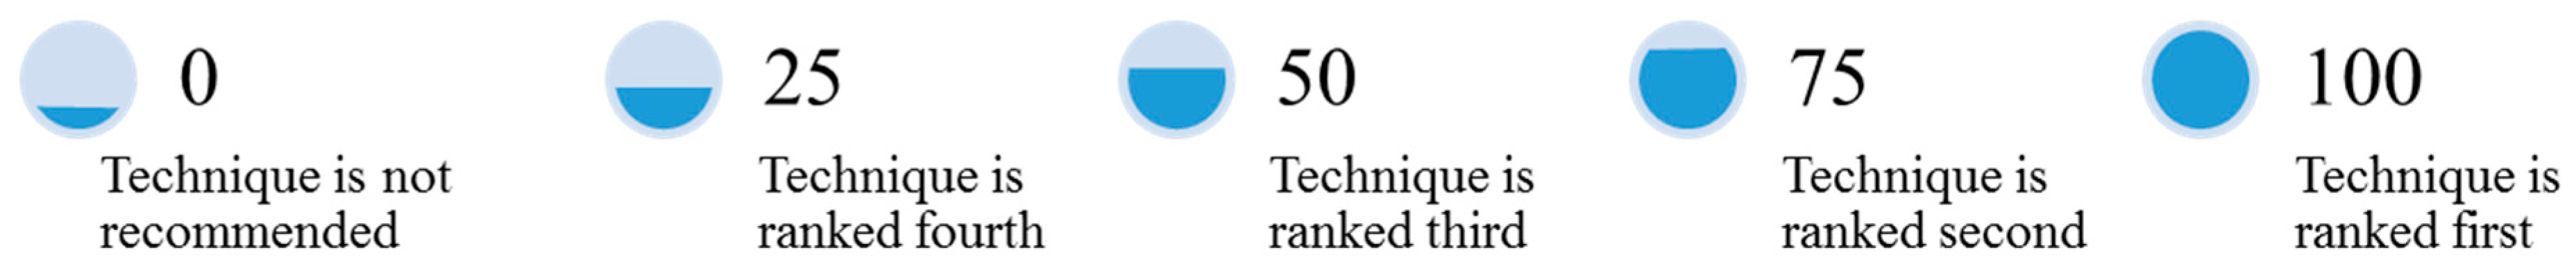
Section 3.2). The amounts of energy recovered, costs, and performances of the different WtE technologies based on selected assessment criteria were aggregated in the four MCA models. The first MCA model indicated that AD was the most appropriate WtE technology, with incineration and landfill gas recovery next and gasification the least appropriate (Table 5). AD had high scores for most criteria but requires waste to be segregated and biogas to be treated before use. In contrast, incineration does not require waste to be segregated but does require a constant and stable supply of waste with a high calorific value (Table 1). The second MCA model, using criteria weightings derived from Reference [38], gave almost the same ranking order for the WtE technologies (Equations (13) and (14)). Equation (13) is an example equation for solving the second multiple criteria analysis model. The results of the second multiple criteria analysis model for the use of waste-to-energy technologies in Bahrain are presented in Equation (14).
( I n c i n e r a t i o n 1.00 0.50 1.00 A n a e r o b i c   d i g e s t i o n 0.50 1.00 0.50 L a n d f i l l   G a s 0.25 0.25 1.00 G a s i f i c a t i o n 0.75 0.75 0.25 ) ( E l e c t r i c i t y   r e c o v e r y   p o t e n t i a l C O 2 e   e m i s s i o n s I m p a c t   o f   i n a d e q u a t e   w a s t e   s e g r e g a t i o n 0.25 0.50 0.25   ) = ( 0.75 0.75 0.44 0.63 )
( I n c i n e r a t i o n 0.75 0.25 0.25 1.00 A n a e r o b i c   d i g e s t i o n 0.75 0.75 1.00 0.75 L a n d f i l l   G a s 0.44 1.00 1.00 0.63 G a s i f i c a t i o n 0.63 0.50 0.50 0.50 ) ( 0.45 0.31 0.05 0.19 ) = ( 0.62 0.76 0.68 0.56 )
The third and fourth MCA models were based on Reference [14], in which a system for selecting WtE technologies for use in developing and emerging countries using 12 criteria was presented. The ranking orders were different from the ranking orders for the first two models. Recovering landfill gas was ranked top, then AD and incineration, and finally gasification (Table 6). These results appeared to be reasonable because WtE technologies have not previously been used in Bahrain, so starting with the cheapest option (even though it has a relatively low energy recovery potential) would be sensible now or in the near future once the national waste management strategy has been fully implemented. The results of the four MCA models were aggregated, and the Friedman nonparametric test suggested that there were no statistically significant differences in the ranking orders for the WtE technologies. AD and landfill gas recovery were ranked highest, then incineration, and finally gasification (Table 7). These results were consistent with the results of previous studies for Saudi Arabia and Oman, for which AD was also ranked top [38,43].
Comparing the WtE technologies by performing MCAs allowed for several quantitative and qualitative assessment criteria to be taken into consideration. The assessment criteria selected strongly affected the ranking order. Ensuring that all of the relevant criteria were selected was therefore important to assessing the performances, strengths, and weaknesses of WtE technologies. However, selecting the most appropriate WtE technology is not easy, because it is important to minimize negative impacts on the environment [38].
There are several challenges to the use of WtE in Bahrain. The first is the energy content and composition of MSW. Waste with a high moisture content, e.g., food waste, can negatively affect incineration and gasification by causing the energy recovery potential to be low [21,22,71]. MSW with a lower heating value (LHV) of less than 3.15 MJ/kg can give very low electricity generation efficiencies for incinerators (mean 22%), and some of the electricity generated will be consumed by certain processes within an incinerator. This means that if most paper and plastic waste in Bahrain is recycled, the electricity generation potential of MSW could be low [82]. This is because plastic waste and paper waste are good fuels for WtE incinerators [14,21]. This means that all waste recycling plans must be considered before deciding whether MSW should be incinerated.
The second challenge is related to waste production being stable enough to ensure energy can be recovered effectively. Waste production stability is perceived to be a barrier in many countries [71]. There is an alarming trend in Bahrain. The total amount of waste produced in the Capital Governorate decreased by 23% in the first quarter of 2019. This could have been caused by waste awareness campaigns or the implementation of a new value-added tariff. This decrease in MSW production will affect the cost effectiveness and energy recovery potential of WtE technologies. Other factors could also affect the waste production stability. For example, campaigns to distribute food waste and campaigns to decrease plastic use could affect MSW production stability. All future campaigns and changes in reuse and recycling activities must be considered when planning the use of WtE technologies in Bahrain.
Another potential challenge is controlling air pollution and ensuring that toxic flue gases (e.g., polychlorinated dibenzo-p-dioxins and dibenzofurans) are removed [22,71]. This is not an issue in the EU because of strict laws and the use of advanced technologies. Polychlorinated dibenzo-p-dioxin, dibenzofuran, and particulate matter (PM10) emissions during WtE incineration are minimal in the EU in both absolute terms and in terms of the contributions of such emissions to total emissions [83]. Although flue gas emissions for the best available technologies are low, they are close to flue gas emissions limits in the EU [17]. Complying with strict emissions limits increases construction costs [83]. Emissions during incineration are not controlled effectively in many developing countries because of the high costs involved [7].
The cost of investing in WtE technologies is relatively high compared to the costs involved in conventional and renewable energy sources. WtE technologies have been estimated to cost 1700–2000 USD/kW to install, whereas natural gas combined cycle systems cost 450–1500 USD/kW to install, photovoltaic systems are 900–1500 USD/kW to install, and onshore wind turbines are 1100–1500 USD/kW to install [84]. The capital cost may be perceived to be an obstacle in Bahrain, particularly because a “fiscal balance program” has been implemented for 2019–2022. The annual budget for projects was 530 × 106 USD in the recently approved state budget for the fiscal years 2019–2020. Previously published capital costs have ranged from 6 × 10⁶ to 207 × 106 USD (Table 4), but the actual costs for similar projects in other GCC countries have been much higher (Table 2) and have been close to or higher than the annual budget for projects in Bahrain. Establishing similar projects in Bahrain in this period will therefore need to be strongly justified, if such a project is to be financed by the government, to ensure that the three pillars of sustainable development (society, economy, and environment) are considered.
There are two main justifications for financing WtE projects in Bahrain: to contribute to achieving the renewable energy targets of 5% by 2025 and 10% by 2035 or to decrease CO2e emissions. The capital costs of other types of renewable energy in Bahrain range from 11 × 106 USD for offshore wind to 115 × 106 USD for solar energy. WtE technologies cost considerably more. The electricity generation potentials for WtE technologies in Bahrain are very sensitive to several factors, making it difficult to guarantee the generation of large amounts of electricity. WtE incinerators have the highest electricity generation potential, but the capacity of WtE incinerators would be ~100 MW, which is only 14% of the renewable energy goal, and the cost would be higher than, for example, solar energy. In terms of using WtE technologies to decrease CO2e emissions, the share the waste sector could contribute to decreasing total national emissions will be relatively low, making it logical to target emissions from other sectors.
One last justification for using WtE technologies could be valid. This is decreasing the area required for landfills if current economic, social, and environmental conditions are assumed to be valid in the future. Bahrain has limited areas available for landfills, so it would be wise to decrease the area required for MSW. However, there may be other ways of achieving this, such as by exporting MSW to neighboring countries with WtE plants but insufficient MSW. Nonetheless, there are several international funding opportunities for developing WtE plants, including the “Green Climate Fund” and the “Nationally Appropriate Mitigation Actions (NAMA) facility” [73].
Despite the challenges, it is imperative to ensure public participation throughout a WtE project to ensure success [17]. Public approval must be obtained before construction of a WtE plant because of environmental concerns. Public objections to WtE plants have caused many projects around the world to be terminated or delayed [45].
The challenges to establishing WtE plants (described above) have been addressed in many studies performed worldwide. In general, WtE technologies are supported in many developing countries, but there is a growing trend against incineration in some developed countries. For example, some nongovernmental organizations in the EU have argued that incineration closes the material loop and does not encourage recycling. The European Commission has suggested that the waste hierarchy should be used as a guideline and that an incineration plant should not be constructed unless there is a guaranteed feedstock for the lifetime of the plant, taking recycling obligations into consideration. On the other hand, some people perceive waste to be a source of renewable energy that can help countries meet their renewable energy goals [85].
The findings of this paper suggest several policy implications for Bahrain, as follows:
  • Although the national waste strategy suggests that Estidama is responsible for data collection, it is imperative to provide data and indicators related to waste in Bahrain. Such data are not only missing in Bahrain but also in some other countries in the GCC [40];
  • Set targets for waste recycling and WtE and ensure collaboration with stakeholders;
  • Ensure consistency in waste-relevant policies among different stakeholders;
  • Encourage the reduction, reuse, and recycling of waste before disposal, which contributes to climate change mitigation;
  • Emphasize the need to adopt a participatory approach to waste management in Bahrain.
It is recommended for Bahrain and perhaps for other areas with similar circumstances that an understanding of how the fiscal balance program influences the quantity and characteristics of MSW be gained before decisions about establishing WtE plants are made. It is recommended that Bahrain wait until 2021 to make such decisions because WtE plants in other GCC countries will start operating at that time. This will allow the performances of those plants to be assessed and the energy recovery potentials in the ex ante assessments to be compared to the actual electricity production values in ex post assessments.

5. Conclusions

In this paper, historical CO2e emissions from MSW in Bahrain were calculated, future emissions were predicted, and the effectiveness of several WtE technologies was assessed as a means for climate change mitigation. The originality of this paper lies in presenting a new case study for which new data were provided, especially concerning CO2e emissions and energy recovery potential. The details of the case of Bahrain were explored and synthesized for the first time, giving insights into a previously unexplored sector for climate change mitigation in Bahrain. Additionally, a set of existing methods was used in an integrated way to give a holistic picture of the waste sector in Bahrain and how it contributes to climate change. The integrated approach to the assessment of WtE technologies provided insights into the performance of each technology against selected assessment criteria. Furthermore, developing multiple MCA models showed the robustness of the results and how the ranking order of the technologies changed only slightly when different criteria and criteria weights were used. However, the adopted approach had some limitations. The limitations included subjectivity in the selection of criteria and criteria weights, in addition to the validity of assumptions used in the assessment. These limitations can be overcome with proper research design.
Although this study focused on Bahrain, several lessons can be drawn from the findings for application in other developing countries, including:
  • Considering the three pillars of sustainability to balance decision-making between the environment, economy, and society;
  • Considering a group of factors before adopting any of the WtE technologies. These include energy costs, MSW composition, waste production stability, air pollution control, investment costs, and public participation and acceptance;
  • Bearing in mind that potential energy recovery is sensitive to many factors, and if energy recovery is emphasized, then the WtE technologies need to carefully be assessed;
  • Ensuring integration of the policies in different sectors, as policies and targets in one sector may support WtE technologies (e.g., waste management and renewable energy targets), while policies in another sector contradict them (e.g., plastic waste minimization plans, which reduce the electricity generation potential);
  • Solutions beyond the geographical space may exist, such as transporting waste to a neighboring country, especially if part of an economic union and the WtE plants in the other country lack sufficiently large quantities of waste.
The results of this paper led to four main recommendations, given below:
  • Ensure integration in terms of planning for different sectors. Mitigating CO2e emissions from waste is linked to climate change mitigation, environmental management, and energy planning;
  • Capacity building for WtE technologies needs to be increased, and technologies may need to be modified to meet local needs;
  • Encourage performance assessments of WtE technologies in different countries to be reported. This could form part of the north–south collaboration within the Paris Agreement. Accessible databases for WtE plants around the world should be made available;
  • Create links between GCC countries related to WtE technologies to allow experiences and success stories to be shared and to inform decision-makers.
Future research should be focused on maximizing the benefits of WtE technologies to make them attractive to petroleum-producing countries and competitive with renewable and nonrenewable energy sources. Research focused on decreasing CO2e emissions from MSW in GCC countries using other mitigation measures should also be explored.

Funding

This research was funded by the Arabian Gulf University, grant number NR-AK-2017.

Conflicts of Interest

The funder had no role in the design of the study; in the collection, analyses, or interpretation of data; in the writing of the manuscript; or in the decision to publish the results.

References

  1. IEA/OECD. Key World Energy Statistics; IEA: Paris, France, 2018. [Google Scholar]
  2. Sabouni, R.; Blaschke, C.; Bkayrat, R.; Gentil, S. Energy Efficiency in the GCC: Status and Outlook. Available online: http://cebcmena.com/wp-content/uploads/2018/03/CEBC-Energy-Efficiency-in-the-GCC-January-2018-REV2.pdf (accessed on 21 July 2019).
  3. IRENA. Renewable Energy: Market. Analysis; IRENA: Abu Dhabi, UAE, 2019. [Google Scholar]
  4. Wogan, D.; Pradhan, S.; Albardi, S. GCC Energy System: Overview—2017; KAPSARC: Riad, Saudi Arabien, 2017. [Google Scholar]
  5. Bogner, J.; Ahmed, M.; Diaz, C.; Faaij, A.; Gao, Q.; Hashimoto, S.; Mareckova, K.; Pipatti, R.; Zhang, T. Waste management. In Climate Change 2007: Mitigation. Contribution of Working Group III to the Fourth Assessment Report of the Intergovernmental Panel on Climate Change; Metz, B., Davidson, O.R., Bosch, P.R., Dave, R., Meyer, L.A., Eds.; Cambridge University Press: Cambridge, UK; New York, NY, USA, 2007. [Google Scholar]
  6. Fischedick, M.; Roy, J.; Abdel-Aziz, A.; Acquaye, A.; Allwood, J.M.; Ceron, J.P.; Geng, Y.; Kheshgi, H.; Lanza, A.; Perczyk, D.; et al. Industry. In Climate Change 2014: Mitigation of Climate Change. Contribution of Working Group III to the Fifth Assessment Report of the Intergovernmental Panel on Climate Change; Edenhofer, O., Pichs-Madruga, R., Sokona, Y., Farahani, E., Kadner, S., Seyboth, K., Adler, A., Baum, I., Brunner, S., Eickemeier, P., et al., Eds.; Cambridge University Press: Cambridge, UK; New York, NY, USA, 2014. [Google Scholar]
  7. Bogner, J.; Pipatti, R.; Hashimoto, S.; Diaz, C.; Mareckova, K.; Diaz, L.; Kjeldsen, P.; Monni, S.; Faaij, A.; Gao, Q.; et al. Mitigation of global greenhouse gas emissions from waste: Conclusions and strategies from the Intergovernmental Panel on Climate Change (IPCC) Fourth Assessment Report. Working Group III (Mitigation). Waste management & research. J. Int. Solid Wastes Public Clean. Assoc. ISWA 2008, 26, 11–32. [Google Scholar] [CrossRef]
  8. Hoa, N.T.; Matsuoka, Y. The analysis of greenhouse gas emissions/reductions in waste sector in Vietnam. Mitig. Adapt. Strateg. Glob. Chang. 2017, 22, 427–446. [Google Scholar] [CrossRef]
  9. Pikoń, K.; Gaska, K. Greenhouse gas emission mitigation relevant to changes in municipal solid waste management system. J. Air Waste Manag. Assoc. 2012, 60, 782–788. [Google Scholar] [CrossRef]
  10. Chandel, M.K.; Kwok, G.; Jackson, R.B.; Pratson, L.F. The potential of waste-to-energy in reducing GHG emissions. Carbon Manag. 2012, 3, 133–144. [Google Scholar] [CrossRef] [Green Version]
  11. Mustafa, S.S.; Mustafa, S.S.; Mutlag, A.H. Kirkuk municipal waste to electrical energy. Int. J. Electr. Power Energy Syst. 2013, 44, 506–513. [Google Scholar] [CrossRef]
  12. Kawai, K.; Tasaki, T. Revisiting estimates of municipal solid waste generation per capita and their reliability. J. Mater. Cycles Waste Manag. 2015, 18, 1–13. [Google Scholar] [CrossRef] [Green Version]
  13. Ecoprog. Waste-to-Energy 2018/2019. Available online: https://www.ecoprog.com/publications/energy-management/waste-to-energy.htm (accessed on 28 May 2019).
  14. Mutz, D.; Hengevoss, D.; Hugi, C.; Gross, T. Waste-to-Energy Options in Municipal Solid Waste Management; GIZ: Eschborn, Germany, 2017. [Google Scholar]
  15. Alzate, S.; Restrepo-Cuestas, B.; Jaramillo-Duque, Á. Municipal solid waste as a source of electric power generation in Colombia: A techno-economic evaluation under different scenarios. Resources 2019, 8, 51. [Google Scholar] [CrossRef]
  16. Council, W.E. World Energy Resources: Waste to Energy. Available online: https://www.worldenergy.org/wp-content/uploads/2016/10/World-Energy-Resources-Full-report-2016.10.03.pdf (accessed on 28 May 2019).
  17. ISWA. ISWA Guidelines: Waste to Energy in Low and Middle Income Countries; ISWA: Vienna, Austria, 2013. [Google Scholar]
  18. Makarichi, L.; Jutidamrongphan, W.; Techato, K.A. The evolution of waste-to-energy incineration: A review. Renew. Sustain. Energy Rev. 2018, 91, 812–821. [Google Scholar] [CrossRef]
  19. Alzate Arias, S.; Restrepo-Cuestas, B.; Jaramillo-Duque, Á. Electricity generation potential from solid waste in three Colombian municipalities. TecnoLógicas 2018, 21, 111–128. [Google Scholar] [CrossRef]
  20. Carneiro, M.L.N.M.; Gomes, M.S.P. Energy, exergy, environmental and economic analysis of hybrid waste-to-energy plants. Energy Convers. Manag. 2019, 179, 397–417. [Google Scholar] [CrossRef]
  21. Chen, Y.C. Evaluating greenhouse gas emissions and energy recovery from municipal and industrial solid waste using waste-to-energy technology. J. Clean. Prod. 2018, 192, 262–269. [Google Scholar] [CrossRef]
  22. Alzate-Arias, S.; Jaramillo-Duque, Á.; Villada, F.; Restrepo-Cuestas, B. Assessment of government incentives for energy from waste in Colombia. Sustainability 2018, 10, 1294. [Google Scholar] [CrossRef]
  23. Abushammala, M.F.; Qazi, W.A.; Azam, M.H.; Mehmood, U.A.; Al-Mufragi, G.A.; Alrawahi, N.A. Economic and environmental benefits of landfill gas utilisation in Oman. Waste Manag. Res. J. Int. Solid Wastes Public Clean. Assoc. ISWA 2016, 34, 717–723. [Google Scholar] [CrossRef]
  24. Abdallah, M.; Shanableh, A.; Shabib, A.; Adghim, M. Financial feasibility of waste to energy strategies in the United Arab Emirates. Waste Manag. 2018, 82, 207–219. [Google Scholar] [CrossRef]
  25. Nizami, A.S.; Shahzad, K.; Rehan, M.; Ouda, O.K.M.; Khan, M.Z.; Ismail, I.M.I.; Almeelbi, T.; Basahi, J.M.; Demirbas, A. Developing waste biorefinery in Makkah: A way forward to convert urban waste into renewable energy. Appl. Energy 2017, 186, 189–196. [Google Scholar] [CrossRef]
  26. Ouda, O.K.M.; Cekirge, H.M.; Raza, S.A.R. An assessment of the potential contribution from waste-to-energy facilities to electricity demand in Saudi Arabia. Energy Convers. Manag. 2013, 75, 402–406. [Google Scholar] [CrossRef]
  27. Anshar, M.; Ani, F.; Kader, A. The energy potential of municipal solid waste for power generation in Indonesia. J. Mek. 2014, 37, 42–54. [Google Scholar]
  28. Abdallah, M.; Shanableh, A.; Arab, M.; Shabib, A.; Adghim, M.; El-Sherbiny, R. Waste to energy potential in middle income countries of MENA region based on multi-scenario analysis for Kafr El-Sheikh Governorate, Egypt. J. Environ. Manag. 2019, 232, 58–65. [Google Scholar] [CrossRef]
  29. Fernandez-Gonzalez, J.M.; Grindlay, A.L.; Serrano-Bernardo, F.; Rodriguez-Rojas, M.I.; Zamorano, M. Economic and environmental review of waste-to-energy systems for municipal solid waste management in medium and small municipalities. Waste Manag. 2017, 67, 360–374. [Google Scholar] [CrossRef]
  30. Mambeli Barros, R.; Tiago Filho, G.L.; da Silva, T.R. The electric energy potential of landfill biogas in Brazil. Energy Policy 2014, 65, 150–164. [Google Scholar] [CrossRef]
  31. Cabaraban, M.T.I.; Paclijan, S.S. Estimation of landfill gas production and the energy potential of municipal solid wastes from the upper Dagong dumpsite using the Philippine landfill gas model v.1. WIT Transactions on Ecology and the Environment 2015, 1, 295–301. [Google Scholar] [CrossRef]
  32. Aguilar-Virgen, Q.; Taboada-González, P.; Ojeda-Benítez, S. Analysis of the feasibility of the recovery of landfill gas: A case study of Mexico. J. Clean. Prod. 2014, 79, 53–60. [Google Scholar] [CrossRef]
  33. Johari, A.; Ahmed, S.I.; Hashim, H.; Alkali, H.; Ramli, M. Economic and environmental benefits of landfill gas from municipal solid waste in Malaysia. Renew. Sustain. Energy Rev. 2012, 16, 2907–2912. [Google Scholar] [CrossRef]
  34. Perkoulidis, G.; Kasampalis, T.; Karagiannidis, L.; Moussiopoulos, N. Development of waste-to-energy plants database for evaluating the efficiency of energy recovery from waste in Europe. Waste Biomass Valor. 2015, 6, 983–988. [Google Scholar] [CrossRef]
  35. Al Ahmad, M.; Dimashki, M.; Nassour, A.; Nelles, M. Characterization, concentrations and emission rates of volatile organic compounds from two major landfill sites in Kuwait. Am. J. Environ. Sci. 2012, 8, 56–63. [Google Scholar]
  36. Al-Jarallah, R.; Aleisa, E. A baseline study characterizing the municipal solid waste in the state of Kuwait. Waste Manag. 2014, 34, 952–960. [Google Scholar] [CrossRef] [PubMed]
  37. Koushki, P.A.; Al-Khaleefi, A.L. An analysis of household solid waste in Kuwait: Magnitude, type, and forecasting models. J. Air Waste Manag. Assoc. 1998, 48, 256–263. [Google Scholar] [CrossRef] [PubMed]
  38. Qazi, W.A.; Abushammala, M.F.; Azam, M.H. Multi-criteria decision analysis of waste-to-energy technologies for municipal solid waste management in Sultanate of Oman. Waste Manag. Res. J. Int. Solid Wastes Public Clean. Assoc. ISWA 2018, 36, 594–605. [Google Scholar] [CrossRef] [PubMed]
  39. Aleisa, E.; Al-Jarallah, R.; Shehada, D. The effect of geological and meteorological conditions on municipal waste management systems: A life cycle assessment approach. Int. J. Environ. Sci. Technol. 2019, 16, 485–494. [Google Scholar] [CrossRef]
  40. Lahou, A.A.; Alsabbagh, M. Assessment of municipal solid waste management in the state of Kuwait. Int. J. Environ. Sci. Dev. 2019, 10, 51–56. [Google Scholar] [CrossRef]
  41. Hadidi, L.A.; Omer, M.M. A financial feasibility model of gasification and anaerobic digestion waste-to-energy (WTE) plants in Saudi Arabia. Waste Manag. 2017, 59, 90–101. [Google Scholar] [CrossRef] [PubMed]
  42. Shahzad, K.; Nizami, A.S.; Sagir, M.; Rehan, M.; Maier, S.; Khan, M.Z.; Ouda, O.K.; Ismail, I.M.; BaFail, A.O. Biodiesel production potential from fat fraction of municipal waste in Makkah. PLoS ONE 2017, 12, e0171297. [Google Scholar] [CrossRef] [PubMed]
  43. Baig, M.B.; Gorski, I.; Neff, R.A. Understanding and addressing waste of food in the Kingdom of Saudi Arabia. Saudi J. Biol. Sci. 2018. [Google Scholar] [CrossRef]
  44. Allesch, A.; Brunner, P.H. Assessment methods for solid waste management: A literature review. Waste Manag. Res. 2014, 32, 461–473. [Google Scholar] [CrossRef] [PubMed]
  45. Cucchiella, F.; D’Adamo, I.; Gastaldi, M. Sustainable waste management: Waste to energy plant as an alternative to landfill. Energy Convers. Manag. 2017, 131, 18–31. [Google Scholar] [CrossRef]
  46. Dong, J.; Tang, Y.; Nzihou, A.; Chi, Y.; Weiss-Hortala, E.; Ni, M.; Zhou, Z. Comparison of waste-to-energy technologies of gasification and incineration using life cycle assessment: Case studies in Finland, France and China. J. Clean. Prod. 2018, 203, 287–300. [Google Scholar] [CrossRef]
  47. Gumisiriza, R.; Hawumba, J.F.; Okure, M.; Hensel, O. Biomass waste-to-energy valorisation technologies: A review case for banana processing in Uganda. Biotechnol. Biofuels 2017, 10, 11. [Google Scholar] [CrossRef] [PubMed]
  48. PMEW. Bahrain’s Initial Communications to the United Nations Framework Convention on Climate Change; PMEW: Manama, Bahrain, 2005. [Google Scholar]
  49. PMEW. Bahrain’s Second National Communication; PMEW: Manama, Bahrain, 2012. [Google Scholar]
  50. Authority, I.A.E. Statistical Abstract. Available online: http://www.data.gov.bh/en/ResourceCenter (accessed on 28 May 2019).
  51. Supreme Council for Environment. Waste Quantity and Type in Bahrain. Unpublished report. 2017. [Google Scholar]
  52. Bank, T.W. GDP (Current US$). Available online: https://data.worldbank.org/indicator/NY.GDP.MKTP.CD?locations=BH (accessed on 28 May 2019).
  53. Al Sabbagh, M.K.; Velis, C.A.; Wilson, D.C.; Cheeseman, C.R. Resource management performance in Bahrain: A systematic analysis of municipal waste management, secondary material flows and organizational aspects. Waste Manag. Res. J. Int. Solid Wastes Public Clean. Assoc. ISWA 2012, 30, 813–824. [Google Scholar] [CrossRef] [PubMed]
  54. Musaiger, A.; Al Zayani, A. (Eds.) The Environment in Bahrain: The State and Challenges; BCSR: Manama, Bahrain, 2008.
  55. Alayam. Minster of Works: 195 Thousand Tonnes of Food Waste Annually. Available online: https://www.alayam.com/online/local/737712/News.html (accessed on 3 June 2019).
  56. Fichtner. Waste Composition and Characterization Study. Unpublished report. 2014. [Google Scholar]
  57. Energy, U.M.O. The UAE State of Energy Report 2015. Available online: https://issuu.com/dccepublications/docs/soer_2015_book_final_single_low/75 (accessed on 3 June 2019).
  58. Gloom, S.; Alyousfi, B.; Aljenaid, S. Solid waste landfills as carbon sinks for sequestration of greenhouse gases and curtailment of climate change phenomenon. Arab Gulf J. Sci. Res. 2014, 32, 192–199. [Google Scholar]
  59. Al-Joburi, K.I. Mapping Bahrain’s subsurface municipal solid waste. Arab. J. Geosci. 2018, 11. [Google Scholar] [CrossRef]
  60. Mohareb, E.A.; MacLean, H.L.; Kennedy, C.A. Greenhouse gas emissions from waste management—Assessment of quantification methods. J. Air Waste Manag. Assoc. 2011, 61, 480–493. [Google Scholar] [CrossRef] [PubMed]
  61. IPCC/OECD/IEA. Revised 1996 IPCC Guidelines for National Greenhouse Gas. Inventories: Reference Manual; UK Metrological Office: Bracknell, UK, 1997.
  62. Eggleston, H.S.; Buendia, L.; Miwa, K.; Ngara, T.; Tanabe, K. Guidelines for National Greenhouse Gas. Inventories; IGES: Hayama, Japan, 2006. [Google Scholar]
  63. Bank, T.W. Population Estimates And Projections. Available online: https://datacatalog.worldbank.org/dataset/population-estimates-and-projections (accessed on 29 May 2019).
  64. Gómez, A.; Zubizarreta, J.; Rodrigues, M.; Dopazo, C.; Fueyo, N. Potential and cost of electricity generation from human and animal waste in Spain. Renew. Energy 2010, 35, 498–505. [Google Scholar] [CrossRef]
  65. Saarikoski, H.; Mustajoki, J.; Marttunen, M. Participatory multi-criteria assessment as ‘opening up’ vs. ‘closing down’ of policy discourses: A case of old-growth forest conflict in Finnish Upper Lapland. Land Use Policy 2013, 32, 329–336. [Google Scholar] [CrossRef]
  66. Government, D.f.C.A.L. Multi-Criteria Analysis: A Manual; Department for Communities and Local Government: London, UK, 2009.
  67. Fulop, J. Introduction to Decision Making Methods. Available online: https://pdfs.semanticscholar.org/e0d8/d4fd210c4aeae40560c7332711c7cc8dc5df.pdf (accessed on 29 May 2019).
  68. Gamper, C.D.; Turcanu, C. On the governmental use of multi-criteria analysis. Ecol. Econ. 2007, 62, 298–307. [Google Scholar] [CrossRef]
  69. Huang, I.B.; Keisler, J.; Linkov, I. Multi-criteria decision analysis in environmental sciences: Ten years of applications and trends. Sci. Total Environ. 2011, 409, 3578–3594. [Google Scholar] [CrossRef] [PubMed]
  70. Yap, H.Y.; Nixon, J.D. A multi-criteria analysis of options for energy recovery from municipal solid waste in India and the UK. Waste Manag. 2015, 46, 265–277. [Google Scholar] [CrossRef] [PubMed] [Green Version]
  71. Xin-Gang, Z.; Gui-Wu, J.; Ang, L.; Yun, L. Technology, cost, a performance of waste-to-energy incineration industry in China. Renew. Sustain. Energy Rev. 2016, 55, 115–130. [Google Scholar] [CrossRef]
  72. Munster, M.; Lund, H. Comparing waste-to-energy technologies by applying energy system analysis. Waste Manag. 2010, 30, 1251–1263. [Google Scholar] [CrossRef] [PubMed]
  73. UNFCCC. Mitigation Benefits and Co-Benefits of Policies, Practices and Actions for Enhancing Mitigation Ambition: Implementation of Circular Economies with a Focus on Wasteto-Energy Technologies and on Industrial Waste Reuse and Prevention Solutions. Available online: https://unfccc.int/sites/default/files/resource/tpMitigation.pdf (accessed on 29 May 2019).
  74. Gibbons, J. Nonparametric Statistics: An. Introduction; SAGE Publications: Newbury Park, CA, USA, 1992. [Google Scholar]
  75. Jarrell, S. Basic Statistics; Wm. C. Brown Publishers: Oxford, UK, 1994. [Google Scholar]
  76. Kirk, R. Statistics: An Introduction; Harcourt Brace College Publishers: Fort Worth, TX, USA, 1999. [Google Scholar]
  77. IPCC. Climate Change 2014: Synthesis Report. Contribution of Working Groups I, II and III to the Fifth Assessment Report of the Intergovernmental Panel on Climate Change. Available online: https://www.ipcc.ch/site/assets/uploads/2018/02/SYR_AR5_FINAL_full.pdf (accessed on 29 May 2019).
  78. Al-Waked, R.; Ouda, O.; Raza, S. Potential value of waste-to-energy facility in Riyadh City—Saudi Arabia. In Proceedings of the Conference Paper. The 8th Jordanian International Mechanical Engineering Conference, Amman, Jordan, 22–23 September 2014. [Google Scholar]
  79. Michael, T. 2—Environmental and social impacts of waste to energy (WTE) conversion plants. In Waste to Energy Conversion Technology; Klinghoffer, N.B., Castaldi, M.J., Eds.; Woodhead Publishing: Cambridge, UK, 2013; pp. 15–28. [Google Scholar]
  80. Pivato, A.; Masi, S.; De Caprio, D.; Tommasin, A. Sanitary landfill costs from design to aftercare: Criteria for defining unit cost. Detritus 2018, 4, 140. [Google Scholar] [CrossRef]
  81. Bagazi, A. A new landfill in Jeddah with a capacity of 1.5 million tonnes annually. Asharq Al-Awsat 2011. [Google Scholar]
  82. Astrup, T.; Moller, J.; Fruergaard, T. Incineration and co-combustion of waste: Accounting of greenhouse gases and global warming contributions. Waste Manag. Res. J. Int. Solid Wastes Public Clean. Assoc. ISWA 2009, 27, 789–799. [Google Scholar] [CrossRef] [PubMed]
  83. ESWET. Everything You Always Wanted to Know About Waste-to-Energy. Available online: http://www.eswet.eu/tl_files/eswet/5.%20Documents/5.1.%20Waste-to-Energy%20Handbook/ESWET_Handbook_Waste-to-Energy.pdf (accessed on 30 May 2019).
  84. Eveloy, V.; Gebreegziabher, T. Excess electricity and power-to-gas storage potential in the future renewable-based power generation sector in the United Arab Emirates. Energy 2019, 166, 426–450. [Google Scholar] [CrossRef]
  85. Malinauskaite, J.; Jouhara, H.; Czajczyńska, D.; Stanchev, P.; Katsou, E.; Rostkowski, P.; Thorne, R.J.; Colón, J.; Ponsá, S.; Al-Mansour, F.; et al. Municipal solid waste management and waste-to-energy in the context of a circular economy and energy recycling in Europe. Energy 2017, 141, 2013–2044. [Google Scholar] [CrossRef]
Figure 1. Classification of waste-to-energy (WtE) technologies [16].
Climate 07 00100 g001
Figure 2. CO2e emissions from different sectors in Bahrain, from the first and second national communications (NCs) [48,49].
Climate 07 00100 g002
Figure 3. Total amounts of waste produced and the contributions of different types of waste in Bahrain between 1997 and 2016 [50,51].
Climate 07 00100 g003
Figure 4. (a) Amount of municipal solid waste (MSW) produced, population, and gross domestic product (GDP) in Bahrain between 1997 and 2016 [50,51,52] and (b) relationships between the population and GDP and the amount of MSW produced.
Climate 07 00100 g004
Figure 5. Composition of municipal solid waste produced in Bahrain between 1987 and 2017 [53,54,55].
Climate 07 00100 g005
Figure 6. Composition of municipal solid waste produced in selected Gulf Cooperation Council countries [26,38,55,56,57].
Climate 07 00100 g006
Figure 7. Population projections used in the determination of future MSW [50,63].
Climate 07 00100 g007
Figure 8. Assessment criteria used for the first and second multiple criteria analysis models.
Climate 07 00100 g008
Figure 9. Scale used in the multiple criteria analysis models.
Climate 07 00100 g009
Figure 10. Methane emissions from the Asker landfill between 1986 and 2016, calculated using the revised IPCC 1996 and IPCC 2006 methods.
Climate 07 00100 g010
Figure 11. Box plot of methane emissions from the Asker landfill predicted using various degradable organic carbon content (DOC) values, per capita MSW generation rates, and population projections using the IPCC 2006 method.
Climate 07 00100 g011
Figure 12. Mean energy contents of municipal solid waste in some Gulf Cooperation Council countries [26,38,56,57,78]. Note: the value for Bahrain was calculated in this study. The value for Dubai was calculated after organic waste had been removed to improve energy recovery.
Climate 07 00100 g012
Figure 13. Electricity generation potentials for waste-to-energy technologies in Bahrain between 2020 and 2030.
Climate 07 00100 g013
Figure 14. Electricity generation potentials for waste-to-energy technologies in Bahrain in 2030 calculated using various assumptions.
Climate 07 00100 g014
Figure 15. CO2e emissions reduction potential from municipal solid waste in Bahrain.
Climate 07 00100 g015
Table 1. Pros and cons of selected waste-to-energy technologies [14,16,17,22,29,44,45,46,47].
TechnologyIncinerationAnaerobic DigestionLandfill GasGasification
Brief description
  • Direct burning of waste at 800–1000 °C
  • Products: heat, power, dust, ash, air pollutants
  • Biochemical conversion of organic waste to produce biogas
  • Processing organic waste takes ~15–30 days
  • Produces methane (65%), CO2 (35%), and some air pollutants
  • Products: biomethane, heat, power, nutrient-rich digestate
  • Anaerobic decomposition of biodegradable waste in a sanitary landfill
  • Wells with pipes in the landfill are used to retrieve the gas
  • Converts waste containing carbon into synthesis gas
  • Temperature of 750 °C
  • Methane, hydrogen, and other hydrocarbons are produced
  • Processes around 100 t of waste each day
  • Products: power, heat, ash
Pros
  • Inputs can include whole waste or waste with recyclable material removed
  • Can decrease the waste volume by 80%
  • Does not require a large land area
  • Economically feasible
  • Air pollutants can be controlled
  • Less complicated than other methods
  • Suitable for more than 2 tonnes of waste per day
  • Uses an enclosed system, which allows emissions to be controlled
  • No power is required
  • No odors are produced
  • Little land is required
  • Cheapest option
  • Not a complex process
  • Gas produced can be used to generate power or directly to produce heat
  • Fast
  • Little air pollution caused
  • Can decrease waste volume by 50%–90%
  • Synthesis gas can be used to generate electricity or produce fuels, chemicals, and synthesis natural gas
Cons
  • Old technology
  • Produces large amounts of greenhouse gases
  • Latest systems allow air pollutant emissions to be controlled to comply with emissions standards
  • Not economically feasible for <100 tonnes of waste per day
  • Requires waste with a high calorific value
  • High capital cost
  • Requires organic waste
  • Waste needs to be segregated
  • Biogas needs to be treated before use
  • Low power generation efficiency
  • Requires large land area
  • Pollution may be caused by surface runoff during rain
  • Leachates may be released into the groundwater
  • Spontaneous explosions can occur because of methane accumulation
  • Complex process
  • Requires recyclable material and inorganic waste to be removed
  • Poor energy recovery associated with waste with a high moisture content
  • Cleaning the synthesis gas is challenging for large plants
Table 2. Waste-to-energy projects in Gulf Cooperation Council (GCC) countries.
CountryProjectCapacity (kt/year)Installed Power Generation Capacity (MW)Cost (Million USD)Operational Year
United Arab Emirates Sharjah300302202020
Sharjah (Sajja area)40080
Ras Al Khaimah-232
Dubai (Al Warsan)18251855452020
Abu Dhabi-100850
BahrainAskar39025480
KuwaitKabd1195100756
Oman 803507502023
Note: Saudi Arabia has set an ambitious target of 3 GW for WtE facilities in 2030.
Table 3. Energy contents of various types of waste [26].
Type of WasteEnergy Content (Btu/Ib)
Mixed paper6800
Mixed food waste2400
Mixed plastic14,000
Textiles8100
Waste hardwood6500
Table 4. Estimated costs of using various waste-to-energy technologies (modified from Reference [14]).
TechnologyCapital Cost (Million USD)Annual Capital Cost (USD/t)Annual Operating and Maintenance Costs (USD/t)Total Annual Cost (USD/t)Plant Size (kt/year)Revenue from Generating Electricity (US$/t)Total Annual Cost to Be Recovered (US$/t Waste Input)
Incineration151–20790–129201291–33015047244–283
Anaerobic digestion13–2213–2111–1724–3850–150519–33
Landfill gas6–71.60.31.88503−1.2
Gasification90–13439–5034–4573–952503043–65
Note: A new sanitary landfill almost the same size as the current landfill (seven cells, each ~60,000 m2 and 4 m deep, with a total volume for all seven cells of ~1.68 × 10⁶ m3) would cost ~15.2 × 10⁶ USD, based on a construction cost of ~9 USD/m3 [80]. However, the cost of constructing a 2.7 × 10⁶ m3 cell in a sanitary landfill in Saudi Arabia was only ~5 × 10⁶ USD [81].
Table 5. Simple multiple criteria analysis performance matrix for the waste-to-energy technologies.
Technology/CriteriaEnvironmentalEconomicSocialOtherTotal ScoreFinal Rank
Electricity Recovery Potential 1CO2e Emissions 2Impact of Inadequate Waste Segregation 2Capital Cost 1Public Acceptance 3Lack of Expertise 2Area Required 2
Incineration10.510.250.25115.002
Anaerobic digestion0.510.50.75110.55.251
Landfill gas0.250.2511110.254.753
Gasification0.750.750.250.50.50.250.753.754
Note: The scale 0–1 was used, with 1 being the best option, 0.75 the second best option, 0.5 the third best option, and 0.25 the fourth best option. A value of 0 indicates the option is not suitable or recommended. The option with the highest total score is ranked at the top. 1 Based on Table 4; 2 Reference [70]; 3 Reference [38].
Table 6. Simple performance matrix for waste-to-energy technologies based on a previous publication [14].
No.CriterionIncinerationAnaerobic DigestionLandfill GasGasification
1 *A systematic waste collection is in place; however, recycling is not organized.0.75010
1 **A systematic waste collection is in place, and recycling is organized.1110.25
2MSW is sometimes mixed with fractions of mineral or hazardous waste.10.510.5
3 *Calorific value of the waste is >8 MJ/kg on average.1111
3 **Calorific value of the waste is <7 MJ/kg on average with relatively high humidity (after removing the plastic waste, assuming the recycling of it).0.5110
4More than 150 kt/y of suitable waste is available.1110.25
5 *The public/the private sectors have no experience with WtE.000.750
5**The public/the private sectors have experience but need capacity building.0.750.7510.75
6Almost no changes will occur to the distance/time of transporting waste.1110.25
7There is no market for process residues; however, it can be safely disposed of at a near controlled landfill.0.750.7510.75
8A national legal framework for WtE exists, and the international standards are ensured.00.750.750
9Costs of waste collection and disposal are covered; however, covering the cost of WtE projects may be difficult.0.750.750.750.75
10Most spare parts can be purchased locally, and sale offices for imported spare parts are also available.0.750.7510.75
11WtE facilities are close to end users, and good transport infrastructure exists.1110.25
12Economic incentives for low carbon energy generation are regulated by law but may not have been implemented yet.0.750.7510.75
Total score (current state)8.758.2511.255.25
Final rank2214
Total score (near future)9.251011.55.25
Final rank3214
Note: The scale 0–1 was used, with 1 being the best option, 0.75 the second best option, 0.5 the third best option, and 0.25 the fourth best option. A value of 0 indicates the option is not suitable or recommended. The option with the highest total score is ranked at the top. * The current state; ** the state in the near future.
Table 7. Rankings of the waste-to-energy (WtE) technologies for Bahrain, determined using the four multicriteria analysis (MCA) models.
WtE TechnologyFirst MCA ModelSecond MCA ModelThird MCA ModelFourth MCA Model
Incineration2323
Anaerobic digestion1122
Landfill gas3211
Gasification4444

