Controls on Land Surface Temperature in Deserts of Southern California Derived from MODIS Satellite Time Series Analysis, 2000 to 2018

Abstract
:1. Introduction
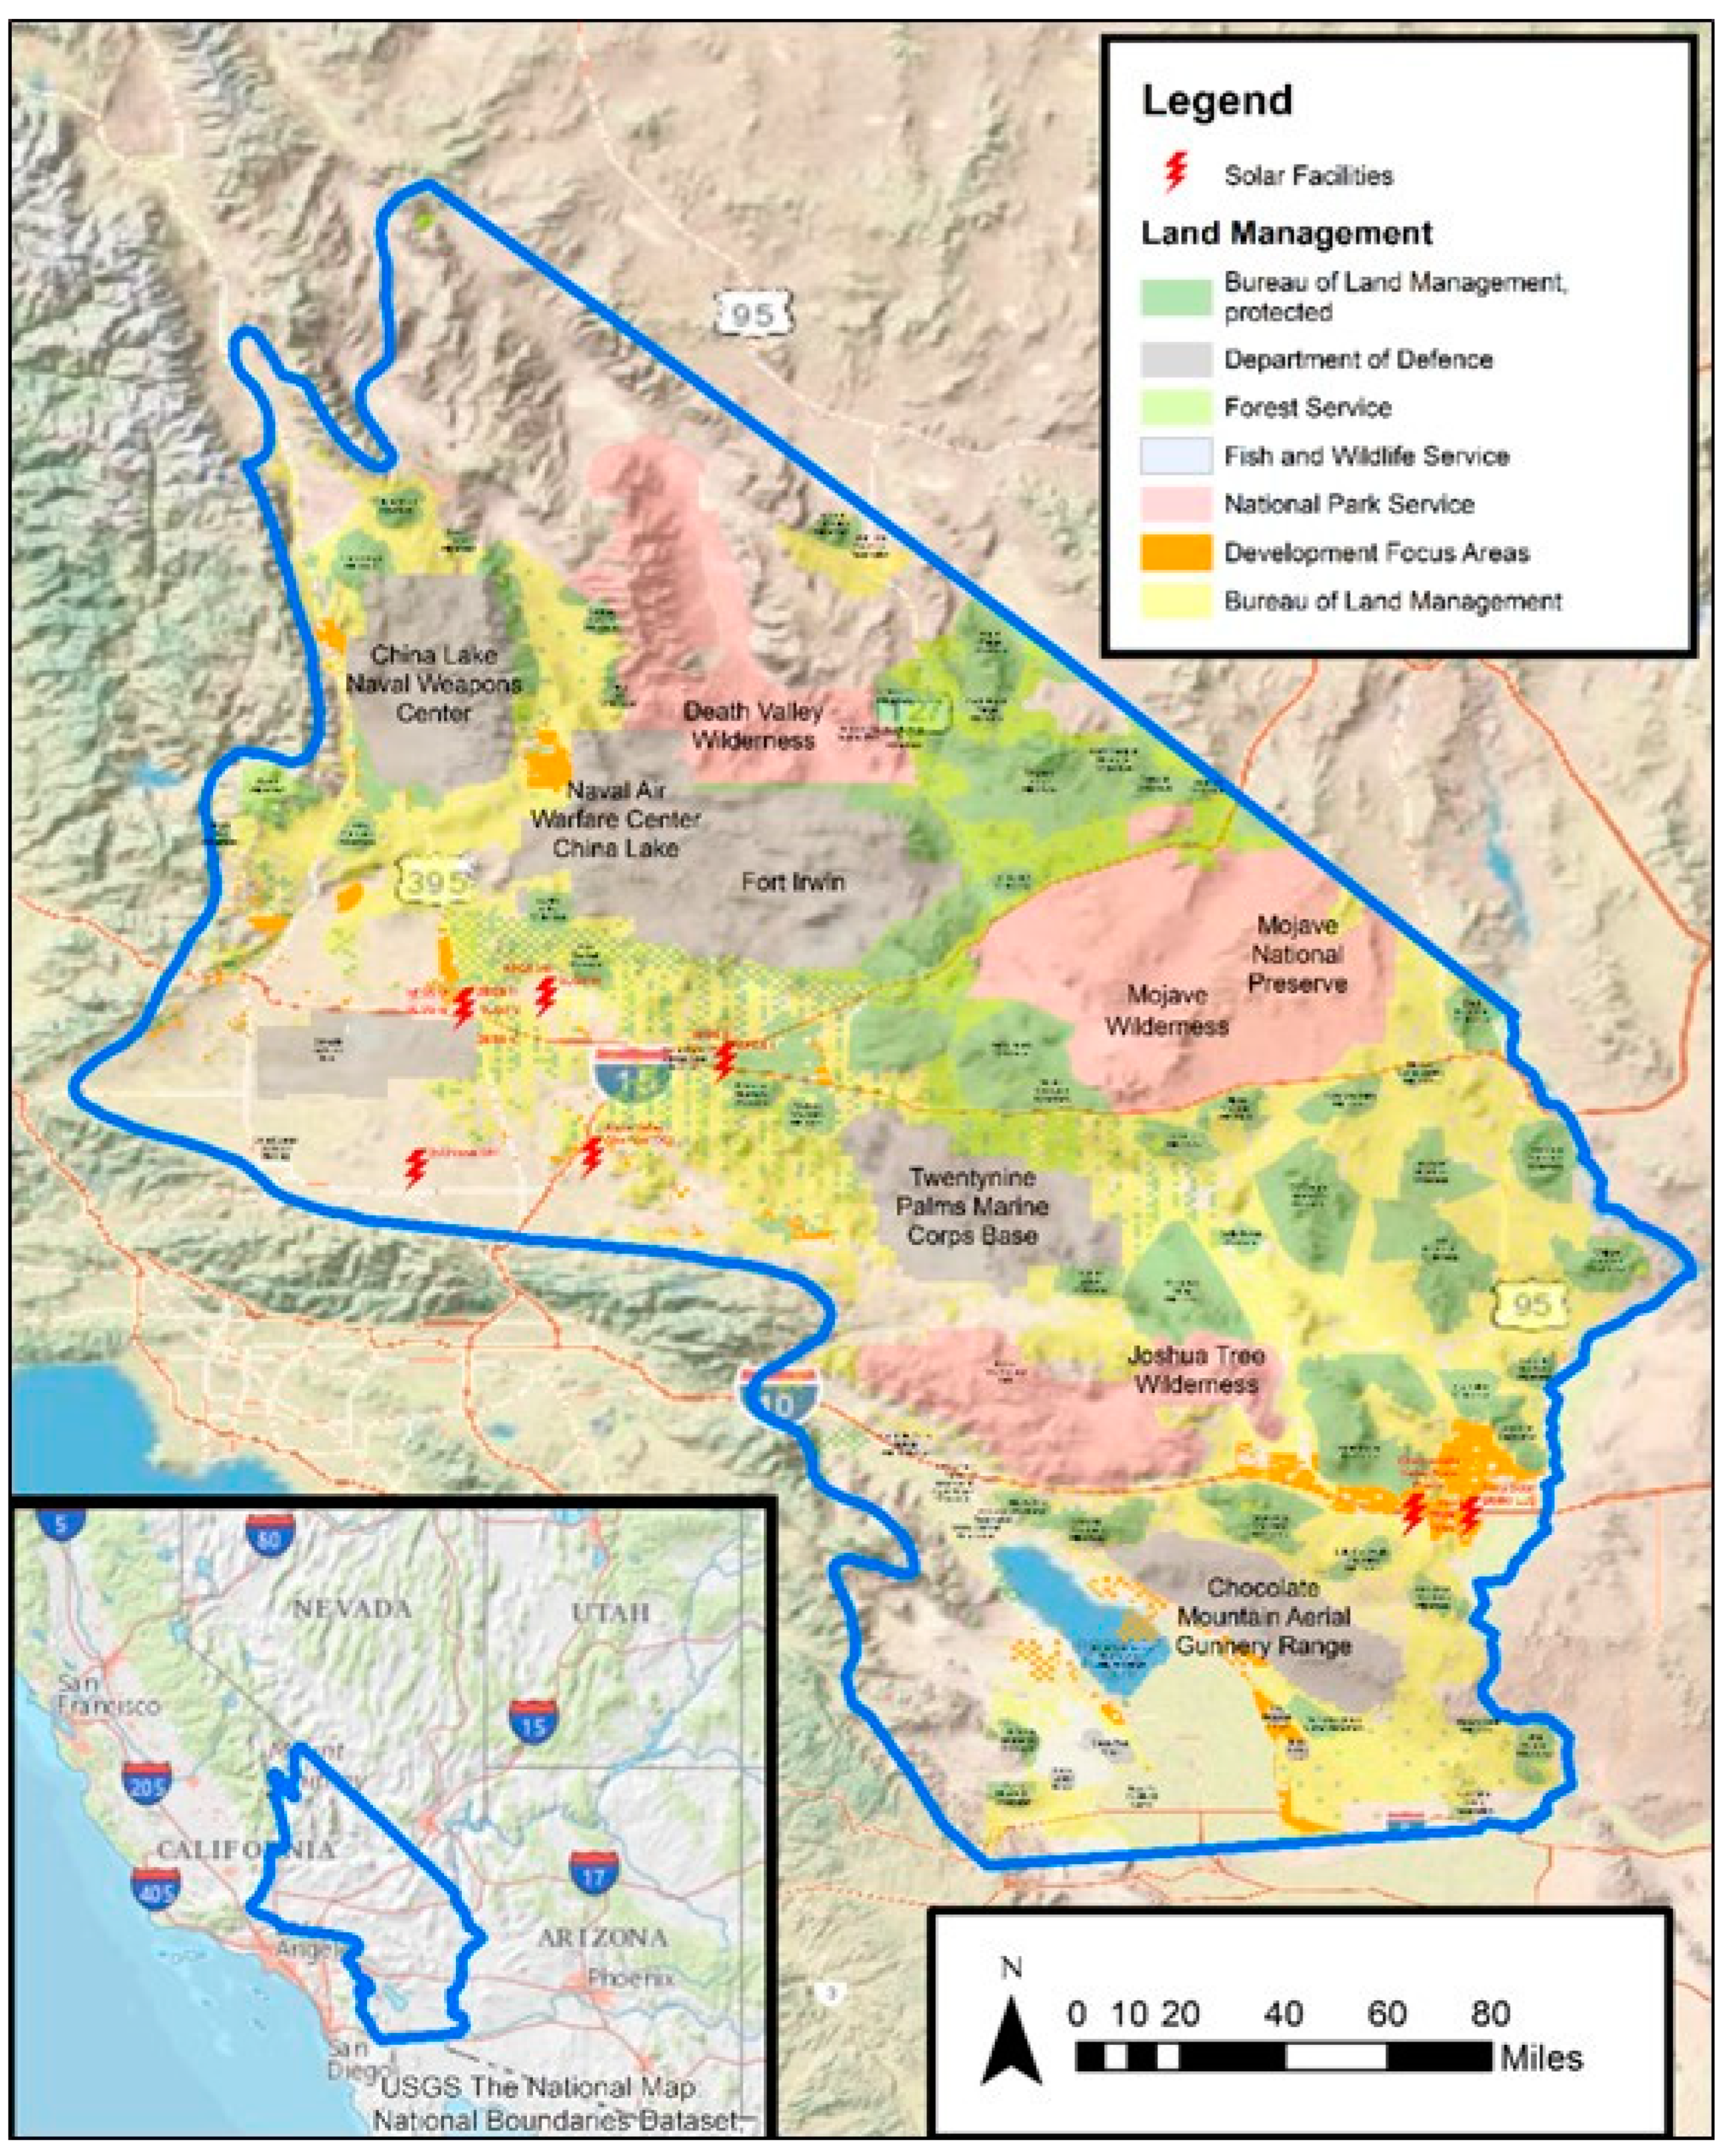
2. Study Area
3. Materials and Methods
3.1. MODIS Land Surface Temperature Data
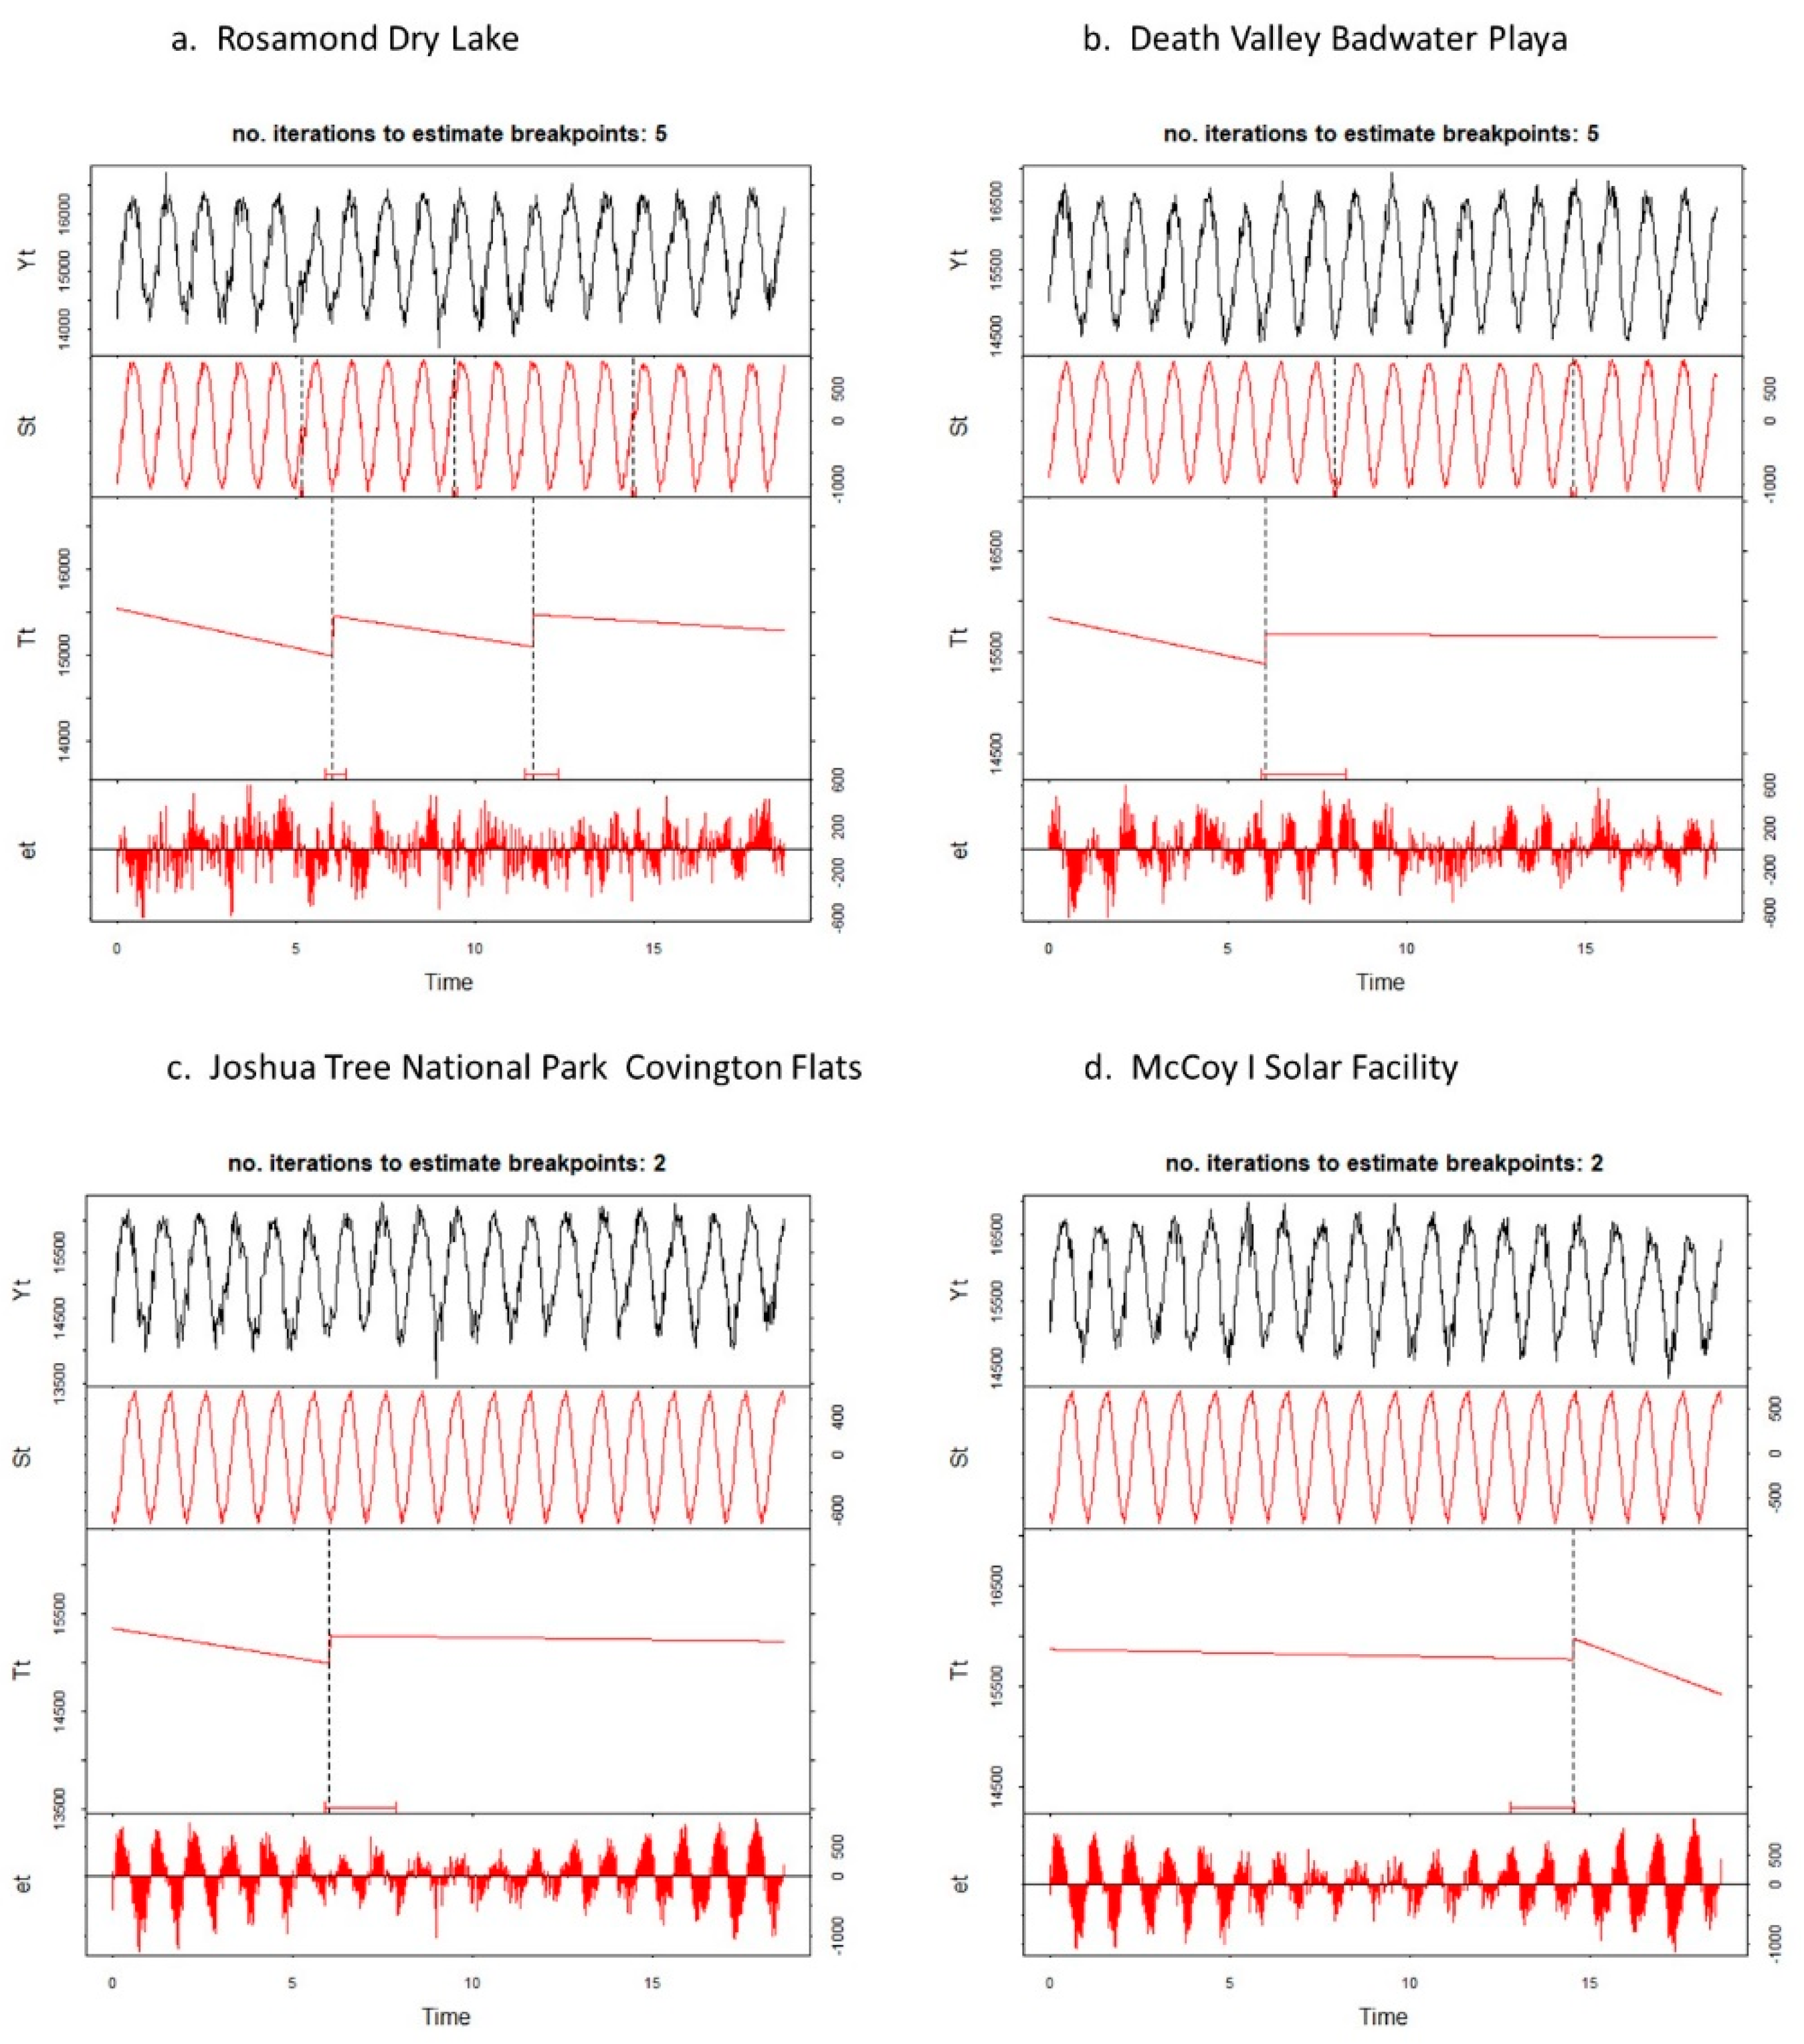
3.2. Time Series Change Detection and Statistical Analyses
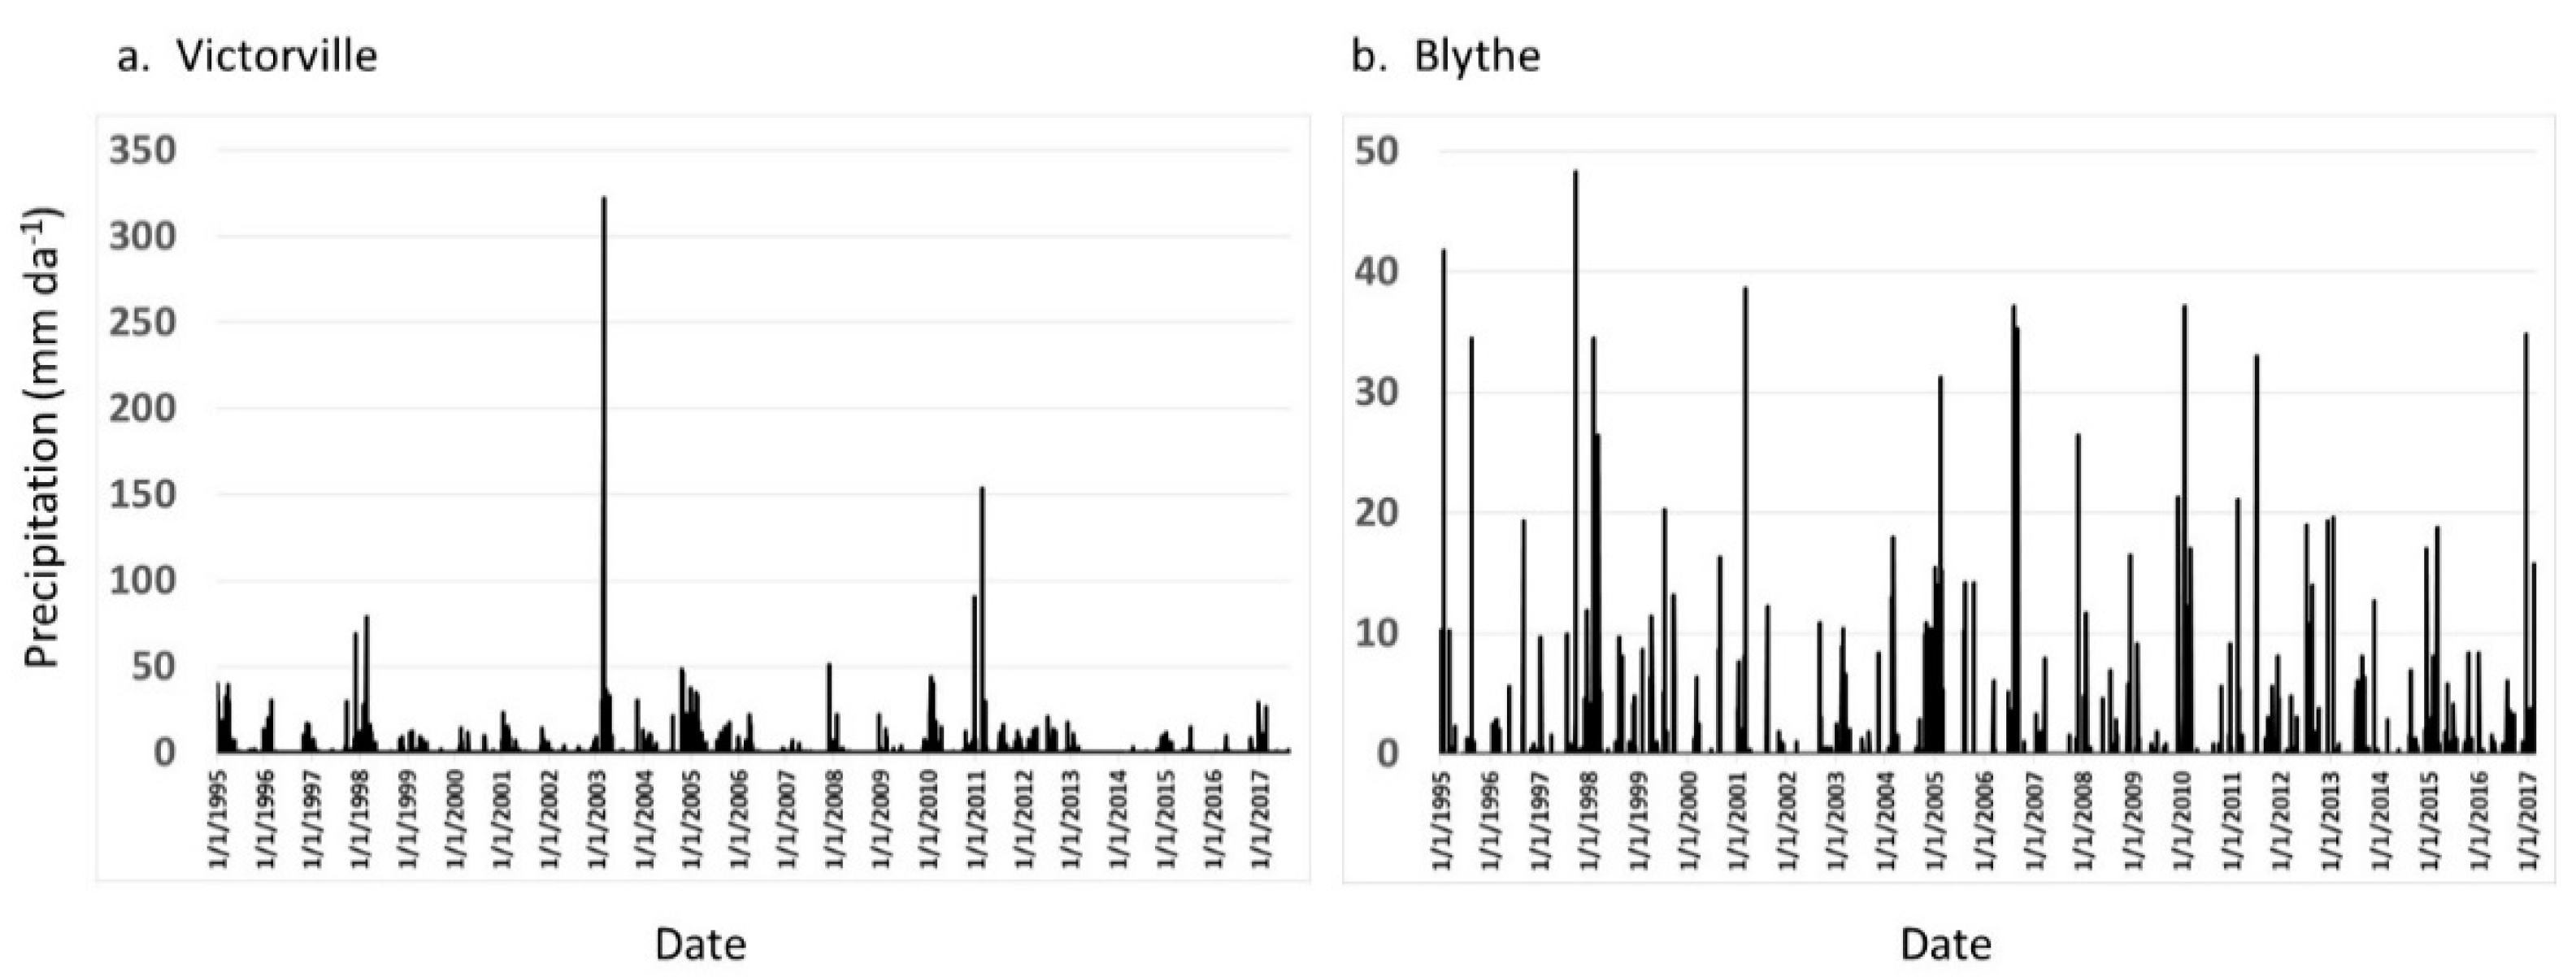
3.3. Long-Term Climate Records
4. Results
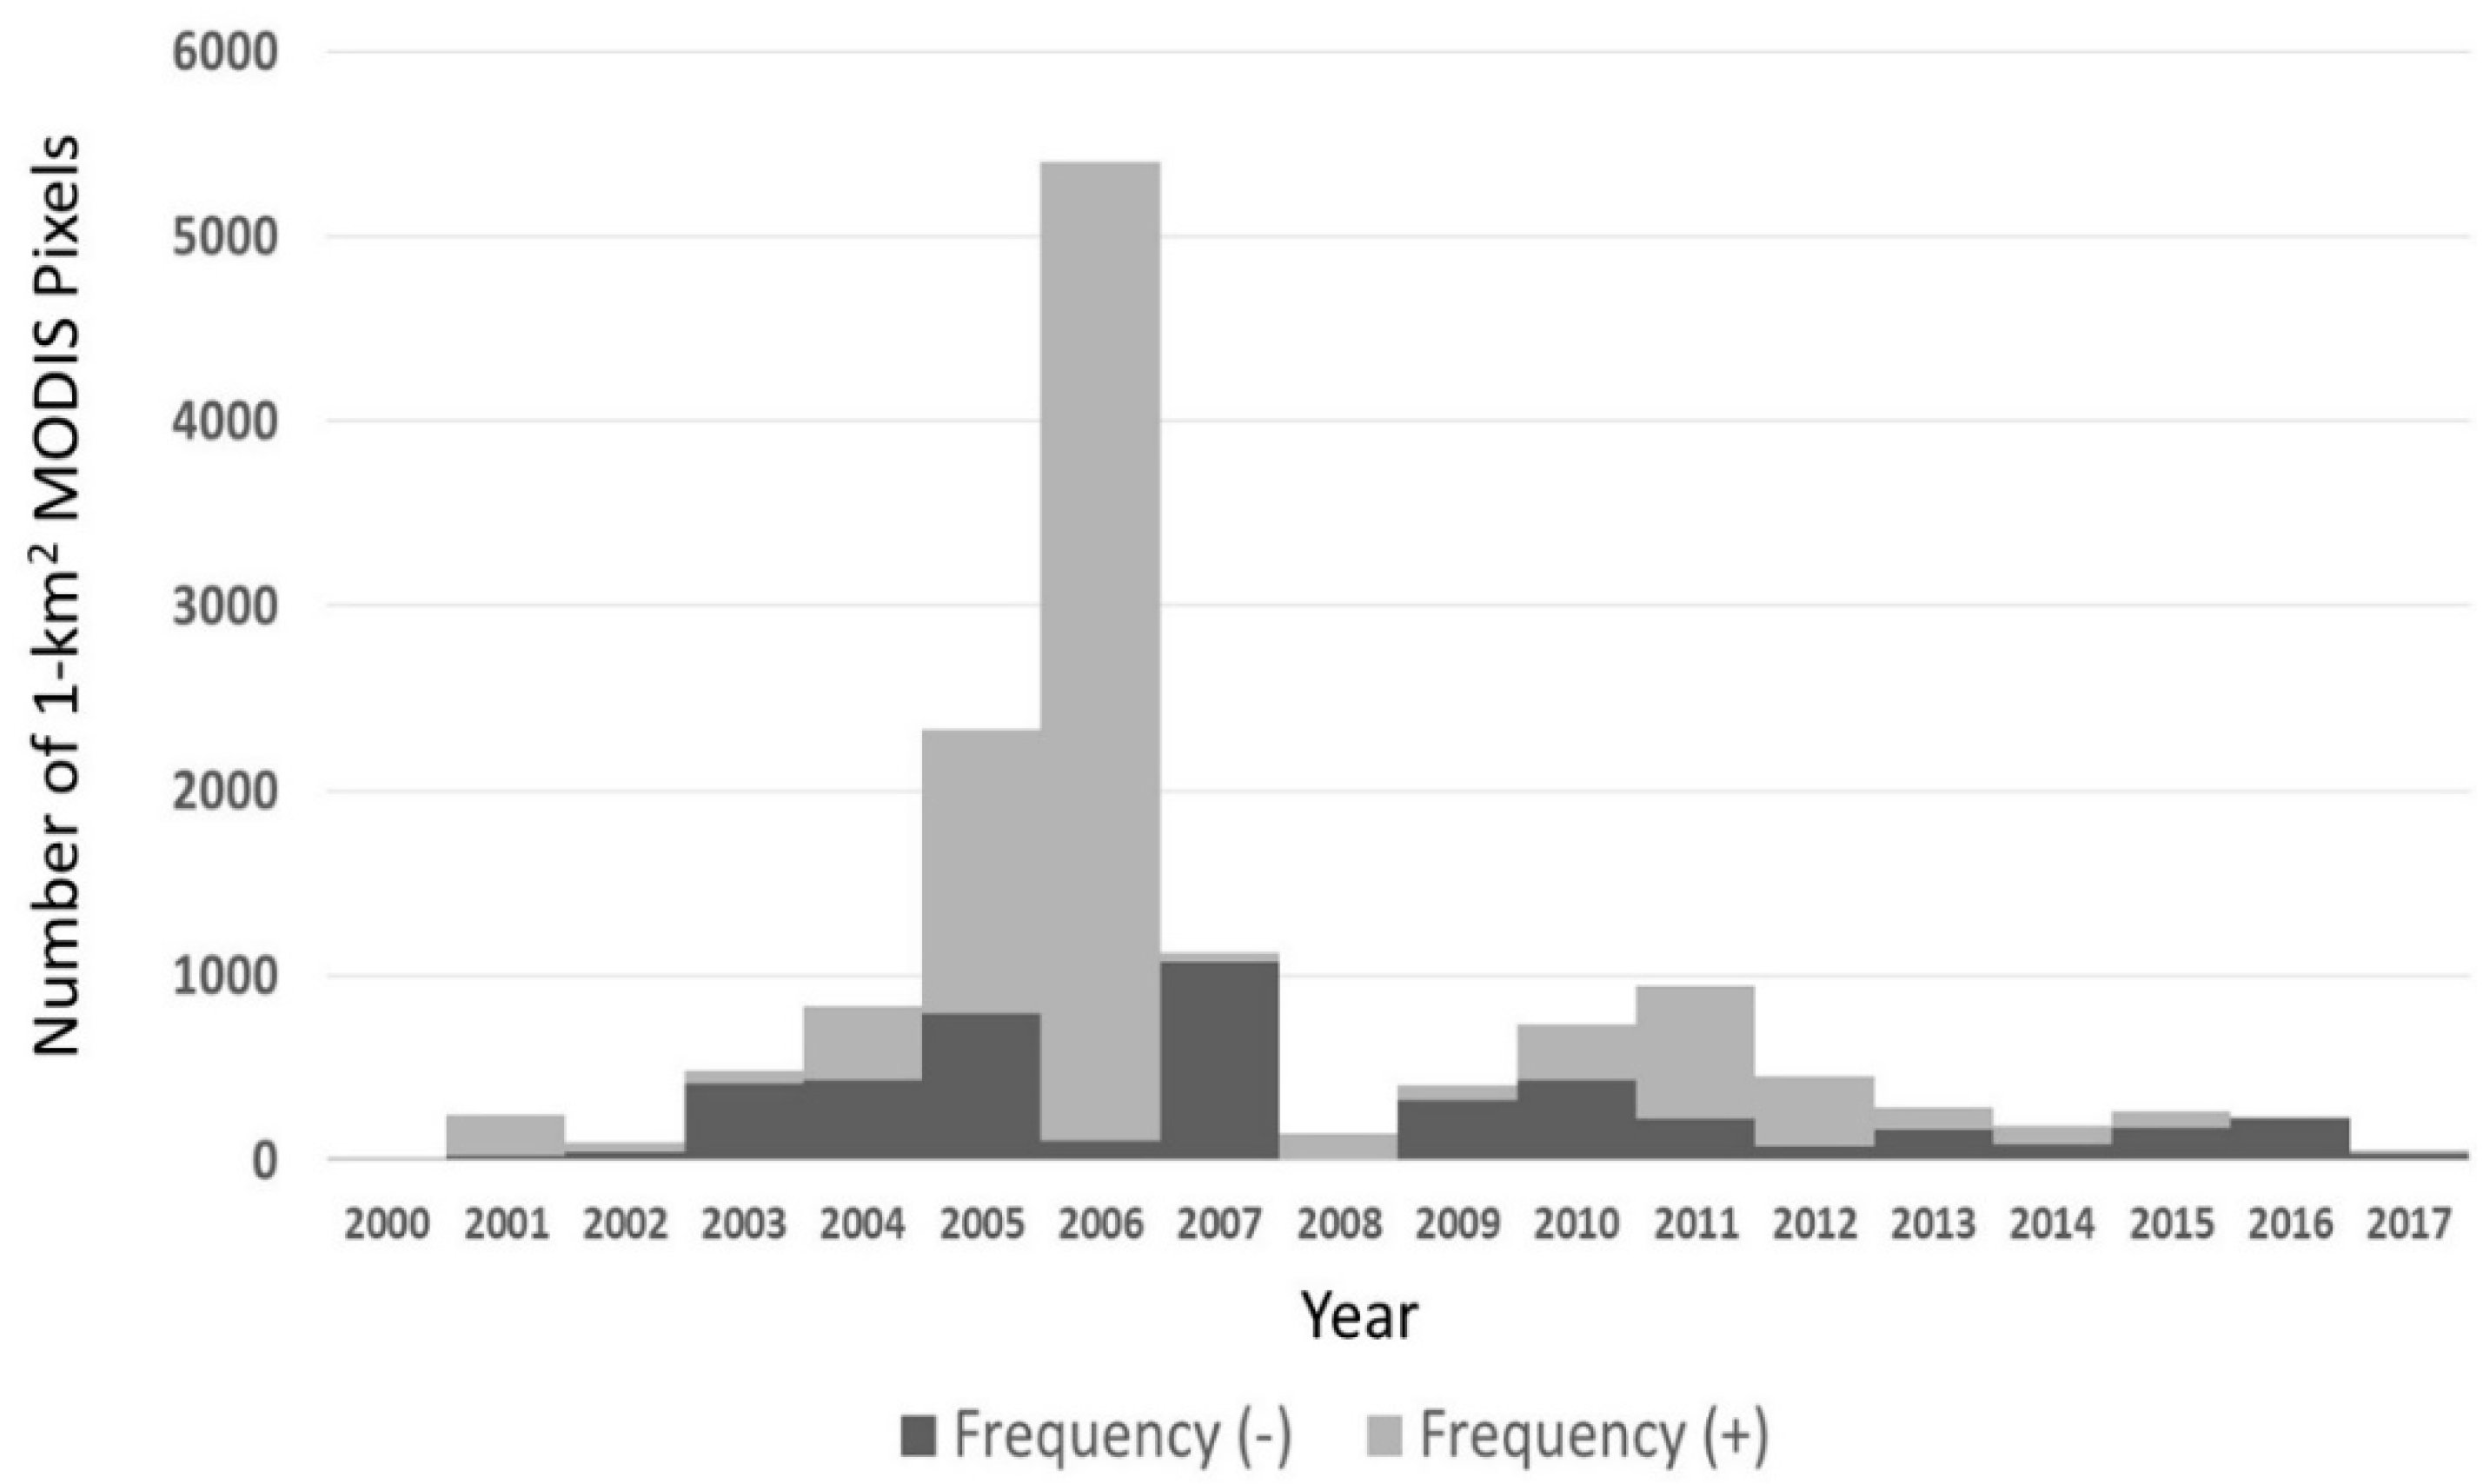
4.1. Breakpoint Patterns
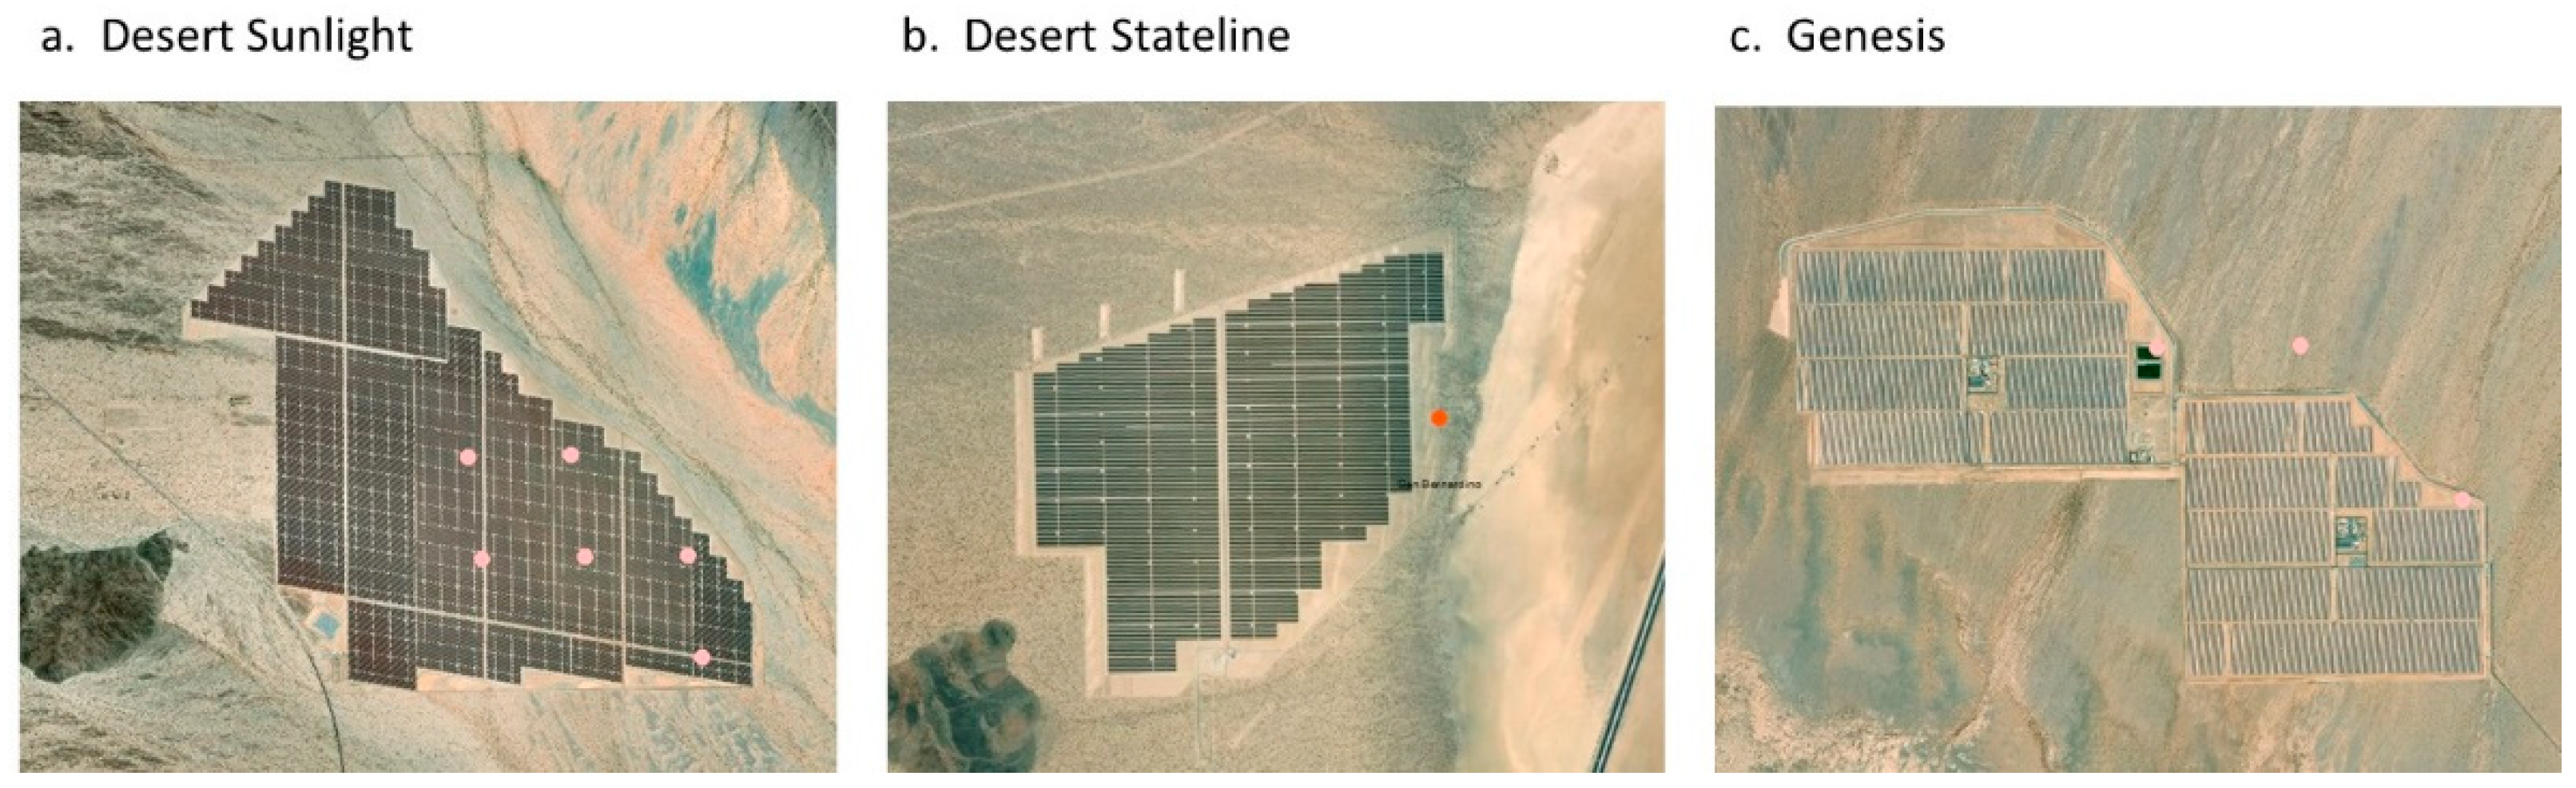
4.2. Change Detection at Solar Energy Development Sites
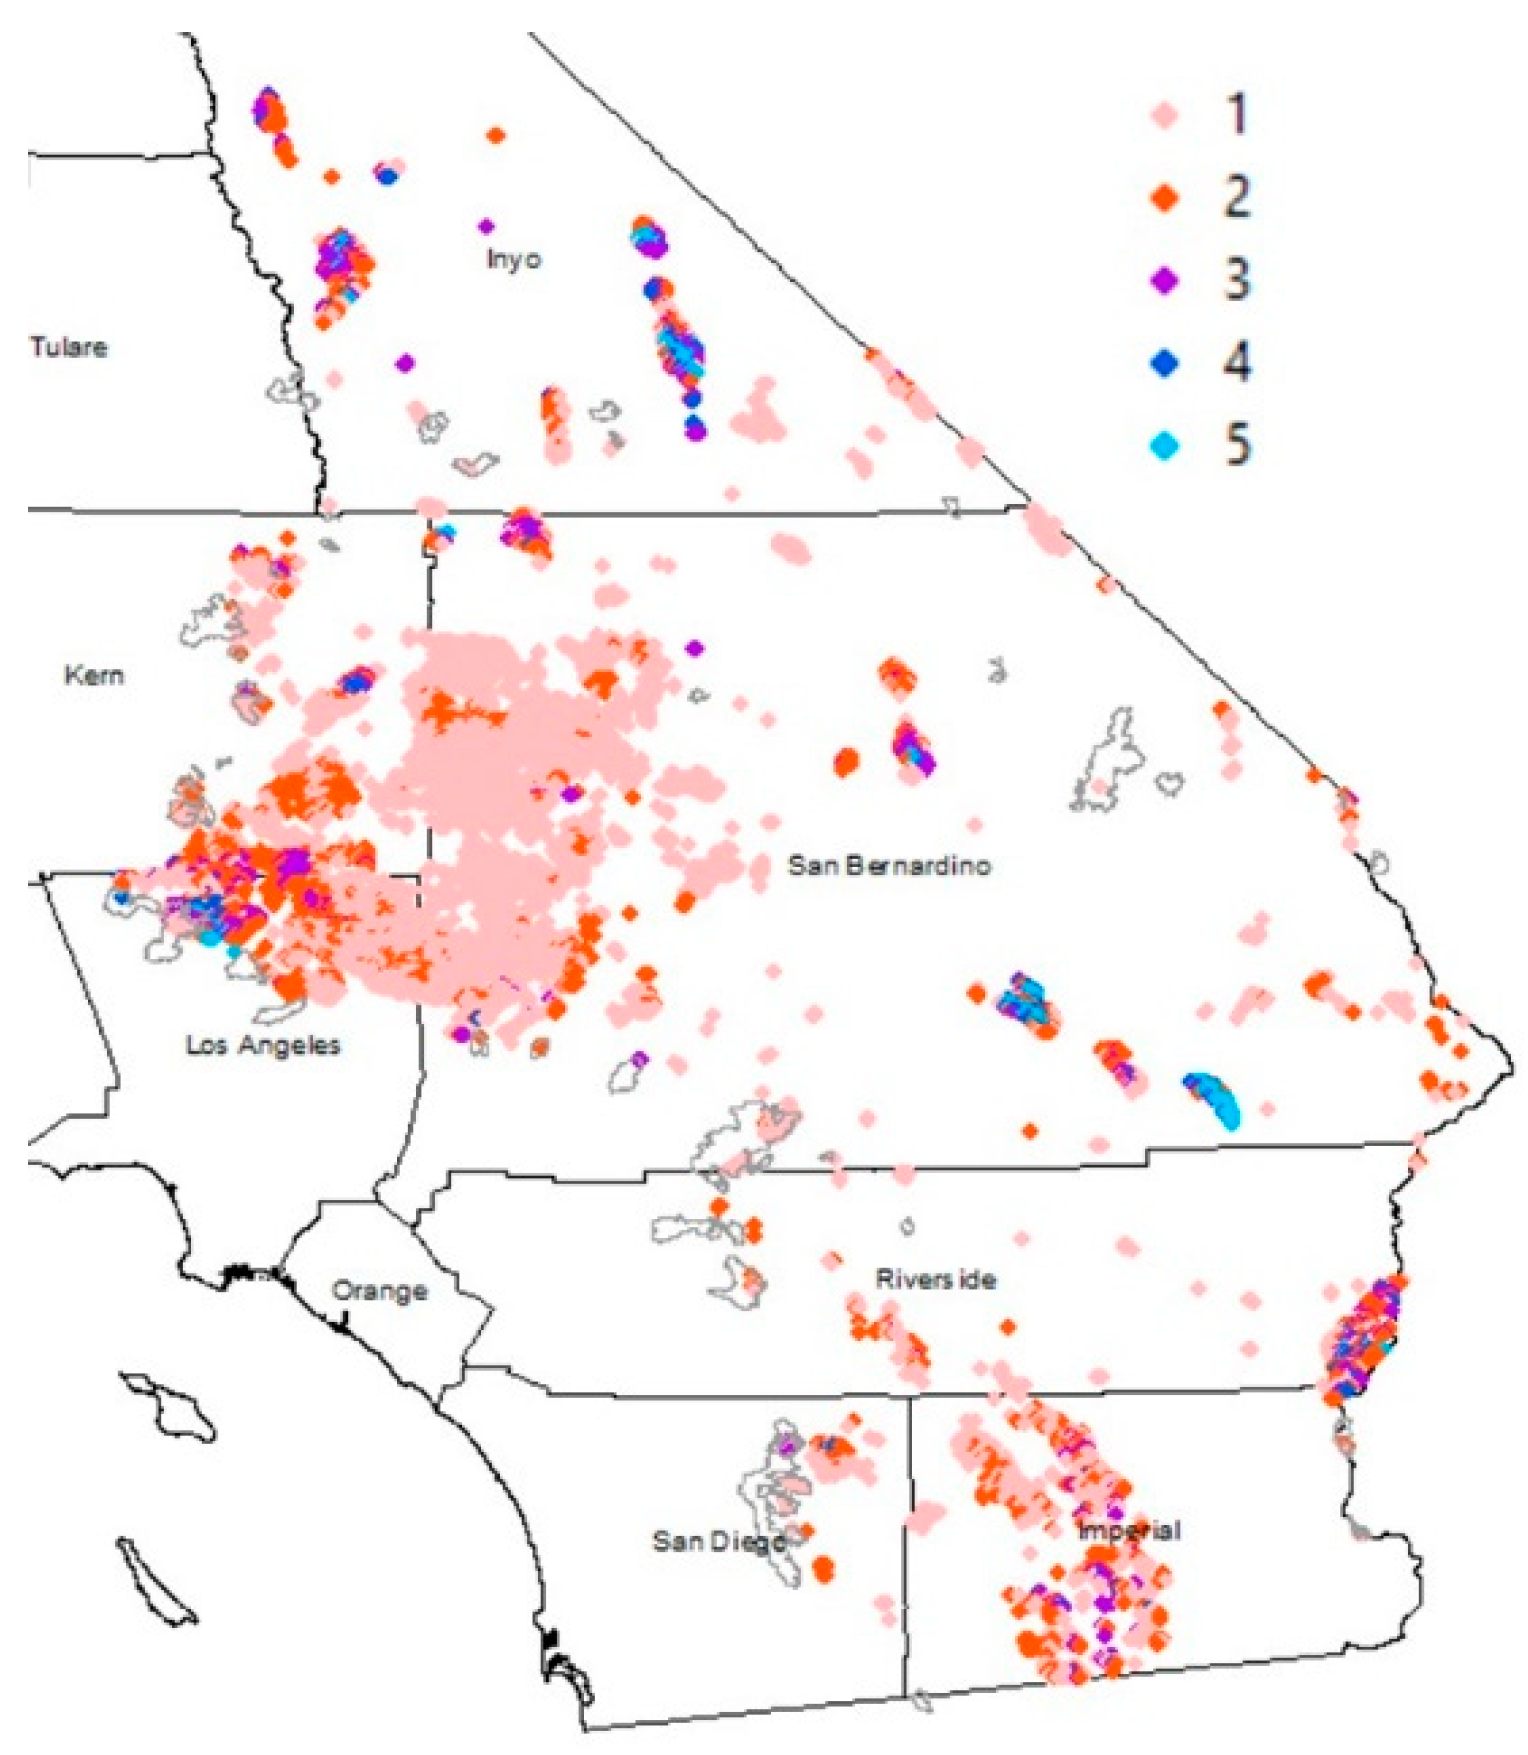
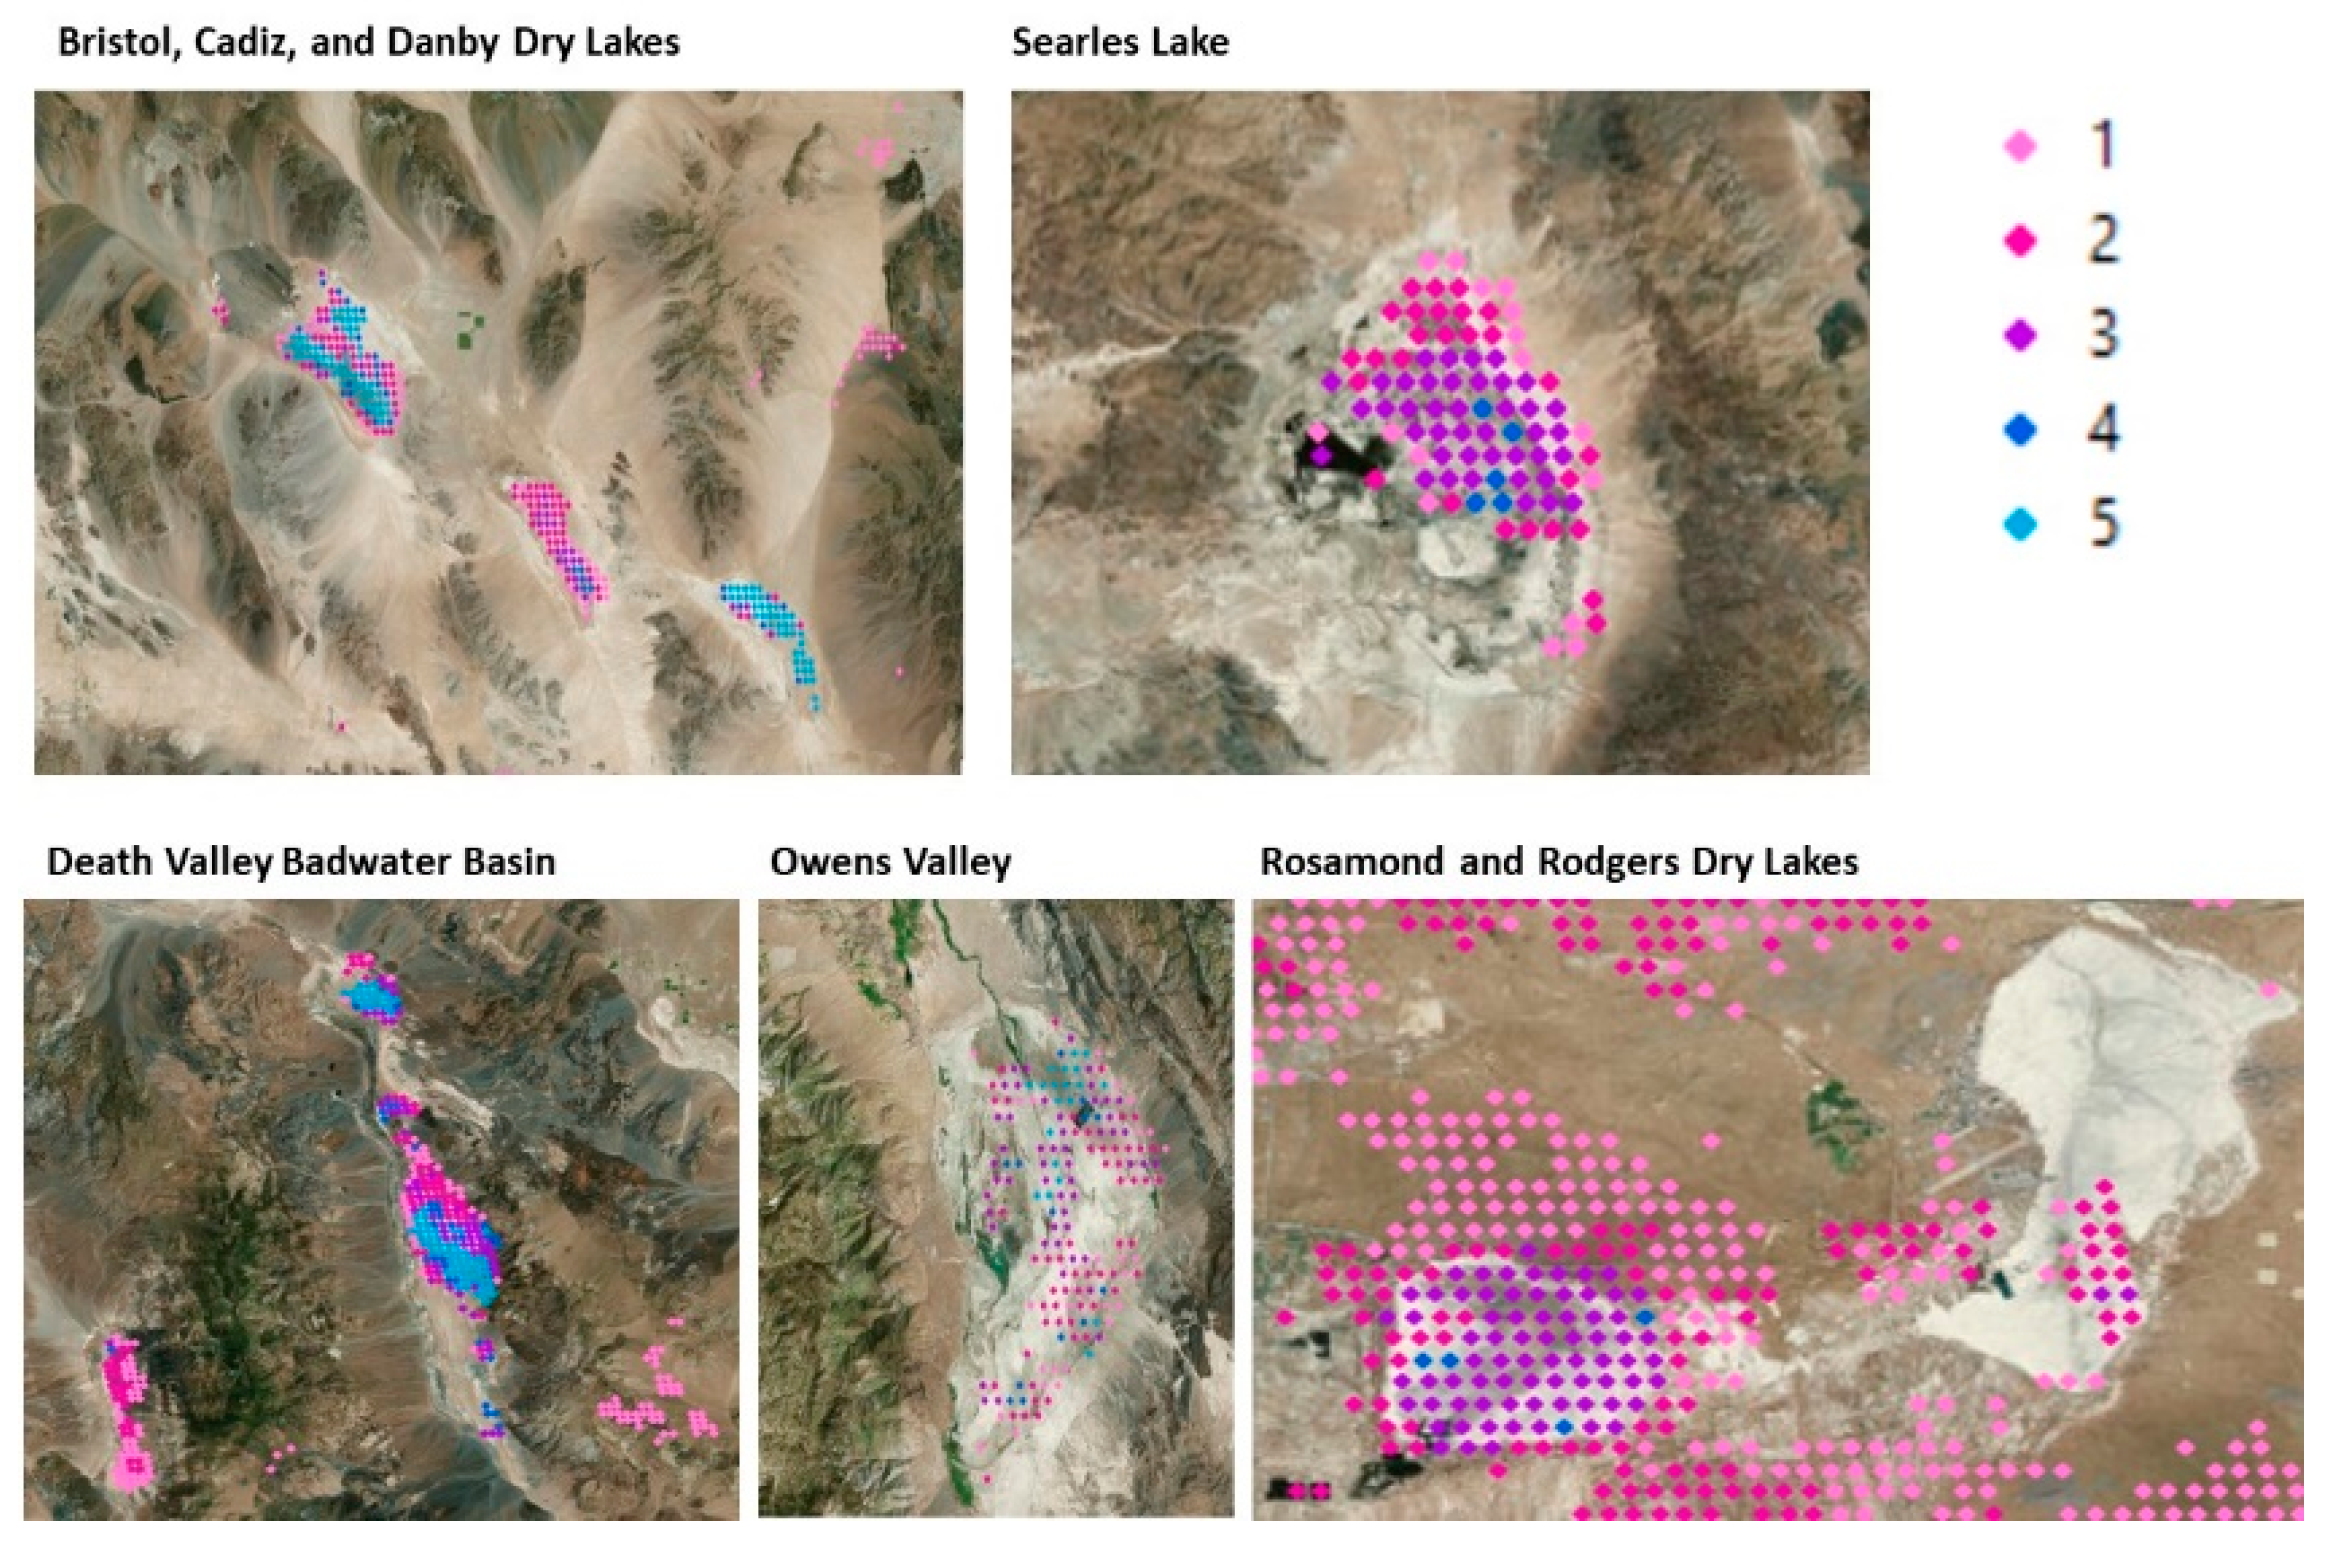
4.3. Breakpoint Detection at the Regional Scale
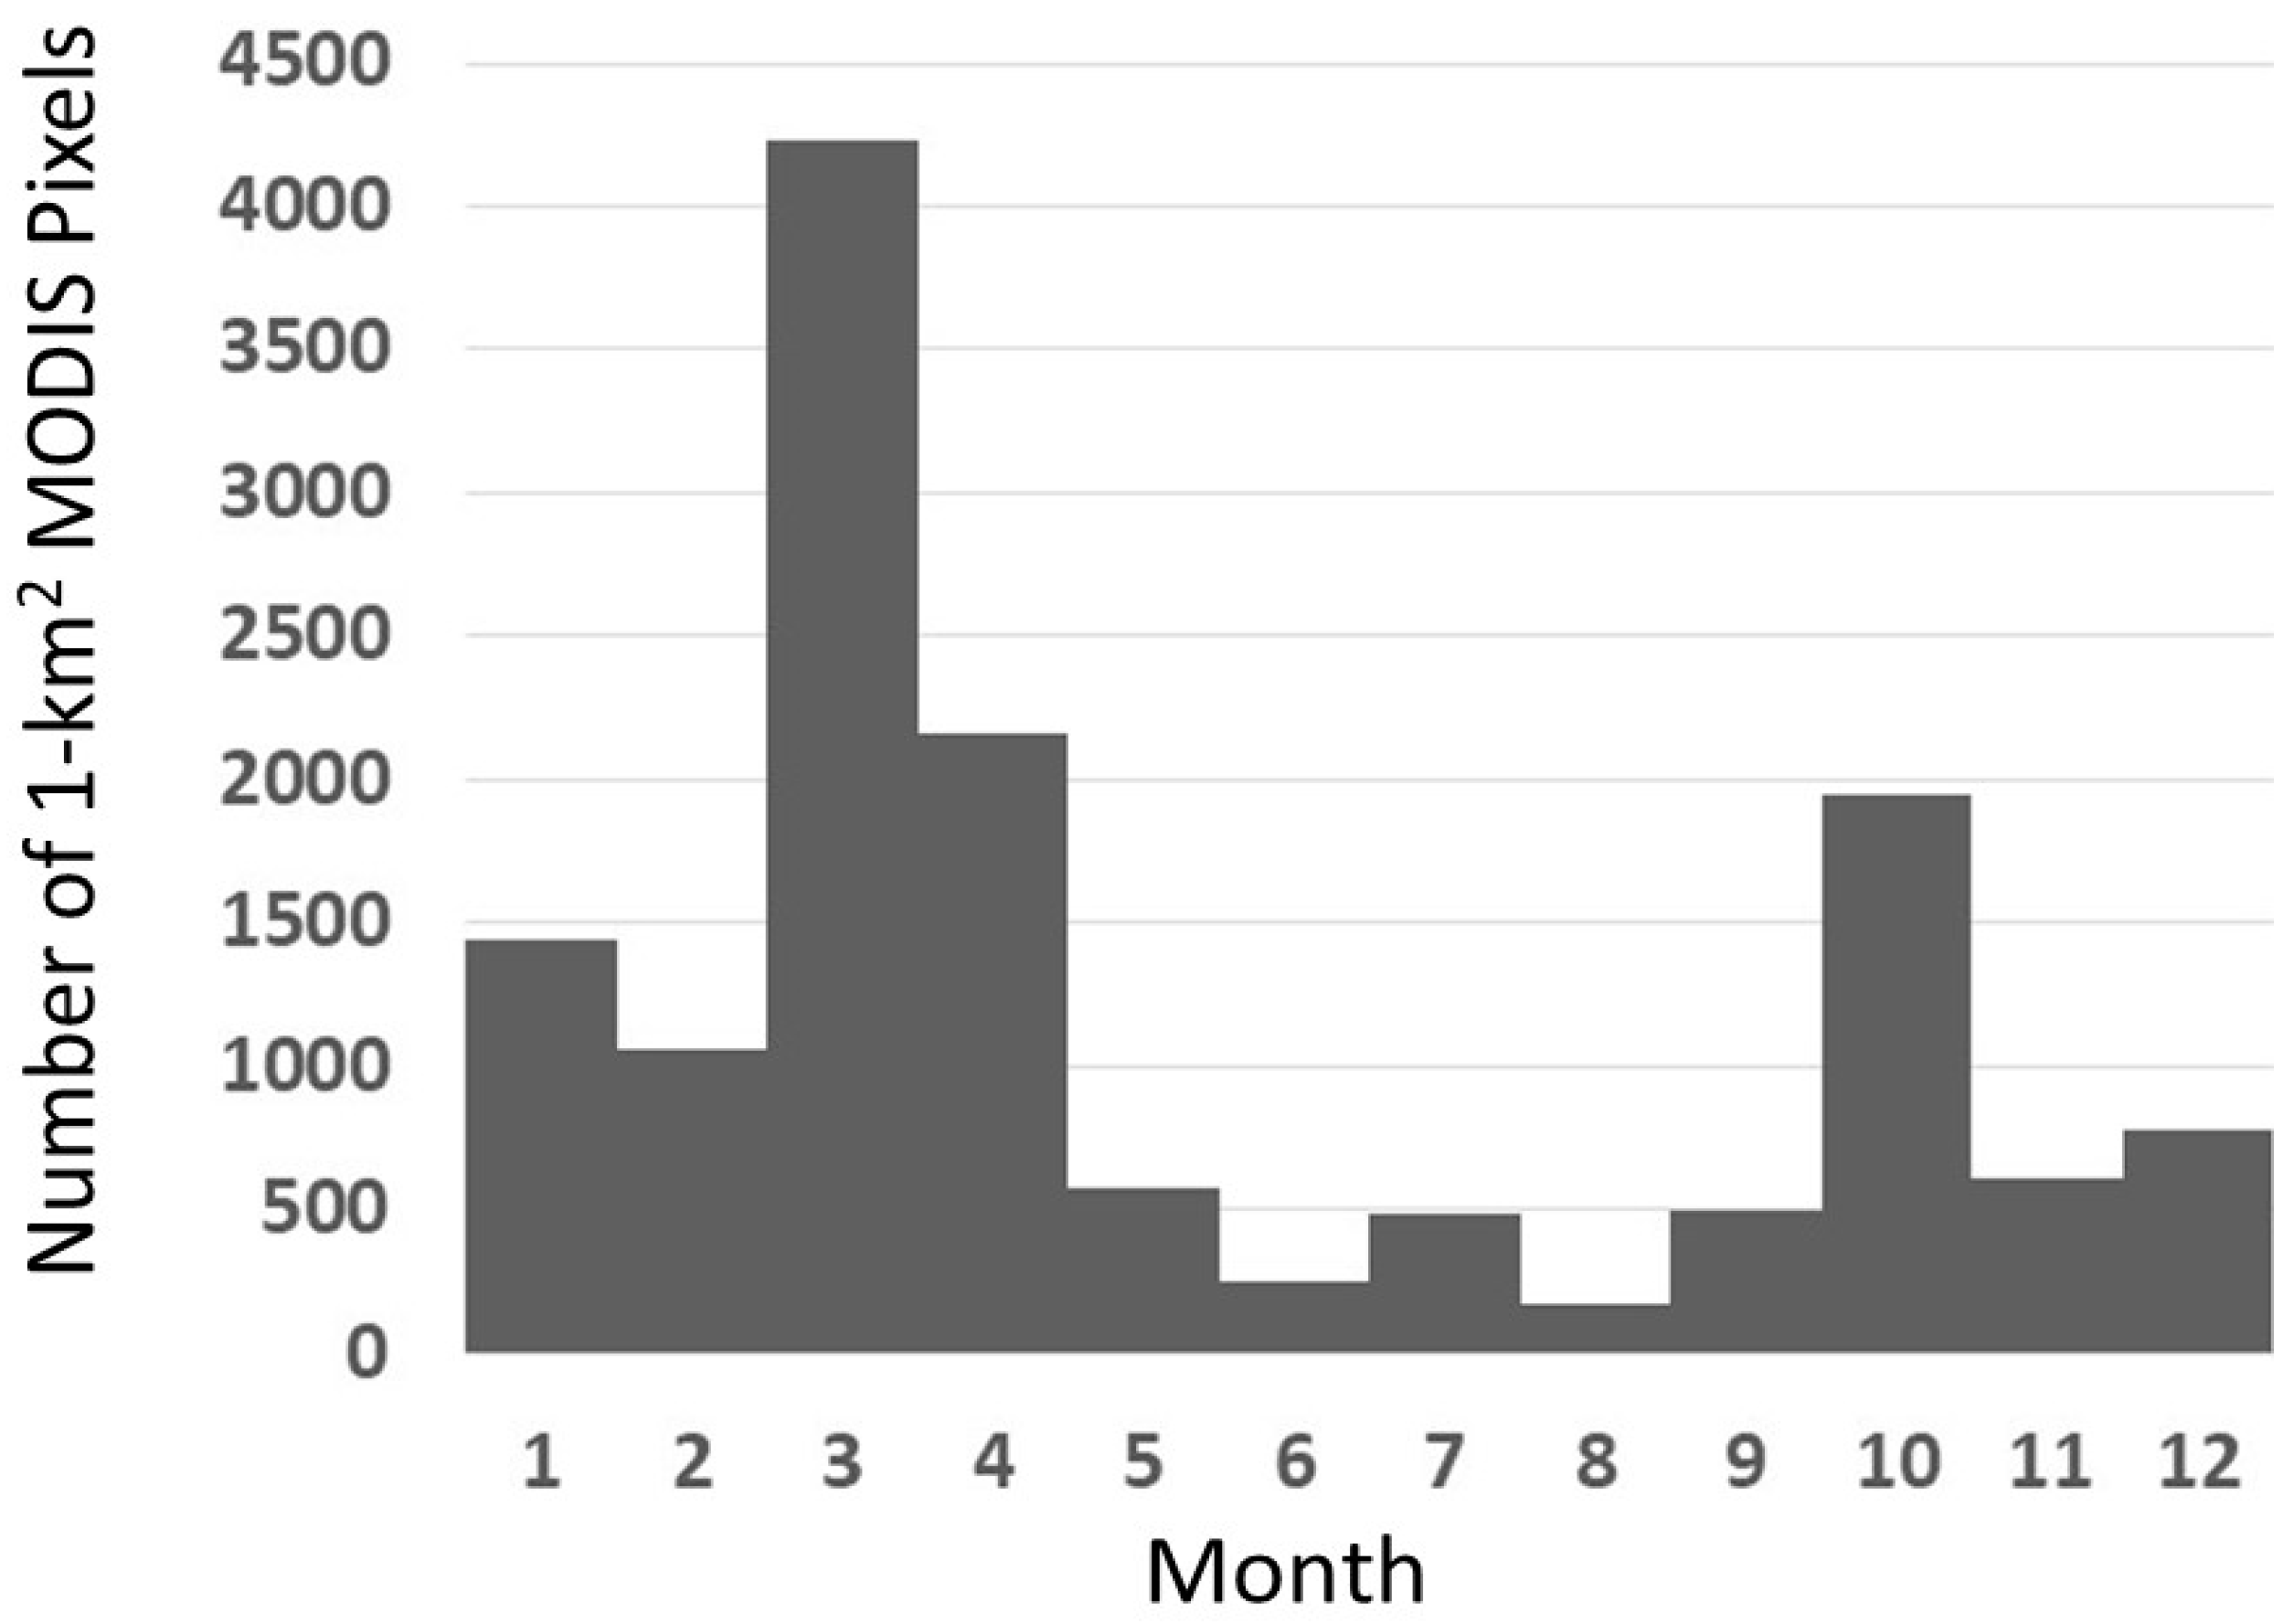
4.4. Association of Breakpoint Dates with Precipitation Events
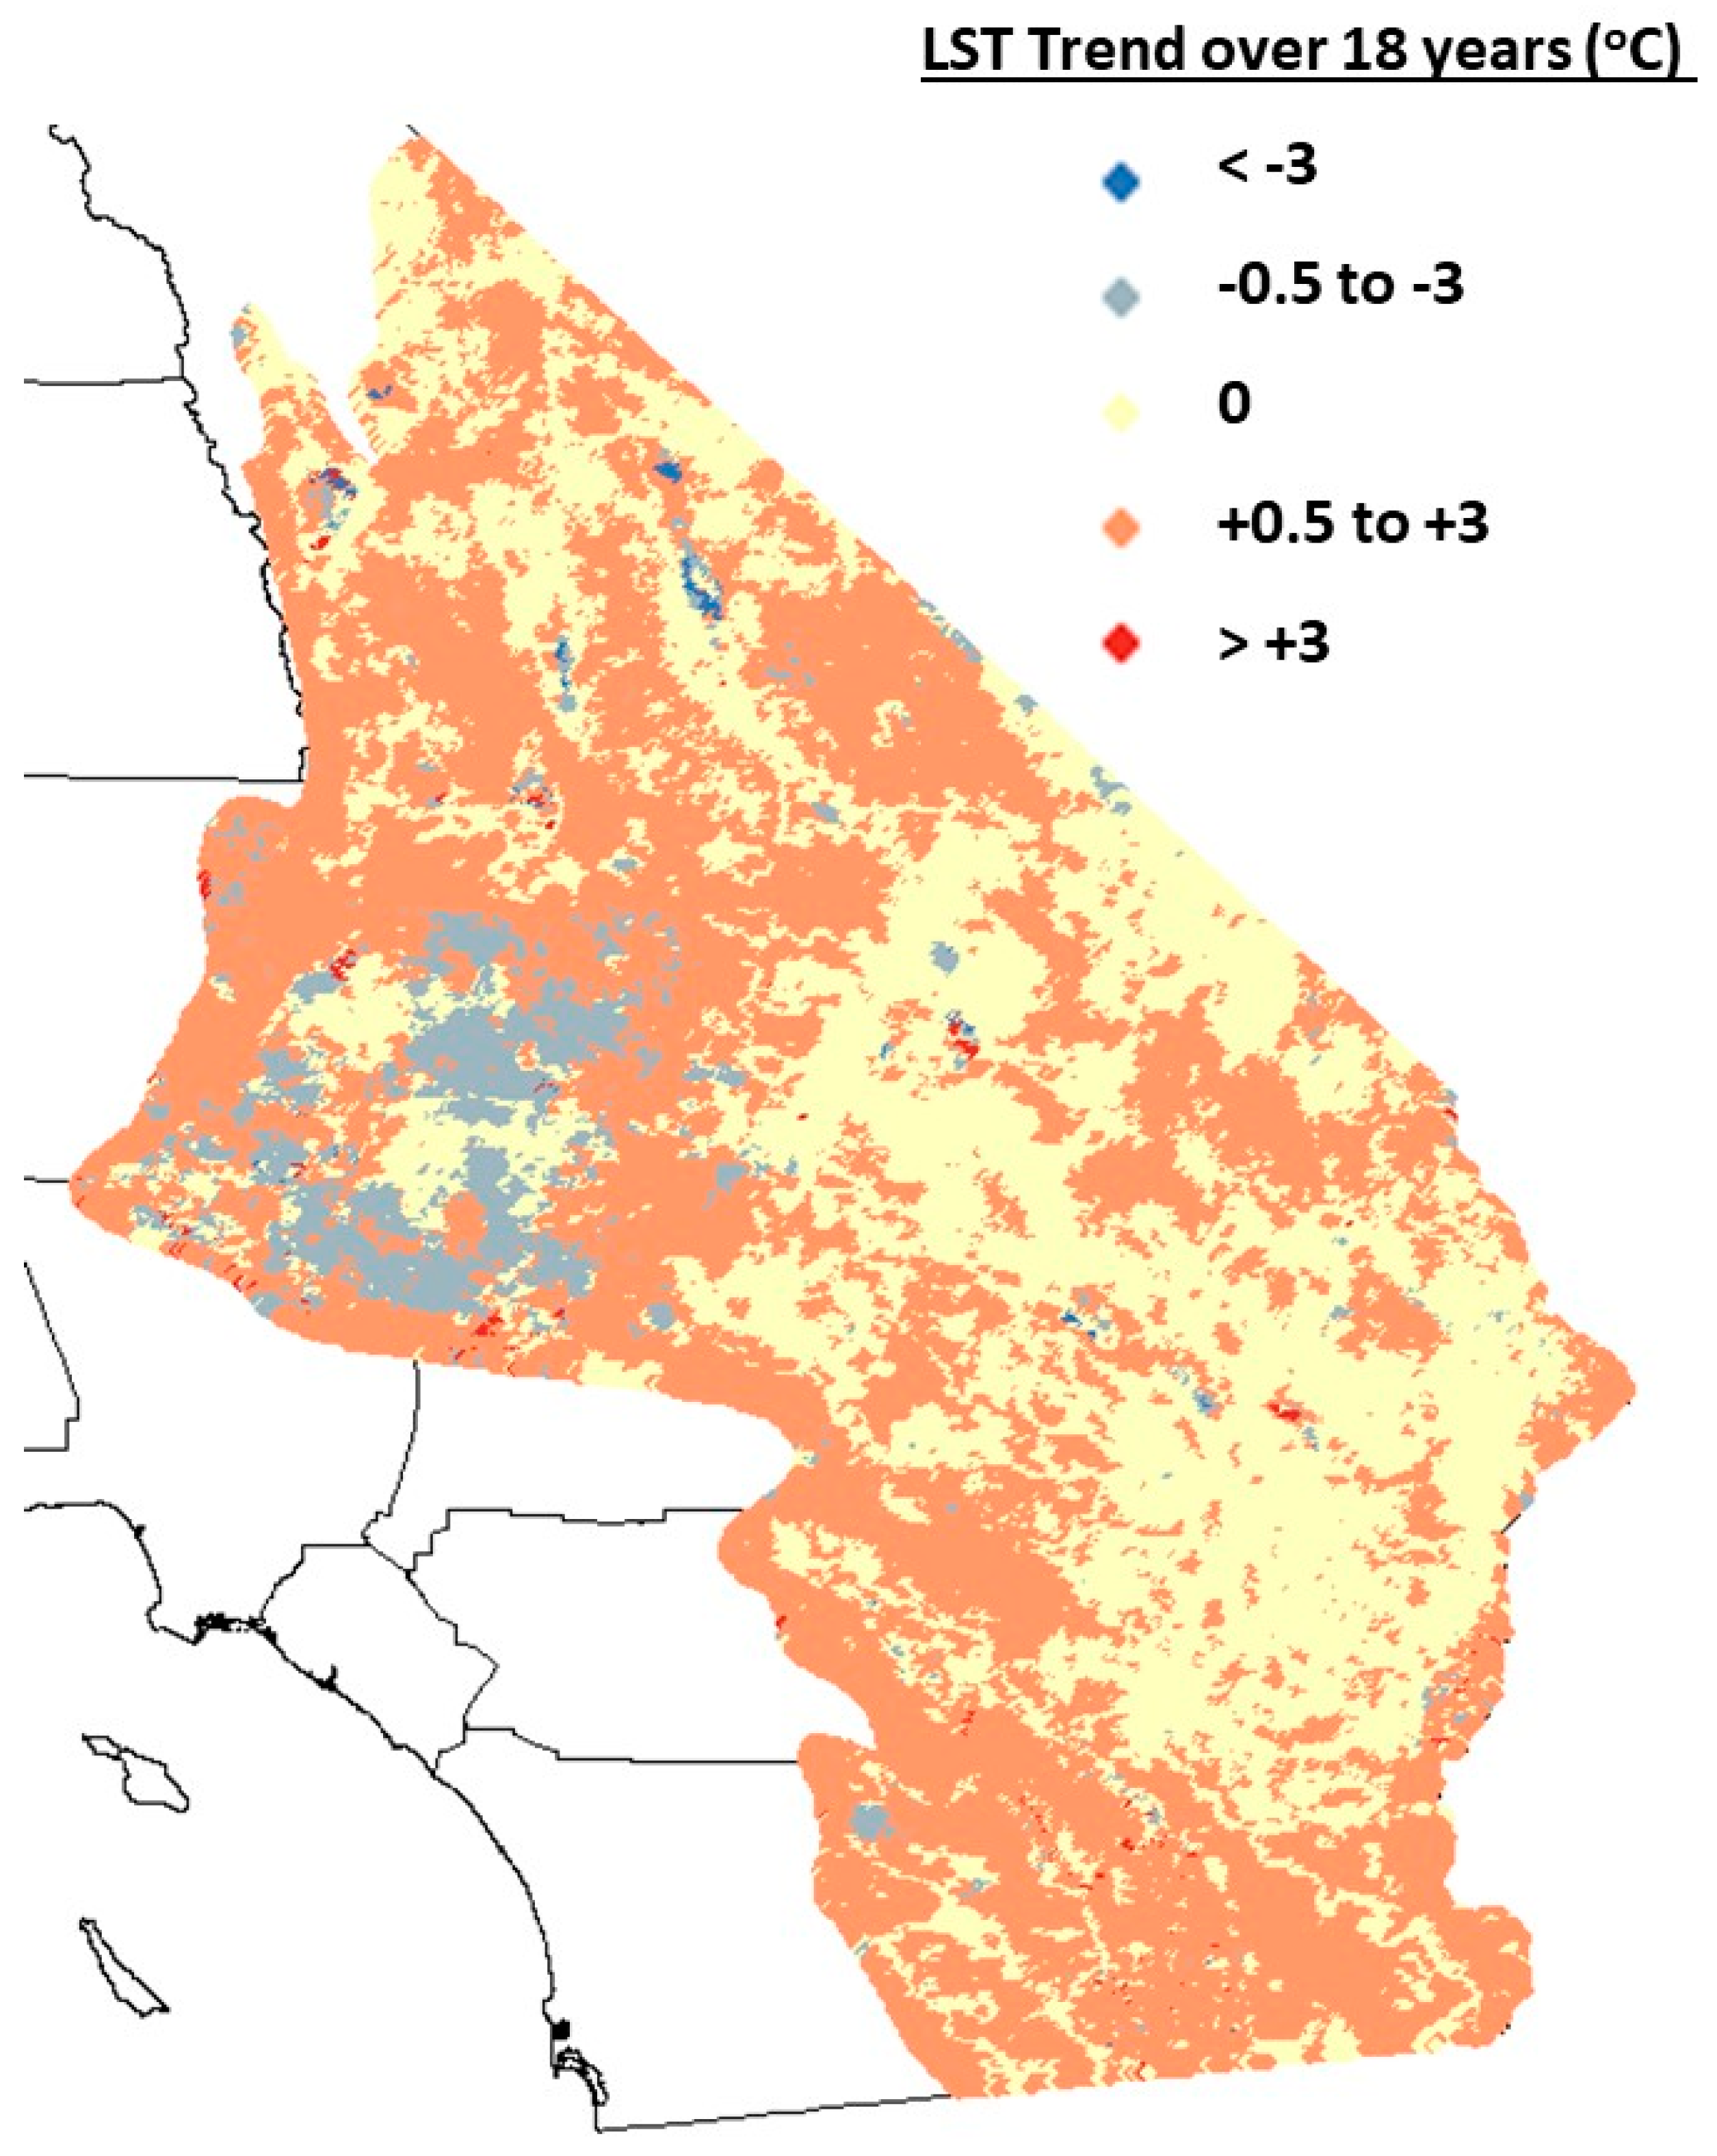
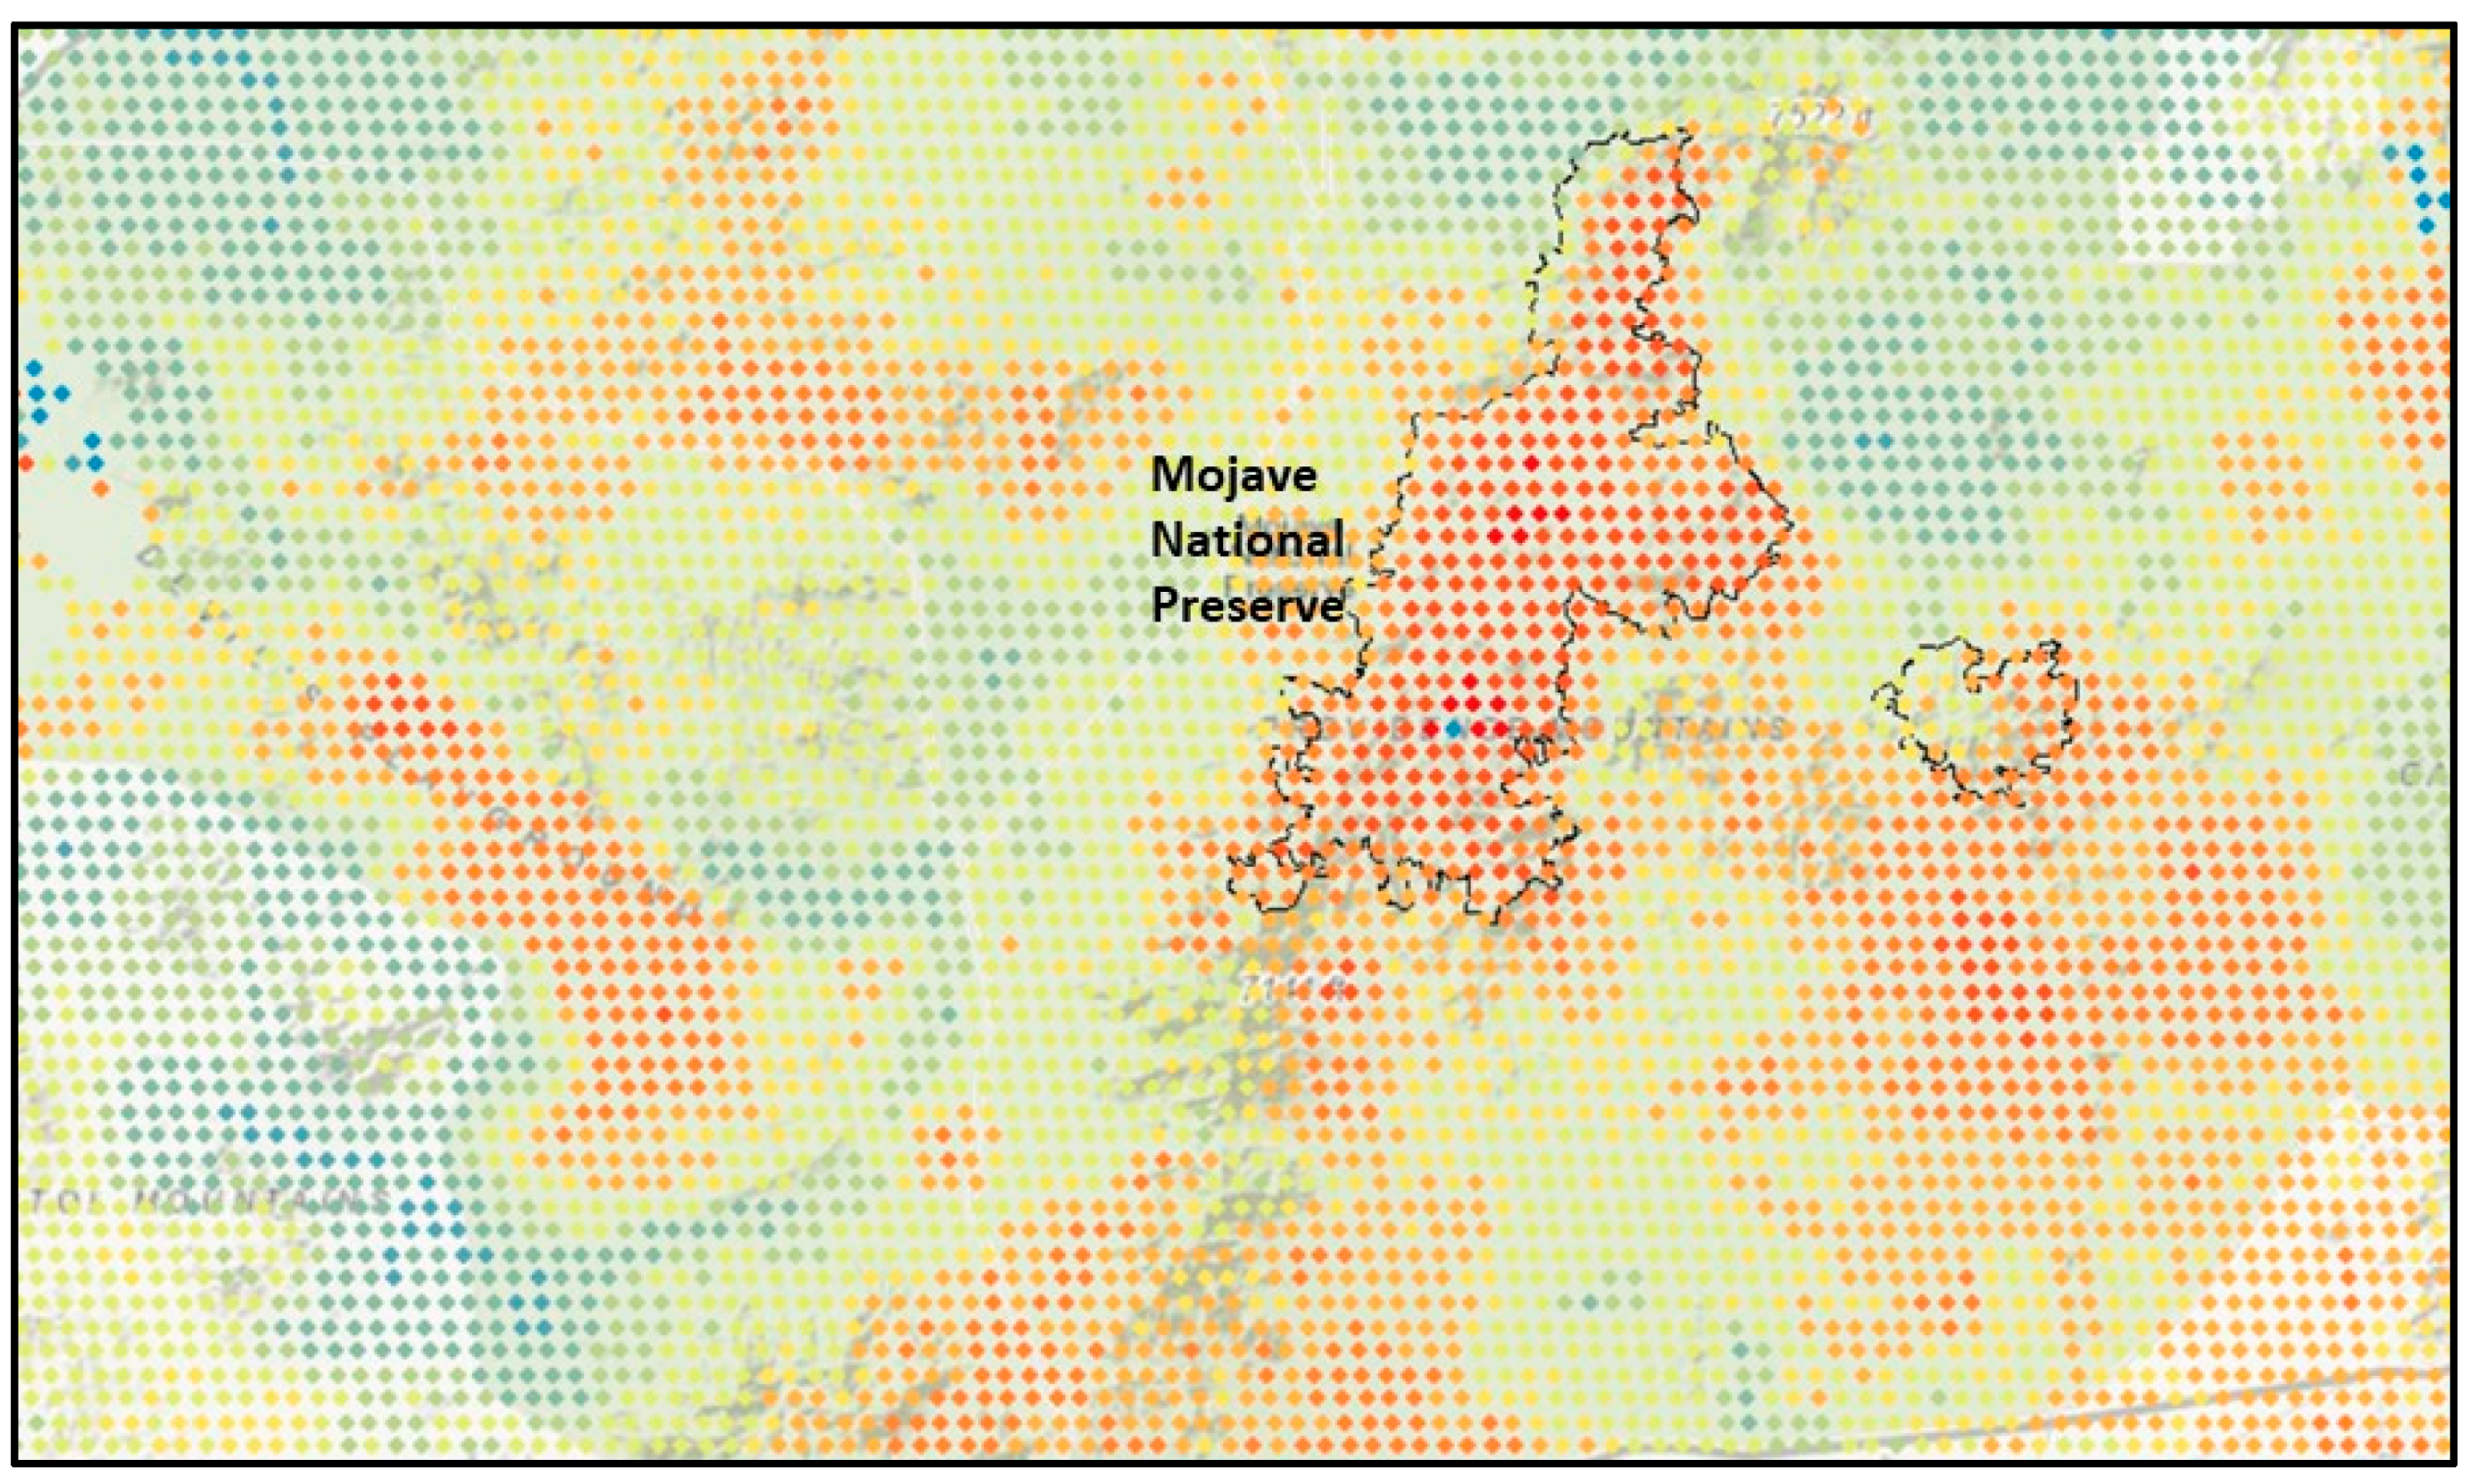
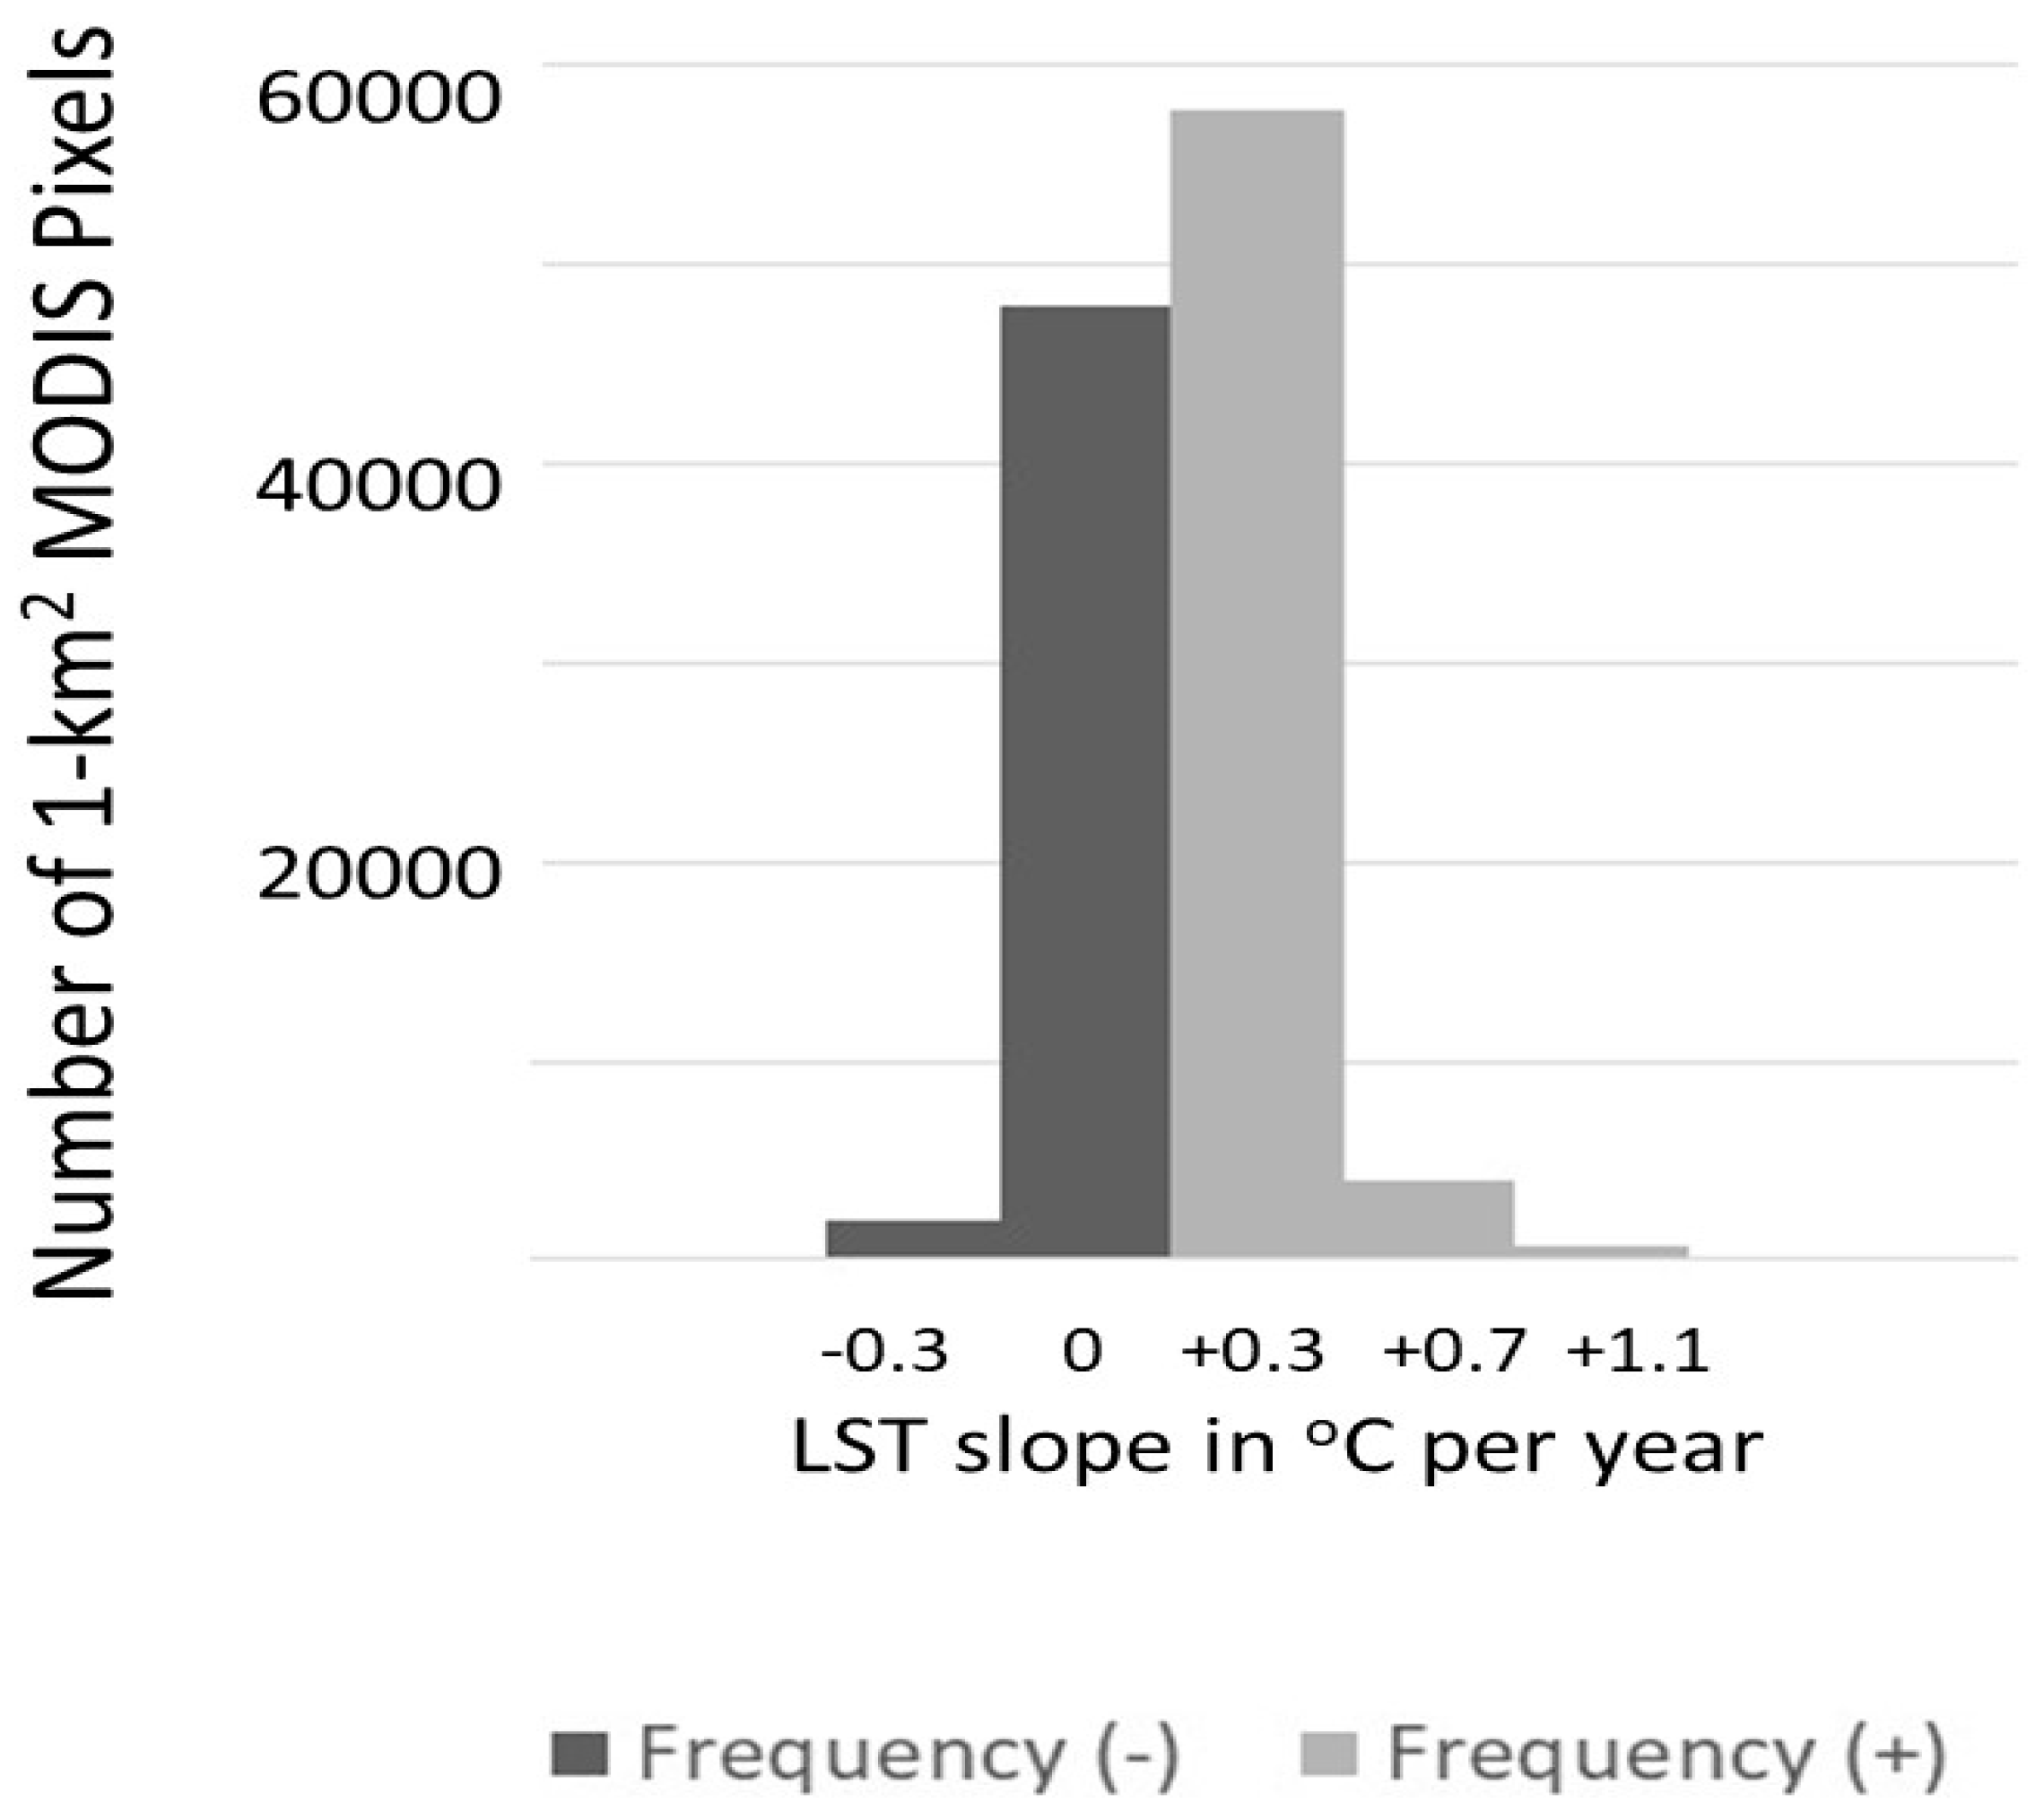
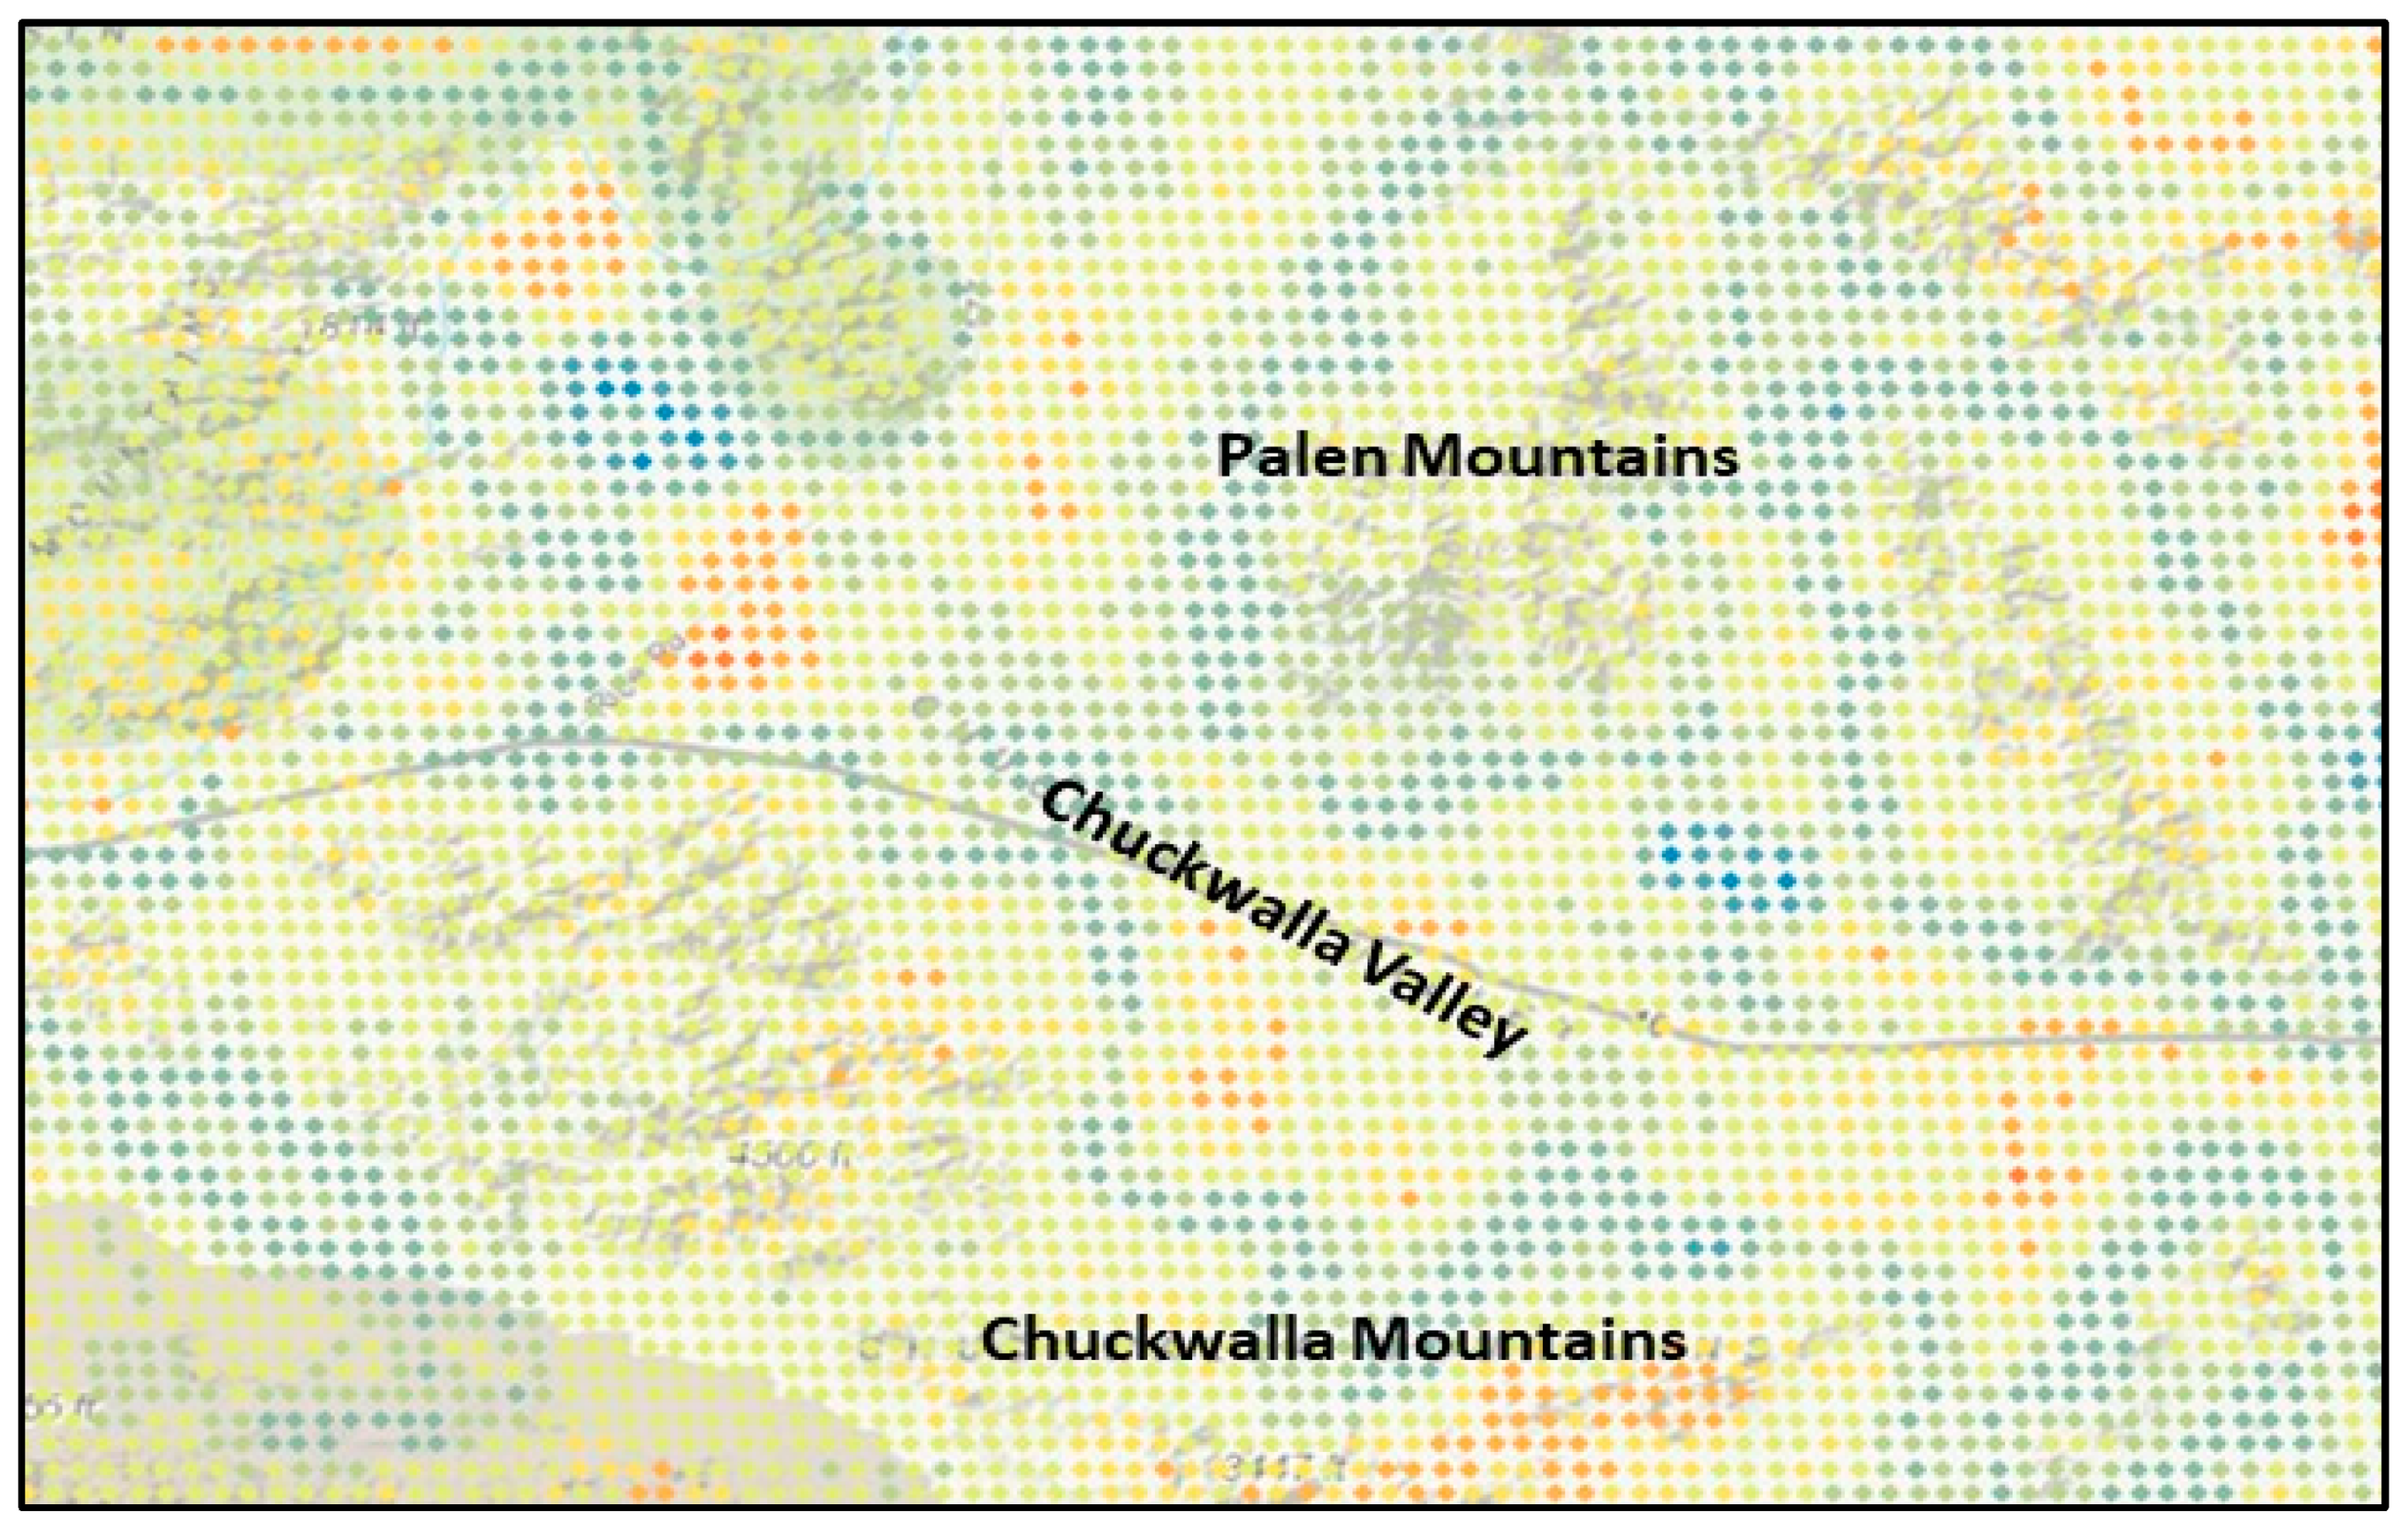
4.5. Surface Temperature Trends at the Regional Scale
5. Discussion
6. Conclusions
Author Contributions
Funding
Acknowledgments
Conflicts of Interest
References
- Paul, E.A.; Clark, F.E. Soil Microbiology and Biochemistry; Academic Press: Cambridge, MA, USA, 1996; pp. 12–32. [Google Scholar]
- Lehnert, M. Factors affecting soil temperature as limits of spatial interpretation and simulation of soil temperature. Acta Univ. Palacki. Olomuc. Geogr. 2015, 45, 5–21. [Google Scholar]
- Potter, C.S. Landsat time series analysis of vegetation changes in solar energy development areas of the Lower Colorado Desert, Southern California. J. Geosci. Environ. Prot. 2016, 4, 1–6. [Google Scholar] [CrossRef]
- DRECP. Desert Renewable Energy Conservation Plan Homepage. 2018. Available online: https://www.drecp.org (accessed on 1 August 2018).
- Li, Z.; Guo, X.; Dixon, P.; He, Y. Applicability of Land Surface Temperature (LST) estimates from AVHRR satellite image composites in northern Canada. Prairie Perspect. 2008, 11, 119–130. [Google Scholar]
- Quan, J.; Zhan, W.; Chen, Y.; Wang, M.; Wang, J. Time series decomposition of remotely sensed land surface temperature and investigation of trends and seasonal variations in surface urban heat islands. J. Geophys. Res. Atmos. 2016, 121, 2638–2657. [Google Scholar] [CrossRef]
- Zhan, W.; Huang, F.; Quan, J.; Zhu, X.; Gao, L.; Zhou, J.; Ju, W. Disaggregation of remotely sensed land surface temperature: A new dynamic methodology. J. Geophys. Res. Atmos. 2016, 121, 10538–10554. [Google Scholar] [CrossRef]
- Coppernoll-Houston, D.; Potter, C.S. Field measurements and satellite remote sensing of daily soil surface temperature variations in the Lower Colorado Desert of California. Climate 2018, 6, 94. [Google Scholar] [CrossRef]
- Verbesselt, J.; Hyndman, R.; Newnham, G.; Culvenor, D. Detecting trend and seasonal changes in satellite image time series. Remote Sens. Environ. 2010, 114, 106–115. [Google Scholar] [CrossRef]
- Marks, J.B. Vegetation and soil relations in the Lower Colorado Desert. Ecology 1950, 31, 176–193. [Google Scholar] [CrossRef]
- McNab, W.H.; Avers, P.E. (Eds.) Ecological Subregions of the United States: Section Descriptions; WO-WSA-5; USDA Forest Service, Ecosystem Management: Washington, DC, USA, 1994.
- Brostoff, W.; Lichvar, R.; Sprecher, S. Delineating Playas in the Arid Southwest: A Literature Review; Technical Report ERDC TR-01-4; US Army Corps of Engineers, Engineer Research and Development Center: Fort Belvoir, VA, USA, 2011; 34p.
- Cooke, R.; Warren, A.; Goudie, A. Desert Geomorphology; UCL Press: London, UK, 1993. [Google Scholar]
- California Department of Water Resources. California’s Groundwater: California Department of Water Resources Bulletin 118. 2003; 246p. Available online: www.water.ca.gov/groundwater/bulletin118/update2003.cfm/ (accessed on 1 November 2018).
- Schmitt, S.J.; Milby Dawson, B.J.; Belitz, K. Groundwater Quality Data in the Antelope Valley Study Unit, 2008—Results from the California GAMA Program: U.S. Geological Survey Data Series 479. 2009; 79p. Available online: pubs.usgs.gov/ds/479/ (accessed on 1 November 2018).
- Siade, A.J.; Nishikawa, T.; Rewis, D.L.; Martin, P.; Phillips, S.P. Groundwater Flow and Land Subsidence Model of Antelope Valley; Scientific Investigations Report 2014-5166; U.S. Geological Survey: Menlo Park, CA, USA, 2014; p. 136.
- Galloway, D.; Hudnut, K.; Ingebritsen, S.; Phillips, S.; Peltzer, G.; Rogez, F.; Rosen, P. Detection of aquifer system compaction and land subsidence using interferometric synthetic aperture radar, Antelope Valley, Mojave Desert, California. Water Resour. Res. 1998, 34. [Google Scholar] [CrossRef]
- Wan, Z.; Dozier, J. A generalized split-window algorithm for retrieving land-surface temperature from space. IEEE Trans. Geosci. Remote Sens. 1996, 34, 892–905. [Google Scholar]
- Wan, Z.; Zhang, Y.; Zhang, Q.; Li, Z.-L. Validation of the land-surface temperature products retrieved from Terra Moderate Resolution Imaging Spectroradiometer data. Remote Sens. Environ. 2002, 83, 163–180. [Google Scholar] [CrossRef]
- Busetto, L.; Ranghetti, L. MODIStsp: An R Package for Automatic Preprocessing of MODIS Land Products Time Series. Comput. Geosci. 2016, 97, 40–48. [Google Scholar] [CrossRef]
- Hua, L.; Sun, D.; Yu, Y.; Wang, H.; Liu, Y.; Liu, Q.; Du, Y.; Wang, H.; Cao, B. Evaluation of the VIIRS and MODIS LST products in an arid area of Northwest China. Remote Sens. Environ. 2014, 142, 111–121. [Google Scholar]
- Zeileis, A. A unified approach to structural change tests based on ML scores, F statistics, and OLS residuals. Econom. Rev. 2005, 24, 445–466. [Google Scholar] [CrossRef]
- Eidenshink, J.; Schwind, B.; Brewer, K.; Zhu, Z.; Quayle, B.; Howard, S. A project for monitoring trends in burn severity. Fire Ecol. Spec. Issue 2007, 3, 3–21. [Google Scholar] [CrossRef]
- Mojave Integrated Regional Water Management Plan (IRWMP). Kennedy-Jenks Consultants; K/J Project No. 1389002; IRWMP: Oxnard, CA, USA, 2014; 400p. [Google Scholar]
- Reynolds, R.L.; Yount, J.C.; Reheis, M.; Goldstein, H.; Chavez, P., Jr.; Fulton, R.; Whitney, J.; Fuller, C.; Forester, R.M. Dust emission from wet and dry playas in the Mojave Desert, USA. Earth Surf. Process. Landf. 2007, 32, 1811–1827. [Google Scholar] [CrossRef]
- Vlassova, L.; Pérez-Cabello, F.; Rodrigues, M.; Montorio, R.; García-Martín, A. Analysis of the relationship between land surface temperature and wildfire severity in a series of Landsat images. Remote Sens. 2014, 6, 6136–6162. [Google Scholar] [CrossRef]
- Veraverbeke, S.; Verstraeten, W.W.; Lhermitte, S.; Van De Kerchove, R.; Goossens, R. Assessment of post-fire changes in land surface temperature and surface albedo, and their relation with fire–burn severity using multitemporal MODIS imagery. Int. J. Wildl. Fire 2012, 21, 243–256. [Google Scholar] [CrossRef]


| Playa Name | Area (km2) | Approximate Center Location |
|---|---|---|
| Rogers and Rosamond | 97 | 34.83° N, 118.07° W |
| Owens Lake | 448 | 35.50° N, 117.91° W |
| Death Valley–Badwater | 96 | 36.25° N, 116.82° W |
| Panamint Valley | 1680 | 36.10° N, 117.24° W |
| Bristol, Cadiz, and Danby | 193 | 34.28° N, 115.38° W |
| Searles Lake | 96 | 35.73° N, 117.30° W |
| Site | Construction Start Date | Source |
|---|---|---|
| Desert Stateline | October 2014 | Southern Power 2018 |
| Desert Sunlight | September 2011 | First Solar |
| Genesis | December 2010 | National Renewable Energy Laboratory |
| McCoy I | September 2015 | United State Energy Information Administration |
© 2019 by the authors. Licensee MDPI, Basel, Switzerland. This article is an open access article distributed under the terms and conditions of the Creative Commons Attribution (CC BY) license (http://creativecommons.org/licenses/by/4.0/).
Share and Cite
Potter, C.; Coppernoll-Houston, D. Controls on Land Surface Temperature in Deserts of Southern California Derived from MODIS Satellite Time Series Analysis, 2000 to 2018. Climate 2019, 7, 32. https://doi.org/10.3390/cli7020032
Potter C, Coppernoll-Houston D. Controls on Land Surface Temperature in Deserts of Southern California Derived from MODIS Satellite Time Series Analysis, 2000 to 2018. Climate. 2019; 7(2):32. https://doi.org/10.3390/cli7020032
Chicago/Turabian StylePotter, Christopher, and Dana Coppernoll-Houston. 2019. "Controls on Land Surface Temperature in Deserts of Southern California Derived from MODIS Satellite Time Series Analysis, 2000 to 2018" Climate 7, no. 2: 32. https://doi.org/10.3390/cli7020032
APA StylePotter, C., & Coppernoll-Houston, D. (2019). Controls on Land Surface Temperature in Deserts of Southern California Derived from MODIS Satellite Time Series Analysis, 2000 to 2018. Climate, 7(2), 32. https://doi.org/10.3390/cli7020032