Article

Assessing Heat Waves over Greece Using the Excess Heat Factor (EHF)

Department of Meteorology and Climatology, School of Geology, Aristotle University of Thessaloniki, Thessaloniki, 54124, Greece
Climate 2019, 7(1), 9; https://doi.org/10.3390/cli7010009
Submission received: 23 November 2018 / Revised: 21 December 2018 / Accepted: 29 December 2018 / Published: 7 January 2019
(This article belongs to the Special Issue Climate Variability and Change in the 21th Century)

Abstract

:
Heat waves are considered one of the most noteworthy extreme events all over the world due to their crucial impacts on both society and the environment. For the present article, a relatively new heat wave index, which was primarily introduced for the study of extreme warming conditions over Australia (Excess Heat Factor (EHF, hereafter)), was applied over Greece (eastern Mediterranean) for a 55-year period in order to examine its applicability to a region with different climatic characteristics (compared to Australia) and its ability to define previous exceptional heat waves. The computation of the EHF index for the period 1958–2012 demonstrated that, during the warm period of the year (June, July, August, and September (JJAS)), Greece experiences approximately 20 days per year with positive anomalous conditions (EHF > 0) with positive statistically significant trends for all stations under study. Moreover, an average of 128 spells with a duration of 3 to 10 consecutive days with positive EHF values were found during the examined 55-year period. As the duration of the spell was extended, their frequency lessened. Finally, it was found that the EHF index not only detected, identified, and described efficiently the characteristics of the heat waves, but it also provided additional useful information regarding the impact of these abnormal warming conditions on the human ability to adapt to them.

1. Introduction

Heat waves have been a phenomenon of great worldwide interest due to their substantial societal and environmental impacts. These impacts intensify the necessity of measuring, studying, and even predicting these extreme hot conditions especially in the impacted communities and the affected regions [1] because remarkably warmer weather can have a direct negative effect on health, especially for the vulnerable elderly population [2,3,4,5]. There is also a global demonstration that extreme temperatures are highly correlated with human mortality [6,7,8], making heat waves one of the natural hazards with the greatest percentage of casualties [3,9]. Langlois et al. [10] mention that even though people tend to adapt and acclimatize themselves to temperature changes, if this change is sudden and abrupt, it can then cause certain heat-related diseases or even death.
Nevertheless, there is no single and standard definition of the physical nature of a heat wave and their overall description remains quite broad [11]. Heat waves are usually described as periods of exceptionally hot weather. However, the intensity of this temperature rise as well as the duration of the extreme warm consecutive days and the time of year that they occur are important aspects necessary to categorize a hot event as a heat wave. In general, a heat wave is an acute period of extreme warmth during the summer months, whereas the respective hot periods during winter are referred to as warm spells [12].
In order to define suitable metrics for waves, scientists have instituted either absolute or relative approaches [13]. Even though experts differ in the selection of thresholds and duration, the first approach is based on the meteorological/climatological values of certain parameters, such as daily mean temperature, maximum and minimum temperatures, temperature indices, duration, and relative humidity, whereas the relative approach also incorporates human acclimatization to weather and uses more human-related bioclimatic indices (e.g., [14,15,16,17]). Thus, the diverse definitions of a heat wave mainly depend on the scope that is being studied. If the climatological-statistical characteristics of these extreme hot events are of primary interest to the researcher, then straightforward metrics are being used. On the other hand, if the study is more human-centered, then the impact of the heat wave on people’s health is the main drive and different approaches are used [11,18]. It should also be mentioned that due to the fact that most of the heat wave indices are developed for a specific use and a specific target group or sector, they are most of the time not flexible and cannot be applied to different regions or for different purposes [1].
Moreover, since temperature is increasing on a global scale, the interest concerning heat waves is also increasing as they are expected to become more frequent, more intense, and of longer duration [19,20]. Especially with respect to the Mediterranean region, which will probably experience a much larger number of heat waves in the future, particularly during the summer months (e.g., [21,22,23,24,25]), the need to define these extreme events efficiently becomes more and more urgent, due to their severe impacts on several aspects of human lives [26,27,28]. In Greece, which is the center of interest in the present study, heat waves have been analyzed by several researchers using different approaches, methodologies, and metrics either from a statistical or a more bioclimatological point of view (e.g., [24,29,30,31,32,33]).
However, in this study, an attempt was made to carry out an in-depth analysis of Greece’s heat waves with a relatively new index, developed primarily for assessing heat waves in Australia [34] but which had recently been applied to the Czech Republic [35] and the Balkan Peninsula (Romania), where Greece is also located [3]. This index, defined as the excess heat factor (EHF) and described in detail in the next paragraph, is actually a set of indices, whose major advantage is that it combines both the statistical and the human-impact aspects of the heat wave. Moreover, with respect to temperature, not only maximum but also minimum temperatures were used for their definition. Adding Tmin on a heat wave index is not only climatologically tempting [1], but high minimum temperature values intensify the heat wave conditions, also increasing the degree of heat stress [34,36]. In addition, Karl and Knight [37] underlined that no relief from high minimum temperatures, for more than three consecutive days, could have crucial impacts on human health. Finally, another advantage of the excess heat factor index is that it takes into consideration not only the temperature conditions of the specific day but also of the previous two ones, which can intensify or reduce the heat wave’s magnitude [1].
In the next section of this study, the methodology for the EHF index computation is analyzed as well as the data that are being used. Moreover, the statistical characteristics and results of the index are presented for the stations under study as well as the assessment of the EHF’s ability to define and describe two representative heat waves (July 1987 and July 2007) that occurred in Greece during the past few years. Finally, the conclusions derived from the study as well as a literature discussion of them can be found in the last station of this research article.

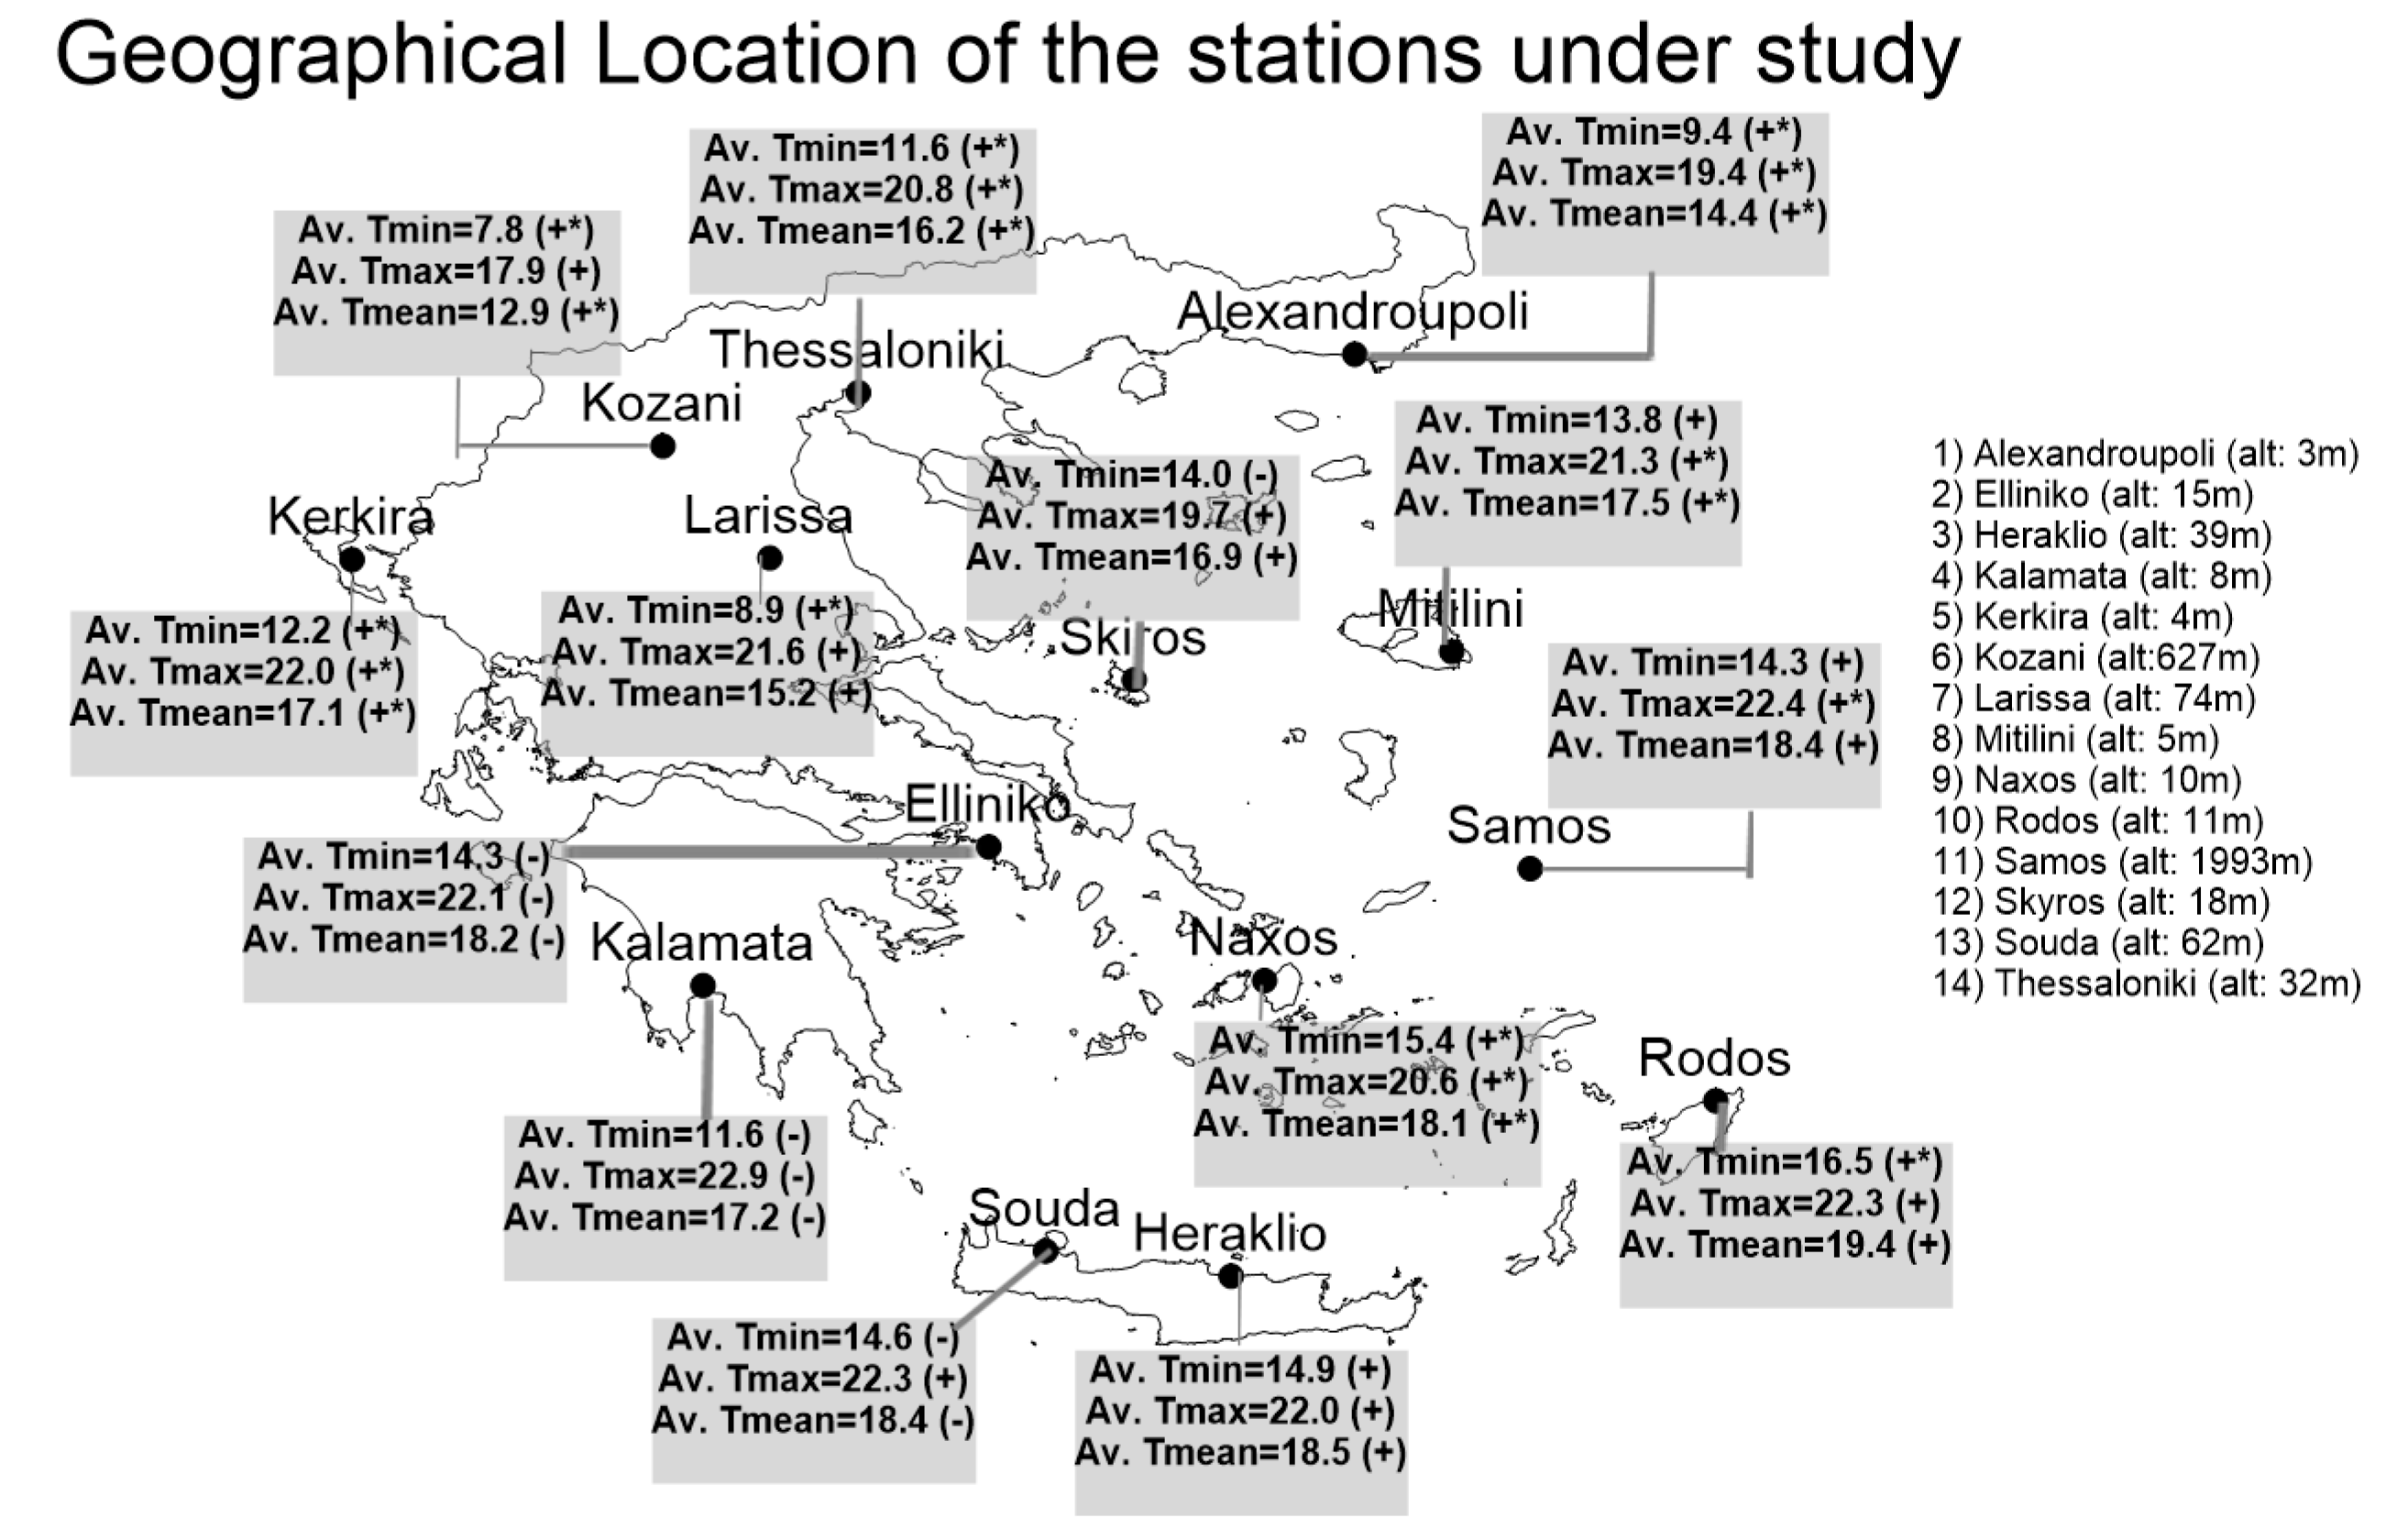
2. Materials and Methods

The identification and determination of heat waves over the study area (Greece) was achieved using the computation of the excess heat factor (EHF) index, which provides a measure of the environmental temperature load [10] and the intensity of a potential heat wave [12]. The EHF is the product of the multiplication of two other excess heat indices (EHIs), namely, EHIaccl and EHIsig.
EHF = EHIsig × max{1, EHIaccl]
EHIaccl is defined as:
E H I a c c l = [ T i + T i 1 + T i 2 3 ] [ T i 3 + T i 32 30 ] ,
where the first term of Equation (2) is the average daily Tmean for a three-day period and the second term is the average daily Tmean of the preceding thirty days. As proposed by Nairn et al. [34], this is an acclimatization index and its positive (negative) values are related to hot (cold) weather conditions. It determines a period of heat that is warmer than the recent past [10], and it should be highlighted that this index is not influenced by the potential general warming trend [34]. This index describes an important factor of the influence of heat to the population because, even though humans tend to acclimatize themselves to their environmental local climate according to the temperature variations throughout the year, they may be unprepared to an abrupt temperature rise above that of the recent past [12]. Thus, positive EHIaccl values indicate a lack of acclimatization to the warmer temperatures which may result in negative health impacts.
The second term of the EHF equation is the significance index (EHIsig) defined by the following equation:
E H I s i g = [ T i + T i 1 + T i 2 3 ] T 95 ,
which is calculated by the difference of the average daily Tmean for a three-day period minus the 95th percentile of the daily Tmean. The percentile is computed for a reference period of 30 years (1971–2000) using the daily values of the mean temperatures for all days throughout the year. A heat wave occurs when EHIsig is positive, while the comparison with the 95th percentile measures the statistical significance of the heat event [30]. The authors also underline the fact that, since T95 is computed for a fixed climatological period, the EHIsig (contrary to the EHIaccl) is expected to become more extreme under a general warming trend.
Therefore, the excess heat factor expresses the long-term temperature anomalies amplified by the short-term ones [10], and the days with positive EHF values indicate heat wave conditions, while the higher the values of the index, the more intense is the heat wave. However, according to Perking and Alexander [1], a heat wave episode will be defined when at least three consecutive days present EHF values above zero.
Finally, daily Tmean in all the above indices should be computed by averaging the Tmin and Tmax daily values since the diurnal temperature variation is highly associated with the ability of the biological systems to recover from high heat load. Hence, for this study, the daily Tmin and Tmax time series, derived from 14 meteorological stations, were used for a 55-year period starting from 1958 to 2012, for the computation of the Tmean values. Except for the data for the Thessaloniki station which were available from the meteorological station of the Aristotle University of Thessaloniki (AUTh), the remaining station data were provided by the Hellenic National Meteorological Service (HNMS). These data were proven to be homogenous according to the Alexandersson test [38] and had no gaps. The geographical distribution of the station locations is presented in Figure 1.
It is worth mentioning at this point that although abnormally warm conditions may occur even during the winter months, it was decided in this case to compute the EHF index for the hottest period of the year, that is, June, July, August, and September (the JJAS period) since summer heat waves tend to be more intense with severe impacts for humans during these months. Finally, adopting the definition used by Perkins and Alexander [1] who mentioned that a heat wave occurs when the abnormally hot conditions (EHF > 0) persist for more than three consecutive days, the duration of spells longer than 3 days was calculated for the 14 stations under study during the 55-year time period.

3. Results

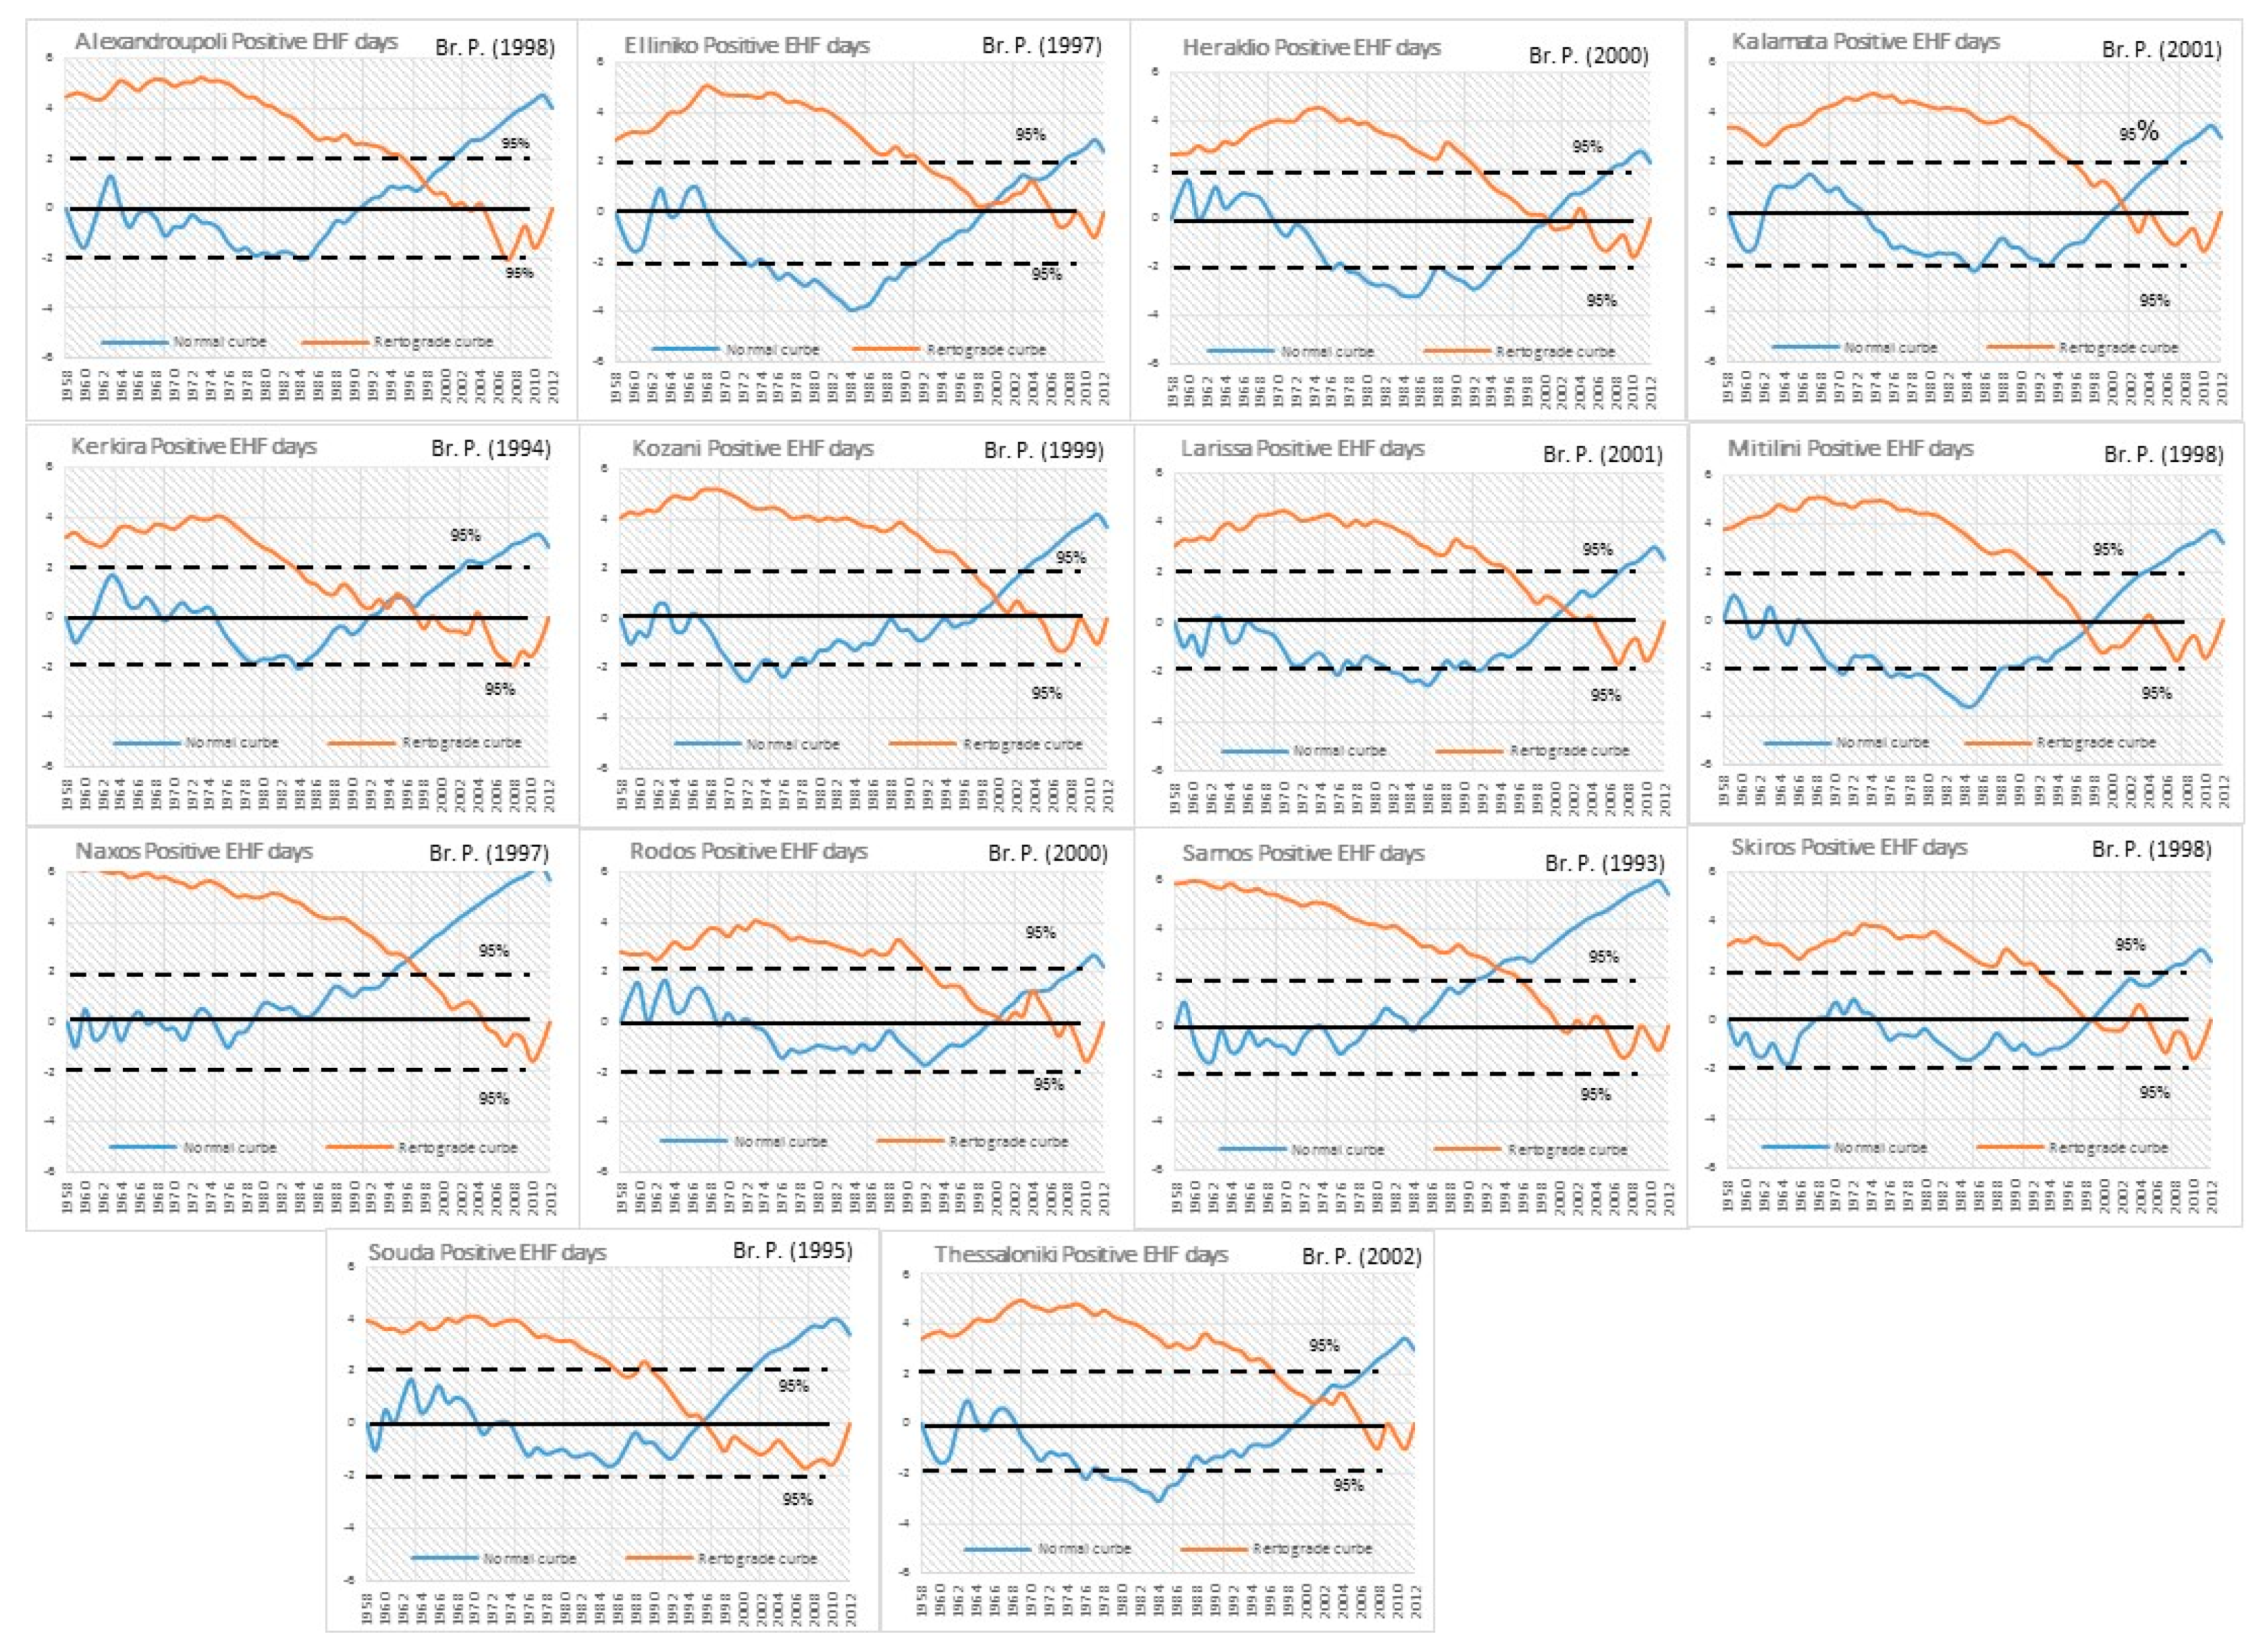
3.1. Statistical Analysis and Aspects of the EHF Index

Primarily required for the definition of the EHIsig index, the 95th percentile of the Tmean was computed for a standard period of 30 years from 1971 to 2000. It was found that the T95 values varied from 24.8 °C to 28.7 °C. The lowest percentile values were observed over Kozani, a station in the west continental part of Greece, followed by Alexandroupoli (25.4 °C) in the north. Kozani is a typical continental station, of quite high altitude (400 m), and that is the main reason for the low Tmean 95th percentile values found. On the other hand, the second minimum of Alexandroupoli can be explained by the fact that this station is found in the northeastern part of Greece, and even though it is a coastal station, it presents an intense continental influence especially during winter, which explains the low 95th percentiles. The highest values were found in Elliniko in central Greece (28.5 °C) and the maximum was found in Samos, an island station over the southeastern Aegean Sea (28.7 °C) (Figure 2).
As mentioned in the previous section, the analysis focused on the hot period of the year (JJAS) for the years from 1958 to 2012. The average number of days in the hot period of the year in Greece when the EHF index presented positive values varied from 17.9 (Larissa) to 23.9 (Kozani). This indicates that for approximately 20 days per year the stations under study experienced heat wave conditions (Table 1). In addition, although Kozani was the station with the lowest T95 percentile value, generally characterized by a relatively colder climate in comparison to the rest of the stations, it showed the highest average positive EHF days.
Moreover, the results regarding the year with the maximum number of days with EHF > 0 indicated that, for all of the stations, they occurred at the end of the examined time period, most of them being in 2012. It seems that during that year, Greece was characterized, in summer, by very intense warm conditions that lasted up to 80 days (Kalamata). However, the absolute maximum was observed in Naxos (89 days) two years earlier (2010). These abnormally hot days tended to become more frequent throughout the examined period, since positive trends were found in all the stations ranging from +3.4 days/decade in Rodos to +11.4 days/decade in Naxos (Table 1). The smaller trend in Rodos could be attributed to the geographical position of the station, in the northwest part of the island, which is highly influenced by the Etesian winds during the summer. The maximum in Naxos could also be related to the location of the station, which is more “protected” from the Etesian winds. Regardless of the trend values, it is worth mentioning that after the application of Kendall’s tau test at a significance level of 95%, all of them were found statistically significant. This comes as a robust indication that the days of abnormally increased temperatures do significantly increase during the examined period and it is not just a random rise (Table 2). This finding encouraged the application of another statistical analysis, based on the application of the Mann–Kendall t test method [39], in order to identify breakpoints on the EHF time series. The results from this test are presented in Figure 3. It can be clearly seen from the normal curve in all stations that the time series of the positive EHF days present a statistically significant positive trend that exceeds the statistical significance level (95%) during the last years of the examined period. In addition, according to the criteria of this test [39], in all stations under study, an abrupt change (breakpoint) of the specific parameter is observed (a clear ”X” shape between the normal and the retrograde curve). The actual year of the breakpoint is not the same in every station but it can be placed from the mid-90s until the first years of the 21st century. More specifically, the earliest breakpoint is in Samos (1993) and the latest one is in the Thessaloniki station (2002) (Figure 3).
Apart from the examination of the number of days with positive EHF values, the study of the spells of positive EHF is also included (Table 2). These heat wave spells were classified in four classes (1st class: 3 to 10 days, 2nd class: 11 to 20 days, 3rd class: 21 to 30 days, and 4th class: >30 days). In addition, the maximum spell duration was computed in order to provide a magnitude of the most extreme heat waves in terms of duration.
As expected, the most frequent spells are the ones belonging to the first class, with an average number of 122.7 spells during the years of study. The most heat waves with 3 to 10 days duration were found for the Kalamata station (146 spells) followed by the Kozani station (140 spells). These “shorter” heat waves were less frequent for two stations in the north of Greece, namely, Alexandroupoli and Kerkira with 106 and 105 spells, respectively. As the duration of the heat waves becomes longer, their frequency decreases. For the second heat wave class, the highest number of spells was found in Alexandroupoli and Elliniko (26 spells) and the lowest one was found in Larissa and Souda (15 spells), whereas for the third class the frequency of the heat waves did not exceed 7 (heat waves with a duration from 21 to 30 days) which was recorded at the Mitilini station over the eastern Aegean Sea. Regarding heat waves with a duration longer than 30 days, none were observed in the Heraklio, Larissa, Skiros, and Souda stations during the 55-year time period. On the other hand, seven (7) such heat waves were found for the Naxos station in the central Aegean Sea and five (5) were found in Kerkira in the Ionian Sea. Finally, calculating the maximum heat wave in each station during the examined period, it should be noted that during the year 2012, Kerkira and Kozani experienced 58 and 57 consecutive days, respectively, of abnormal hot conditions with positive EHF values. The maximum for this parameter (the duration of the maximum spell) is found in general over continental stations, over the western parts of the country, where the Etesian winds lack influence, during the summer months. Conversely, the minimum is observed for island stations where the sea probably plays an important role in cooling (temperature drop), especially during the night. It should also be highlighted that for most of the stations, this extremely long heat wave was detected during the last three years of the study period (2010, 2011, and 2012), especially the last year. This is in agreement with the general finding that 2012 is considered, on a planetary scale, as one of the warmest years all over the world according to the World Meteorological Organization (WMO).

3.2. Examination of the EHF Index in “Capturing” Two Characteristic Heat Waves in Greece

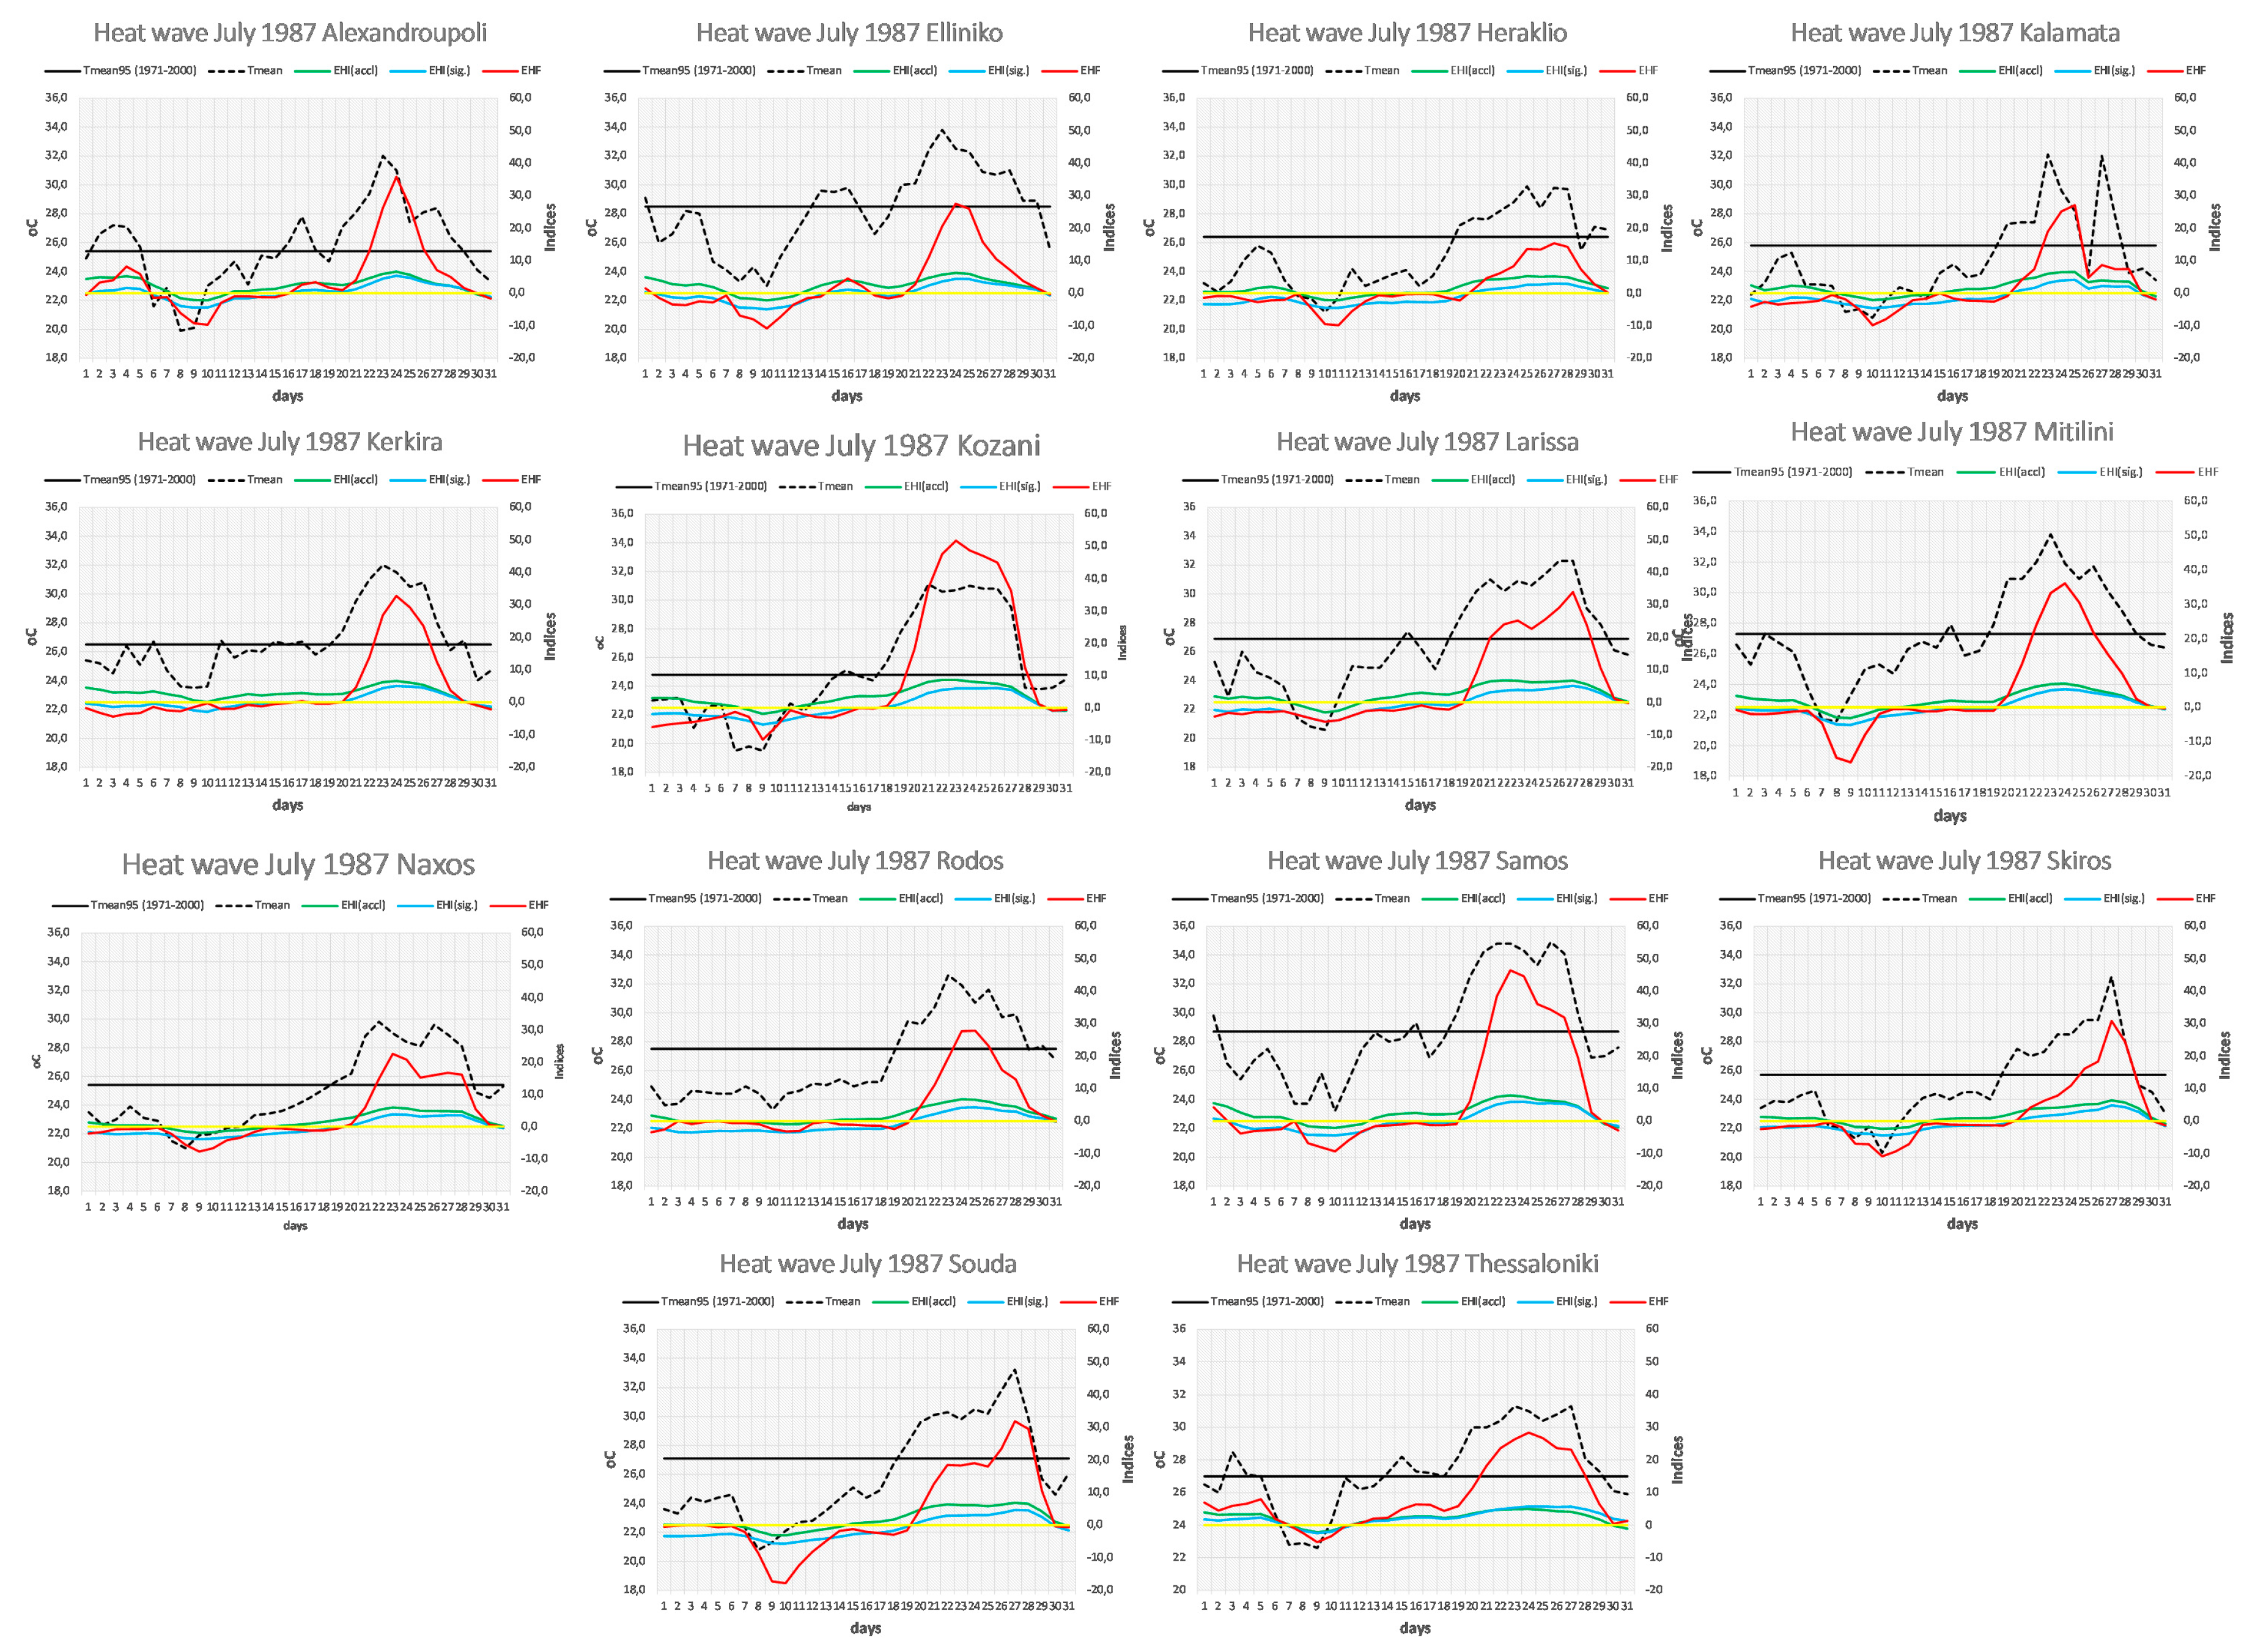
3.2.1. The Heat Wave of the Year 1987

Listed as one of the major natural disasters by Berz [40], the heat wave of the summer of 1987 in Greece resulted in over a thousand deaths all over the country due to heat strokes, heat exhaustion, and heart-related conditions [16,30]. As a result, the heat wave of 1987 has been the subject of several studies, all agreeing that even though higher absolute Tmax values had been recorded before, the duration of these very intense and severe hot conditions was the main characteristic of this specific heat wave [29]. Using two physiological discomfort indices, Giles et al. [41] confirmed that this heat wave was continuous. For nine consecutive days, from 19 to 27 July [29], Tmax values exceeded 40 °C for most areas of Greece [41]; minimum temperatures were also relatively high and the days of the heat waves were characterized by a rather small diurnal range [29]. Matzarakis and Mayer [30] also mention that the thermal indices used in their study showed a very high thermal stress on people. Especially in the case of Athens, each afternoon was considered as “extremely hot” [31] and the heat wave was found to be more intense in northern Greece, especially in Thessaloniki [31,41].
Because of the above characteristics of the heat wave of 1987, this study now attempted to investigate if the EHF index was efficient enough to detect the heat wave, to identify it, and to provide a thorough analysis of this extremely hot summer in Greece. For this purpose, the acclimatization and the significance indices (EHIaccl and EHIsig) as well as the EHF index were computed during the month of July 1987 for the 14 stations under study in comparison with the daily Tmean of that month and the Tmean95 of the reference period 1971–2000 (Figure 4). For all the stations, a gradual increase of the Tmean daily values was observed, rising above the Tmean95 value from 17 to 18 July. The peak of these daily values was found during days 25 to 27 of the month, and they dropped again below the 95th percentile at the end of the month (from 29 to 30 July 1987). If the study of the heat wave was based only on the daily mean temperatures that exceeded the Tmean95, then the duration of the heat wave would be defined from days 18 to 30 of the month. However, using the EHF index, additional and more detailed information was provided.
More specifically, EHIaccl began to have positive values much sooner, on 12–13 July, meaning that the averaged three-day temperature was higher than the recent past, according to the index definition. This indicated that there was now a lack of human acclimatization to the upcoming warmer conditions, which could result in an adverse impact on their everyday life and health [12]. Thus, even though the “actual” heat wave had not started, this rising index (EHIaccl) indicated that humans were not able to physically adapt to this warming, which could be used as a useful alert for heat wave policy management measures. The second computed index (EHIsig) turned positive for several days (in general on 20 July). This was the starting point of the heat wave, since by definition, the EHIsig values should be positive in order to consider the temperature conditions abnormally hot, higher than the 95th percentile Tmean. Both the indices dropped below zero (yellow line in Figure 4) at the end of July, either on day 29 or 30 of the month. In most of the stations, these were the same days that the daily Tmean also fell below the 95th percentile value. Overall, the examination of the combined EHF index showed that the heat wave of July 1987 started on day 20 of the month (in most of the stations under study) ending on day 30 when the EHF values were again negative. An interesting finding of the application of this index was that the peak of the heat wave was not placed on the same day that the actual daily mean temperature values reached their maximum, but one or two days later. In addition, it is worth mentioning that during this specific heat wave, not only were the temperatures exceptionally high (indicated by the EHIsig) but, due to the rapid temperature increase, people did not have the chance to acclimatize themselves to these new “much hotter” conditions (positive EHIaccl), resulting in harmful effects on their health. Moreover, the previous studies’ finding that the heat wave was more intense in northern Greece was also detected from the index application that showed higher values for the stations in the northern parts of the country. It is obvious that the definition and the description of this heat wave using the EHF match the previous findings, making it a suitable index for the study of heat waves.

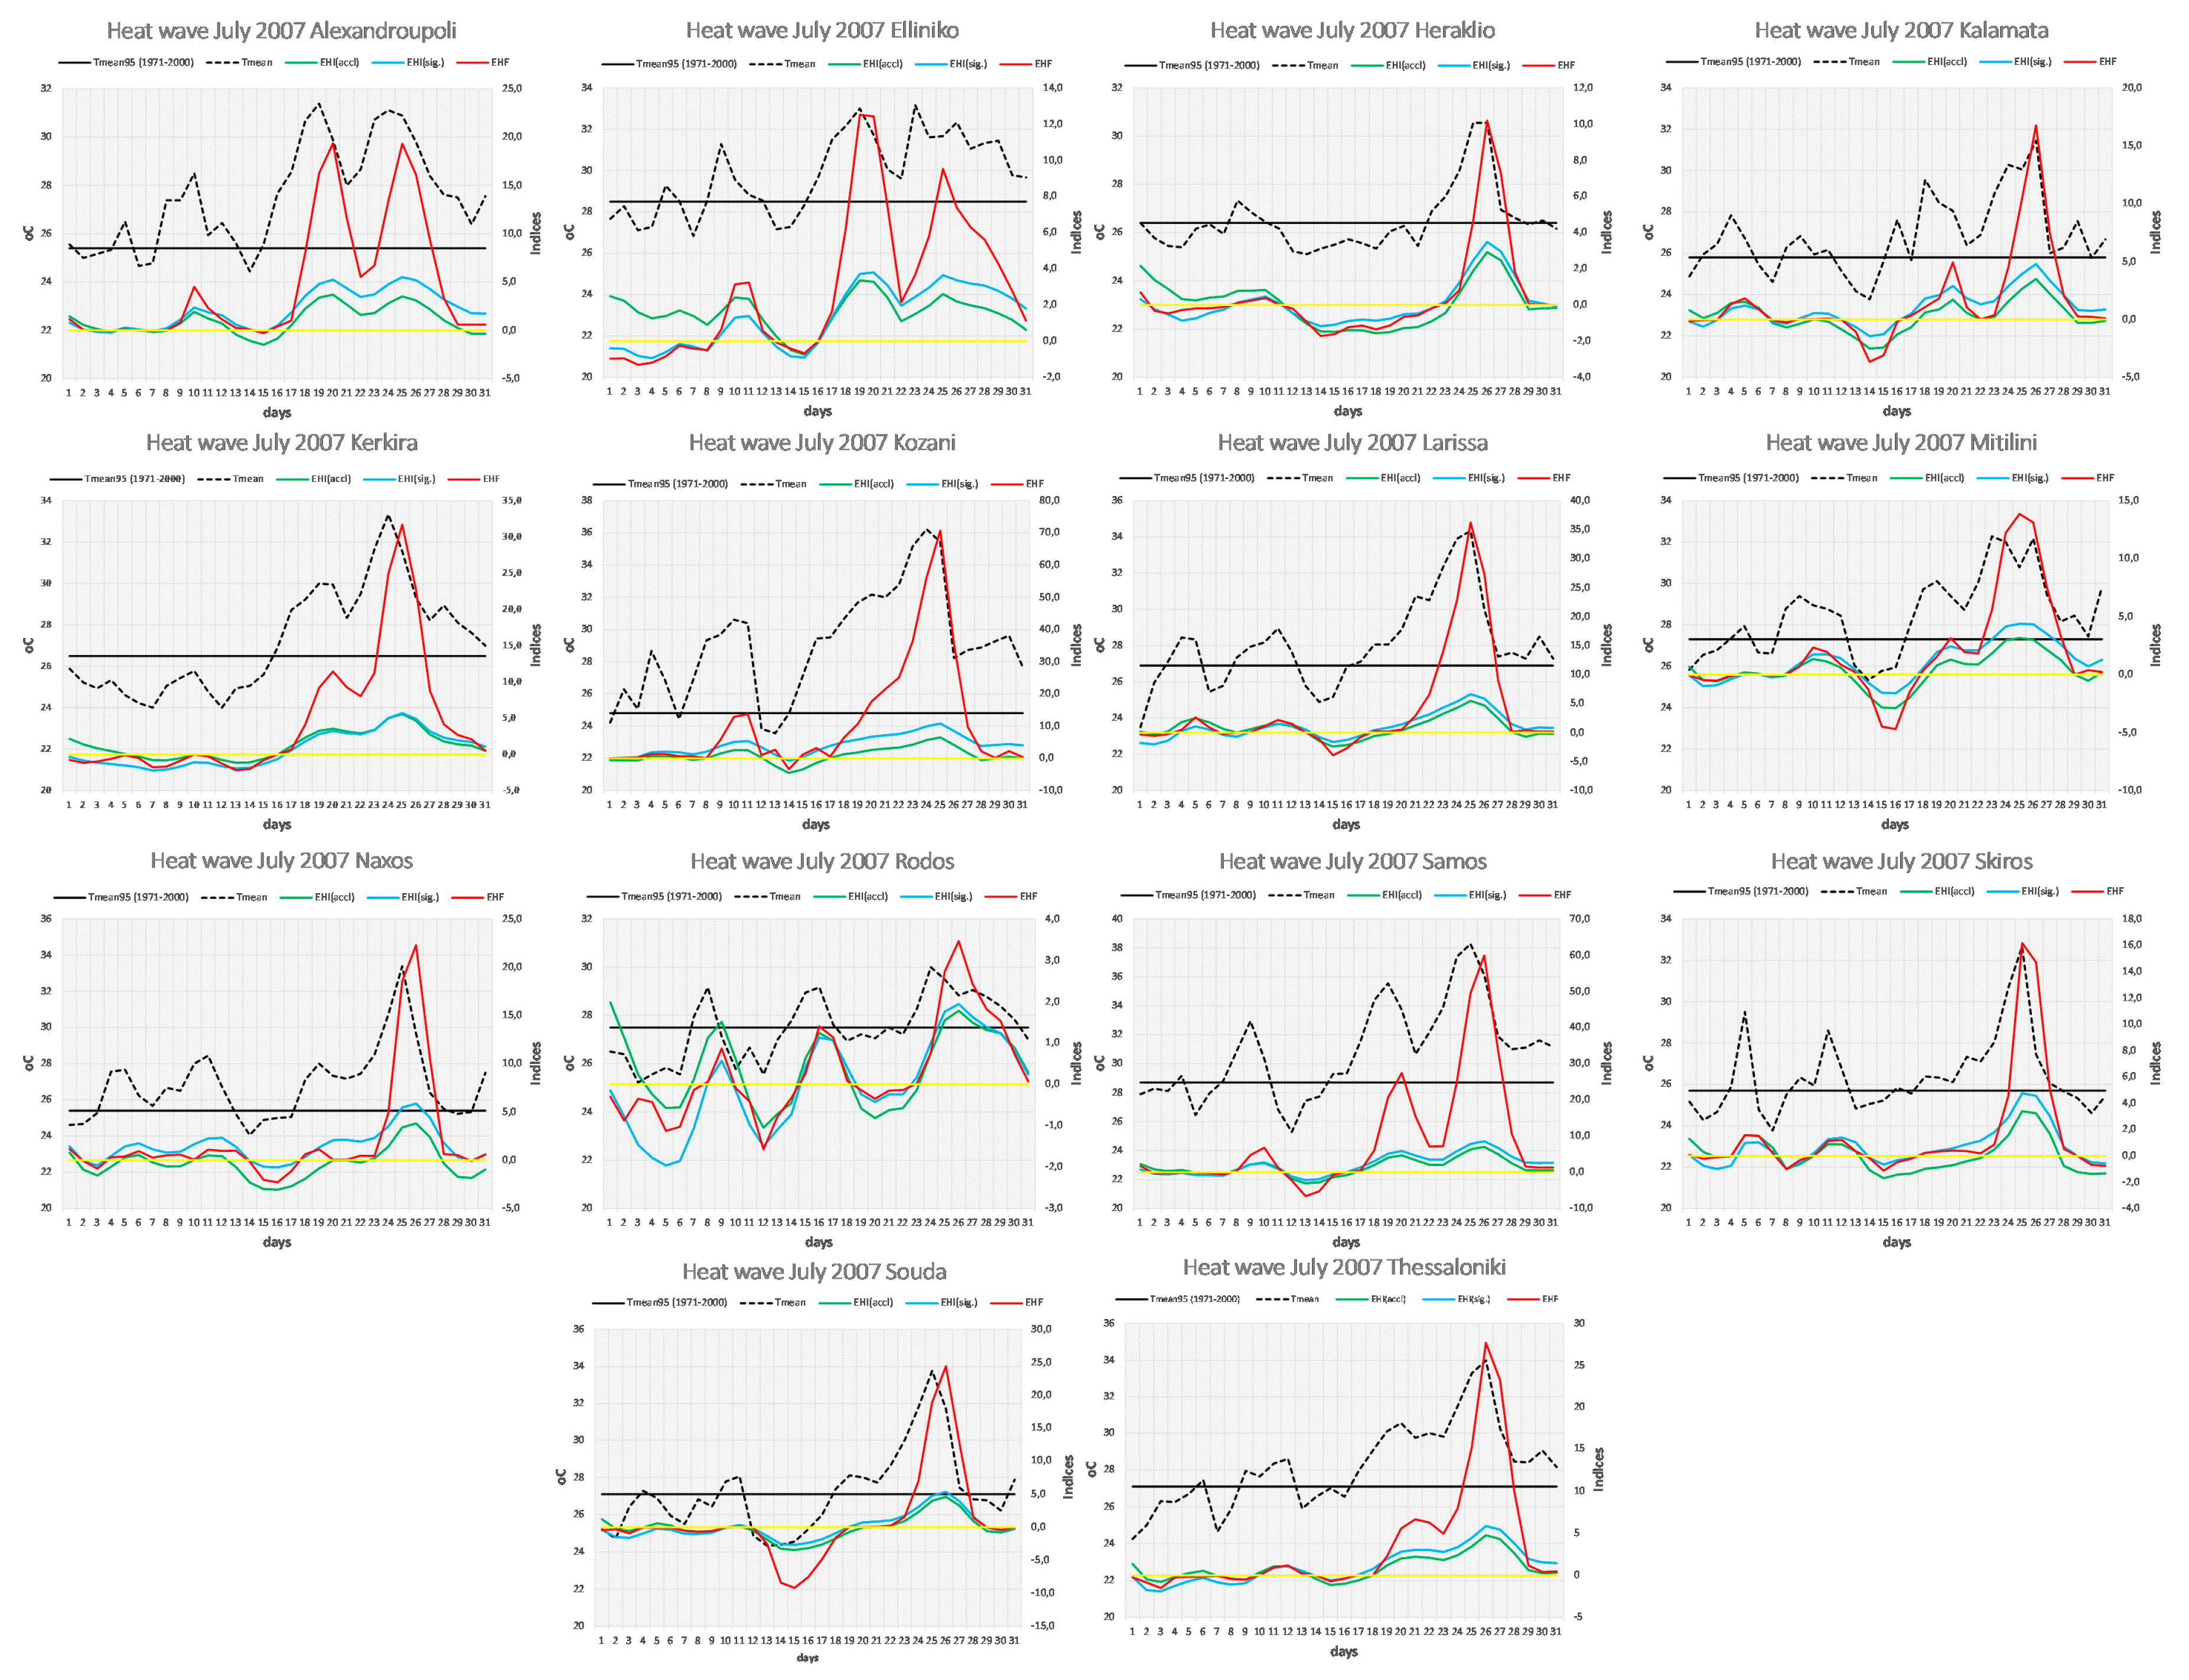
3.2.2. The Heat Wave of the Year 2007

Occurring twenty years after the previous heat wave, the extreme hot conditions experienced during the summer of 2007 have been the subject of several climatological studies. Greece has experienced record-breaking temperatures in most of its regions [33] and the most extreme maximum temperatures appeared during the last days of each of the summer months [24], mainly between days 21 and 29. Theoharatos et al. [42] mentioned that especially in July, the daily Tmax values repeatedly exceeded 40 °C, while the regions where the population experienced discomfort (high discomfort index (DI) values) were Thessalia, Sterea Ellada, and western Pelloponisos. The impacts of this heat wave were substantial with an increase in forest fires, changes in the hydrological balance, and large losses in the agricultural and energy sectors [24,43]. Similarly to the previous paragraph, the three examined indices were computed on a daily basis during July 2007 in order to evaluate their ability to capture and describe the extreme temperatures in Greece during that year (Figure 5).
In most of the stations used in this study, the extreme hot conditions seemed to have started from days 15 to 17 of the month when the daily Tmean exceeded the 95th percentile. However, in most of the stations, the days approximately from 7 to 10 July also surpassed the Tmean95. According to the actual index values, the onset of the heat wave was determined one or two days later from the dates of the Tmean > 95th percentile, 16–18 July, and continued until the end of the month. This was the starting point where the EHIsig was positive, a necessary condition for the determination of a heat wave. Regarding the acclimatization index, it started to present positive values on the same dates as the EHIsig. Yet, in some stations (Souda, Skiros, Naxos, Mitilini, Alexandroupoli, Heraklio, Kalamata), it went negative sooner than the actual ending of the heat wave. This means, according to Nairn and Fawcett [12] that in some cases of longer heat waves, there may be some human adaptation to the extreme hot conditions, decreasing their impact on human health. For example, in the case of Skiros, EHIaccl dropped below zero on 28 July, whereas the end of the heat wave occurred two days later. This characteristic of the heat wave, due to its duration, was not observed in the previous heat wave case (July 1987).
Finally, one of the main issues observed in the computation of the EHF index was its magnitude which differed substantially from one station to the other. This means that even though all of Greece experienced heat wave conditions, its intensity varied considerably (Figure 5). The maximum index values were found for the stations of Kozani, Kerkira, Larissa, and Samos and the lowest ones were found in Rodos. On the other hand, the findings from all stations were in agreement that the peak (the highest EHF value) was found either on day 25 or 26 of the month and that the heat wave then started to wane.

4. Discussion and Conclusions

The statistical characteristics of the combined heat wave index (excess heat factor (EHF)), as well as its ability to identify and describe efficiently previously recorded heat waves over Greece, was the main objective of the present study. Daily maximum and minimum temperature time series from 14 stations distributed over the geographical Greek region were employed for a 55-year period (1958–2018). This index introduced relatively recently [34] had, to the author’s knowledge, never been used before in Greece. Although it was primarily proposed for the monitoring of heat waves in Australia [10,12,34], it was also used during 2018 for heat wave detection in another Balkan country, Romania [3].
Apart from the fact that it is the first time that the EHF index is being used over the center of interest, the main reasons for its selection are the following:
  • It incorporates not only Tmax but also Tmin values which is an important parameter that should be taken under consideration especially if the heat wave study is more human-centered. Temperature rise is undoubtedly related to human health; however, the overnight high temperature impedes the night discharge and results in excess heat stress and an enhancement of the heat wave conditions [1,44,45,46].
  • It measures daily temperature values for a three-day period (average) rather than the single temperature of one day, making it more sensitive to temperature changes as it considers also previous day conditions. [1].
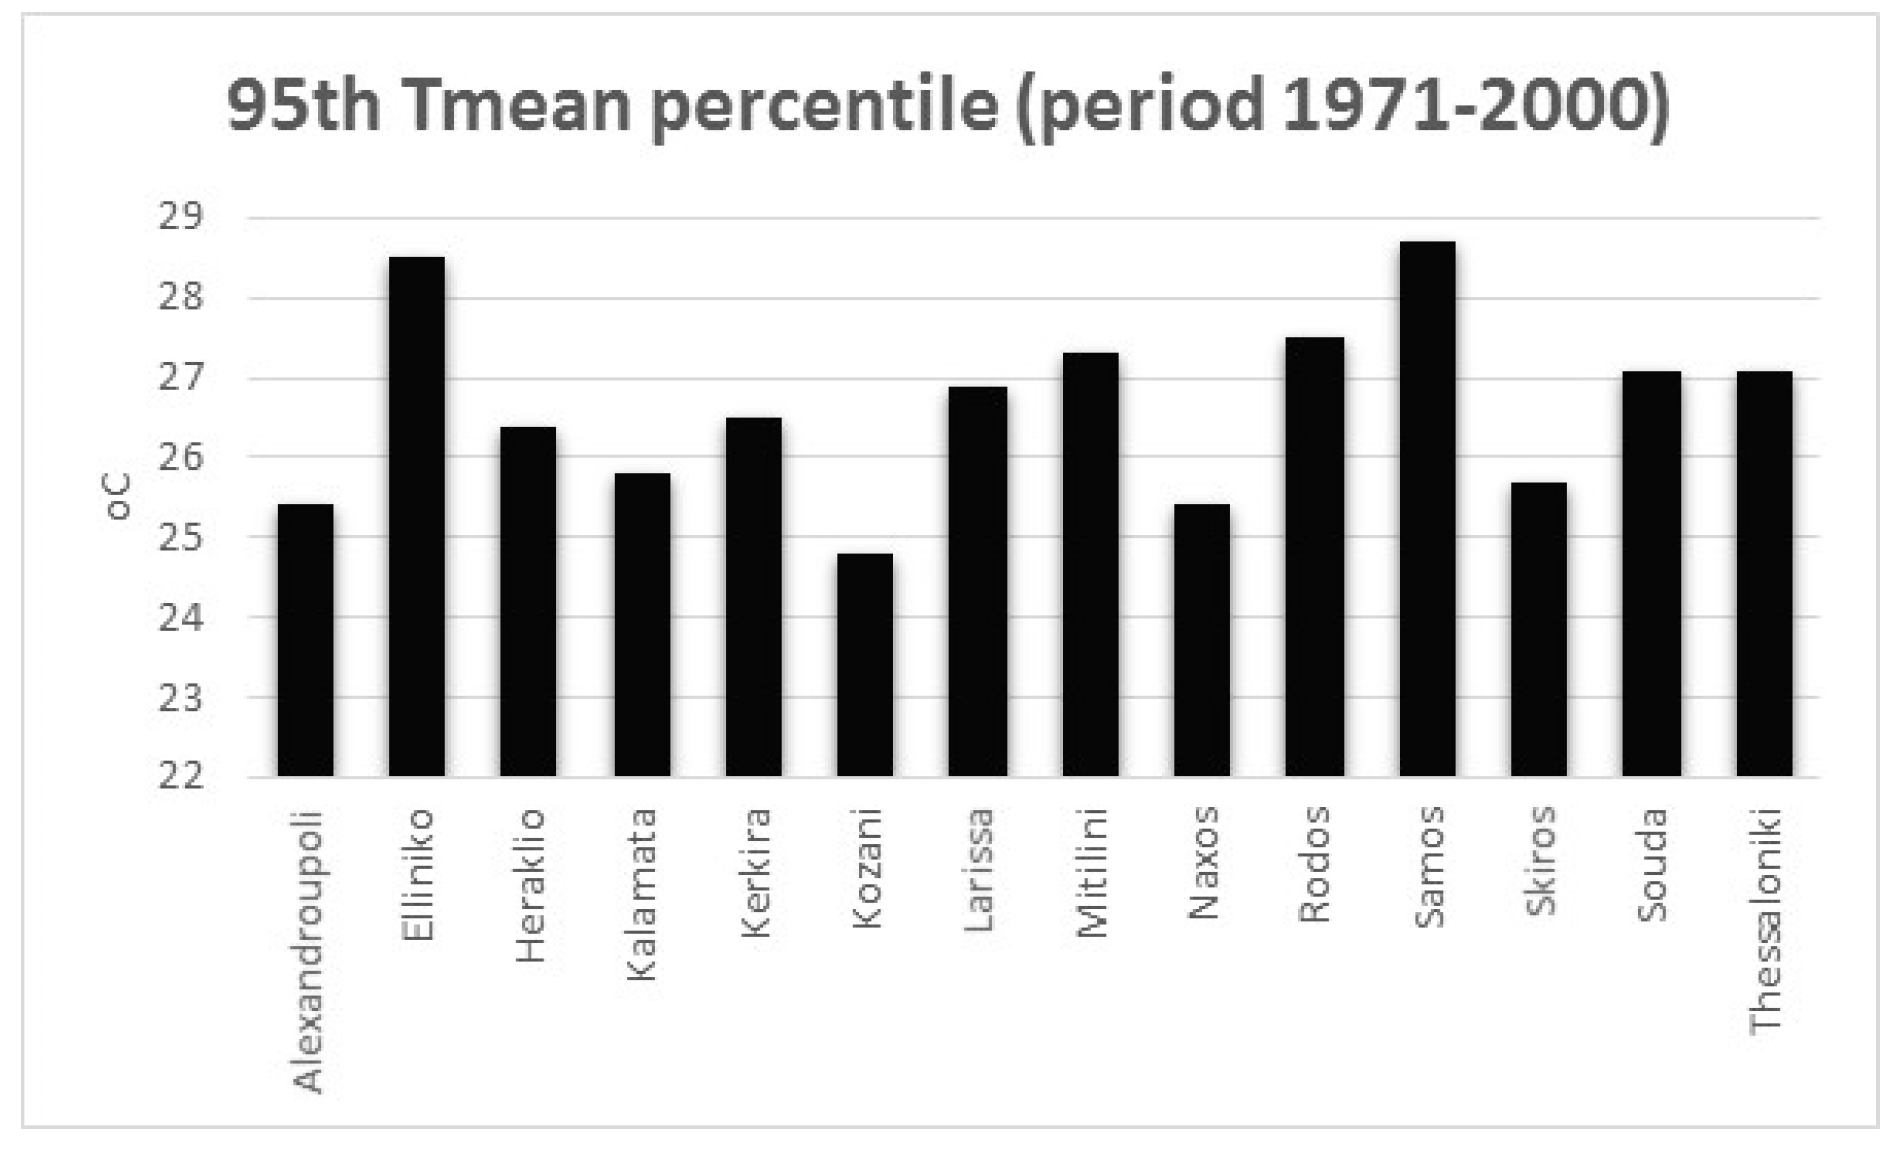
  • The first term of the EHF (EHIsig) provides a measure of the statistical significance of the heating as it is compared with a fixed percentile value (95th percentile of a defined period which, in this case, was chosen to be 1971–2000).
  • The second term (EHIaccl) compares the examined warm conditions with the recent past (previous 30 days) providing an indication of the people’s acclimatization ability to this unusual heat. Conversely to the EHIsig, EHIaccl does not change under a general climate-change warming [12].
  • Overall, the application of the EHF can provide information both about the statistical characteristics of a heat wave but also about its effect on humans.
The computation of the EHF index for the period 1958–2012 demonstrated that, during the warm period of the year (JJAS), Greece experienced approximately 20 days per year with positive anomalous conditions (EHF > 0) with no discrepancies worth mentioning among the stations. In addition, these days tended to become more frequent (with positive statistically significant trends for all stations under study), agreeing with the general consideration of an increase in extreme hot events in the future over the Mediterranean [20]. The years that had the largest number of days with positive EHF values were the last ones of the time period used (2007 to 2012). Up to 89 days in Naxos, for 2010, were observed, where it seemed that most days of the summer season were characterized as abnormally hot.
However, since, according to Perkins and Alexander [1] a heat wave is defined when at least three or more consecutive days have positive anomalies, the spells of these days were also computed according to the index values. The selected stations presented an average of 128 spells with a duration of 3 to 10 days during the examined 55-year period. As the duration of the spell was extended, their frequency lessened. Four stations, mainly island ones, did not present any heat waves longer than 30 consecutive days, whereas others such as Kozani and Kerkira which are located at the northwestern part of Greece experienced an intense heat wave in 2012 lasting 58 and 57 days, respectively.
Apart from the significant insight into the heat wave statistical characteristics obtained from the EHF, an attempt was made in the study to assess its ability to record previous heat waves since the index was primarily introduced for another area with very different climatic characteristics from Greece. After its application to the daily temperature data for July 1987 (one of the most intense heat waves recorded in Greece), it was found that the index identified very efficiently both the duration and the intensity of the heat wave. In addition, the acclimatization index showed that the heating conditions were quite rapid, not allowing people to adapt to them a few days earlier than the defined start of the heat wave. The index was also able to capture the fact that the heat wave was more intense in the northern parts of the country where the EHF values were higher. Conversely, regarding the second heat wave case of July 2007, the computation of the EHF index made it clear that the heating conditions had a different intensity level over Greece since its values differed substantially among the stations. Moreover, the lack of human acclimatization started in this case on the same dates as the beginning of the main heat wave event (a few days of positive value index were also observed during the first days of July). However, the EHIaccl turned negative, for several stations, before the end of the heat wave, meaning that people started to adapt to these extreme conditions due to the longer duration of this specific heat wave.
Overall, the main conclusion of this study is that the EHF index applies not only to the detection and analysis of heat waves in Greece, but it also provides information about the conditions that may or may not have an impact on human health and well-being. Future work includes plans to examine other years which, according to the EHF, seemed to have been extremely hot with extended heat waves such as in the year 2012.

Funding

This research received no external funding.

Conflicts of Interest

The author declares no conflict of interest.

References

  1. Perkins, S.E.; Alexander, L.V. On the Measurement of Heat Waves. J. Clim. 2013, 26, 4500–4517. [Google Scholar] [CrossRef] [Green Version]
  2. Poumadère, M.; Mays, C.; Le Mer, S.; Blong, R. The 2003 heat wave in France: Dangerous climate change here and now. Risk Anal. 2005, 25, 1483–1494. [Google Scholar] [CrossRef] [PubMed]
  3. Piticar, A.; Croitoru, A.E.; Ciupertea, F.A.; Harpa, G.V. Recent changes in heatwaves and cold waves detected based on excess heat factor and excess cold factor in Romania. Int. J. Climatol. 2018, 38, 1777–1793. [Google Scholar] [CrossRef]
  4. Vandentorren, S.; Bretin, P.; Zeghnoun, A.; Mandereau-Bruno, L.; Croisier, A.; Cochet, C.; Ribéron, J.; Siberan, I.; Declercq, B.; Ledrans, M. August 2003 Heat Wave in France: Risk Factors for Death of Elderly People Living at Home. Eur. J. Public Health 2006, 16, 583–591. [Google Scholar] [CrossRef] [PubMed] [Green Version]
  5. Díaz, J.; Jordán, A.; García, R.; López, C.; Alberdi, J.; Hernández, E.; Otero, A. Heat waves in Madrid 1986–1997: Effects on the health of the elderly. Int. Arch. Occup. Environ. Health 2002, 75, 163–170. [Google Scholar] [CrossRef] [PubMed]
  6. Barnett, A.G.; Hajat, S.; Gasparrini, A.; Rocklov, J. Cold and heat waves in the United States. Environ. Res. 2012, 112, 218–224. [Google Scholar] [CrossRef] [PubMed] [Green Version]
  7. D’Ippoliti, D.; Michelozzi, P.; Marino, C.; De’Donato, F.; Menne, B.; Katsouyanni, K.; Kirchmayer, U.; Analitis, A.; Medina-Ramón, M.; Paldy, A.; et al. The impact of heat waves on mortality in 9 European cities: Results from the EuroHEAT project. Environ. Health 2010, 9, 37. [Google Scholar] [CrossRef]
  8. Baccini, M.; Biggeri, A.; Accetta, G.; Kosatsky, T.; Katsouyanni, K.; Analitis, A.; Anderson, H.R.; Bisanti, L.; D’ippoliti, D.; Danova, J.; et al. Heat Effects on Mortality in 15 European Cities. Epidemiology 2008, 19, 711–719. [Google Scholar] [CrossRef]
  9. EM-DAT. The International Disaster Database: Center for Research on the Epidemiology of Disasters—CRED. Available online: https://www.emdat.be/ (accessed on 7 January 2019).
  10. Langlois, N.; Mason, K.; Nairn, J.; Roger, W. Using the Excess Heat Factor (EHF) to predict the risk of heat related deaths. J. Forensic Legal Med. 2013, 20, 408–411. [Google Scholar] [CrossRef]
  11. Smith, T.T.; Zaitchik, B.F.; Gohlke, J.M. Heat waves in the United States: Definitions, patterns and trends. Clim. Chang. 2013, 118, 811–825. [Google Scholar] [CrossRef]
  12. Nairn, J.; Fawcett, R. The excess heat factor: A metric for heatwave intensity and its use in classifying heatwave severity. J. Environ. Res. Public Health 2015, 12, 227–253. [Google Scholar] [CrossRef] [PubMed]
  13. Smouer-Tomic, K.E.; Kuhn, R.; Hudsonh, A. Heat wave hazards: An overview of Heat Wave impacts in Canada. Nat. Hazards 2003, 28, 463–485. [Google Scholar]
  14. Matzarakis, A.; Mayer, H.; Iziomon, M. Applications of a universal thermal index: Physiological equivalent temperature. Int. J. Biometeorol. 1999, 43, 76–84. [Google Scholar] [CrossRef] [PubMed]
  15. Matzarakis, A.; De Rocco, M.; Najjar, G. Thermal bioclimate in Strasbourg—The 2003 heat wave. Theor. Appl. Climatol. 2009, 98, 209–220. [Google Scholar] [CrossRef]
  16. Matzarakis, A.; Nastos, P.T. Human-biometeorological assessment of heat waves in Athens. Theor. Appl. Climatol. 2011, 105, 99–106. [Google Scholar] [CrossRef]
  17. Nastos, P.T.; Matzarakis, A. The effect of air temperature and human thermal indices on mortality in Athens, Greece. Theor. Appl. Climatol. 2012, 108, 591–599. [Google Scholar] [CrossRef]
  18. WMO; WHO. Heatwaves and Health Guidance on Warming-System Development. Available online: https://public.wmo.int/en/projects (accessed on 29 December 2018).
  19. Meehl, G.A.; Tebaldi, C. More Intense, More Frequent, and Longer Lasting Heat Waves in the 21st Century. Science 2004, 305, 994–997. [Google Scholar] [CrossRef] [Green Version]
  20. IPCC. Managing the risks of extreme events and disasters to advance climate change adaptation. In A Special Report of Working Groups I and II of the Intergovernmental Panel on Climate Change; Field, C.B., Barros, V., Stocker, T.F., Qin, D., Dokken, D.J., Ebi, K.L., Mastrandrea, M.D., Mach, K.J., Plattner, G.-K., Allen, S.K., et al., Eds.; Cambridge University Press: Cambridge, UK; New York, NY, USA, 2012; 582p. [Google Scholar]
  21. Xoplaki, E.; Gonzalez-Rouco, J.F.; Luterbacher, J.; Wanner, H. Mediterranean summer air temperature variability and its connection to the large-scale atmospheric circulation and SSTs. Clim. Dyn. 2003, 20, 723–739. [Google Scholar] [CrossRef]
  22. Kostopoulou, E.; Jones, P.D. Assessment of climate extremes in the eastern Mediterranean. Meteorol. Atmos. Phys. 2005, 89, 69–85. [Google Scholar] [CrossRef]
  23. Della-Marta, P.M.; Haylock, M.R.; Luterbacher, J.; Wanner, H. Doubled length of western European summer heat waves since 1880. J. Geophys. Res. 2007, 112, D15103. [Google Scholar] [CrossRef]
  24. Tolika, K.; Maheras, P.; Tegoulias, I. Extreme temperatures in Greece during 2007. Could this be a “return to the future”? Geophys. Res. Lett. 2009, 36. [Google Scholar] [CrossRef]
  25. Ouzeau, G.; Soubeyroux, J.-M.; Schneider, M.; Vautard, R.; Planton, S. Heat waves analysis over France in present and future climate: Application of a new method on the EURO-CORDEX ensemble. Clim. Serv. 2016, 4, 1–12. [Google Scholar] [CrossRef] [Green Version]
  26. Salata, F.; Golasi, I.; Petitti, D.; de Lieto Vollaro, E.; Coppi, M.; de Lieto Vollaro, A. Relating microclimate, human thermal comfort and health during heat waves: An analysis of heat island mitigation strategies through a case study in an urban outdoor environment. Sustain. Cities Soc. 2017, 30, 79–96. [Google Scholar] [CrossRef]
  27. Roldán, E.; Gómez, M.; Pino, M.R.; Pórtoles, J.; Linares, C.; Díaz, J. The effect of climate-change-related heat waves on mortality in Spain: Uncertainties in health on a local scale. Stoch. Environ. Res. Risk Assess. 2016, 30, 831–839. [Google Scholar] [CrossRef]
  28. Miron, I.J.; Linares, C.; Montero, J.C.; Criado-Alvarez, J.J.; Díaz, J. Changes in cause-specific mortality during heat waves in central Spain, 1975–2008. Int. J. Biometeorol. 2015, 59, 1213–1222. [Google Scholar] [CrossRef]
  29. Prezerakos, N. A contribution to the study of the extreme heat wave over the South Balkans in July 1987. Meteorol. Atmos. Phys. 1989, 41, 261–271. [Google Scholar] [CrossRef]
  30. Matzarakis, A.; Mayer, H. The extreme heat wave in Athens in July 1987 from the point of view of human biometeorology. Atmos. Environ. 1991, 25, 203–211. [Google Scholar] [CrossRef]
  31. Giles, B.D.; Balafoutis, C.J. The Greek heatwaves of 1987 and 1988. Int. J. Climatol. 1990, 10, 505–517. [Google Scholar] [CrossRef]
  32. Balafoutis, C.; Makrogiannis, T. Analysis of a heat wave phenomenon over Greece and it’s implications for tourism and recreation. In Proceedings of the First International Workshop o2n Climate, Tourism and Recreation, Halkidiki, Greece, 5–10 October 2001; pp. 113–121. [Google Scholar]
  33. Founda, D.; Giannakopoulos, C. The exceptionally hot summer of 2007 in Athens, Greece—A typical summer in the future climate? Glob. Plan. Chang. 2009, 67, 227–236. [Google Scholar] [CrossRef]
  34. Nairn, J.; Fawcett, R.; Ray, D. Defining and predicting excessive heat events: A national system. In Proceedings of the Modelling and Understanding High Impact Weather: Extended Abstracts of the Third CAWCR Modelling Workshop, Melbourne, Australia, 30 November–2 December 2009; Volume 17, pp. 83–86. [Google Scholar]
  35. Urban, A.; Hanzlíková, H.; Kyselý, J.; Plavcová, E. Impacts of the 2015 heat waves on mortality in the Czech Republic—A comparison with previous heat waves. Int. J. Environ. Res. Public Health 2017, 14, 1562. [Google Scholar] [CrossRef]
  36. Trigo, R.; Garia-Herrera, R.; Diaz, J.; Trigo, I.; Valente, M. How exceptional was the early August 2003 heatwave in France? Geophys. Res. Lett. 2005, 32, L10701. [Google Scholar] [CrossRef]
  37. Karl, T.R.; Knight, R.W. The 1995 Chicago Heat Wave: How likely is a recurrence? Bull. Am. Meteorol. Soc. 1997, 78, 1107–1120. [Google Scholar] [CrossRef]
  38. Alexandersson, H. A homogeneity test applied to precipitation data. J. Climatol. 1986, 6, 661–675. [Google Scholar] [CrossRef]
  39. Sneyers, R. Sur L’analyse Statistique des Series D’observations; OMM Publ. No. 415. Note Technique 143; OMM: Geneve, Switzerland, 1975; 192p. [Google Scholar]
  40. Berz, G. List of Major Natural Disasters, 1960–1987. Nat. Hazards 1998, 1, 97–99. [Google Scholar] [CrossRef]
  41. Giles, B.D.; Balafoutis, C.; Maheras, P. Too hot for comfort: The heatwaves in Greece in 1987 and 1988. Int. J. Biometeorol. 1990, 34, 98–104. [Google Scholar] [CrossRef] [PubMed]
  42. Theoharatos, G.; Pantavou, K.; Spanou, A.; Katavoutas, G.; Makrygiannis, G.; Mavrakis, A. Discomfort index levels during the heatwaves of June and July 2007 in Greece. In Proceedings of the 11th International Conference on Environmental Science and Technology, Chania, Greece, 3–5 September 2009; pp. 946–952. [Google Scholar]
  43. Katavoutas, G.; Theoharatos, G.; Flocas, H.A.; Asimakopoulos, D.N. Measuring the effects of heat wave episodes on the human body’s thermal balance. Int. J. Biometeorol. 2009, 53, 177–187. [Google Scholar] [CrossRef] [PubMed]
  44. Pattendend, S.; Nikiforov, B.; Armstrong, B.G. Mortality and temperature in Sofia and London. Epidemiol. Community Health 2003, 57, 628–633. [Google Scholar] [CrossRef] [Green Version]
  45. Pirard, P.; Vandentorren, S.; Pascal, M.; Laaidi, K.; Le Tertre, A.; Cassadou, S.; Ledrans, M. Summary of the mortality impact assessment of the 2003 heat wave in France. Eurosurveillance 2005, 10, 153–156. [Google Scholar] [CrossRef] [PubMed]
  46. Nicholls, N.; Skinner, C.; Loughnan, M.; Tapper, N. A simple heat alert system for Melbourne, Australia. Int. J. Biometeorol. 2008, 52, 375–384. [Google Scholar] [CrossRef]
Figure 1. Geographical distribution of the stations under study. For each station, the altitude where it is located can be found on the right of the map. For each station, the average Tmin, Tmax, and Tmean values for the period 1958–2012 are provided. The sign of the trend of these time series is found in the brackets (). The asterisk indicates the statistical significance of the trends at the 95% level of significance.
Climate 07 00009 g001
Figure 2. The 95th Tmean percentiles for the stations under study for the period 1971–2000.
Climate 07 00009 g002
Figure 3. Mann–Kendall t test results on the statistically significant trends, at the 95% level, of the EHF positive days. In the upper right corner of each diagram, the year of the breakpoint (abrupt climatic change) is indicated in the brackets.
Climate 07 00009 g003
Figure 4. Day-to -day representation of the heat wave of July 1987 in Greece. The daily Tmean values as well as the Tmean95 percentile (reference period 1971–2000) are plotted in reference to the left y-axis (°C) and the three indices in reference to the right y-axis (°C). The yellow line represents zero and refers to the right y-axis.
Climate 07 00009 g004
Figure 5. Same description as in Figure 4 but for the heat wave of July 2007 in Greece.
Climate 07 00009 g005
Table 1. Average, maximum and trends of the days with positive EHF values for June, July, August, and September (JJAS) for the period 1958–2012. All the trends were found statistically significant at the 95% level according to Kendall’s tau test.
Average Positive EHF DaysMax. Positive EHF DaysTrend Positive EHF Days
Alexandroupoli23.072 (2012)+0.76
Elliniko21.776 (2011)+0.41
Heraklio18.551 (2010)+0.41
Kalamata22.880 (2012)+0.65
Kerkira21.571 (2012)+0.56
Kozani23.977 (2008)+0.79
Larissa17.956 (2012)+0.44
Mitilini21.063 (2007)+0.63
Naxos22.889 (2010)+1.14
Rodos19.450 (2012)+0.34
Samos21.067 (2012)+0.89
Skiros19.552 (2007)+0.41
Souda17.949 (2012)+0.45
Thessaloniki21.963 (2012)+0.58
Table 2. Number of heat wave spells (consecutive days with EHF values > 0.0) during the study period 1958–2012 for the 14 stations under study.
3–10 Days11–20 Days21–30 Days>30 DaysMaximum Spell Duration
Alexandroupoli106265445 days (2012)
Elliniko127262137 days (2011)
Heraklio119211030 days (2010)
Kalamata146202257 days (2012)
Kerkira105233558 days (2012)
Kozani140235132 days (2008)
Larissa117153028 days (2012)
Mitilini116207132 days (2011)
Naxos106192757 days (2010)
Rodos130200133 days (2012)
Samos124195139 days (2012)
Skiros134182025 days (2010)
Souda132150018 days (1999)
Thessaloniki116225138 days (2012)

