Abstract
The thermal environment is an important aspect of the urban environment because it affects the quality of life of urban residents and the energy use in buildings. Urban Heat Island (UHI) and Urban Cold Island (UCI) are complementary effects that are the consequence of cities’ structures interference with the local climate. This article presents results from five years of urban climate monitoring (2012–2016) in a small Portuguese city (Bragança) using a dense meteorological network of 23 locations covering a wide array of Local Climate Zones (LCZ), from urban areas to nearby rural areas. Results show the presence of both the UHI effect, from mid-afternoon until sunrise, and the UCI after sunrise, both being more intense under the dense midrise urban context and during the summer. Urban Green Spaces had an impact on both UHI and UCI, with an important role in cooling areas of the city during daytime in the summer. Other LCZs had less impact on local thermal conditions. Despite the small size of this city, both effects (UHI and UCI) had a relevant intensity with an impact on local climate conditions. Both effects tend to decrease in intensity with increasing wind speed and precipitation.
1. Introduction
As over half of the global population lives nowadays in urban environments [1], the changes in land use and land cover, from rural to urban, induced modifications in physical processes which generate the urban climate, described by Oke [2] as the particular meteorological processes and atmospheric changes that take place at the urban level. Many urban patterns can influence the local climate, including the distribution of land use, the design of streets, buildings and open spaces, as well as the choice of materials; such urban design options generate local changes in wind speed and direction, humidity, precipitation, air temperature, air pollutants dispersion and deposition [3,4].
Back in 1981, an increase in the amount of urban climate studies was already identified by Landsberg [5], who associated this trend with the growing interest by the scientific community on the human impact on the environment. The relevance of urban climate studies is often associated with the needs of a large group of professionals, in different sectors, avid for knowledge that can be applied in the development of solutions for the built environment through sustainable urban design and architecture [2]. Moreover, urban climate studies increased over the last decades as a consequence of the growing concern with human thermal comfort, energy savings, and climate change [6,7]. However, the singularity of each city demands for the development of studies in a wide array of conditions, providing adjusted information for planners and policy makers [8].
Urban Heat Island (UHI) is one of the most studied effects in the urban climate [9,10,11,12,13], which can be described as the tendency for surface air temperature to be higher in cities when compared with the surrounding rural areas [5,14,15]. Therefore, UHI intensity can be analyzed by looking at the differences in surface air temperature between the urban and rural areas; such differences can be ascribed by means of differentiated heating (from sunrise until sunset) and cooling (from sunset to sunrise) across different measurement locations [16]. In fact, the complex characteristics of the urban context include structures that have high thermal admittance which can capture, store, and release heat, which contributes to the warming of cities [6,17]. Radiation balance has a major influence on the changes in air temperature, as incoming radiation—both long and short wave—reaches the surfaces and urban areas have higher uptakes of net radiation [11,18]. Sensible heat (SH) and latent heat (LH) also have a major influence on urban climate during the day in urban and rural areas, respectively [11,17,19,20]. Low albedo of surfaces also plays a relevant role in promoting the UHI effect [5,14,17,18,19,20,21,22,23,24]. In addition, anthropogenic sources provide supplementary heat in cities [11,18,23].
Many studies report changes in the UHI intensity across different urban locations; such differences tend to be positive during the nighttime, reaching the highest values just before sunrise [11,13,15,24,25,26,27,28,29,30]. Conversely, during the morning, negative UHI has also been identified [26,27,28,29,31,32], in what is often called as the Urban Cold Island effect (UCI) [27,29,31]. This process takes place mostly because buildings (or other urban elements) block the solar radiation during the early hours of the day, providing shade in urban areas, while those same structures affect the wind speed inside the urban structure, setting the basis for the UCI [33]. Both of these thermal effects have differentiated intensity when changing the texture of the urban environment [34].
In order to address the variability in the intensity of both the UHI and the UCI effects in an urban area, it is necessary to address the complexity and diversity of the urban fabric [35,36]. Many approaches try to define categorical variables that can provide a valid reference for urban climate analysis, formulating or applying Local Climate Zones (LCZ) [2,36]. The LCZs concept has been used as a spatial reference for the design of urban meteorological networks [13,37,38,39,40,41,42], allowing the analysis of diverse meteorological conditions inside and at the periphery of urban areas.
The main objective of this study was to investigate the intensity of both the UHI and UCI effects in a small but complex urban reality—the city of Bragança (Portugal)—evaluating the changes in the intensity of those effects inside the urban fabric, using LCZs as a reference for this analysis. This study uses data from five years of meteorological observations (2012–2016).
2. Materials and Methods
Bragança is a small size city (approximately 25,000 inhabitants) located in the northeast of Portugal (41°48′20″ N, 6°45′42″ W) (Figure 1), in a mountain region. It is located in a complex terrain and has a diverse urban form. The meteorological network implemented to study this city urban climate includes a set of 23 temperature and relative humidity sensors (model TGP-4500, TinyTag, Gemini Data Loggers, Chichester, UK), spread across the urban and peri-urban context (Figure 2a), encapsulated in white cases and placed three meters above ground level, facing south, semidetached from existent street lights (Figure 2b). Wind speed was measured with three weather stations used for data control (Model 05103, Wind Monitor. Young, Traverse City, MI, USA). Data from every measurement was logged with ten second averages.
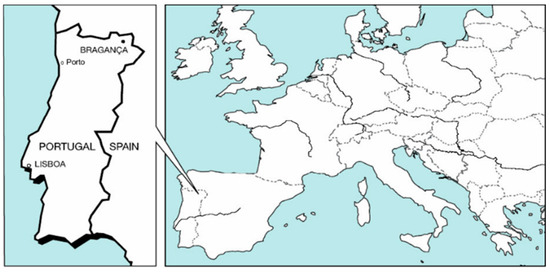
Figure 1.
Location of the city of Bragança (Portugal).
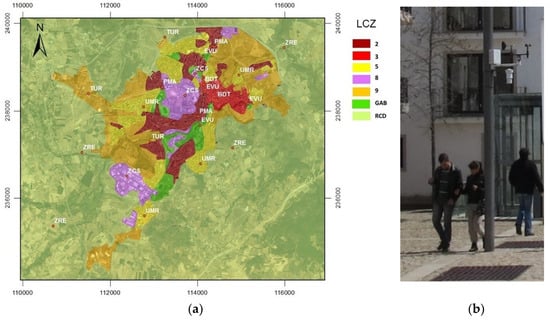
Figure 2.
(a) Measuring network and its distribution in relation to the Local Climate Zones (LCZ) (Table 1); (b) Thermohygrometer and wind speed and direction sensor placed on a local square.
The definition of the meteorological network considered a set of criteria (Figure 2; Table 1): sensors were spread across the city; at least three sensors were placed in each of the seven considered LCZs (Table 2); and the distribution covered the urban to rural gradient. Land use and land cover from every location was gathered including: the Sky View Factor (SVF) using fish eye photos for information; roughness length using Gal et al. method [43]; and the impervious surface fraction for a 25 m radius using ArcGIS software. The network was first installed in December 2011 and has provided essential data for understanding the local urban climate.

Table 1.
Measuring points location.
Table 2.
Local Climate Zones and their attributes (Based on Stewart and Oke [36]).
As the city rests on a complex terrain, with differences in altitude of up to 200 m, a polynomial regression model was used to estimate and then correct the altitude bias, approaching data to an average altitude of 680 m, using data from two rural sensors to determine a fifth degree polynomial function. The result was a slight adjustment that reduces the altitude bias.
Data was collected on location every other month. Thermohygrometers were regularly tested (every 2 years) to verify for the need for calibration. No meaningful differences were found between the devices since the beginning of the observations and therefore data quality was considered to be insured.
For this particular study, data analysis considers a period from 2012 to 2016. Altogether, a total of 958,985 surface air temperature records were considered (approximately 41,689 for each point). Paired-samples t-tests were conducted to investigate whether the data from average air temperature was different across the study LCZs. Data analysis focused on UHI effect intensity, considering the seasonal differences in surface air temperature between urban LCZs and nearby rural areas (). For the same spatial contexts, other analyses included the monthly and hourly variation of the UHI intensity, the average cooling and warming rates, and the influence of wind and precipitation on UHI intensity. Statistical analysis and graphical representation were carried out with the support of SPSS 17 software [44].
3. Results
3.1. Case Study
Bragança is a small size city (approximately 25,000 inhabitants) located in the northeast of Portugal and has cold and humid winters and dry and warm summers (Csb–Köppen). Meteorological data from the study period (Figure 3) shows a wide variation in average surface air temperatures from cold winters to warm summers. Wind speed had its maximum average during the month of February, while precipitation had a maximum average during the months of January and October. Under the local climate conditions, occasional outdoor thermal comfort is expected during mild periods from late spring to early fall, as both cold and hot discomfort is expected be felt outdoors throughout most of the year [45].
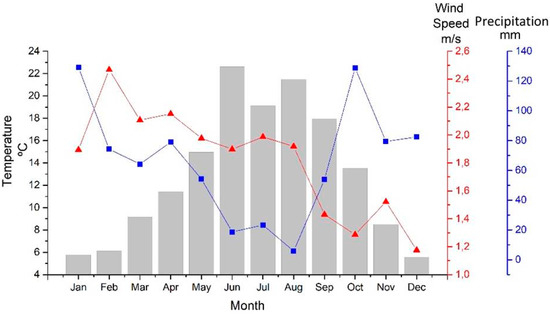
Figure 3.
Monthly average surface air temperature, wind speed, and precipitation (2012–2016).
A paired samples t-test was run to determine whether there was a statistically significant mean difference in the surface air temperature for the different LCZs. Results suggest that the local conditions on the LCZs determine different average temperatures (Table 3). Taking into account such differences, it is expectable that such data will determine differentiated Urban Heat Island (UHI) intensities.
Table 3.
Paired samples t-test results for the average temperature in the different LCZs.
3.2. UHI Intensity
The UHI intensity () results show a wide amplitude for the different urban LCZs (Figure 4), ranging from positive to negative differences, despite the positive median values. As expected, the higher intensity in the UHI was found on the most urbanized contexts (LCZ 2 and 3). LCZ GAB (Urban Green Spaces) also presented a wide range of UHI intensity values, especially during the summertime. Globally, the summer period had the highest intensity medians and the wider range of values. Conversely, the UHI intensity is quite low during the winter season and the range of values narrows.
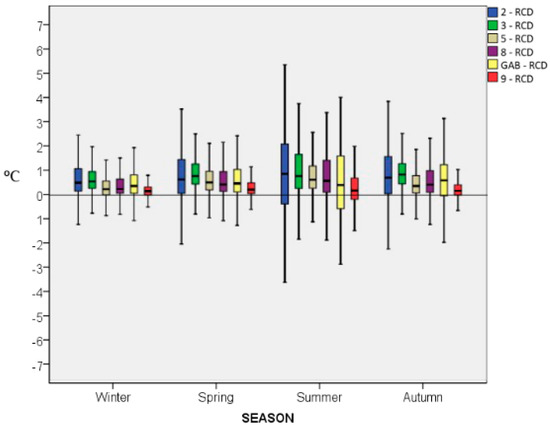
Figure 4.
Seasonal UHI intensity (∆t) across studied LCZs. RCD: Rural Areas; GAB: Urban Green Spaces.
When looking at low-rise urban development LCZs (5 and 9), UHI intensity tends to be reduced in range. The peri-urban context, LCZ 9, has the lowest UHI intensity levels. The existence of a substantial fraction of negative UHI intensity suggests the existence of a UCI effect.
In order to have an insight on the behavior of surface air temperature inside the urban fabric when compared with the rural context, it is important to analyze the daily hour change in the UHI intensity throughout the year (Figure 5). From this analysis, results show the existence of diverse processes taking place throughout the day, all over the year.
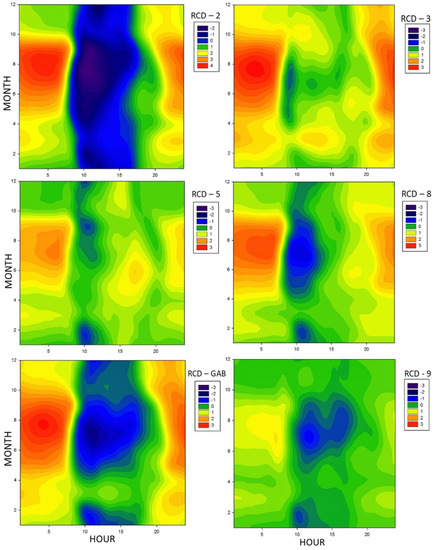
Figure 5.
Daily and seasonal variation for the UHI effect for each LCZ in °C.
Starting from sunrise, soon after the UHI effect reaches its highest values, there is a quick shift in the UHI intensity, as surface air temperature increases faster in the rural context when compared with the urban LCZs. These results suggest the existence of a UCI effect, as in the early hours of the day, the solar radiation hits the ground of the open rural areas earlier, warming up the surfaces and causing air temperature to rise quickly, while the shadows cast by the buildings and trees partially intersect the solar radiation reaching the urban environment. As a consequence, during this period, surface air temperature raises slowly inside the urban context when compared with the rural areas. The UCI was felt with the highest intensity inside the urban green spaces (LCZ GAB) during the summer months, reaching over −3 °C. The persistence of the UCI effect in local green spaces may be explained by the fact that all selected monitoring spots included trees, most of them deciduous, in the vicinity of the sensors, therefore there was a cooling effect as a result of evapotranspiration and of shadows cast by such trees. Such effect was felt more intensely during the spring and summer periods, and was reduced during the fall and winter seasons, likely due to the reduced amount of leaves in trees. Midrise building in LCZs 2 (residential) and 8 (commercial) also had relevant UCI intensities throughout part of the year, which was probably caused by the effect of shadows cast by nearby buildings. Lower UCI intensities were felt in low-rise developments LCZs (3 and 5).
From the afternoon until sunrise, UHI intensities are positive across urban LCZs and intensify when approaching sunrise, thus showing the existence of a UHI effect. Higher hourly UHI intensities were reached in LCZ 2, just before sunrise in summertime, with differences of over 4 °C. LCZs 8, 9, and GAB had lower UHI intensities, but still reached averages close to 3 °C during a fraction of the nighttime. The lowest values were reached in low-rise urban contexts (LCZs 3 and 5).
3.3. Seasonal Hour Temperature Change across LCZs
Changes in the UHI intensity may also be analyzed through the heating and cooling rates across the LCZs (Figure 6), where positive values indicate average hour increases in surface air temperature (warming) and negative values indicate average decreases in surface air temperature (cooling).
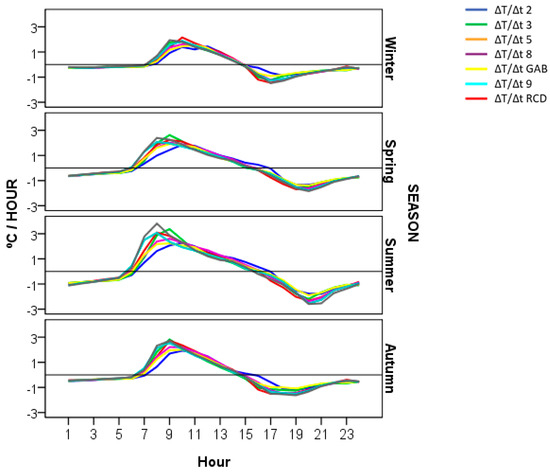
Figure 6.
Average hourly heating and cooling rate for each LCZ.
As the sun elevates after sunrise, surface air temperature increased in every LCZ. In most of the seasons, during the early hours of the day, the local average warming ratio was higher in rural areas, with a clear difference during the early hours of summer, with a maximum average increase during the summer at approximately 08:00 (UTC) reaching an increase of 2 °C/h.
Conversely, the UHI effect is more intense during the night, reaching its maximum intensity just before sunrise. Higher UHI intensities are motivated by the slow release of heat in cities during the night, most noticeable in low SVF locations, as such was the case of LCZ 2, 8, and GAB during the summer. SVF relates with the UHI intensity as the surfaces, heated during the day, release long wave radiation during the night, which is partially trapped by the surrounding elements, preventing a faster release of heat. The night cooling in rural areas, on the other hand, takes place faster, thus generating a relevant difference in surface air temperature when compared with urban LCZs, enhancing the UHI effect. Although the daily cooling and heating rates are similar in all the LCZs, the highest range of results was found in the rural LCZ (RCD).
In every LCZ, the maximum warming rate was felt close to the time of sunrise. Conversely, the cooling rate reached its peak soon after sunset.
3.4. Wind and Rain Effect
As may be recognized in Figure 5, there are several timeframes in which the mentioned UHI and UCI effects became less intense, such was the case of March and October. Such variations may be understood through the analysis of both wind and rainfall, as those variables have an influence on the UHI intensity [5,46].
When analyzing the relationship between UHI intensity and both wind speed and precipitation, there is a clear reduction in the dispersion of results, with both UHI and UCI effects showing less intensity (Figure 7). These results show the importance of wind in reducing the heat storage by promoting convection, while the rain conditions are associated with a lower intake of shortwave radiation, as a consequence of cloud covering, and with the cooling effect of water evaporating on surfaces.
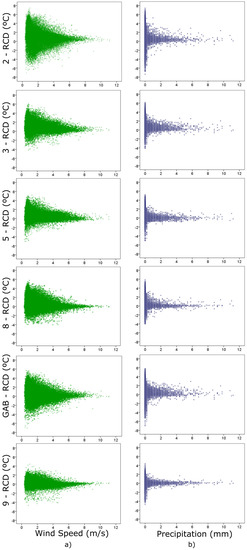
Figure 7.
UHI intensity change with the wind speed (left) and precipitation (right).
4. Discussion
This paper analyzes data from a dense measuring network located in a small city with a diverse urban structure. Larger cities are associated with higher UHI intensity [47,48,49] and several of such cities have been studied in recent years [10,13,41,50,51,52]. Small cities receive less attention, although occasional studies [53,54,55] show that there are urban climate issues that should be considered in this city size scale, including the UHI effect.
This study focused on the analysis of the UHI and UCI using a large dataset (five years) from a dense monitoring network covering a wide array of LCZs. Results on UHI intensity show a positive median value with a large variation throughout the day and night periods, with seasonal variations.
The general UHI intensity measured in this study, in both the daytime and nighttime, follows the general trends presented in similar studies, as the UHI effect had a higher intensity in the most densely urbanized areas, while a more intense UCI was found in local green spaces [10,11,27,37,50,56,57,58,59]. From sunrise, the daily evolution of air temperature shows a slower warming of the urban LCZ in the early hours of the day when compared with the rural areas, most noticed inside urban green spaces (LCZ GAB) and in dense urban contexts with midrise buildings and high admittance surfaces (LCZ 2 and 8). Such effect is more effective during the summer and, under the local climate conditions, may help to provide cooling areas during the morning in hot summer days. The four monitoring locations located inside green spaces had deciduous trees, a fact that may help explain the existence of contrasting effects between fall and winter seasons and summer seasons. During the warmer seasons, trees’ shadow generates a more effective cooling effect. The main reason for these circumstances is related to the differences in the SVF from the monitoring sites, as the rural areas considered (RCD) in the vicinity of the city of Bragança are mostly formed by low-rise vegetation, with high SVF, easing the cooling of surfaces, in contrast with the lower SVF found in LCZ GAB. These results are consistent with studies that demonstrate the cooling potential of green spaces [33,60,61,62,63]. The relatively high UCI registered in the LCZs 2 and 8 are associated with the urban configuration, including shadow cast by buildings and reduced ventilation inside the urban structure.
From mid-afternoon, the prevailing effect starts to be the UHI, with increasing intensity until sunrise. The most relevant effect was reached on LCZ 2, with average differences just over 4 °C during the summer. Such effects are often the result of the urban texture, with lower SVF, impervious surfaces, and low albedo materials [15]. Under warm summer conditions, the persistence of a high UHI may contribute to the development of health problems during warm summer nights [64,65,66], since this effect may help extend the heat stress beyond the daytime hours. Less dense LCZs have a smaller impact on the UHI.
Among such LCZs, the GAB showed the highest potential for developing a UCI during the day, while having the second highest UHI intensity during summer nights. The lower impact of GAB in reducing the UHI during summer nights should be related with the role of the tree canopy in reducing the SVF, thus limiting the emission of long wave radiation [67,68].
Daily and seasonal variation analysis has shown that there were some periods with low UHI and UCI intensities. This study presents results that suggest that both effects are reduced and even neutralized by the effect of wind or precipitation, or both. Such circumstances have also been found in similar studies [29,55,69] indicating that both the UHI and UCI effects are more intense during stable meteorological conditions.
The existence of a dense measuring network in a small city should be regarded as providing a relevant potential for delivering quality data to urban planning. As the UHI effect is often associated with large cities, this study shows that the studied city (Bragança, Portugal) had an important impact on the urban climate, thus demonstrating the need for a wide development of research to address local urban climate issues.
This study used the definition of LCZs as a starting point for the analysis of the UHI intensity in a diverse urban context. This approach carries some degree of simplification, as it uses a categorical approach to the definition of the urban influence on local climate. To better understand this effect, a deeper analysis on the microclimatic conditions on individual sensor location should be considered in future analysis. Moreover, the complexity of the dataset and the hour, daily, and seasonal variations in surface air temperature demand further and more diverse approaches to the analysis of the data provided by the local meteorological network.
In the future, the meteorological network will continue to gather relevant data that will provide additional inputs for the development of research, including microclimatic analysis, urban climate mapping, or urban climate modeling.
Author Contributions
Conceptualization, A.G., A.C.R. and M.F.; Methodology, A.G. and A.C.R.; Validation, M.F.; Formal Analysis, G.O.; Investigation, G.O. and F.M.; Data Curation, G.O. and F.M.; Writing-Original Draft Preparation, G.O. and F.M.; Writing-Review & Editing, A.G.; Visualization, A.G. and G.O.; Supervision, A.R.; Project Administration, A.G.; Funding Acquisition, A.G., A.C.R and M.F.
Funding
This research was initially part of the Project BIOURB—“Diversidad Bioconstructiva Transfronteriza, Edificación Bioclimática y su adaptación a la Arquitectura y Urbanismo Moderno”, funded by FEDER (European Regional Development Fund), under the Transnational Co-Operation Programme Portugal-Spain, 2011–2013.
Acknowledgments
The authors would like to acknowledge the support from the following persons or institutions: Arsénio Araújo and Ângelo Saraiva for the help in collecting the data from the meteorological network; Pierfranco Giordano for his help with data compilation; and the Municipality of Bragança for the logistic support for the Meteorological Network.
Conflicts of Interest
The authors declare no conflict of interest.
References
- United Nations. World Population Prospects: 2018 Revision; United Nations: New York, NY, USA, 2018. [Google Scholar]
- Oke, T.R. Initial Guidance to Obtain Representative Meteorological Observations at Urban Sites, in Instruments and Observing Methods; WHO, Ed.; World Health Organization: Geneva, Switzerland, 2006. [Google Scholar]
- Janković, V. A historical review of urban climatology and the atmospheres of the industrialized world. Wiley Interdiscip. Rev. Clim. Chang. 2013, 4, 539–553. [Google Scholar] [CrossRef]
- Collier, C.G. The impact of urban areas on weather. Q. J. R. Meteorol. Soc. 2006, 132, 1–25. [Google Scholar] [CrossRef]
- Landsberg, H.E. The Urban Climate; Academic Press: Cambridge, MA, USA, 1981; Volume 28. [Google Scholar]
- Hebbert, M.; Jankovic, V. Cities and Climate Change: The Precedents and Why They Matter. Urban Stud. 2013, 50, 1332–1347. [Google Scholar] [CrossRef]
- Mills, G. Urban climatology: History, status and prospects. Urban Clim. 2014, 10, 479–489. [Google Scholar] [CrossRef]
- Ren, C.; Ng, E.Y.-Y.; Katzschner, L. Urban climatic map studies: A review. Int. J. Climatol. 2011, 31, 2213–2233. [Google Scholar] [CrossRef]
- Stewart, I.D. A systematic review and scientific critique of methodology in modern urban heat island literature. Int. J. Climatol. 2011, 31, 200–217. [Google Scholar] [CrossRef]
- Giridharan, R.; Ganesan, S.; Lau, S.S.Y. Daytime urban heat island effect in high-rise and high-density residential developments in Hong Kong. Energy Build. 2004, 36, 525–534. [Google Scholar] [CrossRef]
- Memon, R.A.; Leung, D.Y.C.; Liu, C.-H. An investigation of urban heat island intensity (UHII) as an indicator of urban heating. Atmos. Res. 2009, 94, 491–500. [Google Scholar] [CrossRef]
- Cuadrat, J.M.; Saz Sánchez, M.A.; Vicente Serrano, S.M. Spatial patterns of the urban heat island in Zaragoza (Spain). Clim. Res. 2005, 30, 61–69. [Google Scholar]
- Van Hove, L.W.A.; Jacobs, C.M.J.; Heusinkveld, B.G.; Elbers, J.A.; van Driel, B.L.; Holtslag, A.A.M. Temporal and spatial variability of urban heat island and thermal comfort within the Rotterdam agglomeration. Build. Environ. 2015, 83, 91–103. [Google Scholar] [CrossRef]
- Gartland, L. Heat Islands: Understanding and Mitigating Heat in Urban Areas; Earthscan: London, UK, 2008. [Google Scholar]
- Oke, T.R. Boundary Layer Climates; Routledge: London, UK, 1987. [Google Scholar]
- Sakakibara, Y.; Owa, K. Urban–rural temperature differences in coastal cities: Influence of rural sites. Int. J. Climatol. 2005, 25, 811–820. [Google Scholar] [CrossRef]
- Chrysoulakis, N.; Grimmond, C.S.B. Understanding and Reducing the Anthropogenic Heat Emission, in Urban Climate Mitigation Techniques; Routledge: London, UK, 2016; pp. 27–40. [Google Scholar]
- Taha, H. Urban climates and heat islands: Albedo, evapotranspiration, and anthropogenic heat. Energy Build. 1997, 25, 99–103. [Google Scholar] [CrossRef]
- Trlica, A.; Hutyra, L.R.; Schaaf, C.L.; Erb, A.; Wang, J.A. Albedo, Land Cover, and Daytime Surface Temperature Variation Across an Urbanized Landscape. Earths Future 2017, 5, 1084–1101. [Google Scholar] [CrossRef]
- Brown, R.D. Design with Microclimate: The Secret to Comfortable Outdoor Space; Island Press: Washington, DC, USA, 2010. [Google Scholar]
- Jandaghian, Z.; Akbari, H. The Effect of Increasing Surface Albedo on Urban Climate and Air Quality: A Detailed Study for Sacramento, Houston, and Chicago. Climate 2018, 6, 19. [Google Scholar] [CrossRef]
- Morini, E.; Touchaei, A.G.; Rossi, F.; Cotana, F.; Akbari, H. Evaluation of albedo enhancement to mitigate impacts of urban heat island in Rome (Italy) using WRF meteorological model. Urban Clim. 2018, 24, 551–566. [Google Scholar] [CrossRef]
- Boehme, P.; Berger, M.; Massier, T. Estimating the building based energy consumption as an anthropogenic contribution to urban heat islands. Sustain. Cities Soc. 2015, 19, 373–384. [Google Scholar] [CrossRef]
- Schrijvers, P.J.C.; Jonker, H.J.J.; Kenjereš, S.; de Roode, S.R. Breakdown of the night time urban heat island energy budget. Build. Environ. 2015, 83, 50–64. [Google Scholar] [CrossRef]
- Kusaka, H.; Kimura, F. Thermal Effects of Urban Canyon Structure on the Nocturnal Heat Island: Numerical Experiment Using a Mesoscale Model Coupled with an Urban Canopy Model. J. Appl. Meteorol. 2004, 43, 1899–1910. [Google Scholar] [CrossRef]
- Suomi, J.; Kayhko, J. The impact of environmental factors on urban temperature variability in the coastal city of Turku, SW Finland. Int. J. Climatol. 2012, 32, 451–463. [Google Scholar] [CrossRef]
- Półrolniczak, M.; Tomczyk, A.; Kolendowicz, L. Thermal Conditions in the City of Poznań (Poland) during Selected Heat Waves. Atmosphere 2018, 9, 11. [Google Scholar] [CrossRef]
- Vez, J.P.M.; Rodríguez, A.; Jiménez, J.I. A study of the urban heat island of Granada. Int. J. Climatol. 2000, 20, 899–911. [Google Scholar]
- Acero, J.A.; Arrizabalaga, J.; Kupski, S.; Katzschner, L. Urban heat island in a coastal urban area in northern Spain. Theor. Appl. Climatol. 2013, 113, 137–154. [Google Scholar] [CrossRef]
- Peron, F.; De Maria, M.M.; Spinazzè, F.; Mazzali, U. An analysis of the urban heat island of Venice mainland. Sustain. Cities Soc. 2015, 19, 300–309. [Google Scholar] [CrossRef]
- Ye, C.; Liu, Y.; Quan, W.; Liu, W.; Liu, C. Application of Urban Thermal Environment Monitoring Based on Remote Sensing in Beijing. Procedia Environ. Sci. 2011, 11, 1424–1433. [Google Scholar] [CrossRef]
- Liu, Y.; Fang, X.; Xu, Y.; Zhang, S.; Luan, Q. Assessment of surface urban heat island across China’s three main urban agglomerations. Theor. Appl. Climatol. 2018, 133, 473–488. [Google Scholar] [CrossRef]
- Yang, X.; Li, Y.; Luo, Z.; Chan, P.W. The urban cool island phenomenon in a high-rise high-density city and its mechanisms. Int. J. Climatol. 2017, 37, 890–904. [Google Scholar] [CrossRef]
- Sobstyl, J.M.; Emig, T.; Qomi, M.J.A.; Ulm, F.J.; Pelleng, R.J. Role of City Texture in Urban Heat Islands at Nighttime. Phys. Rev. Lett. 2018, 120, 108701. [Google Scholar] [CrossRef] [PubMed]
- Givoni, B. Climate Considerations in Building and Urban Design; John Wiley & Sons: Hoboken, NJ, USA, 1998. [Google Scholar]
- Stewart, I.D.; Oke, T.R. Local climate zones for urban temperature studies. Bull. Am. Meteorol. Soc. 2012, 93, 1879–1900. [Google Scholar] [CrossRef]
- Beck, C.; Straub, A.; Breitner, A.; Cyrys, J.; Philipp, A.; Rathmann, J.; Schneider, A.; Wolf, K.; Jacobeit, J. Air temperature characteristics of local climate zones in the Augsburg urban area (Bavaria, southern Germany) under varying synoptic conditions. Urban Clim. 2018, 25, 152–166. [Google Scholar] [CrossRef]
- Middel, A.; Häb, K.; Brazel, A.J.; Martin, C.A.; Guhathakurta, S. Impact of urban form and design on mid-afternoon microclimate in Phoenix Local Climate Zones. Landsc. Urban Plan. 2014, 122, 16–28. [Google Scholar] [CrossRef]
- Siu, L.W.; Hart, M.A. Quantifying urban heat island intensity in Hong Kong SAR, China. Environ. Monit. Assess. 2013, 185, 4383–4398. [Google Scholar] [CrossRef] [PubMed]
- Leconte, F.; Bouyer, J.; Claverie, R.; Pétrissans, M. Using Local Climate Zone scheme for UHI assessment: Evaluation of the method using mobile measurements. Build. Environ. 2015, 83, 39–49. [Google Scholar] [CrossRef]
- Alexander, P.; Mills, G. Local Climate Classification and Dublin’s Urban Heat Island. Atmosphere 2014, 5, 755. [Google Scholar] [CrossRef]
- Perera, N.G.R.; Emmanuel, R. A “Local Climate Zone” based approach to urban planning in Colombo, Sri Lanka. Urban Clim. 2018, 23, 188–203. [Google Scholar] [CrossRef]
- Gál, T.; Unger, J. Detection of ventilation paths using high-resolution roughness parameter mapping in a large urban area. Build. Environ. 2009, 44, 198–206. [Google Scholar] [CrossRef]
- SPSS Inc. PASW Statistics for Windows, version 18.0.; SPSS Inc.: Chicago, IL, USA, 2019. [Google Scholar]
- Fariña Tojo, J.; Fernández Áñez, M.V.; Galvez Huerta, M.A.; Hernández Aja, A.; Urrutia del Campo, N. Manual de Diseño Bioclimático: Manual de Recomendaciones Para la Elaboración de Normativas Urbanísticas; Instituto Politécnico de Bragança: Bragança, Portugal, 2013. [Google Scholar]
- Oke, T.R. The energetic basis of the urban heat island. Q. J. R. Meteorol. Soc. 1982, 108, 1–24. [Google Scholar] [CrossRef]
- Zhou, B.; Rybski, D.; Kropp, J.P. The role of city size and urban form in the surface urban heat island. Sci. Rep. 2017, 7, 4791. [Google Scholar] [CrossRef] [PubMed]
- Tan, M.; Li, X. Quantifying the effects of settlement size on urban heat islands in fairly uniform geographic areas. Habitat Int. 2015, 49, 100–106. [Google Scholar] [CrossRef]
- Oke, T.R. City size and the urban heat island. Atmos. Environ. (1967) 1973, 7, 769–779. [Google Scholar] [CrossRef]
- Roberge, F.; Sushama, L. Urban heat island in current and future climates for the island of Montreal. Sustain. Cities Soc. 2018, 40, 501–512. [Google Scholar] [CrossRef]
- Clay, R.; Guan, H.; Wild, N.; Bennett, J.; Vinodkumar; Ewenz, C. Urban Heat Island traverses in the City of Adelaide, South Australia. Urban Clim. 2016, 17, 89–101. [Google Scholar] [CrossRef]
- Zhang, H.; Qi, Z.-F.; Ye, X.-Y.; Cai, Y.-B.; Ma, W.-C.; Chen, M.-N. Analysis of land use/land cover change, population shift, and their effects on spatiotemporal patterns of urban heat islands in metropolitan Shanghai, China. Appl. Geogr. 2013, 44, 121–133. [Google Scholar] [CrossRef]
- Ivajnšič, D.; Kaligarič, M.; Žiberna, I. Geographically weighted regression of the urban heat island of a small city. Appl. Geogr. 2014, 53, 341–353. [Google Scholar] [CrossRef]
- Dos Santos Cardoso, R.; Dorigon, L.P.; Teixeira, D.C.F.; de Costa Trindade Amorim, M.C. Assessment of Urban Heat Islands in Small- and Mid-Sized Cities in Brazil. Climate 2017, 5, 14. [Google Scholar] [CrossRef]
- Vardoulakis, E.; Karamanis, D.; Fotiadi, A.; Mihalakakou, G. The urban heat island effect in a small Mediterranean city of high summer temperatures and cooling energy demands. Solar Energy 2013, 94, 128–144. [Google Scholar] [CrossRef]
- Lopes, A.; Alves, E.; Alcoforado, M.J.; Machete, R. Lisbon urban heat island updated: New highlights about the relationships between thermal patterns and wind regimes. Adv. Meteorol. 2013, 2013, 487695. [Google Scholar] [CrossRef]
- Giannaros, T.M.; Melas, D. Study of the urban heat island in a coastal Mediterranean City: The case study of Thessaloniki, Greece. Atmos. Res. 2012, 118, 103–120. [Google Scholar] [CrossRef]
- Haashemi, S.; Weng, Q.; Darbishi, A.; Alavipanah, S.K. Seasonal variations of the surface urban heat island in a semi-arid city. Remote Sens. 2016, 8, 352. [Google Scholar] [CrossRef]
- Peng, J.; Ma, J.; Liu, Q.; Liu, Y.; Hu, Y.; Li, Y.; Yue, Y. Spatial-temporal change of land surface temperature across 285 cities in China: An urban-rural contrast perspective. Sci. Total Environ. 2018, 635, 487–497. [Google Scholar] [CrossRef] [PubMed]
- Anjos, M.; Lopes, A. Urban Heat Island and Park Cool Island Intensities in the Coastal City of Aracaju, North-Eastern Brazil. Sustainability 2017, 9, 1379. [Google Scholar] [CrossRef]
- Bowler, D.E.; Buyung-Ali, L.; Knight, T.M.; Pullin, A.S. Urban greening to cool towns and cities: A systematic review of the empirical evidence. Landsc. Urban Plan. 2010, 97, 147–155. [Google Scholar] [CrossRef]
- Feyisa, G.L.; Dons, K.; Meilby, H. Efficiency of parks in mitigating urban heat island effect: An example from Addis Ababa. Landsc. Urban Plan. 2014, 123, 87–95. [Google Scholar] [CrossRef]
- Saaroni, H.; Amorim, J.H.; Hiemstra, J.A.; Pearlmutter, D. Urban Green Infrastructure as a tool for urban heat mitigation: Survey of research methodologies and findings across different climatic regions. Urban Clim. 2018, 24, 94–110. [Google Scholar] [CrossRef]
- Tan, J.; Zheng, Y.; Tang, X.; Guo, C.; Li, L.; Song, G.; Zhen, X.; Yuan, D.; Kalkstein, A.J.; Li, F.; et al. The urban heat island and its impact on heat waves and human health in Shanghai. Int. J. Biometeorol. 2010, 54, 75–84. [Google Scholar] [CrossRef] [PubMed]
- Shahmohamadi, P.; Che-Ani, A.I.; Etessam, I.; Maulud, K.N.A.; Tawil, N.M. Healthy environment: The need to mitigate urban heat island effects on human health. Procedia Eng. 2011, 20, 61–70. [Google Scholar] [CrossRef]
- Gabriel, K.M.A.; Endlicher, W.R. Urban and rural mortality rates during heat waves in Berlin and Brandenburg, Germany. Environ. Pollut. 2011, 159, 2044–2050. [Google Scholar] [CrossRef] [PubMed]
- Lin, P.; Lau, S.S.Y.; Qin, H.; Gou, Z. Effects of urban planning indicators on urban heat island: A case study of pocket parks in high-rise high-density environment. Landsc. Urban Plan. 2017, 168, 48–60. [Google Scholar] [CrossRef]
- Per, J. Vegetation as an urban climate control in the subtropical city of Gaborone, Botswana. Int. J. Climatol. 2004, 24, 1307–1322. [Google Scholar] [CrossRef]
- Lee, S.-H.; Baik, J.-J. Statistical and dynamical characteristics of the urban heat island intensity in Seoul. Theor. Appl. Climatol. 2010, 100, 227–237. [Google Scholar] [CrossRef]


© 2018 by the authors. Licensee MDPI, Basel, Switzerland. This article is an open access article distributed under the terms and conditions of the Creative Commons Attribution (CC BY) license (http://creativecommons.org/licenses/by/4.0/).