Article

Leftover Spaces for the Mitigation of Urban Overheating in Municipal Beirut

1
Department of Natural Sciences, Lebanese American University, Beirut 13-5053, Lebanon
2
Department of Architecture and Design, Lebanese American University, Beirut 13-5053, Lebanon
3
Engineering Department, University of Roma TRE, Via della Vasca Navale 79, 00146 Rome, Italy
4
Agenzia Nazionale per le Nuove Tecnologie, L’energia e lo Sviluppo Economico Sostensibile (ENEA), Via Anguillarese 301, 00123 Rome, Italy
*
Authors to whom correspondence should be addressed.
Climate 2018, 6(3), 68; https://doi.org/10.3390/cli6030068
Submission received: 8 July 2018 / Revised: 15 August 2018 / Accepted: 16 August 2018 / Published: 21 August 2018

Abstract

:
The Urban Heat Island phenomenon and urban overheating are serious consequences of urbanization resulting in impacts on thermal comfort levels, heat stress and even mortality. This paper builds on previous findings on the topic of non-constructible parcels, small vacant or built spaces in Municipal Beirut, some of which belong to the municipality while others are privately owned and which might be used for different functional purposes. This paper further examines the possibility of implementing cool surface or paving materials and urban vegetation to reduce air urban temperature, especially during the summer period and with the view to project the positive findings of this case study to the entire Municipal Beirut area. A numerical analysis using ENVI-met 4.0 investigates the thermal performance of these non-constructibles further to implementation of high reflective surfaces and urban vegetation on a broad neighborhood scale, taking the Bachoura District as a reference case for a typical summer day. The best air temperature reductions correspond to the use of cool material in areas that are far from buildings where there are no shadow effects. In some cases, the introduction of trees leads to an increase of the air temperature near the ground because they became an obstacle of the natural ventilation. Results show a maximum mitigation effect with the use of cool materials that lead to reductions in air temperatures up to 0.42 °C if used alone and up to 0.77 °C if used in combination with trees. Within the framework of an integrated approach to planning, this form of urban intervention aims for substantial overheating reduction.

1. Introduction

Today, 54% of the world’s population lives in urban areas, a proportion that is expected to increase to 66% by 2050 [1]. With increasing urbanization trends, where natural surfaces are replaced by impermeable surfaces, stresses on the surrounding urban temperatures are escalating. This urban warming, or urban heat island (UHI), is the increase of urban temperatures with respect to surrounding rural areas and has a strong impact on thermal comfort levels, energy performance of buildings and health [2]. With global warming, associated to climate changes and increasing summer heat waves, the potential means by which the consequences of the UHI and urban overheating can be adapted to and mitigated to build more resilient cities is a topic of much research and discussion worldwide. In fact, counterbalancing the effects of urban heat island is a major priority for the scientific community [3,4,5,6].
Starting from as early as 1818 when Luke Howard, a chemist turned meteorologist, published his first documentation on the “Climate of London,” many studies have been carried out to detect and assess UHI and today there is an impressive amount of data throughout the world [7,8,9,10]. The scientific community produced many studies aiming at assessing the mitigation potentials of technologies and strategies to minimize urban heating. While several technologies and strategies exist for the cooling of urban temperatures, the two major solutions to pursue urban heating are cool materials and urban greenery [11,12,13,14,15,16,17,18] and some of the available literature on these topics is described further below.
Vegetation has been studied in urban climates [19] in order to reduce the urban heat island effect. This type of mitigation technique cools the environment through a higher albedo (typically 0.18–0.22) compared to common pavements such as asphalt (typically 0.05–0.15) [20,21,22,23,24] and by evapotranspiration [25]. An experimental and numerical analysis was developed by Srivanit and Hokao [26] at an institutional campus in the subtropical-humid climate of Saga, Japan. In this work, the average daily maximum temperature decreased by 2.7 °C when the quantity of the trees was increased by 20% in the campus area. In addition, in another study carried out in the city of Lisbon by Oliveira, Andrade and Vaz [27], the thermal performance of a small green space (0.24 ha) and its influence on the surrounding environment of a densely urbanized area, was conducted. Results showed that the garden was cooler than the surrounding areas, either in the sun or in the shade, by up to 6.9 °C of air temperature.
Cool materials are characterized by a high solar reflectance or albedo (α) to the short-wave radiation and a high emissivity (ε) to the long-wave radiation [28]. These materials can be used on building surfaces or on urban pavements in order to reduce the surface temperature. Synnefa et al. in 2008 [29] carried out a numerical study on large areas of Athens, Greece, in order to simulate the impacts of cool materials on the urban heat island effect. It was found that large-scale increases in albedo could lower ambient air temperatures by 2 °C.
There is a strong correlation between albedo increase and drops in average and maximum temperature. Santamouris, in 2014, estimated a decrease of the average and maximum air temperatures close to 0.27 °C and 0.78 °C per 10% increase of the albedo.
In the last few years, the use of ENVI-met tool for the analysis of urban heat island phenomenon has been growing (Section 3). In particular, numerous studies have been conducted to assess the impact of urban vegetation on microclimatic conditions [30,31,32,33]. In Hong Kong, Morakinyo and Lam [34] simulated the impact of different configurations of trees in an urban canyon; changing the aspect ratio, leaf area index (LAI), leaf area density (LAD) distribution and trunk height under different wind conditions. Wang and Zacharias [35] studied possible interventions of urban requalification in Beijing (China) estimating a decrease in the air temperature of about 0.5–1 °C due to the substitution of roads with urban greening and permeable soils. In 2015, Amor et.al [36] carried out a numerical analysis by using the ENVI-met tool in order to determine the impact of vegetation, ponds and fountains in a square of the Algerian city of Setif. Other researchers have been more focused on the evaluation of the effect of cool materials using the ENVI-met tool [37,38,39,40]. In 2015, Sodoudi [41] conducted a study to assess the effectiveness of three UHI mitigation strategies, such as high albedo materials, greenery on the surface and on the roofs, and a combination of these strategies in the city of Tehran. Wang and Akbari in 2015 [42] developed the “thermal radiative power” (TRP) parameter to investigate the impact of building surface material albedo on urban environment in the central city of Montreal.
Municipal Beirut, with approximately 21,000 inhabitants/km2 [43,44] is a densely populated city, while covering a relatively small surface area of about 20km2. Concerning the weather conditions, Beirut is classified as a hot-dry summer Mediterranean Climate, “Csa” class, according to the Köppen-Geiger system. No relevant studies exist on the UHI intensity (UHII) in Beirut, however some quantification can be derived from data acquired by the weather stations in and around the city and the Beirut International Airport. Data from the Fanar weather station, situated a little outside the city (Section 3), includes daily minimum, maximum and average air temperatures. Based on data from this weather station from the year 2011 which consists of the most uninterrupted and therefore continuous data, it is estimated that the maximum UHII has reached 4.56 °C considering the daily maximum air temperature difference and a value of 1.68 °C considering the daily average one.
The major master plans for Beirut were subject to several updates throughout their history, such as the Danger Brothers Scheme in 1932 and the Ecochard schemes in 1943 and 1964, and combined with an outdated laws and regulations system that manages urban operations, have enriched the urban fabric of Municipal Beirut with a non-negligible number of non-constructible parcels (NCs) [45]. These are leftover spaces found in the shape of small vacant or built spaces in between buildings or around corners and belonging to the municipality, which might be used for social purposes. Since 1954, with the introduction of Article 5 of the decree n° 6285/54, Lebanon’s Construction’s Law has acknowledged and defined non-constructible surfaces as such: (a) residue of an old road after a new alignment and (b) result of land consolidation or left-over spaces after planning. Moreover, Article 5, does not allow construction on narrow parts of parcels for three main reasons: (a) the intent of visual clearance on street corners and intersections; (b) to manage parcel densification; and (c) to avoid transferring its odd forms into the volumetric of the buildings [46].
The surface areas of these NCs do not exceed 250 m2, depending on the zone they belong to and according to the zoning scheme introduced in 1973 by decree nº 5550, which divides Beirut into 10 zones. As for their current land uses, they have various current temporary land uses such as parking lots for neighboring buildings, vacant plots, dumpsters, brown land, right-of-ways and so on. Some of them are illegally built and as for the un-built ones, they are rapidly being consolidated with larger adjacent plots by developers who are seeking more space for their projects. Previous research has shown that unfiltered results for non-constructible parcels within Municipal Beirut add up to 6039.
Upon comparing these findings to previous Town Energy Balance (TEB) single layer urban canopy model [47] simulations for Municipal Beirut [48,49], it was found that Zones 3 and 4 of the city had the highest urban warming results, as well as the highest number of NCs, amongst which Bachoura District is situated. As such, Bachoura District was selected as a case study area for the purpose of this paper to be replicated for future similar analyses within Municipal Beirut.

2. Objective and Methods

The objective of this paper is to explore the potential of NCs to reduce urban air temperatures through the case study of the Bachoura District, preparing grounds for future implementation projects on selected NCs throughout Municipal Beirut at a larger scale. This approach is an innovative one within the context of Municipal Beirut, where no thermal mitigation strategies were experienced in the past. The integration of technical and policy aspects to pursue urban mitigation will be also discussed further in this paper.
To achieve the research objective, the study was carried out according to the following procedure:
  • Identification and characterization of the case study: this part includes the identification of the main characteristics, including the thermal and solar properties, of the selected district, next transferred on an information model, to carry out successive analyses;
  • Identification of mitigation strategies and technologies to be implemented: this part includes the description technologies and strategies, selected to perform mitigation analyses.
  • Assessment of mitigation potentials through numerical analyses: this part, implemented in Section 3, includes the calculation, modeling and simulation work carried out to quantify the impact of selected solutions on relevant urban thermal indicators using the software ENVI-met 4.0.
  • Derive policy approaches as a consequence of technical results, taking into account potentials and limitations of the latter.

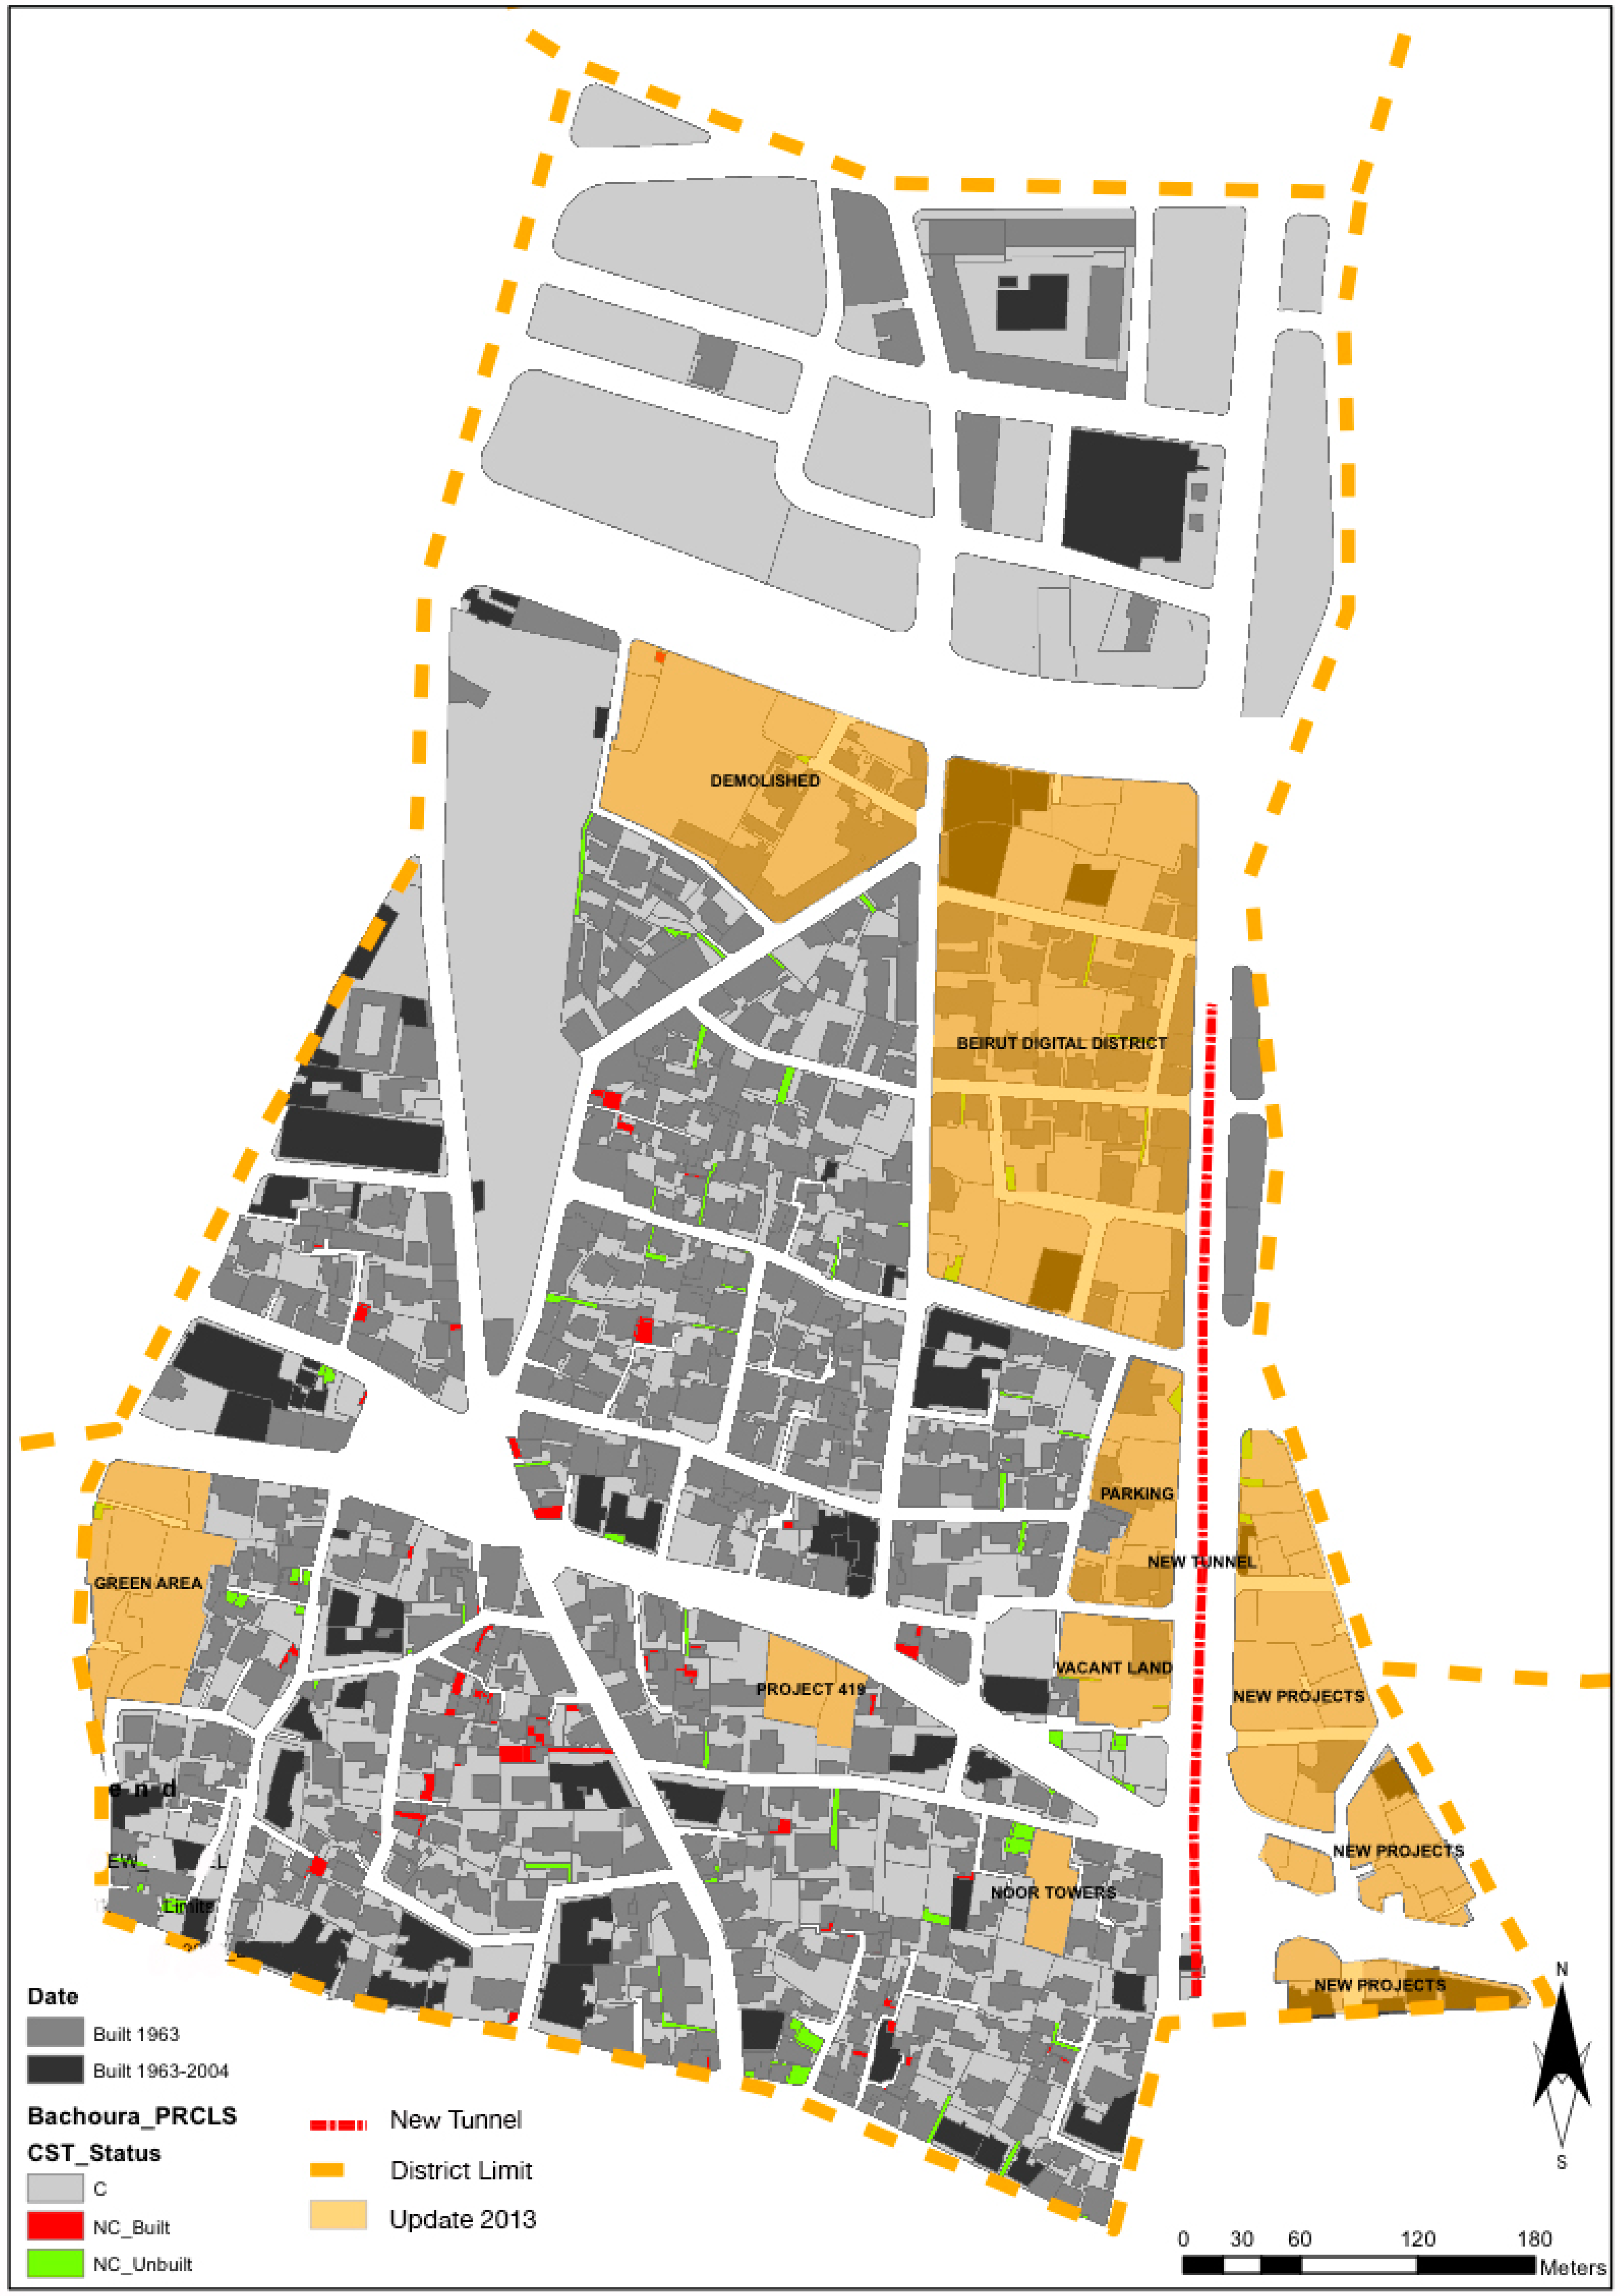
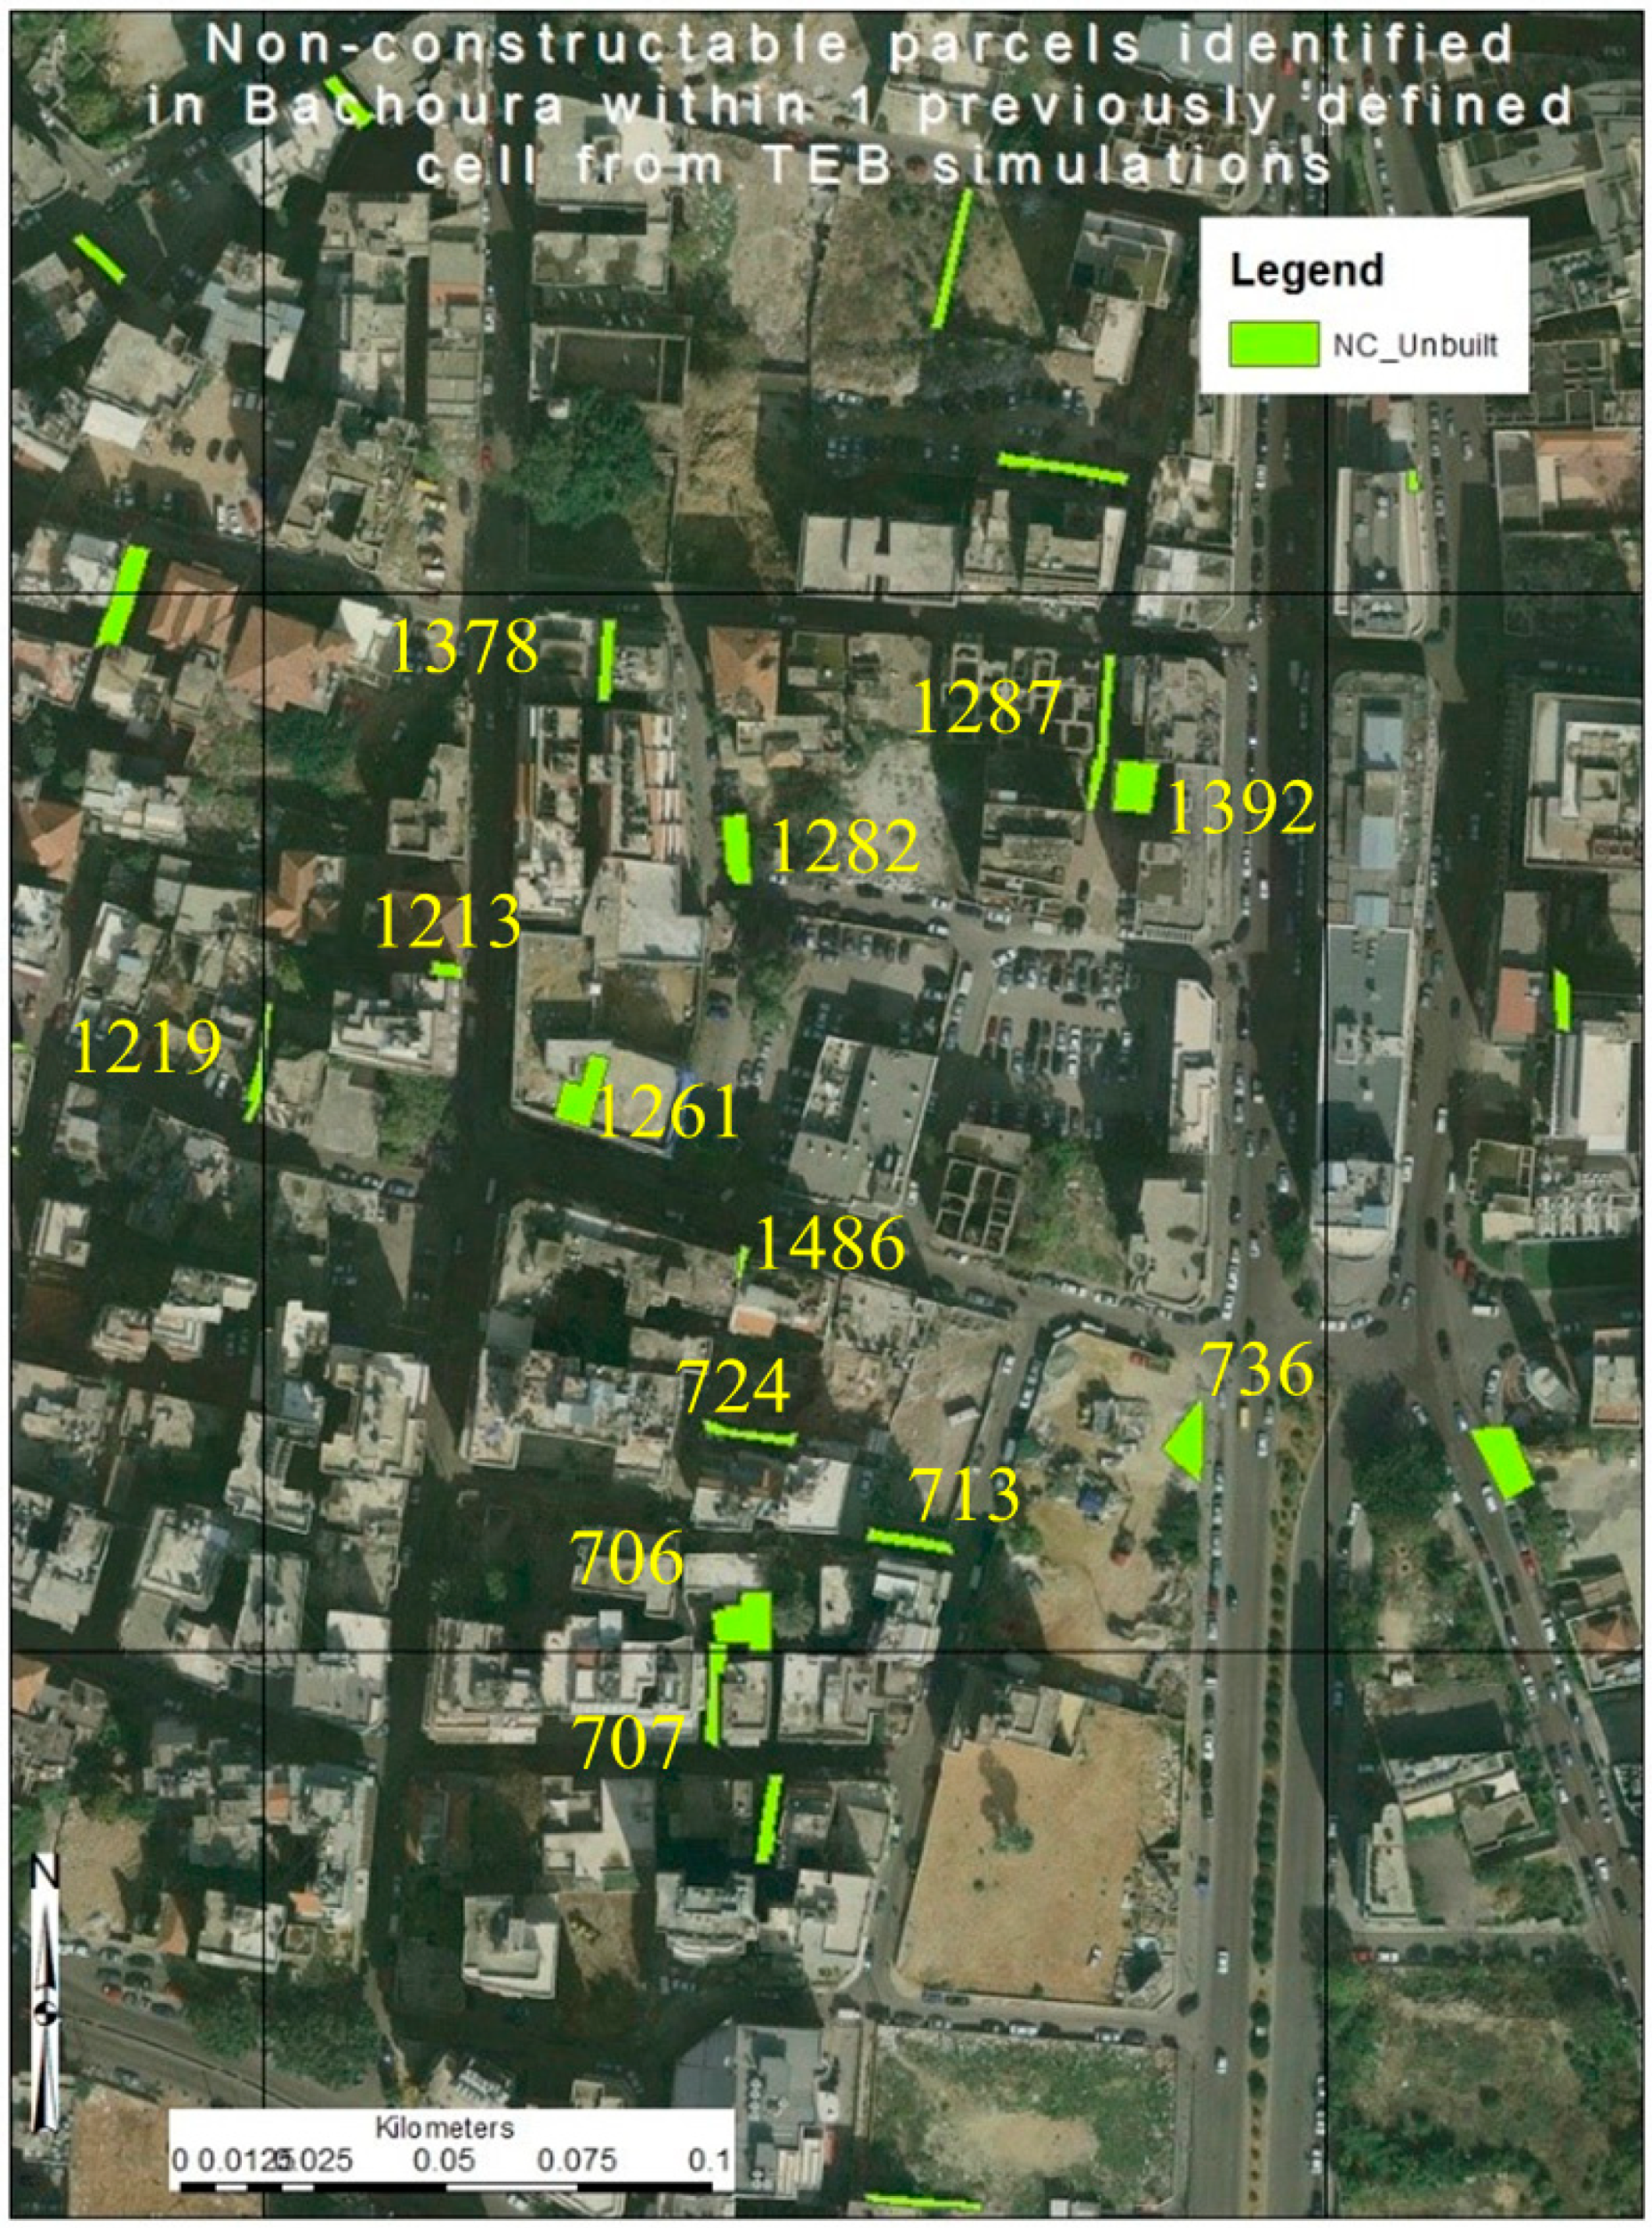
2.1. The Case Study Zone: Bachoura District

The selected district is one of the most affected by urban overheating, thus suitable for the presented study. Previous research (Figure 1) has shown that Bachoura District holds a total 197 NC parcels. Further studies have highlighted the exploitable parcels for the purpose of this paper, which are the vacant lands (VL) and right of ways (ROW). Vacant lands are the un-built lands of various uses such as brown land, junkyards or dumpsites, gardens, entrances for buildings, support for neighborhood generator or parking lots. Right of way are the un-built passages and movement corridors that lead to the inside of blocks. It was surveyed [50] that Bachoura holds 1307 m2 of VL and 1525 m2 of ROWs.

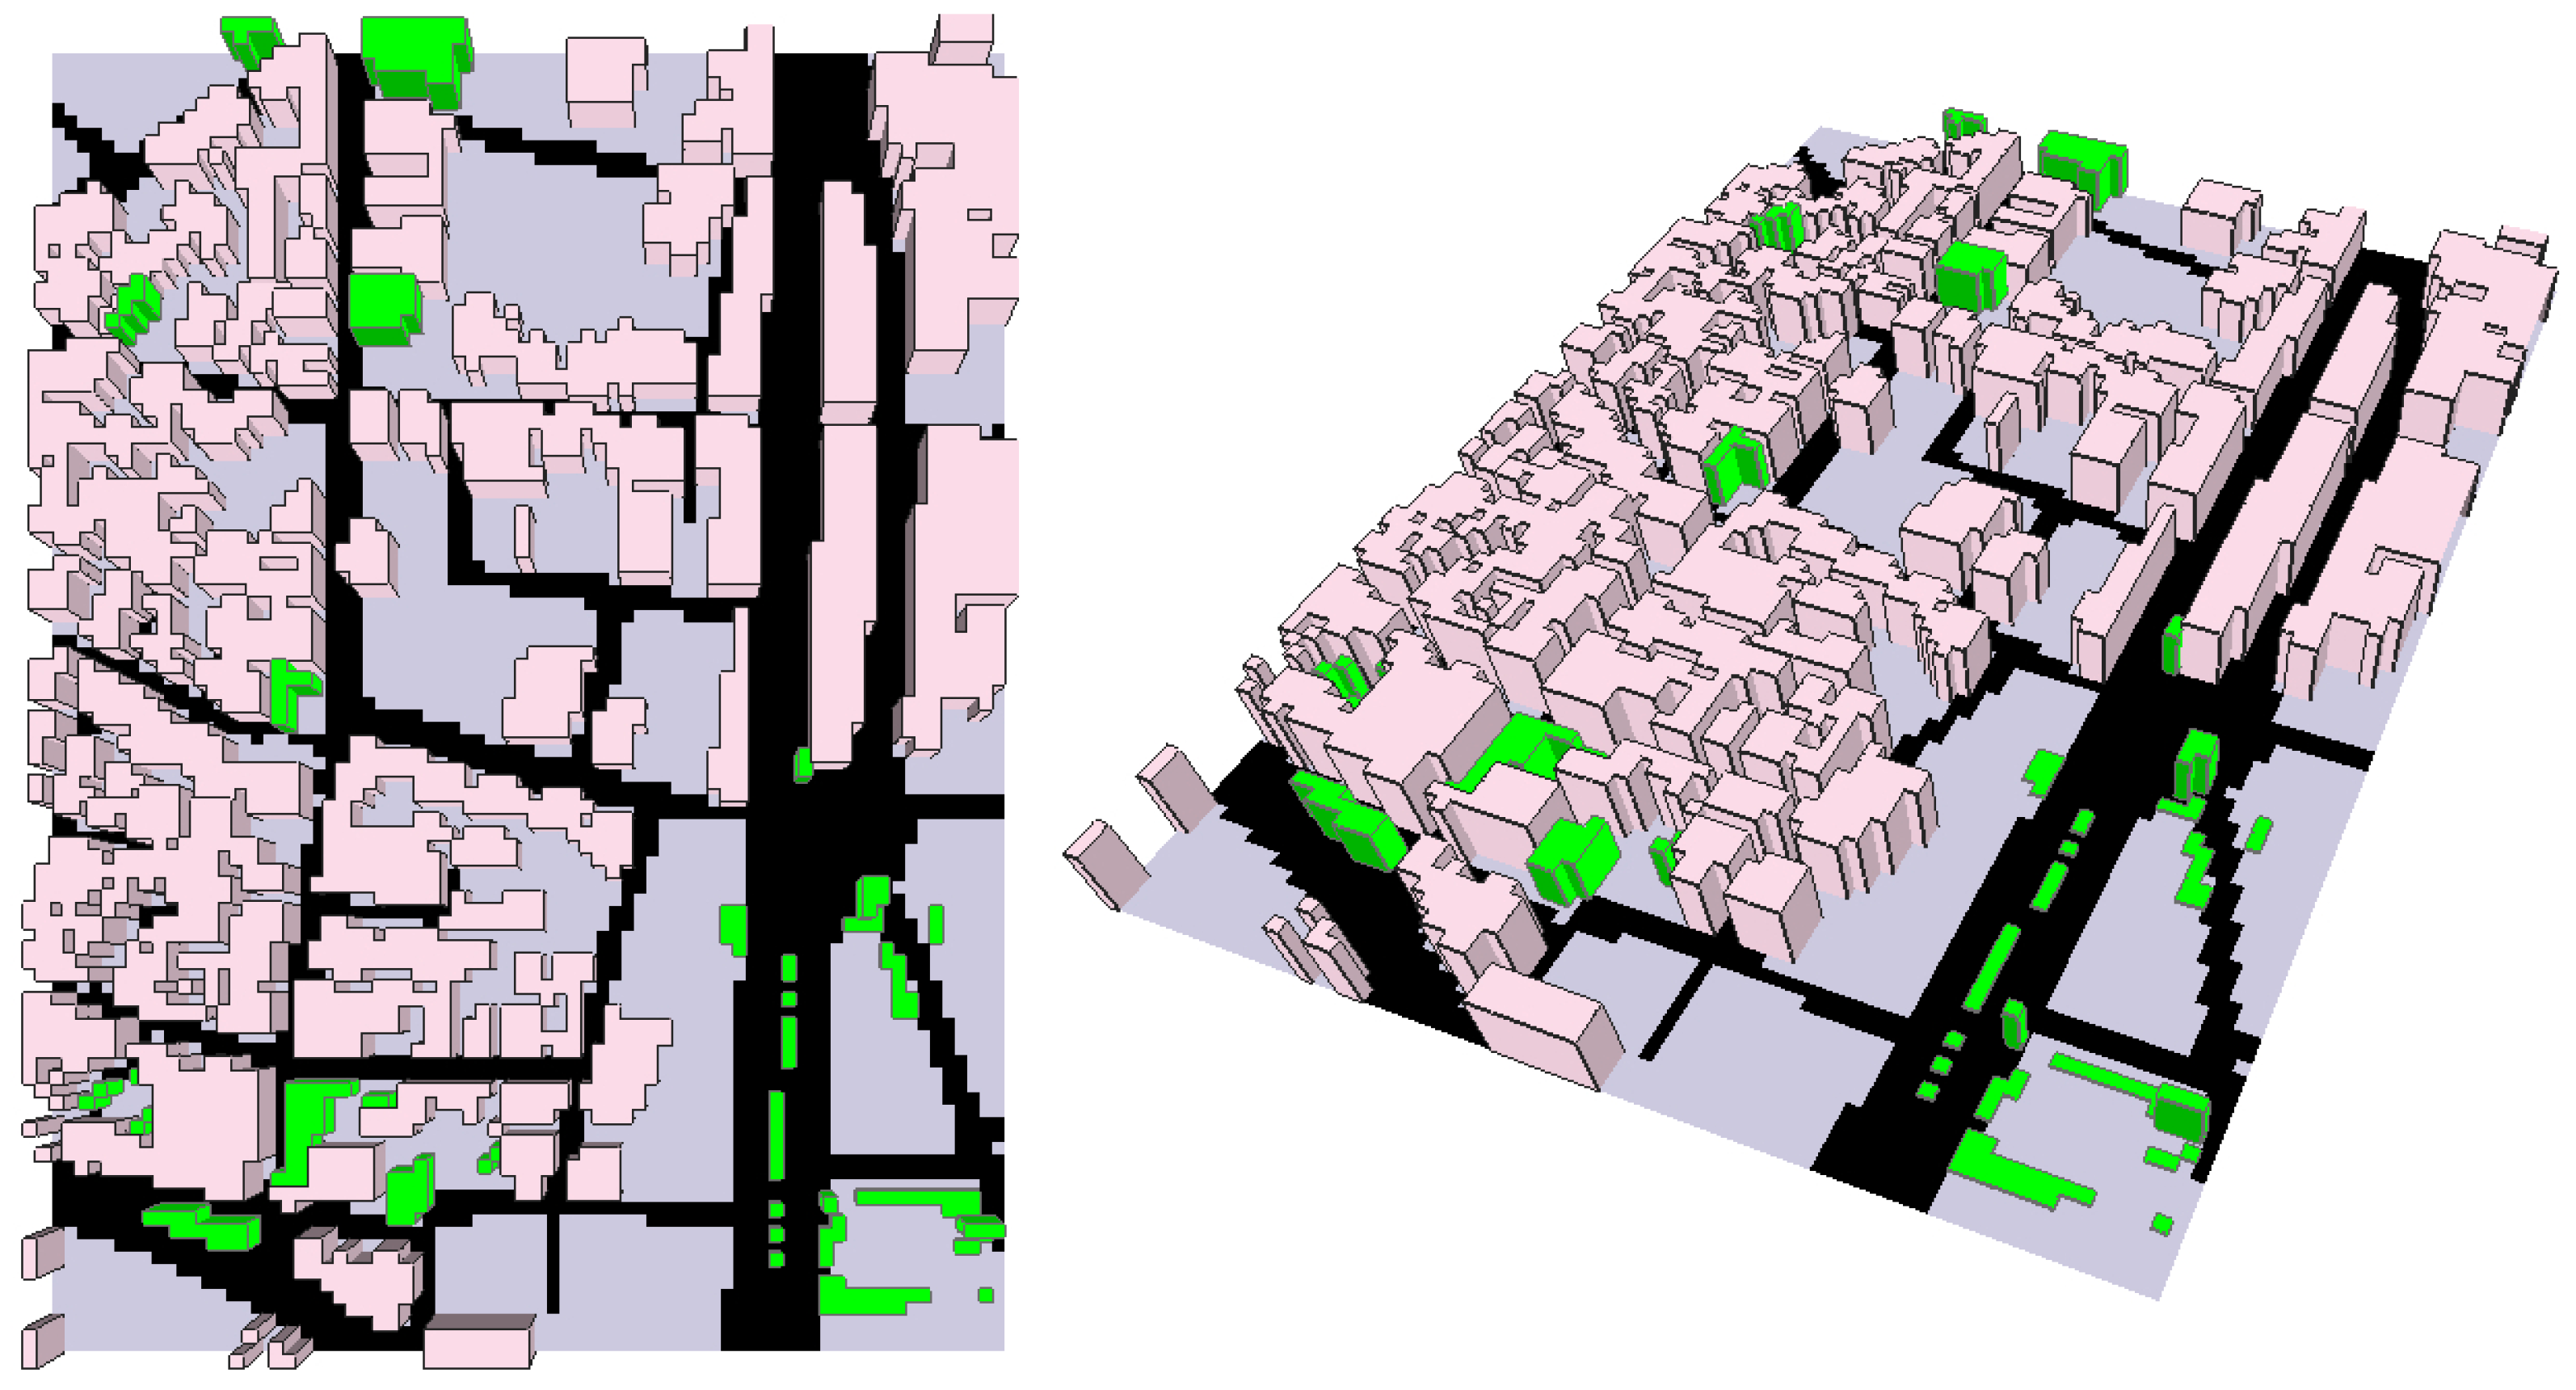
2.2. Transferring Geometrical and Construction Properties on an Information Model

Data from previous findings for NCs, as well as the thermal properties of dominating urban surfaces, were combined and updated using the Geographic Information System software (ArcGIS) [51]. This systematic integration of the main features of the urban fabrics has a double value: it helps the simulation and calculation work carried out in this study and, in a broader perspective, it helps to develop an informational database that can be used by Municipal Beirut as an instrument to plan mitigation measures in the future.
All the NCs were characterized in detail in the information system; each of these NCs include the following information:
  • Identification code and reference district;
  • Surface;
  • Nature of the area (e.g., vacant, park, etc.);
  • Age of the neighborhood;
  • Average albedo of walls of the dominating building group;
  • Average emissivity of walls of the dominating building group;
  • Average albedo of roofs of the dominating building group;
  • Average emissivity of roofs of the dominating building group;
  • Average albedo of roads;
  • Average emissivity of roads;
  • Town cover fraction of buildings;
  • Town cover fraction of green areas;
  • Town cover fraction of roads
The observation of non-constructible parcels shows that they are primarily impermeable surfaces, roads and buildings account for the majority of the town covers surrounding the identified NCs, while gardens, which include predominantly high vegetation such as scattered urban trees or low vegetation like grass or bushes, account for the lowest town cover fraction thus emphasizing the deficiency of these important urban cooling spaces within the city. For example, in an identified Bachoura neighborhood covering a surface area of 200 × 200 m, it was calculated that the building fraction was 0.48, the garden fraction 0.14 and road fraction 0.38 and this is typical throughout Bachoura and indeed the city which is a predominantly artificial city. Dominating roof surfaces, comprised primarily of grey concrete roof slabs, have a very low albedo (α) of 0.23 as adapted from Oke 1987. Moreover, road surfaces with topmost layer comprised of asphalt, also have a low α of 0.1–0.2. It has to be noted that the albedo values for the purpose of this paper are adapted from Oke, 1987 as they are typically reference points in the available literature. The emissivity (ε) of these non-metallic materials is assumed to be 0.9.
The non-constructible parcels defined as vacant land, brownfields or dumpsters were selected for investigation. Figure 2 therefore shows the selected NCs within a previously defined TEB grid cell within the district of Bachoura.

2.3. Selection and Characterization of the Mitigation Strategies

This paper addresses two potential solutions, which are among the most used for mitigation purposes, due to their performances, reliability and economic feasibility.
Cool materials are the first solution, tailored for the different NCs of the district. Table 1 defines the characteristics of these NCs with proposed types of light-colored materials or reflective coatings and their respective albedos that can be used in this regard within the context of Municipal Beirut [52,53].
Concerning the urban greenery, the type of urban trees proposed for UHI mitigation is the ficus nitida species, which is commonly found and planted decoratively throughout municipal Beirut. For the purpose of this paper, ficus nitida is considered to have a total height of 10 m, a trunk height of 5 m and a leaf area index (LAI) of 4, the latter quantity defined as the ration of one-sided green leaf area per unit ground surface area, both expressed in square meters.
The total surface area of the above-listed NCs in the identified TEB grid is 634 m2 thus comprising approximately 1.6% of the total TEB grid area of 40,000 m2. The selected mitigation strategies are applied in this area, individually and in combination.

3. Calculation

The simulation was carried out with ENVI-met 4.0 which is a transient tool able to recreate urban 3D models based on a soil-vegetation-atmosphere transfer scheme realized with deterministic equations that couple thermal and fluid-dynamics processes [54]. This software is widely used in the scientific community to assess thermal conditions in the urban environment and the impact of mitigation strategies and technologies, as addressed in the introduction. The main indicator to assess the mitigation potential is the air temperature.

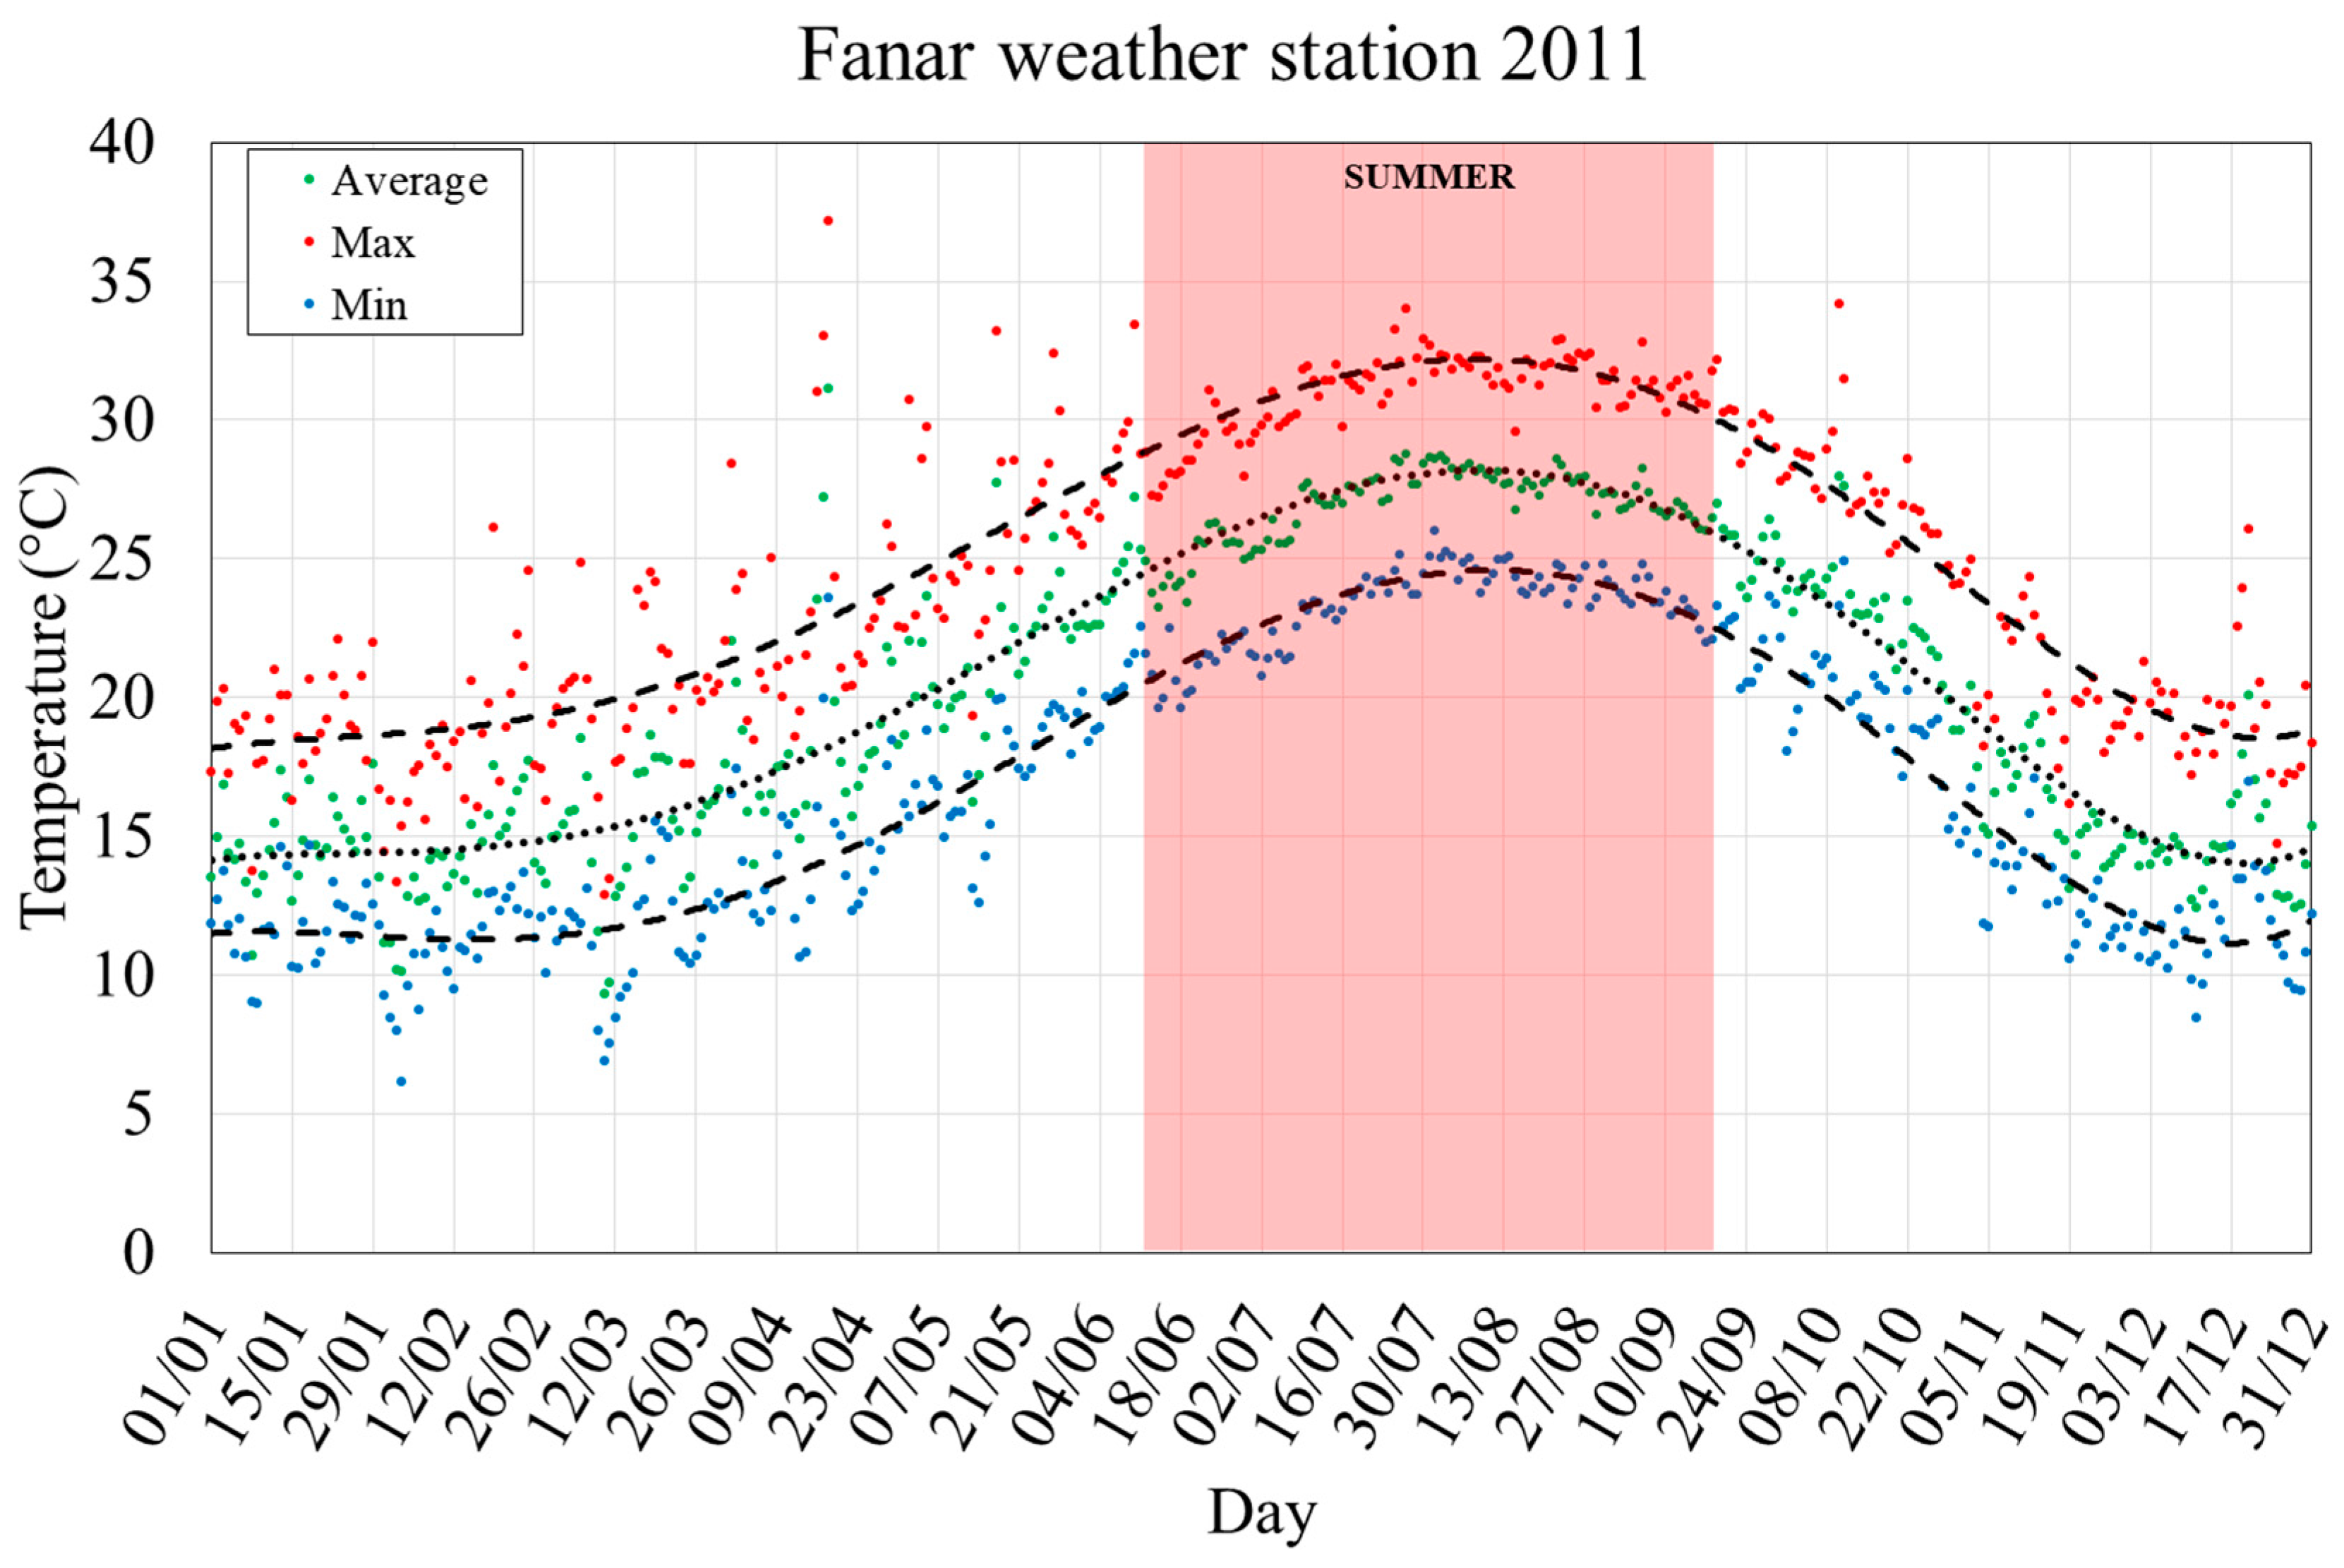
3.1. Implementation of the Numerical Model in ENVI-Met 4.0

The target area taken into account is the Bachoura District, the implementation of which in ENVI_met is presented in Figure 3, covering a surface area of approximately 130,000 m2. It is to be noted that this latter surface area represents the domain area as presented in Figure 2, which is used for the purpose of this paper and which is less than the area of the previously mentioned TEB grid cells (40,000 m2) from which dominating urban morphological characteristics have been used for the purpose of this study. The selected NCs account for approximately 0.5% (650 m2) of this chosen domain (Figure 2). The three-dimensional model recreates the distribution of structures, pavements and vegetation and it is composed by a mesh of 77 × 105 × 25 square cells. Each cell has a dimension of 4(x) × 4(y) × 2(z) meters.

3.2. Model Calibration
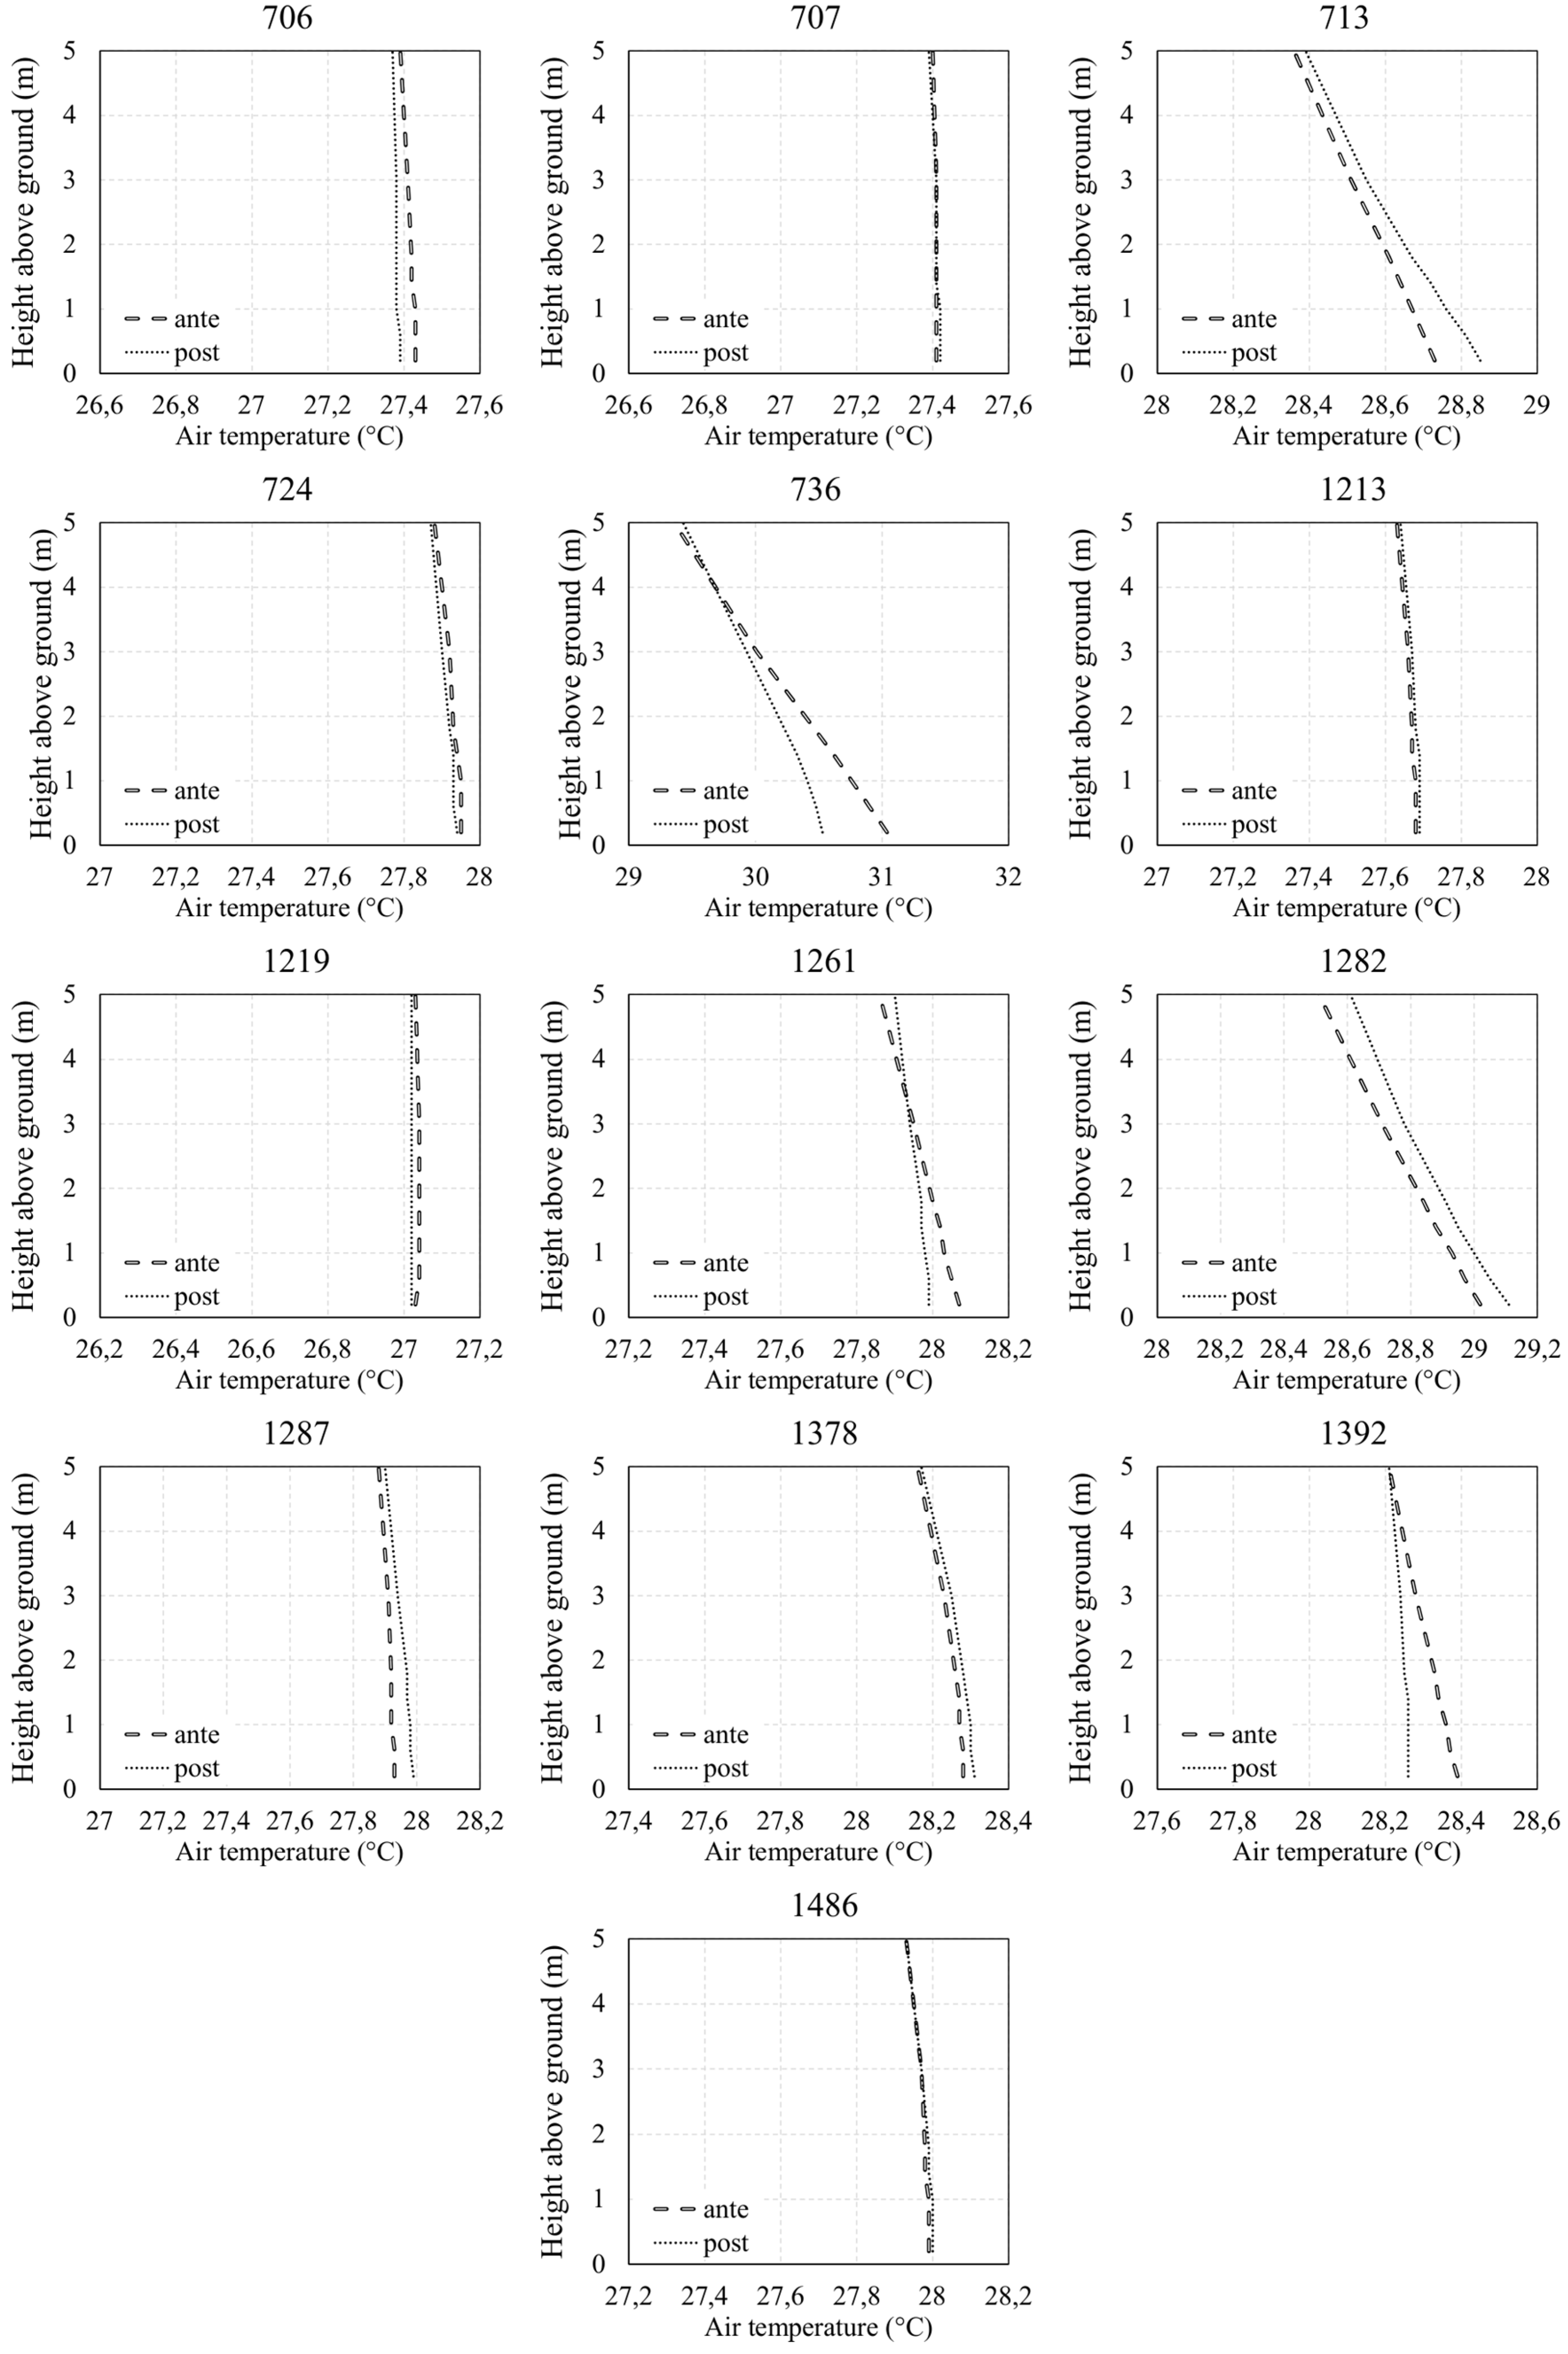
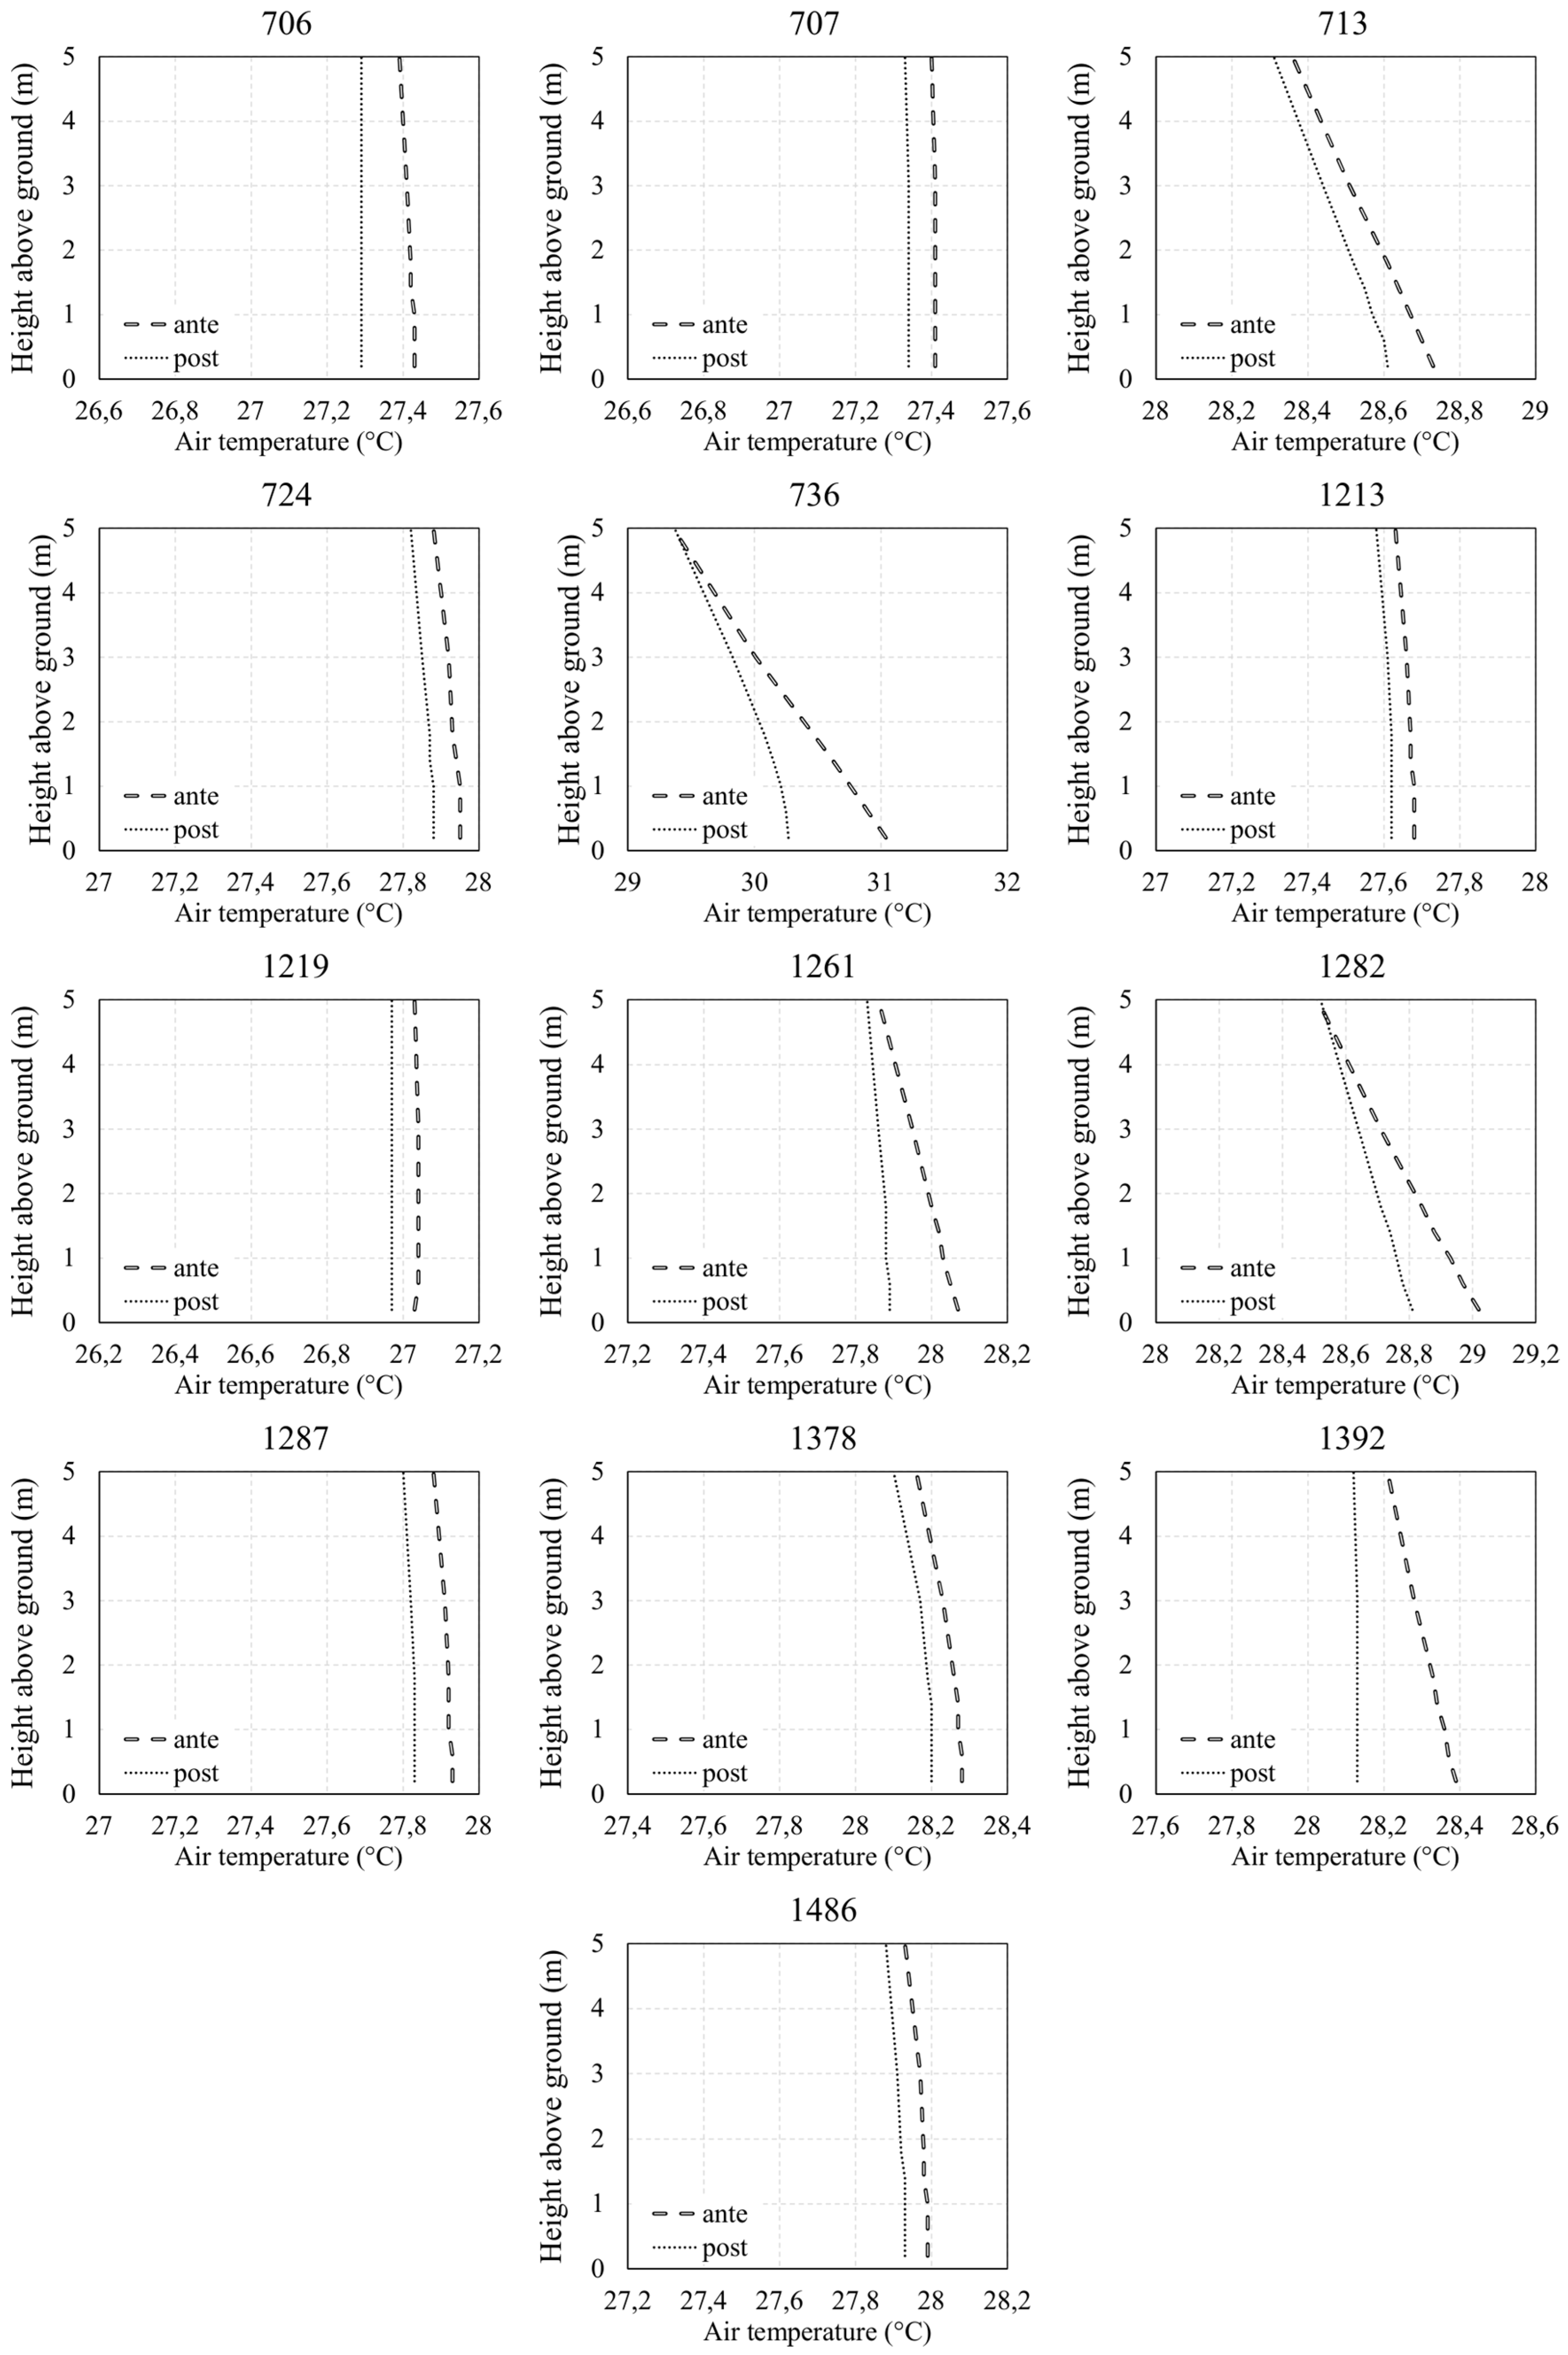
The thermal conditions inside the Bachoura District are simulated on a typical summer day in Beirut. For this reason, a Beirut weather station situated in Fanar (placed at 1.8 m above the ground) was selected as representative of the mean air temperature condition in Beirut in 2011. The Fanar station is located at approximately 3.5 km to the east of Beirut at Latitude 33°53′02.8′′ N and Longitude 35°33′08.3′′ E at an elevation of 90m ASL, in a medium density urban area. This station, which is operated by the Lebanese Institute for Agricultural Research (LARI), started its operation in 2009 and continues to present day. Records were collected and accordingly compiled from this station, for the numerical analysis of this research. The minimum, maximum and average air temperature in the summer of 2011 are shown in Figure 4.
The weather boundary conditions were imposed as the average data for a typical summer day as follow: wind speed of 1.24 m/s, wind direction of 142° (south-east wind) and relative humidity of 68%.
In order to calibrate the numerical model, a comparison was carried out between the maximum air temperature recorded at 1.8 m above the ground in the entire numerical domain and the maximum air temperature of 31.2 °C measured by the Fanar weather station in the summer of 2011. In order to reduce the error, the initial air potential temperature was varied at 2500 m. It has to be clearly stated that the calibration work is strictly dependent on the measured data, which in this case were not sufficiently disaggregated to carry out more detailed analyses.
The initial potential air temperature of 20 °C lead to a minimum error of +0.1% between the measured and the model-predicted maximum air temperature.

4. Results

Simulation results are presented in Figure 5, Figure 6 and Figure 7, where the air temperature variations versus the height from the ground is plotted in order to compare the current situation with the mitigation solutions. The air temperature variations on the X-axes are varied in the graphs so that the temperature differences between the represented configurations can be clearly inferred. The curves are plotted from 0 to 5 m above the ground, since after that value the impact of the proposed solution is not significant; more over the selected height is relevant because of the interaction between the ambient temperature and both, buildings and pedestrians.
Table 2 presents the maximum air temperature reductions for the selected zones, to be noted that this peak is reached always at 2 pm in all cases. To be noted that urban greenery was placed only in 6 out of the 13 NCs listed in Table 1, since it was deemed preferable to place the trees in large spaces like parking lots; as such, right of ways were excluded from the simulations.
Figure 5 shows the air temperature variation before and after with the introduction of cool materials listed in Table 1. It is worth noting that in all the NCs the introduction of cool material leads to a decrease of the air temperature along 5 m above the ground. The maximum effects are more relevant near the ground. This effect leads to a decrease of the air temperature from 0.04 for the NC 1486 to 0.42 for the NC 736. The marble material leads to a maximum air temperature decrease from 0.04 for the NC 1486 to 0.11 for the NC 713. Furthermore, the white alkyd chlorine rubber coating lead to a maximum air temperature decrease from 0.09 for the NC 706 to 0.23 for the NC 1282. Finally, the white acrylic latex leads to a maximum air temperature decrease from 0.05 for the NC 707 to 0.42 for the NC 736.
Figure 6 shows the altitude air temperature variations before and after the introduction of trees in the NCs number 706, 736, 1261, 1282, 1378 and 1392. Relevant effects are recorded in the NCs number 736, 1261 and 1392 where it is worth to notice that the decrease of the air temperature is higher near the ground and lower at an altitude ranging from 3 to 4 m.
Figure 7 shows the altitude air temperature variations before and after the introduction with the introduction of cool materials and the trees implemented in the cases of Figure 6. The combining effects are evident in the NCs number 736, 1261, 1282 and 1392 where the decrease of the air temperature is from 0.18 to 0.77 especially in the levels near the ground.
The best air temperature reduction effects are found in the NC number 736 because this is located relatively far from buildings with no shadow effects. On the other hand, NC 1282 with trees showed an increase in simulation results. The reason could be that in this particular area, the trees became an obstacle of the natural ventilation (see Section 5 Discussions). Overall however, the maximum mitigation effects are seen with the use of cool materials.

5. Discussion

Based on the simulation results therefore, the selected mitigation strategies showed that in open areas, where the effect of surrounding buildings is limited, temperature reduction close to 1°C might be reached, however in most cases the mitigation potential appears of limited or null impact in our analysis, when compared with similar studies. This mainly depends on the following factors:
  • It was outlined in the previous sections that NC areas in which it was possible to implement the selected solutions were small compared to the district size, by about 1%. In these conditions, the air temperature reduction is limited.
  • The urban texture in the selected district is very dense and mainly characterized by high building height to street width ratios; thus, narrow parcels can be easily shaded by surrounding buildings. Under these conditions, direct benefits of cool materials and urban greenery decrease when compared to those detectable in strongly irradiated open urban areas.
  • Using trees showed positive as well as negative UHI effects. The reason for this could be that trees could obstruct summer breezes if not strategically placed thus having the reverse desired effect [55]. In fact, trees create perturbation of the thermo fluid-dynamic conditions because they are an obstacle to the natural ventilation, which can accordingly cause a variation of the micro-climate near the trees and in the rest of the domain. It is therefore suggested to have more in-depth knowledge of the plant species and their strategic placement within the NCs proposed as such.
Another relevant aspect of this study is that only air mitigation solutions are addressed, while pedestrian thermal comfort issues are not analyzed as this is not within the scope of this paper. It is, however, well recognized that air temperature is only one of the many physical parameters affecting the comfort conditions; air humidity and velocity, as well as solar radiation all play a crucial role within the context of thermal comfort. The latter, in particular, affects the surface temperature of urban fabrics and, thus, the longwave radiation exchanges. As an example, it was demonstrated in this paper that cool materials while able to mitigate the ambient temperature, could in fact worsen the thermal comfort conditions at the pedestrian level, due to the increase of solar radiation [56,57]. In this sense, this study can be considered a preliminary assessment to be elaborated upon by conducting further, more in-depth, analyses to assess other mitigating strategies and technologies, as well as the impact on the thermal comfort conditions of users.
However, it has to be noted that this study acts on two levels, technical and policy one, where the results achieved in the former acts as a lever for the latter ones. To successfully intervene on such lands of Municipal Beirut and to develop a pilot project based on these findings, different types of strategies could be developed, where technical and policy issues converge to promote solution for urban regeneration. One strategy is a user driven tactical strategy where UH mitigation programs are applied as part of a long-term vision for regeneration and implemented with adequate resources such as the NDSM project in Amsterdam [58] and The High Line Project in New York [59].
Another tactical strategy would be based on the idea of “best practice approach” [60] where local temporary projects are taken as a model for broader policy-making and subsequent implementation. This type of strategy usually uses intermediary agents to find short and medium-term uses for vacant land, disused, or awaiting redevelopment land. In this strategy, applied in the Meanwhile London Project, temporary uses, should they succeed, could become permanent [61].
There are other strategies where temporary uses are applied in an event-like manner and where long-term vision is coupled with limited resources. These project-based strategies, such as the Leipzig plantation project [62], are very important in triggering a more sustained strategy. These event-like projects can attract potential investors and provide resources for future projects, hence move towards a strategy of the first kind. Finally, there are the strategies, where power is kept centralized and no collaboration is envisioned. This strategy does not distribute resources for the implementation of temporary uses and reveals only partial understanding of potential benefits on the authorities’ side and leave unclear the will to collaborate further.
The above-mentioned urban strategies for the implementation of urban heating mitigation programs on residual parcels differ in their approaches, they all share the same understanding of the potential of mitigation programs as a catalyst for the regeneration of the city. Whether long or short-term strategies were envisioned; resources were or were not available; leaders were local authorities or intermediary agents; or developments were user driven pushing for collaboration or centralized, they all shared a bottom-up strategy starting with the understanding of user’s needs and the acknowledgment of the potential of residual spaces/urban heating mitigation.
In the case of Beirut, no specific urban strategy is modeled to integrate non-constructible parcels and implement mitigation programs. It will be important to define a strategy that embraces a long-term vision for the regeneration of the city, through the integration of these parcels and the implementation of mitigation programs. In a longer perspective, a wider area of the city should be involved in such urban regeneration measures, so to have higher mitigation potentials than those achievable operating only on NCs. By acknowledging user’s needs, finding resources and encouraging collaboration with involved actors, the developed user oriented strategy will have better chances of responding to the city’s needs rather than becoming a strategy for punctual interventions.

6. Conclusions

Within Municipal Beirut, covering a total surface area of 20 km2, approximately 300,000 m2 of non-constructible parcels have been identified. Within the context of resilient cities, there is a potential for re-naturalization of these non-constructible areas by implementation of green and cool urban design. For the purpose of this paper, numerical analyses using ENVI-met 4.0 were carried out to study the implementation of cool materials and urban trees as a sustainable strategy for reductions of the urban air temperature in Bachoura District. However, only 0.5% of the zones in the Bachoura domain were used for the purpose of this paper.
Implementation of cool design approaches showed reductions of urban air temperatures up to 0.42 °C. The introduction of trees may lead, in some cases, to an increase of the air temperature near the ground because they can obstruct natural ventilation. In an investigated area, which is far from the surrounding buildings, the maximum air temperature reduction with the implementation of combined cool materials and trees reached up to 0.77 °C. Hence, the use of mitigation strategies in small non-constructible areas can create small urban oases in which people can benefit from better thermal conditions, especially in the summer. However, this research can be further expanded to examine other mitigating solutions within a similar urban context, especially in the view to assess how such solutions could effectively influence and improve thermal comfort aspects.
This research can be considered to be a milestone for the case of Beirut, since it provides evidence of the importance of making use of not constructible areas for multiple objectives including beautification of the city, providing a ‘breathing’ space for the local communities, while building a more resilient city within the context of climate change and the urban heat island.

Author Contributions

Conceptualization, N.K. and D.A.; Formal analysis, G.B.; Investigation, G.B. and M.Z.; Methodology, N.K. and D.A., M.Z., G.B.; Project administration, N.K.; Resources, N.K., D.A., G.B. and M.Z.; Software, G.B. and M.Z.; Supervision, N.K. and M.Z.; Visualization, N.K. and D.A.; Writing—original draft, N.K., D.A. and G.B.; Writing—review & editing, N.K., D.A., G.B. and M.Z.

Funding

This research received no external funding.

Conflicts of Interest

The authors declare no conflict of interest.

References

  1. Un-habitat. State of the World’s Cities 2010/2011: Bridging the Urban Divide; Earthscan: London, UK, 2010. [Google Scholar]
  2. Rizwan, A.M.; Dennis, Y.C.L.; Liu, C. A review on the generation, determination and mitigation of Urban Heat Island. J. Environ. Sci. 2009, 20, 120–128. [Google Scholar] [CrossRef]
  3. Akbari, H. Energy Saving Potentials and Air Quality Benefits of Urban Heat Island Mitigation; Lawrence Berkeley National Lab (LBNL): Berkeley, CA, USA, 2005. [Google Scholar]
  4. Akbari, H. Rapid development of global heat island mitigation studies and countermeasures: A 30 year success story. In Proceedings of the Prepared for: The Third International Conference on Countermeasures to UHI, Venezia, Italy, 13–15 October 2014. [Google Scholar]
  5. Bozonnet, E.; Musy, M.; Calmet, I.; Rodriguez, F. Modeling methods to assess urban fluxes and heat island mitigation measures from street to city scale. Int. J. Low-Carbon Technol. 2013, 10, 62–77. [Google Scholar] [CrossRef] [Green Version]
  6. Oliveira, S.; Andrade, H.; Vaz, T. The cooling effect of green spaces as a contribution to the mitigation of urban heat: A case study in Lisbon. Build. Environ. 2011, 46, 2186–2194. [Google Scholar] [CrossRef]
  7. Santamouris, M. Using cool pavements as a mitigation strategy to fight urban heat island—A review of the actual developments. Renew. Sustain. Energy Rev. 2013, 26, 224–240. [Google Scholar] [CrossRef]
  8. Gartland, L. Heat Islands; Routledge: London, UK, 2008. [Google Scholar]
  9. Oke, T.R. Boundary Layer Climates, 2nd ed.; Methuen & Co. Ltd.: London, UK, 1987. [Google Scholar]
  10. Stewart, I.D. A systematic review and scientific critique of methodology in modern urban heat island literature. Int. J. Climatol. 2011, 31, 200–217. [Google Scholar] [CrossRef] [Green Version]
  11. Akbari, H.; Pomerantz, M.; Taha, H. Cool surfaces and shade trees to reduce energy use and improve air quality in urban areas. Sol. Energy 2001, 70, 295–310. [Google Scholar] [CrossRef]
  12. Rosenfeld, A.H.; Akbari, H.; Romm, J.J.; Pomerantz, M. Cool communities: Strategies for heat island mitigation and smog reduction. Energy Build. 1998, 28, 51–62. [Google Scholar] [CrossRef]
  13. Synnefa, A.; Saliari, M.; Santamouris, M. Experimental and numerical assessment of the impact of increased roof reflectance on a school building in Athens. Energy Build. 2012, 55, 7–15. [Google Scholar] [CrossRef]
  14. Taha, H.; Sailor, D.; Akbari, H. High-Albedo Materials for Reducing Building Cooling Energy Use; Report Number LBL-31721; Lawrence Berkeley National Laboratory: Berkeley, CA, USA, 1992. [Google Scholar]
  15. Taha, H. Urban climates and heat islands: Albedo, evapotranspiration, and anthropogenic heat. Energy Build. 1997, 25, 99–103. [Google Scholar] [CrossRef]
  16. Che-Ani, A.I.; Shahmohamadi, P.; Sairi, A.; Mohd-Nor, M.F.I.; Zain, M.F.M.; Surat, M. Mitigating the urban island effect: Some points with altering existing city planning. Eur. J. Sci. Res. 2009, 35, 204–216. [Google Scholar]
  17. Santamouris, M.; Ding, L.; Fiorito, F.; Oldfield, P.; Osmond, P.; Paolini, R.; Prasad, D.; Synnefa, A. Passive and active cooling for the outdoor built environment–Analysis and assessment of the cooling potential of mitigation technologies using performance data from 220 large scale projects. Sol. Energy 2017, 154, 14–33. [Google Scholar] [CrossRef]
  18. Santamouris, M. Cooling the cities–a review of reflective and green roof mitigation technologies to fight heat island and improve comfort in urban environments. Sol. Energy 2014, 103, 682–703. [Google Scholar] [CrossRef]
  19. Oke, T.R.; Crowther, J.M.; McNaughton, K.G.; Monteith, J.L.; Gardiner, B. The micrometeorology of the urban forest [and discussion]. Philos. Trans. R. Soc. Lond. B Biol. Sci. 1989, 324, 335–349. [Google Scholar] [CrossRef]
  20. Dimoudi, A.; Nikolopoulou, M. Vegetation in the urban environment: Microclimatic analysis and benefits. Energy Build. 2003, 35, 69–76. [Google Scholar] [CrossRef]
  21. Kleerekoper, L.; van Esch, M.; Salcedo, T.B. How to make a city climate-proof, addressing the urban heat island effect. Resour. Conserv. Recycl. 2012, 64, 30–38. [Google Scholar] [CrossRef]
  22. McPherson, E.G.; Rowntree, A.R.; Wagar, J.A. Energy-efficient landscapes. In Urban Forest Landscapes—Integrating Multidisciplinary Perspectives; Bradley, G., Ed.; University of Washington Press: Seattle, WA, USA; London, UK, 1994. [Google Scholar]
  23. Oke, T.R. The energetic basis of the urban heat island. Q. J. R. Meteorol. Soc. 1982, 108, 1–24. [Google Scholar] [CrossRef]
  24. Taha, H.; Douglas, S.; Haney, J. Mesoscale meteorological and air quality impacts of increased urban albedo and vegetation. Energy Build. 1997, 25, 169–177. [Google Scholar] [CrossRef] [Green Version]
  25. Oke, T.R. Boundary Layer Climates; Routledge: New York, NY, USA, 1987. [Google Scholar]
  26. Pereira, L.; Perrier, A.; Allen, R.; Alves, I. Evapotranspiration: Concepts and future trends. J. Irrig. Drain. Eng. 1999, 125, 45–51. [Google Scholar] [CrossRef]
  27. Srivanit, M.; Hokao, K. Evaluating the cooling effects of greening for improving the outdoor thermal environment at an institutional campus in the summer. Build. Environ. 2013, 66, 158–172. [Google Scholar] [CrossRef]
  28. Doulos, L.; Santamouris, M.; Livada, I. Passive cooling of outdoor urban spaces The role of materials. Sol. Energy 2004, 77, 231–249. [Google Scholar] [CrossRef]
  29. Synnefa, A.; Dandou, A.; Santamouris, M.; Tombrou, M.; Soulakellis, N. On the use of cool materials as a heat island mitigation strategy. J. Appl. Meteorol. Climatol. 2008, 47, 2846–2856. [Google Scholar] [CrossRef]
  30. Lee, H.; Mayer, H.; NChen, L. Contribution of trees and grasslands to the mitigation of human heat stress in a residential district of Freiburg Southwest Germany. Landsc. Urban Plan. 2016, 148, 37–50. [Google Scholar] [CrossRef]
  31. Duarte, D.H.S.; Shinzato, P.; dos Santos Gusson, C.; Abrahão Alves, C. The impact of vegetation on urban microclimate to counterbalance built density in a subtropical changing climate. Urban Clim. 2015, 14, 224–239. [Google Scholar] [CrossRef]
  32. Tsilini, V.; Papantoniou, S.; Kolokotsa, D.; Maria, E. Urban gardens as a solution to energy poverty and urban heat island. Sustain. Cities Soc. 2014, 14, 323–333. [Google Scholar] [CrossRef]
  33. Ketterer, C.; Matzarakis, A. Comparison of different methods for the assessment of the urban heat island in Stuttgart, Germany. Int. J. Biometeorol. 2015, 59, 1299–1309. [Google Scholar] [CrossRef] [PubMed]
  34. Morakinyo, T.E.; Lam, Y.F. Simulation study on the impact of tree-configuration, planting pattern and wind condition on street-canyon’s micro-climate and thermal comfort. Build. Environ. 2016, 103, 262–275. [Google Scholar] [CrossRef]
  35. Wang, Y.; Zacharias, J. Landscape modification for ambient environmental improvement in central business districts—A case from Beijing. Urban For. Urban Green. 2015, 14, 8–18. [Google Scholar] [CrossRef]
  36. Amor, B.; Lacheheb, D.E.Z.; Bouchahm, Y. Improvement of Thermal Comfort Conditions in an Urban Space (Case Study: The Square of Independence, Sétif, Algeria). Eur. J. Sustain. Dev. 2015, 4, 407–416. [Google Scholar]
  37. Ambrosini, D.; Galli, G.; Mancini, B.; Nardi, I.; Sfarra, S. Evaluating mitigation effects of urban heat islands in a historical small center with the ENVI-met® climate model. Sustainability (Switzerland) 2014, 6, 7013–7029. [Google Scholar] [CrossRef]
  38. Razzaghmanesh, M.; Beecham, S.; Salemi, T. The role of green roofs in mitigating Urban Heat Island effects in the metropolitan area of Adelaide, South Australia. Urban For. Urban Green. 2016, 15, 89–102. [Google Scholar] [CrossRef]
  39. Lobaccaro, G.; Acero, J.A. Comparative analysis of green actions to improve outdoor thermal comfort inside typical urban street canyons. Urban Clim. 2015, 14, 251–267. [Google Scholar] [CrossRef]
  40. Battista, G.; Carnielo, E.; De Lieto Vollaro, R. Thermal impact of a redeveloped area on localized urban microclimate: A case study in Rome. Energy Build. 2016, 133, 446–454. [Google Scholar] [CrossRef]
  41. Sodoudi, S.; Shahmohamadi, P.; Vollack, K.; Cubasch, U.; Che-Ani, A.I. Mitigating the urban heat island effect in megacity Tehran. Adv. Meteorol. 2014, 2014, 547974. [Google Scholar] [CrossRef]
  42. Wang, Y.; Akbari, H. Development and application of ‘thermal radiative power’ for urban environmental evaluation. Sustain. Cities Soc. 2015, 14, 316–322. [Google Scholar] [CrossRef]
  43. UNFPA Lebanon. Available online: http://www.unfpa.org.lb/PROGRAMME-AREAS/Population-and-Development/Population-and-Development-Strategies.aspx (accessed on 14 September 2015).
  44. Ministry of Environment/Lebanese Environment and Development Observatory (LEDO)/ECODIT. Lebanon State of the Environment Report. Available online: http://www.moe.gov.lb (accessed on 14 January 2018).
  45. Aouad, D. Urban Acupuncture as a tool for today’s re-naturalization of the city: The non-constructible parcels of Municipal Beirut through the case study of Saifi district. In Architectural Research Addressing Societal Challenges, Proceedings of the EAAE/ARCC 10th International Conference (EAAE ARCC 2016), Lisbon, Portugal, 15–18 June 2016; Da Costa, M.J.R.C., Roseta, F., Lages, J.P., Da Costa, S.C., Eds.; Taylor & Francis: Lisbon, Portugal, 2017. [Google Scholar]
  46. El-Achkar, E. Réglementation et Formes Urbaines: Le cas de Beyrouth; CERMOC: Beirut, Lebanon, 1998. [Google Scholar]
  47. Masson, V. A physically-based scheme for the urban energy budget in atmospheric models. Bound.-Lay. Meteorol. 2000, 94, 357–397. [Google Scholar] [CrossRef]
  48. Kaloustian, N.; Diab, Y. Effects of urbanization on the urban heat island in Beirut. Urban Clim. 2015, 14, 154–165. [Google Scholar] [CrossRef]
  49. Kaloustian, N. On the Urban Heat Island in Beirut. Ph.D. Thesis, Académie Libanaise des Beaux-Arts (ALBA), Balamand University, Beirut, Lebanon, Université Paris-Est, Paris, France, 17 November 2015. [Google Scholar]
  50. Aouad, D. Non-constructible Parcels within the Boundaries of Municipal Beirut: The Case Study of Saifi, Bachoura and Zokak El-Blat. Masters’ Thesis, Académie Libanaise des Beaux-Arts (ALBA), Balamand University, Balamand, Lebanon, 2014. [Google Scholar]
  51. ESRI. ArcGIS Desktop: Release 10; Environmental Systems Research Institute: Redlands, CA, USA, 2011. [Google Scholar]
  52. Asaeda, T.; Ca, V.T.; Wake, A. Heat storage of pavement and its effect on the lower atmosphere. Atmos. Environ. 1996, 30, 413–427. [Google Scholar] [CrossRef]
  53. Synnefa, A.; Santamouris, M.; Livada, I. A study of the thermal performance of reflective coatings for the urban environment. Sol. Energy 2005, 80, 968–981. [Google Scholar] [CrossRef]
  54. ENVI-met 4.0. Available online: www.envi-met.com (accessed on 1 August 2018).
  55. Gago, E.J.; Roldan, J.; Pacheco-Torres, R.; Ordóñez, J. The city and urban heat islands: A review of strategies to mitigate adverse effects. Renew. Sustain. Energy Rev. 2013, 25, 749–758. [Google Scholar] [CrossRef]
  56. Erell, E.; Pearlmutter, D.; Boneh, D.; Bar Kutiel, P. Effect of high-albedo materials on pedestrian heat stress in urban street canyons. Urban Clim. 2014, 10, 367–386. [Google Scholar] [CrossRef]
  57. Yaghoobian, N.; Kleissl, J.; Scott Krayenhoff, E. Modeling the Thermal Effects of Artificial Turf on the Urban Environment. J. Appl. Meteorol. Climatol. 2010, 49, 332–345. [Google Scholar] [CrossRef]
  58. Andersson, L. Urban Experiments and Concrete Utopias: Platform4 a ‘Bottom Up Approach to the Experience City. In Architecture and Stages in the Experience City; Kiib, H., Ed.; Institut for Arkitecktur og Medieteknologi, Department of Architecture and Designs Skriftserie, No. 30; Aalborg University: Aalborg, Denmark, 2008; pp. 84–95. [Google Scholar]
  59. NYC Parks. Available online: http://www.nycgovparks.org/parks/highline (accessed on 24 March 2014).
  60. Lehtovuori, P.; Ruoppila, S. Temporary Uses as Means of Experimental Urban Planning. SAJ—Serbian Archit. J. 2012, 4, 29–53. [Google Scholar]
  61. Killing Architects. Urban Tactics: Temporary Interventions + Long Term Planning. Available online: http://www.killingarchitects.com/urban-tactics-final-repor/ (accessed on 22 May 2013).
  62. Heck, A.; Will, H. Interim Use: Opportunity for New Open-Space Quality in the Inner City—The Example of Leipzig. Available online: http://www.difu.de/node/5959 (accessed on 16 January 2014).
Figure 1. Non-Constructible parcels map within the Bachoura District [45].
Climate 06 00068 g001
Figure 2. Non-constructible parcels identified in previous TEB cell(s) in Bachoura District.
Climate 06 00068 g002
Figure 3. Three-dimensional computational domain of Bachoura District.
Climate 06 00068 g003
Figure 4. Minimum, maximum and average air temperature in the summer of 2011 of Fanar weather station
Climate 06 00068 g004
Figure 5. Air temperature variations from ante- to post-operam with cool materials.
Climate 06 00068 g005
Figure 6. Altitude air temperature variations from ante to post-operam with trees.
Climate 06 00068 g006
Figure 7. Altitude air temperature variations from ante to post-operam with cool materials and trees.
Climate 06 00068 g007
Table 1. Characteristics of existing NCs with proposed types of cool materials or reflective coatings and their thermal properties in Bachoura District.
Plot No.Surf. Area [m2]Nature of PlotExisting Material Initial Albedo [-]Proposed Cool Material Final Albedo [-]
70697Parking LotAsphalt0.2White alkyd Chlorine rubber coating0.5–0.6
70746.64ROWPavestone0.2–0.35White acrylic latex0.6–0.7
71333.3ROWPavestone0.2–0.35Marble 0.45–0.5
72430.1ROWPavestone0.2–0.35Marble 0.45–0.5
73668.2Parking LotAsphalt0.225White acrylic latex 0.6–0.7
121314.7Vacant LandBush/Garden0.18Marble 0.45–0.5
121936.75ROWPavestone0.2–0.35Marble0.45–0.5
126178.6Parking LotAsphalt0.20White alkyd chlorine rubber coating0.5–0.6
128257.4GeneratorConcrete Slab0.10–0.35White alkyd chlorine rubber coating0.5–0.6
128753.8BushBush 0.18White acrylic latex0.6–0.67
137834.6Parking LotAsphalt0.20Marble 0.45–0.5
139274.2Parking LotAsphalt0.20White alkyd chlorine rubber coating0.5–0.6
14869.1ROWPavestone0.2–0.35Marble 0.45–0.5
Table 2. Results of simulations for selected NCs in Bachoura District. Maximum air temperature difference from 0 to 5 m above ground before and after the application of mitigation strategies.
Maximum Temperature Reduction (°)
NC Plot Nos.70670771372473612131219126112821287137813921486Max
Cool mat.−0.09−0.05−0.11−0.07−0.42−0.07−0.05−0.14−0.23−0.12−0.10−0.22−0.04−0.42
Trees−0.05+0.01+0.12−0.02−0.51+0.02−0.02−0.08+0.10+0.06+0.03−0.13+0.01−0.51
Cool mat. & trees−0.14−0.07−0.12−0.07−0.77−0.06−0.07−0.18−0.21−0.10−0.08−0.26−0.06−0.77

