Article

Evaluation of Small-Scale Fishers’ Perceptions on Climate Change and Their Coping Strategies: Insights from Lake Malawi

1
Department of International Environment and Development Studies (Noragric), Norwegian University of Life Sciences, P.O. Box 5003, N-1430 Ås, Norway
2
Department of Fisheries, P.O. Box 593, Lilongwe, Malawi
3
Department of Animal and Aquacultural Sciences, Norwegian University of Life Sciences, P.O. Box 5003, N-1430 Ås, Norway
*
Author to whom correspondence should be addressed.
Climate 2018, 6(2), 34; https://doi.org/10.3390/cli6020034
Submission received: 26 March 2018 / Revised: 18 April 2018 / Accepted: 24 April 2018 / Published: 30 April 2018
(This article belongs to the Special Issue Climate Services for Local Disaster Risk Reduction in Africa)

Abstract

:
The effects of climate change have negatively affected Malawi’s agricultural production. In this context, fisheries have been providing alternative livelihoods. However, there is a knowledge gap around the responses of small-scale fishers to climate-related changes. Therefore, a study was conducted on the Western shores of Lake Malawi between August 2015 and April 2016. The study evaluated the perceived effects of climate change on small-scale fishers and their coping strategies by employing a wide range of methods for data collection and analysis. The study used explorative surveys, household surveys, focus group discussions and key informant interviews to collect data. The study randomly sampled 112 household heads who owned either fishing gear or a fishing vessel or both. Content analysis for themes was used to analyse the qualitative data. The Mann–Kendal Test was used to analyse trends in meteorological data, and binary logistic regression was used to determine factors that influence coping with low fish catches. Despite the respondents noticing an increased incidence of extreme weather events and low fish catches, their perceptions could not be validated using time series meteorological data. However, such perceptions were influenced by experience from long-time exposure to extreme weather events and to low fish catches. The majority of the fishers had adjusted to these changes by increasing their fishing time, using highly efficient illegal fishing nets, expanding farming land, operating small businesses and undertaking casual labour in agriculture and fishing activities. The fishers’ propensity to adjust to these changes increased due to the presence of the following factors: older age of household head, higher education level, being married and having an annual income. In contrast, being a member of fish conservation club decreased the probability of adjusting. This study emphasizes the need to be cautious when defining and framing perceptions of local communities on extreme weather events as data obtained could be misleading. Furthermore, a multi-sectoral approach to balance sustainable livelihoods and management of fisheries is needed. These findings provide theoretical and practical lessons that can inform design, planning and implementation of policies that enhance adaptive capacity in fisheries and promote sustainable livelihoods in sub-Saharan Africa.

1. Introduction

Global food production systems have been impacted by climate change [1]. This problem is increased because the adaptive capacity of many poor communities is too low to enable them to be resilient. This is a picture which commonly describe many developing countries whose people are poor and vulnerable [2]. One such country in the Southern part of Africa is Malawi, which has been facing increased impacts of extreme weather events more frequently in the last decades than ever before [3].
These extreme weather events have affected Malawi’s agriculture sector on which its development agenda is framed [4]. This is because Malawi’s agriculture heavily depends on rainfall [5]. This makes Malawi’s economy and its people more vulnerable; thus, they continue to search for other sustainable livelihood sources. Malawi fisheries have, for a long time, cushioned the impacts of low agricultural productivity [6,7].
Small-scale fisheries support the livelihoods of over 180 million people in developing countries; Malawi’s fisheries support its entire population [8,9,10]. In this case, the small-scale fishers are important because they produce more than 90% of Malawi’s total annual fish catches. Although fish has remained the cheapest source of animal protein for many rural Malawians [10], the edible fish population has also been fluctuating [10,11] leading to collapse of some important fisheries, like Lake Malombe [12].
The decline in the fish population has been attributed, among other factors, to overfishing [13,14,15], weak governance structures and environment-related changes [16]. Although it has been difficult to ascertain whether climate change could be among the factors affecting Malawi’s fisheries specifically, at a global level, climate change has been reducing fish catches [17,18,19,20,21].
This should be a major concern to Malawi fisheries, as climate projections, under different scenarios, indicate higher maximum temperatures and lower annual precipitation levels than previously experienced [22,23,24,25,26,27]. These projected changes will have a direct influence on Malawi fisheries via an increase in water temperature and a decrease in fish production in water bodies like Lake Malawi [28,29]. Increase in water temperature lowers water mixing which bring food for fish from the bottom of the lake [30,31]. However, there is still a lack of knowledge on the influence of such effects on Malawi fishers’ livelihoods and coping strategies.
Attempts have been made to investigate such impacts at Lake Chilwa in Malawi [32,33]. However, the knowledge gained was specific to that ecosystem and cannot be applied or generalized to other ecosystems like Lake Malawi. This is because the contexts of the communities along these two water bodies are different. Therefore, using such knowledge to create local policies that enhance sustainable livelihoods will not meet the intended goals [34].
If sustainable livelihoods are to be achieved, there is need to mainstream adaptation into development policies [35]. Implementation of such policies might strengthen the adaptive capacity of small-scale fishers. Adaptation is a difficult process when coupled with a declining fish population [36]; however, understanding the local context might provide solutions to enhance adaptation.
It is paramount to understand local conditions to improve the potential for policies to be correctly designed and to increase chances that they will actually be effective in promoting climate adaptation. Therefore, we explored the perceptions of Lake Malawi’s small-scale fishers on climate change and its effects on their livelihoods using the following research questions: (a) What are the perceptions of the fishers on climate change and what influences such insights? (b) What are the effects of these perceived changes on fish catches? (c) What are the fishers’ coping strategies to the perceived changes? (d) What factors determine these coping strategies?

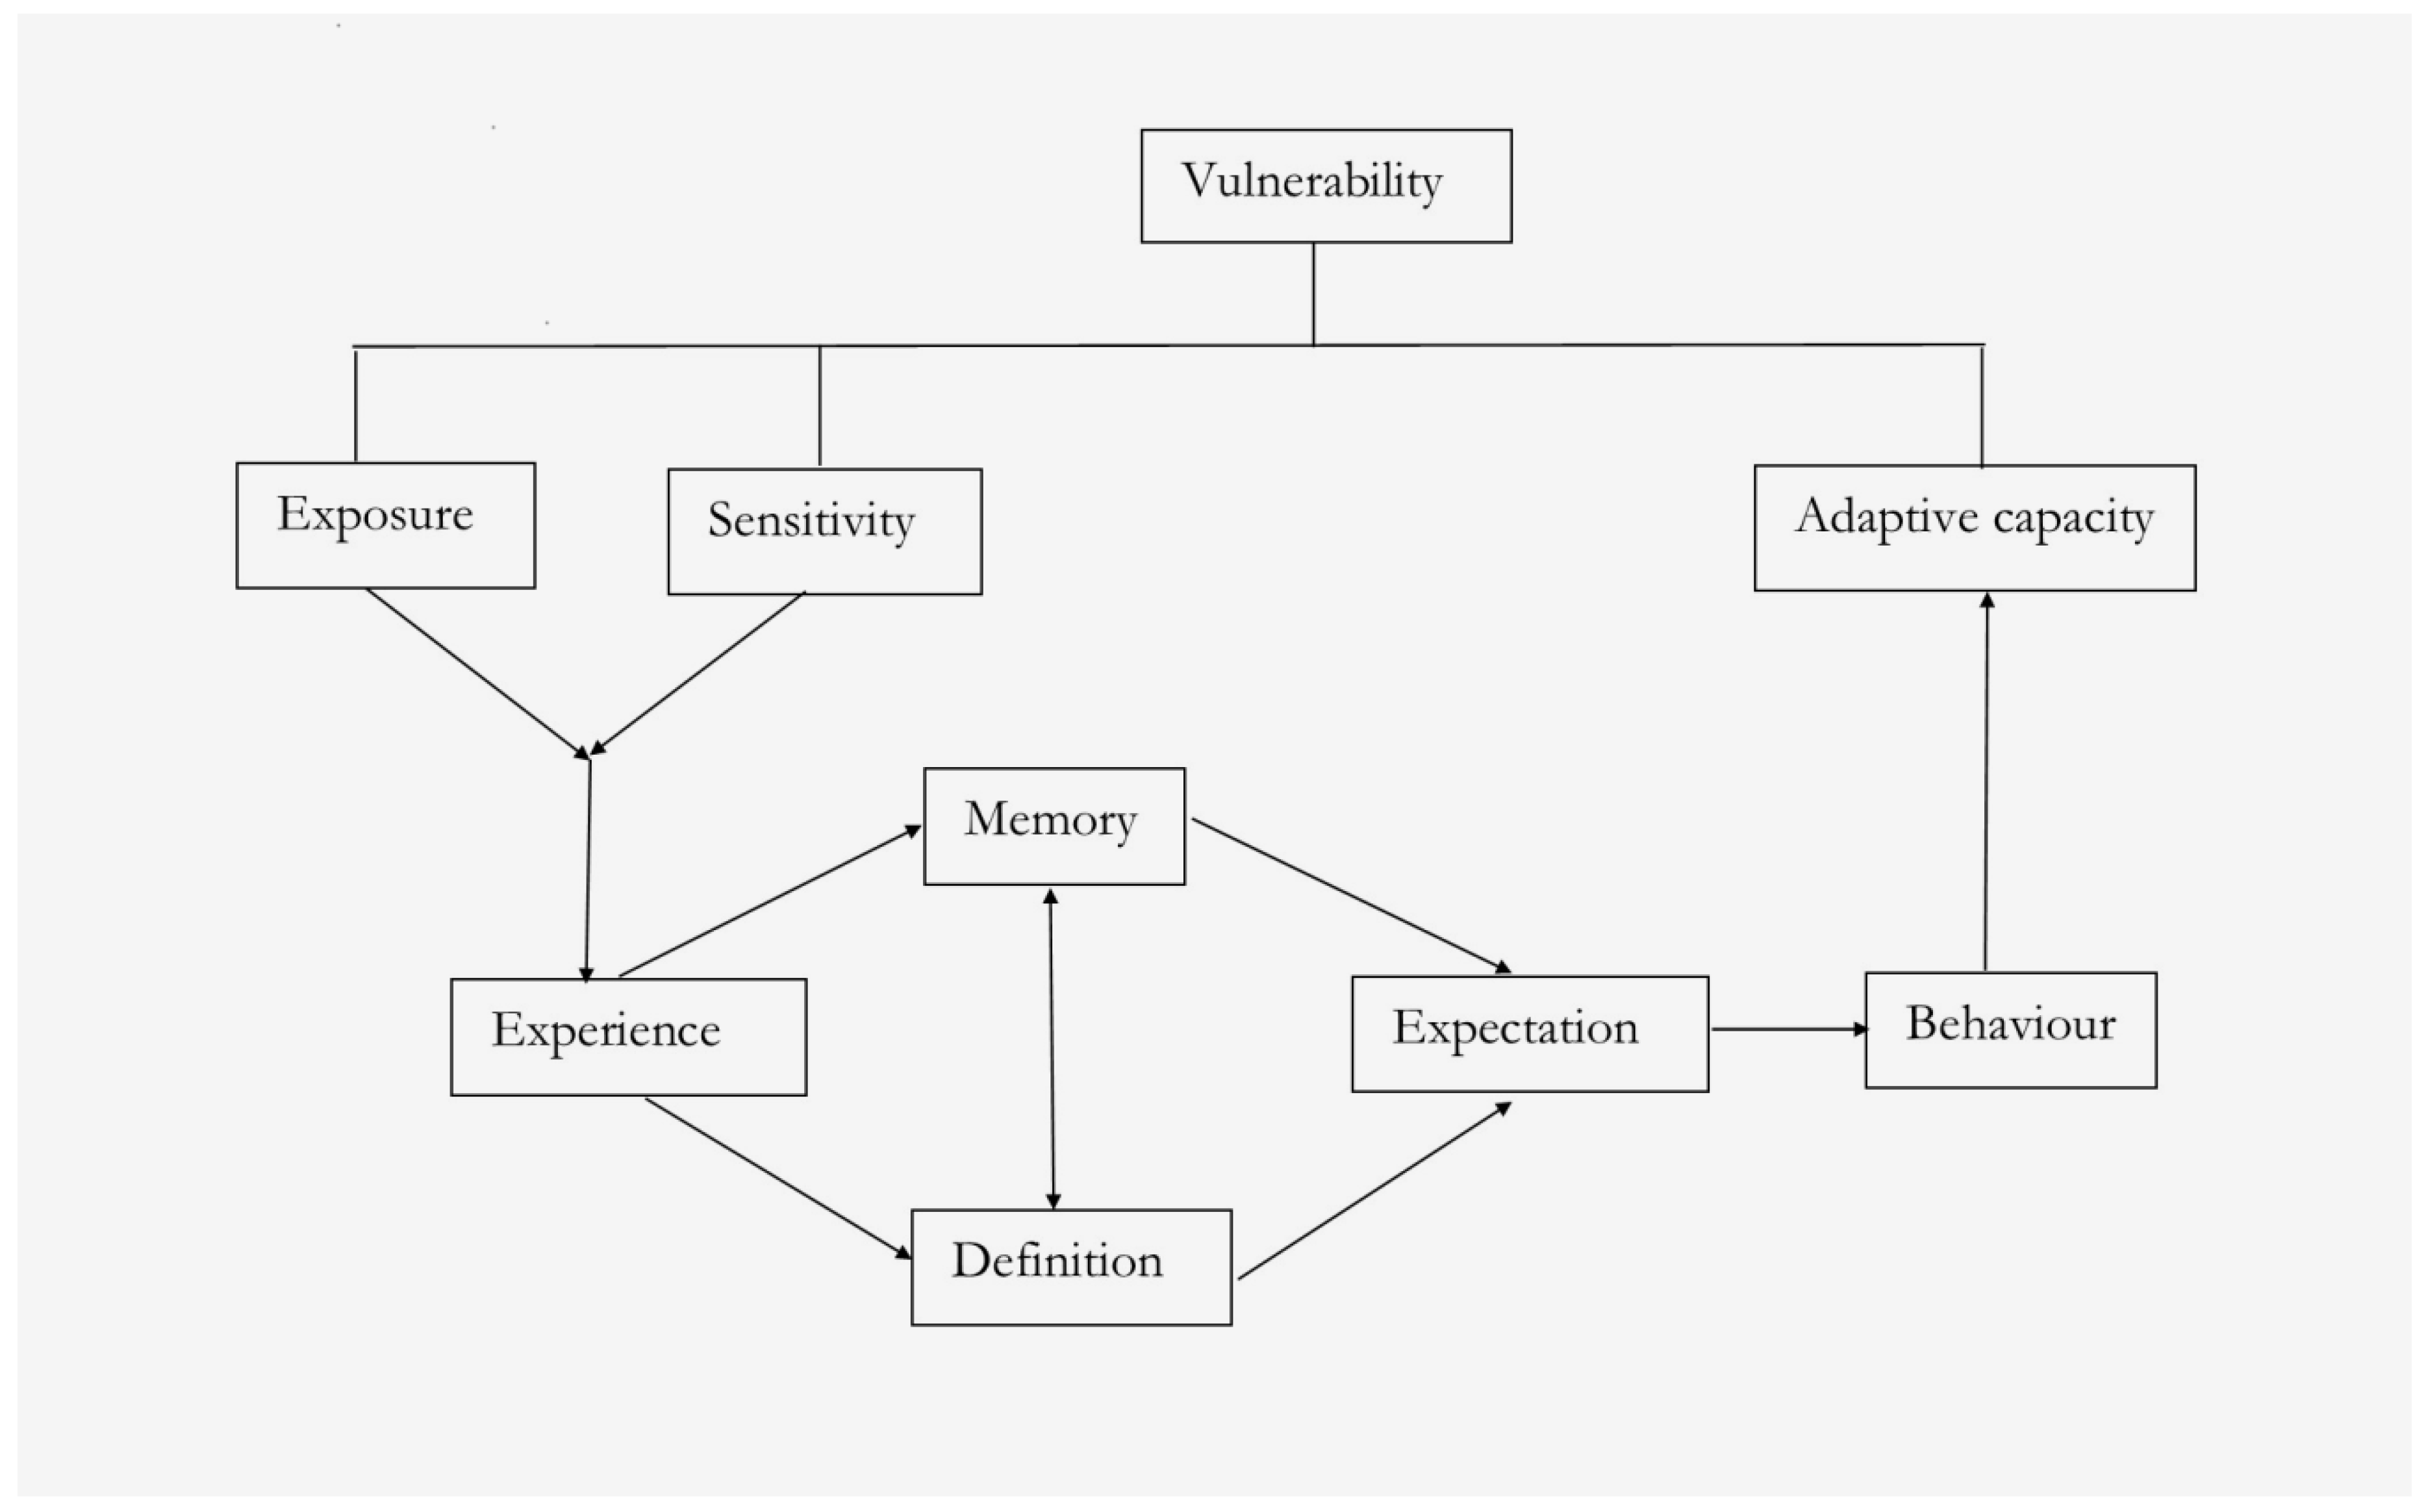
2. Conceptual Framework
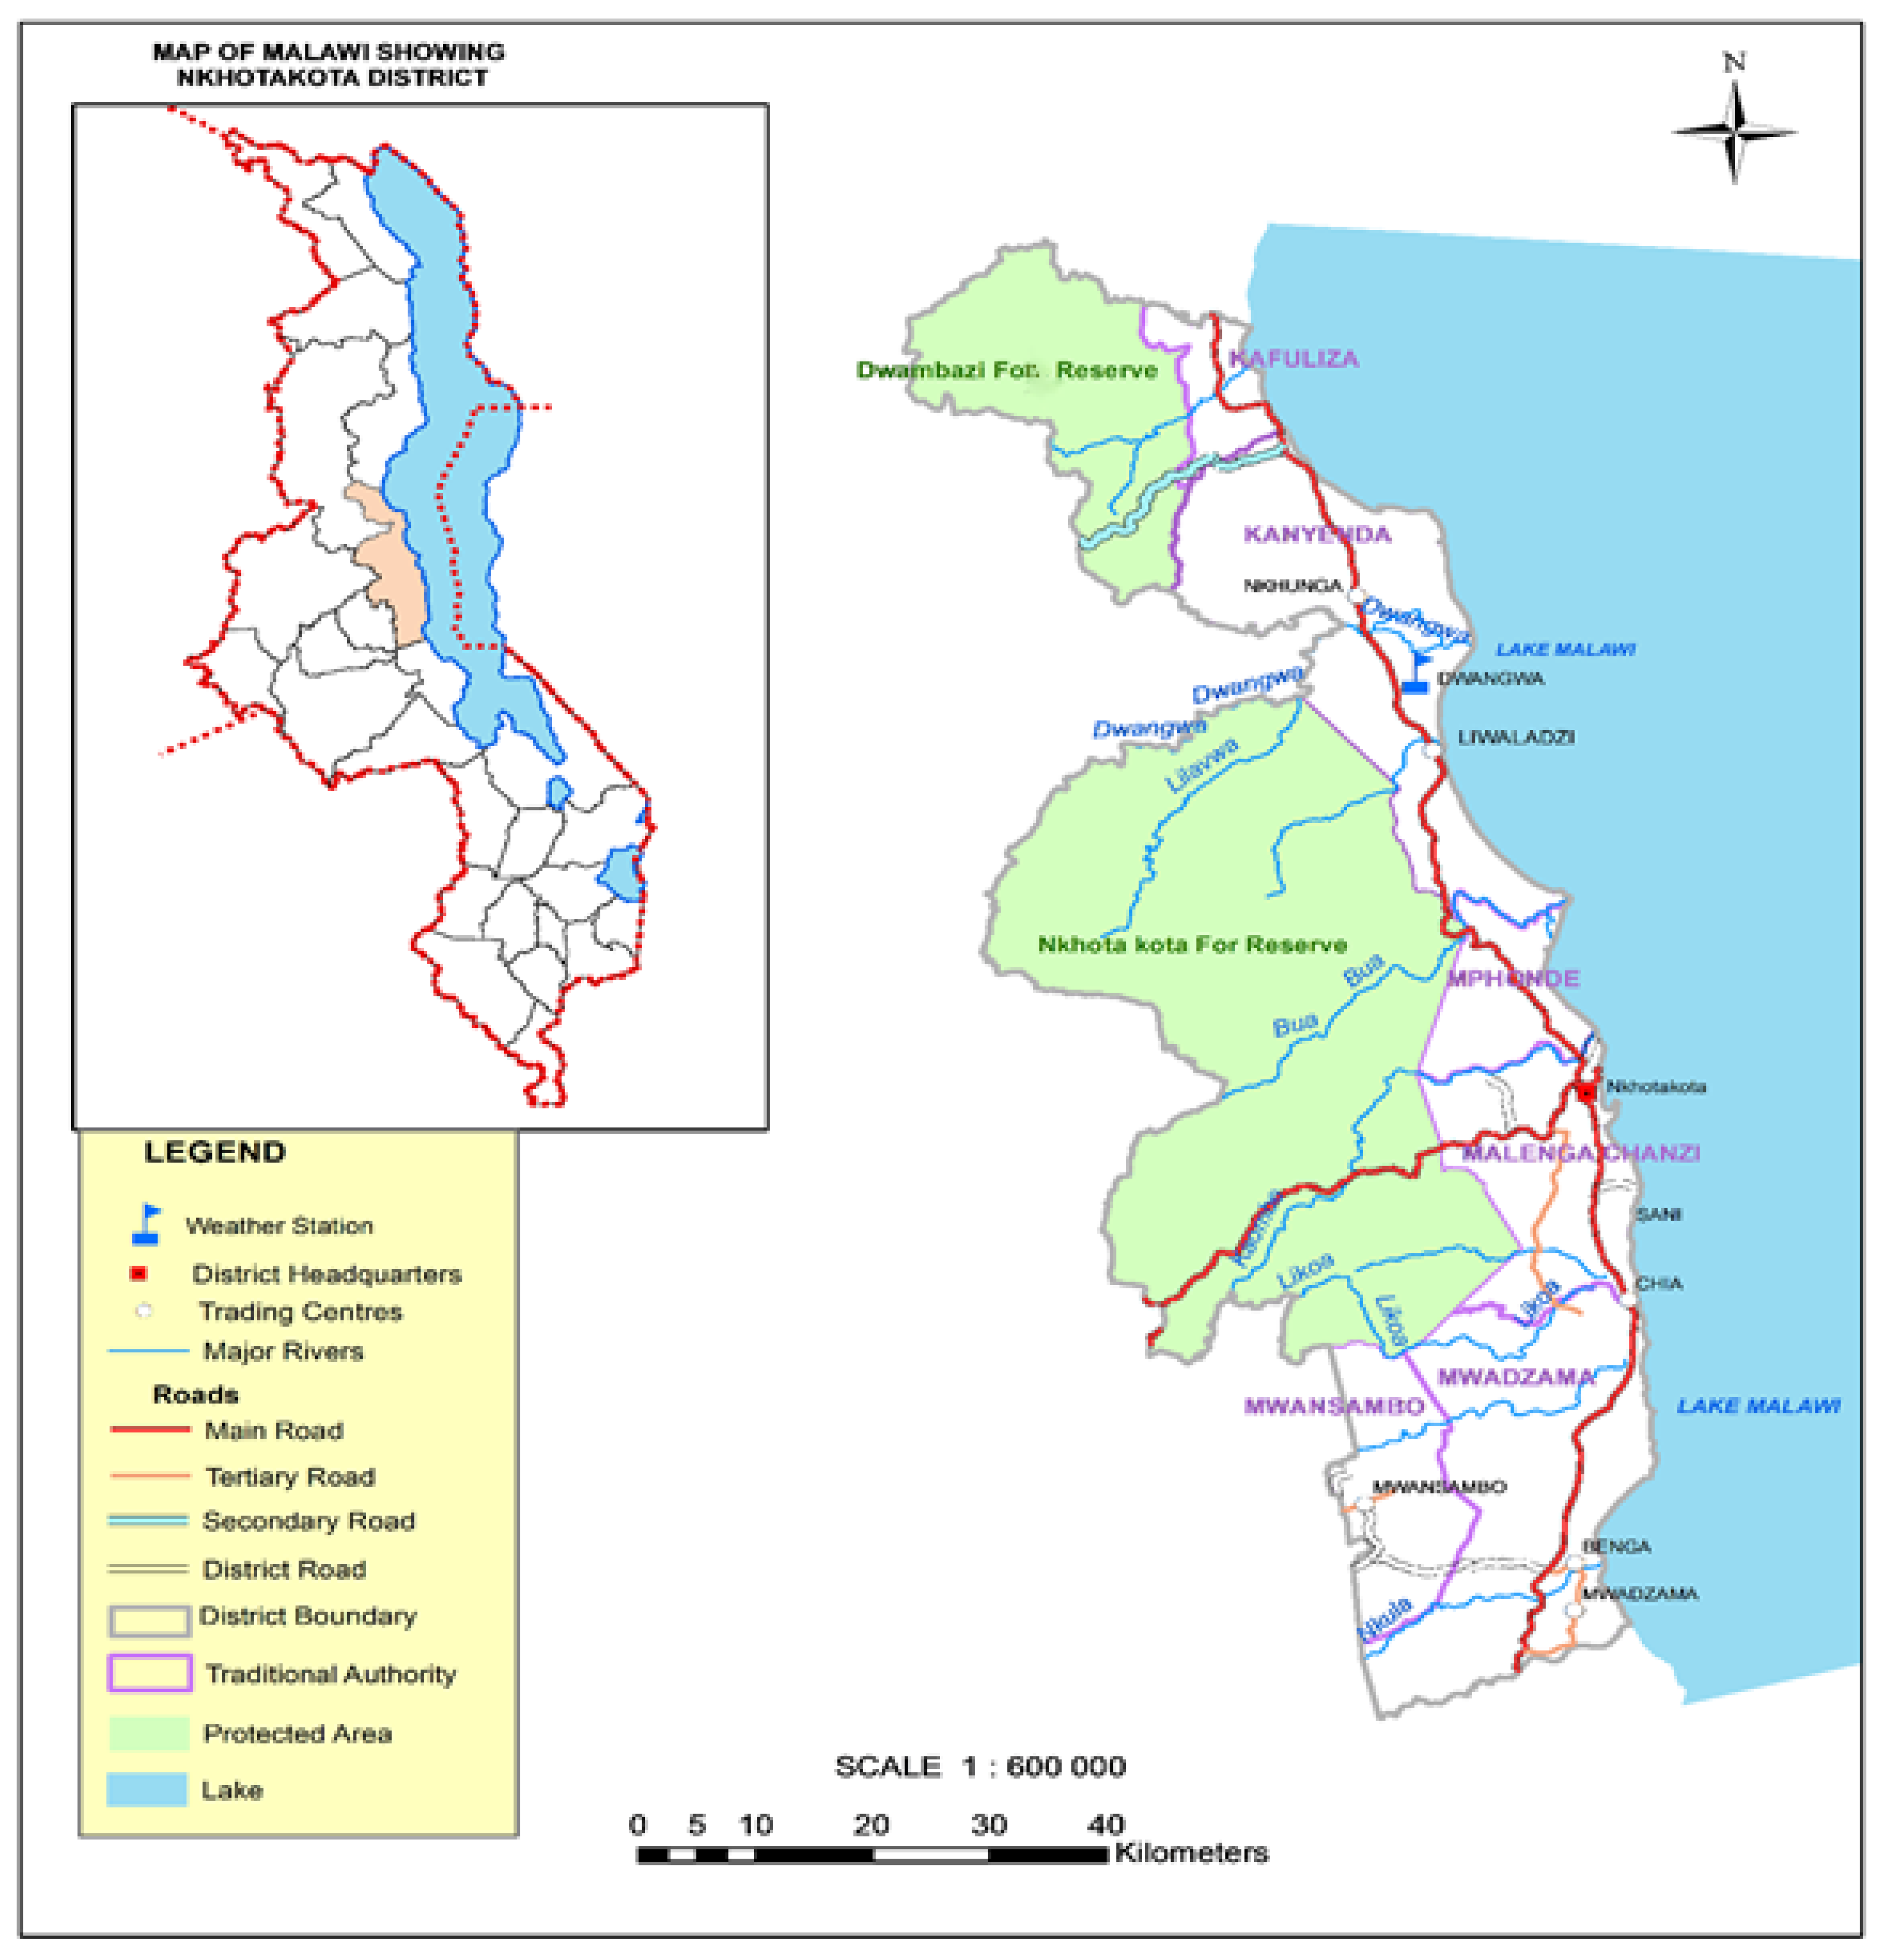
This study was framed around the vulnerability [37] and perception [38] conceptual frameworks. The vulnerability framework has its basis in the Intergovernmental Panel on Climate Change (IPCC)’s Third Assessment Report (TAR) [39], whereas the perception framework was developed for drought studies in the Ogallala Aquifer in the Western United States Great Plains. These two frameworks have been applied in many climate-related studies [40,41,42,43], and in this study, it enabled the application of mixed research methods to assess the vulnerability level of Malawi small-scale fishers using perceptions as a basis to access their impacts on climate change. The combination of these two frameworks (Figure 1) was used to show how fishers view climate change and at the same time, gave a comprehensive platform to capture features of complex systems, such as fisheries [44]. Furthermore, these two concepts are imaginative in nature and offer a method of assessing the relationships between the human and environmental systems.
The vulnerability framework has weaknesses in that it does not consider the mental processes that drives individuals to change their behaviour when exposed to climate changes. Moreover, it assumes that time is irrelevant [40]. These weaknesses were overcome by incorporating the perception framework, which focuses on behaviour, values, beliefs, knowledge and culture [38].
The perception framework is hinged around psychology, which is study of behaviour and mental processes [45]. Furthermore, psychology is closely linked with perceptions [46]. However, perceptions are subjective [47] and comprise a wide range of things which are contextual, value-laden and dynamic [38,47]. For example, a definition of a similar event might be different within a group of individuals in the same environment [48], due to social constructs [47]. Perceptions are also associated with experience, i.e., how individuals react to situations [38]. This is so because perception is a function of the actions displayed thereafter [49]. The experience component is the link to the vulnerability framework through the exposure and sensitivity components.
In addition to exposure and sensitivity, the other component of the vulnerability framework is adaptive capacity. Exposure is the nature to which a system is exposed to significant climatic variation, while sensitivity is the degree to which a system is affected either adversely or beneficially by climate-related stimuli [39]. Adaptive capacity is the ability of a system to adjust to changes [37]. Exposure, sensitivity and adaptive capacities vary across temporal and spatial scales [50], making findings from other fisheries difficult to generalise. Many studies that have theorized vulnerability have found it to be influenced by socioeconomic, cultural, political and technological factors as well as access to financial resources, kinship networks and environmental conditions [37,50,51].
On the other hand, many climate change-related studies have used the perception concept as a tool to understand how people interact with their environment [52,53,54,55,56,57,58,59,60,61,62,63], but many of them have failed to look at how perceptions are theorized.
Failure to theorize the findings could also be equated with failure to declare how vulnerability is framed. Therefore, in using the vulnerability framework, we followed the human security framework [64], because it links fishers’ inability to cope with low fish catches as being due to many stressors, which includes climate. We applied the vulnerability framework based on the contextual issues affecting the fishers.
Linking these two frameworks enabled the study to relate how exposure and sensitivity to past events has been shaped and defined. In our case, fishers remembered events they were exposed to, and this had a bearing on expectations of similar future events, which affected their behaviour [38]. The act of remembering is a psychological aspect of their memory and has a time factor attached to it. The outcome of such behaviour could either be reactive or proactive [ibid]. The displayed behaviour could also be associated with whether a fisher copes with, adapts to, or continues their fishing behaviour because of being satisfied with their fish catch. Behaviour is responsible for the process of choosing either short-term goals, which in most cases are unsustainable (for example, overfishing or using non-selective fishing gear which is destructive), or long-term sustainable goals.
However, in using the composite framework, we made assumptions based on Malawi’s projected temperature and precipitation levels [25,65]. The climate-related impacts based on such projections might potentially affect the provision of ecosystem services from the fisheries on which many people base their livelihoods. If fishers are vulnerable to such changes, what could be factors driving them to perceive the situation in that manner? Moreover perceptions to extreme weather events were validated with the use of meteorological data [58,66].

3. Study Area

The study was conducted in Nkhotakota district between Geographical Positioning System (GPS) Coordinates −13°35′09″ S, 34°29′ 90″ E and −12°62′73″ S, 34°17′46″ E, along the Western shores of Lake Malawi in the central region of Malawi (Figure 2). Lake Malawi is also situated alongside two other countries (Mozambique and Tanzania). Lake Malawi has about 500–1000 endemic fish species [67], and Nkhotakota district is one of the five-lakeshore districts on the Malawi side.
Nkhotakota has a population of 303,659 people representing 2.3% of Malawi’s population. The proportions of men and women in Nkhotakota are equal [68]. The climate of Nkhotakota has been variable [29]. Its average annual rainfall ranges between 860 and 1600 mm between December and March, whereas, its monthly average temperature ranges between 20 and 28.7 degrees Celsius. Nkhotakota district has an approximate area of 7500 km2, of which 43% of it is under water [69].
Although 57% of Nkhotakota is covered by land, only a small portion (6%) of it is left for its people to use for shelter and agriculture. Large chunks of land are divided between commercial sugarcane plantation and protected game and forest reserves. The people of Nkhotakota are mainly engaged in growing cotton, burley tobacco, cassava and rice, while maize is grown on a small scale. Rice, cotton and tobacco are mostly grown for sale with maize and cassava for food. Nkhotakota is highly vulnerable to extreme weather events [69,70], making food production from agriculture a big challenge.
Vulnerability to agriculture drives many people in Nkhotakota to focus on fishing. Nkhotakota’s fishing gear owners represent 18% of the total proportion of owners on Lake Malawi, and of these, about 2% are women. Crew members from Nkhotakota represent 17% of the entire Lake Malawi fishing population [71]. Nkhotakota fishery industry is characterized by multiple species and multiple types of gear [72]. Despite the majority of Nkhotakota’s population being small-scale fishers [69,71], there is lack of information on these fishers’ vulnerability to changes related to climate.

4. Methods

4.1. Data Collection

The study used mixed research methods to collect information from the respondents [73,74]. Nine exploratory interviews at different fish landing sites within the study area were conducted between August 2015 and December 2015. These interviews targeted local fishery conservation groups, village management structures, fishers and fish traders. The sample comprised both men and women in order to capture a variety of perceptions [60]. These interviews contextualized the study by asking the respondents to describe their local climate and any changes associated with climate occurring in their area. In addition, the respondents were asked about fish catches and any changes that had occurred and the reasons as to why such changes were happening. The respondents were also asked to cite how they were coping with such changes. The responses to the interviews identified the perceptions of the local people [47] and helped to frame quantitative surveys as a follow up to the critical issues gathered during the exploratory surveys.
After the explorative interviews, semi-structured questionnaires (Supplementary File S1) and checklists were developed, pretested and validated [75,76]. The questionnaires captured both quantitative and qualitative information from household surveys [77]. Checklists were used to collect information from focus group discussions and key informant interviews. Some of the aspects covered in the questionnaire included household characteristics and composition, household fishing data, household sources of income, climate change risks, perceptions of climate and ecosystem changes and an analysis of climate change coping measures. The questions avoided leading answers on climate scenarios, but they were open-ended to allow the fishers to discuss and elaborate more on their perceptions [66]. Data collection took high ethical principles into consideration [78]. The household surveys, focus group discussions and key informant interviews were conducted between February 2016 and April 2016.
The survey was administered to 112 fisher household heads (98% male and 2% female) randomly sampled [79] from five fish landing sites (Mwadzama, Chipala, Vinthenga, Kamguzila and Luwaladzi). In addition to the household survey, ten focus group discussions, comprising an average of twenty members per group, were conducted to further probe issues, which emanated from the exploratory interviews and household surveys. The focus group discussions were coordinated by a single moderator in order to maintain consistency in question delivery, timing emphasis and reactivity potential [80]. In establishing focus group discussions, age, gender and the nature of work in the village were considered [60]. Furthermore, five key informant interviews with chiefs, local fishery conservation group members and fish traders were conducted using a phenomenological research approach [81] in which their lived experiences were probed. The use of these methods triangulated different sources of information in order to improve validity [80,82].
To further validate fishers’ perceptions, secondary data sources on meteorology (temperatures, rainy days and precipitation) were used [83,84]. Climate data from the previous 34 years (1982–2016) was obtained from a nearby weather station at Illovo Sugar Company, Dwangwa Estate, located at Geographical Positioning System (GPS) coordinates −12°31′06″ S, 34°07′55″ E.

4.2. Data Analysis

Qualitative data from exploratory surveys, focus group discussions and key informant interviews were transcribed, translated into English and analysed using content analysis for related themes [85]. The analysis involved coding to generate initial themes, searching for themes among the codes, and reviewing and naming the themes [86]. The identification of related themes was based on recorded patterns within the data. Themes were related to specific research questions and they also guided further data analysis. In order to support and clarify the perceptions of different respondents interviewed, direct quotations were also used.
Household survey data from the sampled respondents were analysed using descriptive statistics (means, ranges, frequencies and percentages) [87]. Descriptive statistics were used to identify the main characteristics of the participants. On the other hand, inferential statistics were used to assess whether relationships existed between certain respondent characteristics and the fishing environment. For example, cross tabulations (non-parametric test) were used to determine the associations between (a) a fisher’s main occupation and income source and (b) the fisher’s perceived climate change exposure and changes in fish catches and (c) coping strategies and type of climate exposure [88]. Another inferential statistic used was the Pearson’s correlation coefficient, which determined whether any relationship existed between the maximum annual temperature and total annual precipitation. Furthermore, the Mann–Kendall (MK) test [89,90] was used to establish the presence of trends in precipitation and temperature of the meteorological time series data [91]. In order to verify if the required conditions for the MK test were met, one of the assumptions was to check if there was any random correlation between the variables being tested. Therefore, serial correlation was checked in the precipitation and temperature data using a pre-whitening procedure prior to conducting the MK tests [92]. The influence of serial correlation may lead to committing a Type 1 error [93], that is rejecting the null hypothesis when it is, in fact, true. The annual precipitation and temperature anomalies were standardized, i.e., departures from the mean divided by the standard deviation, were compared with the fishers’ perceptions [84,94].
Finally, a binary logistic regression was used to determine factors which affected fishers’ coping behaviour with the perceived fish catch changes [95]. These factors were gathered through the household survey and were assessed using bivariate correlations prior to running the logistic regression. Of these factors, annual income was log transformed to remove skewness before running the logistic regression so that it conformed with the regression assumption of normality [96]. In conducting descriptive and inferential statistical procedures, Microsoft Excel, Statistical Package for Social Scientists (SPSS) version 24 and Stata version 14.2 were used.

5. Results

5.1. Characteristics of Fishers

The results from this study showed that fishing (90%), farming (6%) and operating small businesses (4%) were the main livelihood sources. The fishers’ main occupation and sources of income were significantly different (χ2 = 16.55, df = 6, p < 0.01). The majority (65%) of the respondents stated that they consume fish every day. More than 90% of the respondents access drinking water from the lake, and a small proportion (1%) access their drinking water from a public utility company. These results suggest the importance of Lake Malawi to the livelihoods of its surrounding communities.
The study also categorized fishers in the study area based on fishing vessel types, fishing location and fishing gear types. We observed that 22% of the fishers use boats with outboard engines, while 44% have boats without engines and a small proportion (26%) use dugout canoes. The majority (76%) of the fishers operate in the offshore waters, whereas 24% fish the inshore waters. The fishers take an average of 2 h to reach the fishing ground. Half of these fishers (50%) spend 3 to 6 h fishing, compared to the other half that spend 9 to 10 h. However, during the focus group discussions, we observed that there have been changes in the time spent fishing. Beach Village Committee #1, 15 December 2015We travel very far away in search of fish than in the past.” These results could be a reflection as to why the majority of fishers fish in the offshore waters. Gillnets (60%) whose average length is 917 m were the most common fishing gear type in the study area. A gillnet is a rectangular fishing gear made from 4 or 6 ply twine, and has a mesh size designed to catch fish of a specific size range. It is used with a single planked boat (with or without engine) and a crew of four. The net may be surface set or bottom set and is a passive gear [97]. The gill nets are used to catch Copadichromis virginalis, Bagrus meridionalis, Mylochromis guentheri, Rhamphochromis spp., Synodontis njassae, Tramitichromis intermedius, Opsaridium microcephalum and Oreochromis species. The other group of fishers (35%) use open water seine nets whose average length is 107 m. An open water seine net has a conical appearance and is used at night to catch Engraulicypris spp., while during the day, the gear is used to target Copadichromis spp. The net is towed in the opposite direction to the movement of the fish and finally hauled into the plank boat [98]. Open water seine nets are used to catch Engraulicypris sardella, C. virginalis and T. intermedius. Some fishers (3%) use fish traps to catch C. virginalis and O. microcephalum, whereas longlines (2%) are used to catch B. meridionalis. The study further noted that some fishers (58%) use nets with mesh sizes ranging from 0.25 to 1.75 inches while the other category (42%) use mesh sizes of 2.5 to 3.5 inches. It was reported by key informant # 1 regarding the question of what has changed in their fishing behaviour that “Almost everyone in this fishing area has adjusted their fishing equipment. Ten years ago, I used to operate gillnets with mesh sizes of four and half (4.5) inches and I was catching many fish. As it is now, I cannot use such type of nets because I will not catch anything, and my family will die of hunger”. Despite the small mesh sized fishing gears, which have improved fishing efficiency, the study also, revealed a high diversity of fish species being caught.

5.2. Fishers’ Perceptions on Changes in the Climate

Even though the study revealed high species diversity, all fishers interviewed acknowledged been exposed to extreme weather events. The fishers reported increased incidences of drought (32%), erratic rainfall (32%), extreme hot temperatures (22%), persistent Mwera winds (strong South easterly winds affecting Lake Malawi due to the flat and obstruction-free nature of its surface, allowing winds of considerable strength to develop. The onset of a Mwera can be quite sudden, causing rapid deterioration in the condition of the lake itself) (11%) and flooding (8%). Most of these fishers (88%) revealed experiencing these extreme weather events in the 21st century. These events occurred frequently in the years between 2000 and 2016, as reported by 89% of the fishers. The majority of the fishers (90%) acknowledged experiencing continuous drought incidences. However, in the last 5 years, about half (44%) of the respondents cited no flooding event in the study area. Apart from being erratic, rainfall was also reported to have reduced in intensity (94%). The reduced intensity might have resulted in drier years in the 2000s, as cited by most respondents (95%), in comparison to the 1990s. These results suggest that the perceived exposures revolved around precipitation and temperature.
An analysis of discussions from qualitative interviews revealed that climate change is defined differently between respondents. The definitions were affected by the time lived in the area, which affected how the fishers perceived the changes. For example, there were variabilities in responses by different age groups based on the way they had experienced different changes related to extreme weather events. The older people recollected past events over a long period through experiences and oral tradition, whereas the young fishers lacked the long-lived experiences but their recollections were also based on information passed down to them through oral tradition. Most of the oral tradition was bound by cultural beliefs as alluded to by one fisher, aged 67 years old, during a focus group discussion:
“……In the past with such frequent occurrence of droughts, the elders of the clan would go and seek advice from the medium spirits and God. Droughts and floods were a form of punishment of some sort, but currently things have changed and believing in medium spirits was outdated, it is all about churches and praying to God……”
This experience has an effect on how the extreme events are defined, with the older individuals saying such events are normal but that the sensitivity of occurrences has increased. This is so because they have a reference point from their past. This was not the case for the young fishers, who claimed that these changes are not normal. Therefore, the frequent occurrences of these extreme events has made these fishers more vulnerable than in the past.
An example was also given for the lake level changes, as an indication of lower precipitation and extremely hot temperatures. The respondents cited that the place where we were conducting our interviews, which was 50–100 m from the shoreline, used to be underwater, but over the last 20–30 years, it has become dry land. In addition, some fishers have built houses in that area.
“……..If it was not for the drying of the lake we would not have a place to build our houses because we migrated to this area as fishers and getting land to settle as migrant fishers, is very difficult……..”
On the other hand, during a key informant interview with a male fisher on 15 November 2015, he reported “By now 30 years ago, we should have planted crops and the rains would have been falling with good intensity. Currently, it is very hot and dry and people are not even sure as to when the rains will fall”.

5.3. Analysis of Meteorological Data

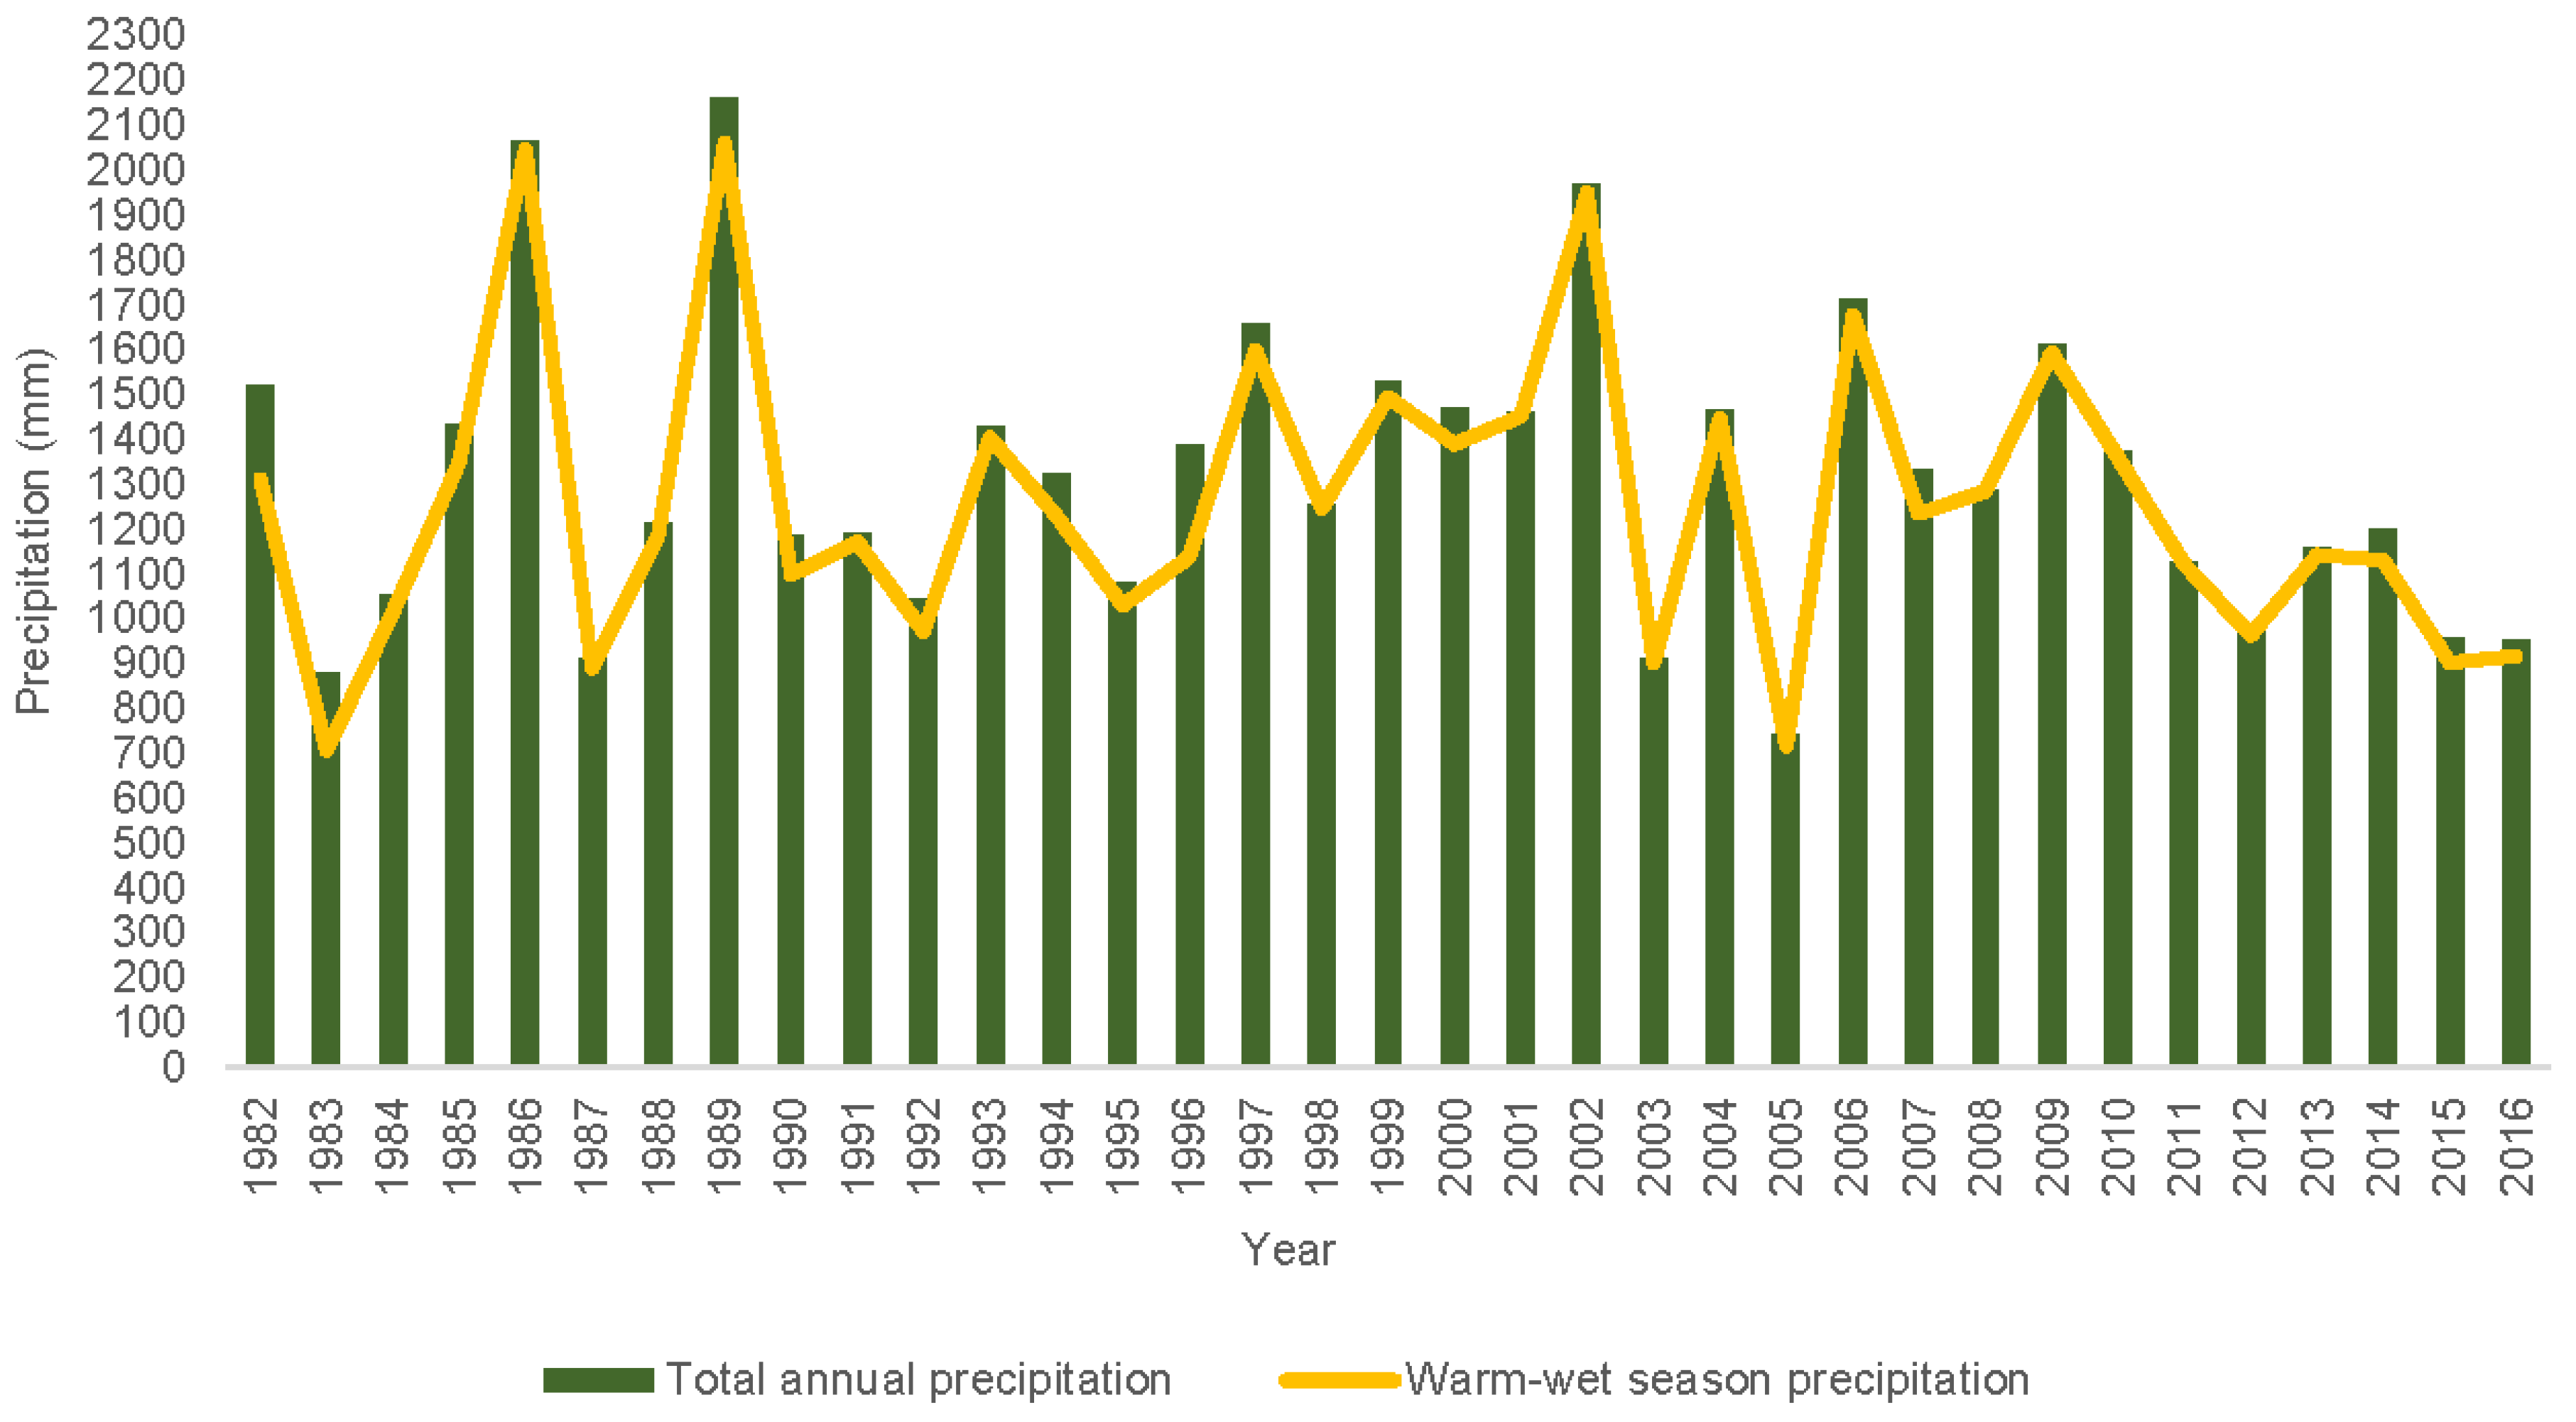
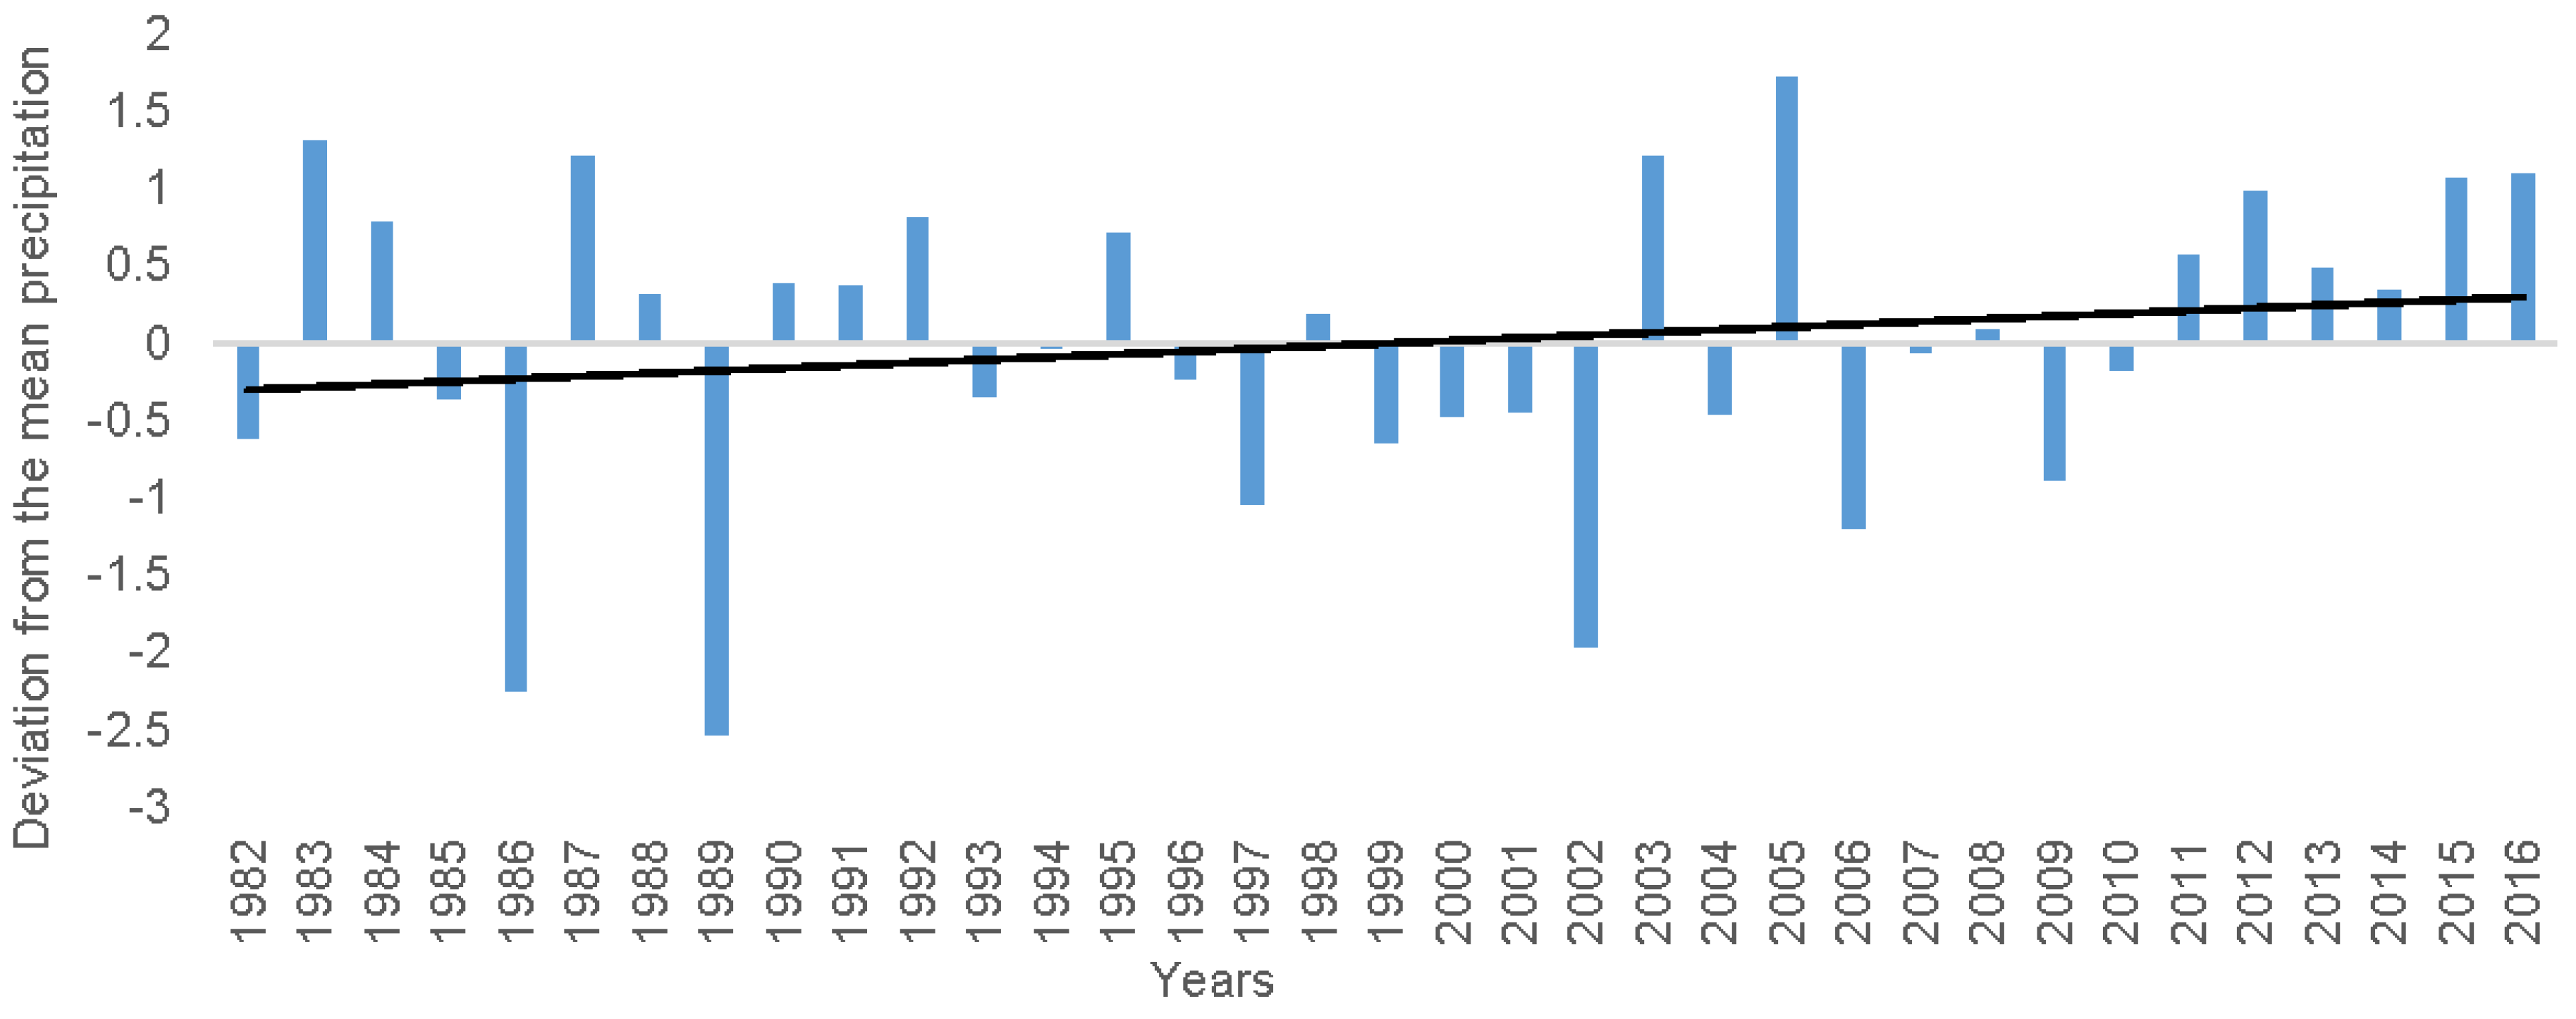
5.3.1. Precipitation
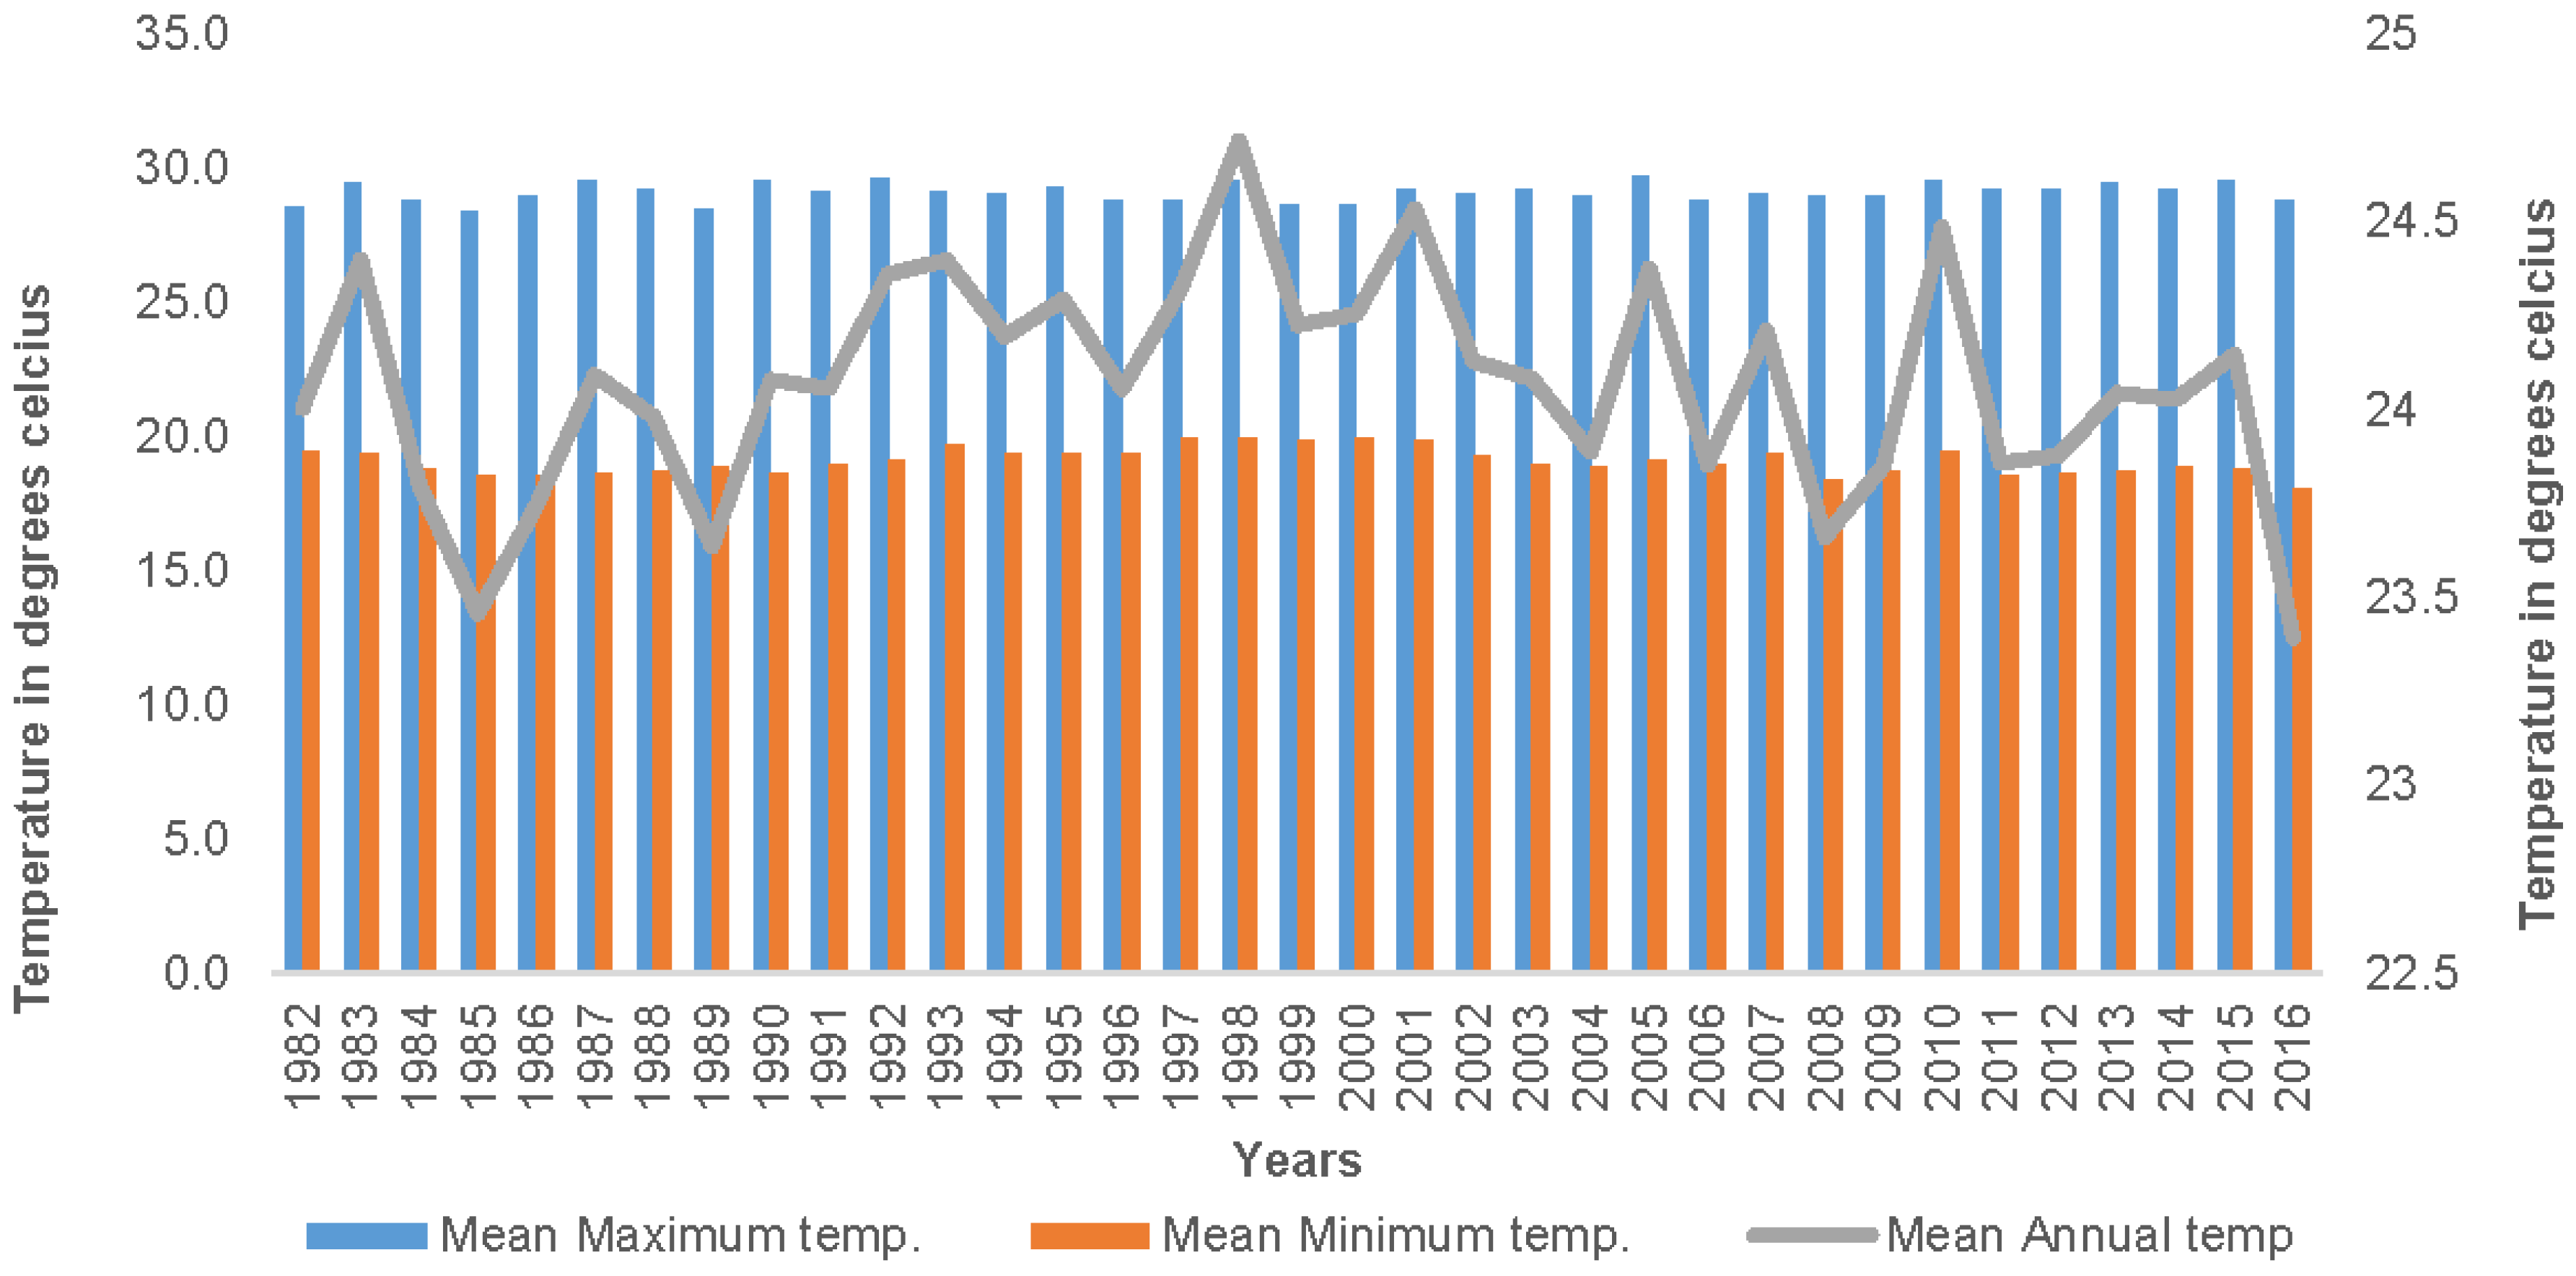
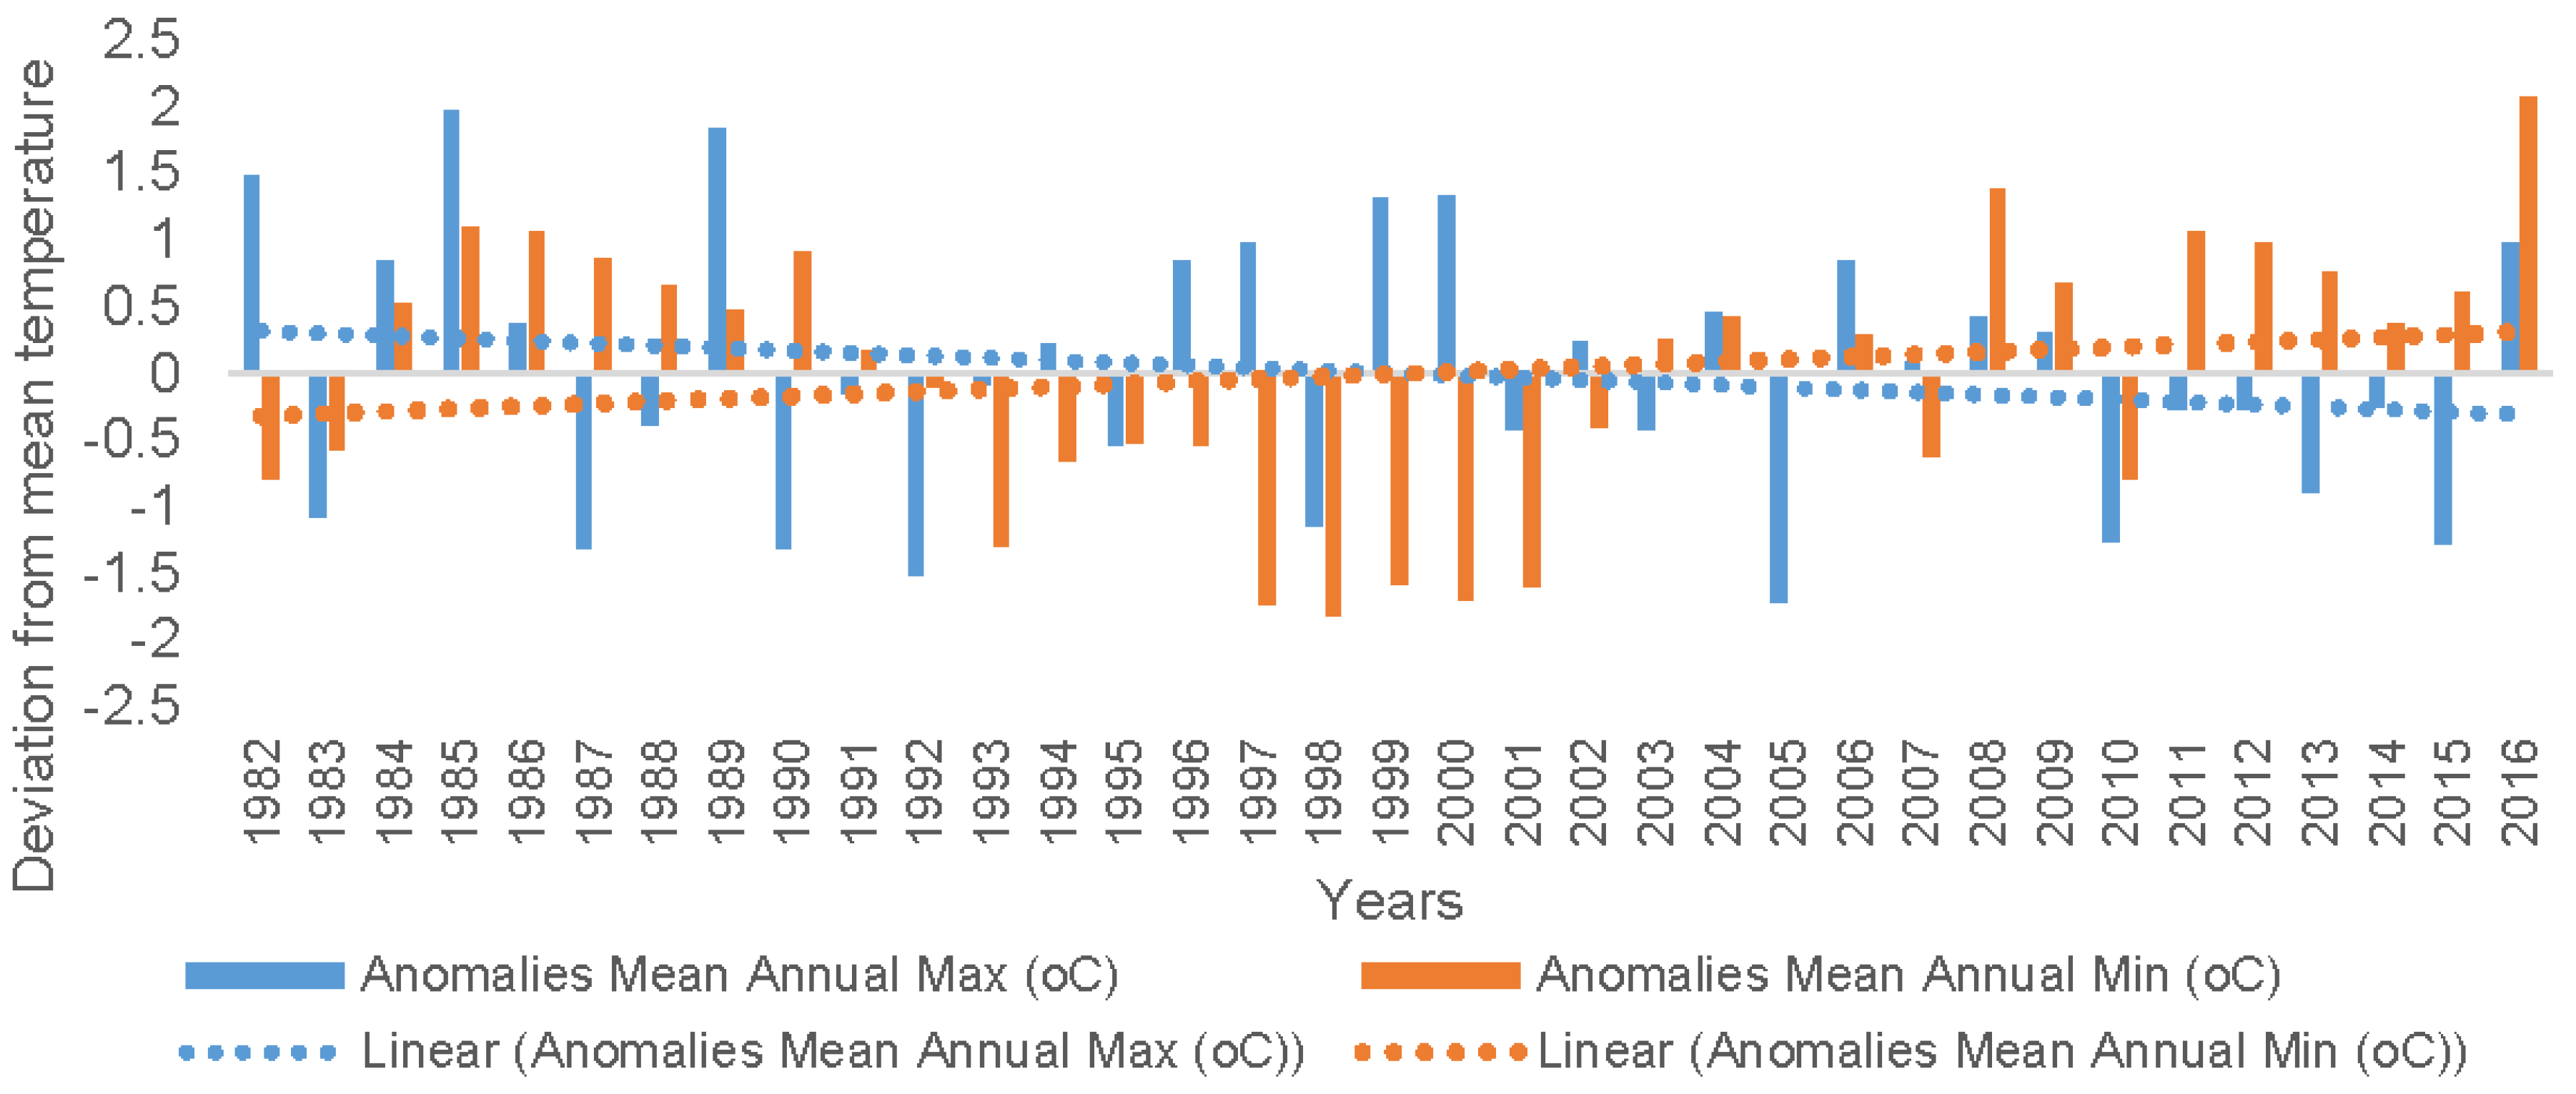
Contrary to the perceptions of the fishers, the results from the meteorological time series data showed that between 1982 and 2016, most of the annual precipitation (96%) fell between November and April which is the normal rainy season, while 3% fell between May and August and 1% fell between September and October. The Mann–Kendall (MK) trend test results showed a decrease in precipitation in the study area over time (Figure 3). These results were only statistically significant (Mann–Kendall (s) = −127 (p < 0.05) for the cool-dry winter season (May–August) which might illustrate interseasonal variability in annual precipitation.
The precipitation varied between 1982 and 2016, with the lowest (745 mm) and highest (2161 mm) values recorded in 2005 and 1989, respectively. The annual precipitation for the main rainy season (November–April) decreased by 6 mm per year compared to the total annual precipitation which also decreased by 4 mm per year between 1982 and 2016 (34 years). Despite the decreased precipitation rates between 1982 and 2016, there was an increase in the total annual precipitation (14 mm) for the warm-wet season (17 mm) between 1982 and 2002 (20 years). Although a large proportion of the fishers (>90%) reported decreased precipitation in the last 20 years, the results from the long time series of precipitation showed variable annual rates between the years.
The study further showed that the average number rainy days had decreased by 0.7 per year. The highest total number of rainy days (180 days) was recorded in 2000/2001, while the number of average rainy days for the 34-year period was 97 days. The precipitation anomaly for the study area (Figure 4) showed both negative and positive trends, reflecting variable precipitation.

5.3.2. Temperature

Some fishers (22%) perceived extremely hot temperatures, and the Mann–Kendall (MK) trend test also showed an increased maximum annual temperature by 0.007 °C and a decreased minimum annual temperature by 0.001 °C per year (Figure 5). However, the temperature results were not statistically significant (p > 0.05). The highest (29.7 °C) and lowest (28.4 °C) mean annual maximum temperatures were recorded in 2005, and 1985 and 1989, respectively. The highest temperature in 2005 coincided with lowest level of precipitation (745 mm) and there was a statistically significantly relationship between the two (r = −0.611, p < 0.01). This suggests that the high temperatures experienced by the respondents might have been due to increased rates of evapotranspiration.
The anomalies for maximum and minimum annual temperatures between 1982 and 2016 showed no defined trend (Figure 6). These results might be a reflection of a non-stable cooling or warming pattern in the study area.

5.4. Impact of the Perceived Climatic Changes on Fish Catches

Despite no significant trends in the meteorological data, there was significant association between the fishers’ perceptions on the changes in climate and fish catches (χ2 = 44.02, df = 20, p < 0.001). The majority of the fishers (89%) reported that the change in climate was the main driver of low fish catches and species composition changes. However, some fishers (10%) attributed low fish catches to overfishing and God’s plan (1%). The specific extreme weather events cited by the respondents as being responsible for low fish catches were increased incidences of drought (29%), erratic rainfall (29%), Mwera winds (27%), extreme hot temperatures (11%) and flooding (5%).
The majority (68%) of the fishers were experiencing changes in fish species composition and sizes compared to last 20 years. For example, some fishers reported that C. virginalis (31%), E. sardella (26%) and Oreochromis species (20%) used to be more important fish species in Nkhotakota 20 years ago compared to their present status.
An analysis of qualitative material revealed the existence of variations in reasons why the fishers were experiencing low fish catches and fish species composition changes. For example, during the qualitative interviews, some fishers cited the following reason: “..the fish have gone to the Mozambique side of the lake, running away from fishing pressure…..
Some respondents who had indigenous knowledge on the relationship between climate and fish catches explained how rainfall is related to fish catches, with more rainfall resulting into more fish catches. Furthermore, they explained that high temperatures also reduce Mwera winds, and more fish are caught because fishers are not hindered from fishing, because Mwera winds increase the risk of operating fishing boats.
The older respondents cited population increase as causing low fish catches, because too many fishers are fighting for too few fish. Therefore, fishers use illegal fishing gears because they have to survive. On responding to the question on the change of behaviour in fishing practice, the focus group discussions stated that not much is happening in the agricultural fields and many people are joining the fishing industry in order to survive.
The study showed that there were some disparities between quantitative and qualitative results. The quantitative output seemed to point to climate change as the major cause for low fish catches, whereas the same climate seemed to increase fish catches based on the qualitative analysis. Therefore, it is difficult to entirely validate such perceptions without a long-term assessment of climate and fish stocks.

5.5. Coping Strategies for Low Fish Catches and Determining Factors

The study showed that the majority (75%) of fishers had adjusted to other livelihood patterns in order to supplement fishing. The adjustment strategies included expanding their agricultural farming land, operating small businesses (small retail shops, buying and selling fish and farm produce) and providing labour services to agriculture and fisheries (Table 1). However, some fishers (25%) did not adjust to the perceived changes as they accepted the low fish catches.
Although some respondents did not adjust their livelihoods, most respondents (84%) had access to weather information, which guided them in terms of where and when to fish. The sources of information were diverse, with the majority (83%) accessing information through local radio stations and to a lesser extent, from churches/mosques (2%) and extension workers (1%). Despite some of the respondents getting the information from their churches/mosques, some respondents (77%) indicated that religious institutions had nothing in their teachings on climate change. Therefore, all respondents emphasized the need for the religious institutions to incorporate climate change into their teachings, in order to enhance the process of coping with the extreme weather events.
However, in the focus groups, we tried to follow up why these fishers had agriculture as a diversifying strategy, despite complaining about continued droughts. We also questioned how and why these fishers were engaged in providing casual labour in fisheries as a livelihood diversification strategy while they were complaining of low fish catches.
The respondents highlighted that relying on fishing alone is not enough, but sometimes they join other fishers’ boats as crew members as a way of diversifying income. They also hire out their fishing equipment while they concentrate on other income-generating activities like farming and providing labour in agriculture. On the other hand, their involvement in agriculture is related to winter cropping which uses residue moisture from the erratic rainfall, which does not fall during the main agricultural season.
The study also analysed factors, which influence fishers’ coping behaviour. The choice of the explanatory variables (Table 2) was based on available data and the current scientific literature [99,100,101,102]. Prior to conducting the logistic regression to determine which factors influence coping behavior, the relationships between the explanatory variables were assessed using bivariate correlations. The results of the correlations (Supplementary File S2) indicated significant relationships between some of the explanatory variables (age, sex, length of stay in the area, family size, fishing experience, fishing location, access to weather information, extreme temperature incidences, Mwera wind incidences, drought incidences and erratic rainfall incidences). For example, the age of the household head was positively correlated with the length of stay in the area, number of family dependents and experience in fishing. Such results suggest that an increase in age of the household head increases time stayed in the area and the fishing experience.
A logistic regression was then conducted to ascertain the effects of socioeconomics factors and incidences of extreme weather events on the probability that the fishers will cope with fish catch fluctuations. The estimated coefficients of the logistic regression are presented in Table 3 along with the levels of significance, standard errors and odds ratios (Exp (B)). The logistic regression model was statistically significant, χ2 = 9.15, df = 8, p < 0.001. The independent variables had adequate power to explain 52% (Nagelkerke R2) of the variation in coping with changes and correctly classified 85% of cases. These results suggest that the model developed may be used to determine the probability that a fisher will cope with changes related to fish catch.
Several factors which include the household head’s age, education, marital status, annual income and membership to a fish conversation club significantly influenced the ability to cope with fish catch changes. These factors were also statistically significantly different between the respondents who adjusted and those who did not.
The age of the household head (p < 0.01) and level of education (p < 0.1) were statistically significant with a positive coefficient suggesting an increase in age and education by one year, increased the probability of adjusting by a factor of 1.1, compared to those who did not adjust. While being married increased the propensity to adjust by almost 7-fold compared to single fishers. An increase in a unit of annual income increased the probability of adjusting by 2-fold. On the other hand, being a member of the fish conservation club reduced the propensity to adjust. These results reflect that the coping process was not homogeneous and was multidimensional.
In the qualitative analysis, it was observed that some of the factors that were shown to significantly affect coping behaviour are similar to those in the regression model. These factors included household income, age and education and these opened room for more coping options.

6. Discussion

6.1. Fishers’ Perceptions on Climate and Changes in Climate Variables

The respondents’ perceptions to extreme weather events could be attributed to their levels of exposure and experience [56,103,104]. The 20-year recall period used in this study was sufficient to validate the stated adverse weather events. The average age and fishing experience of the respondents provided sufficient platform to avoid perceptive reasoning challenges, which arise when trends are interpreted from a few recent events [46]. Age and fishing experience could be responsible for increasing the probability of recalling major climate incidences [105,106]. However, perception memories are reconstructions of forgoing schemes of clear pictures of how the world is viewed [47]. This means that what the fishers perceive to be climate change is not straightforward [107], and that is why time series meteorological data were used to validate such connections.
There were disparities between the perceptions of the fishers and the meteorological data. These disparities could be attributed to the ease of accurately describing changes over shorter periods of time compared to longer periods [108]. The majority of the respondents were fishers and farmers; therefore, they might have defined the climate to be abnormal as long it did not fit their agriculture calendar or resulted in low crop yields or low fish catches [43,46,66,109]. Therefore, memories related to livelihood failures might have been labelled as significant climate changes because knowledge obtained through direct perceptions is practical in nature and is based on what an environment offers for the fulfilment of the action in which the fishers were engaged in at the time [47].
It was difficult to validate the perceptions of the fishers on certain aspects of climate. However, the changes in rainfall pattern could be attributed to a shift in the prevailing rainfall and circulation regime for Malawi, resulting in reduced rainfall in mid-February [110], which is the main agricultural season. Our findings on the interseasonal and interannual rainfall variations are similar to those reported by Ngongondo et al. [111] for the Malawi’s entire rainfall pattern. The observed climate variations in this study could be a true reflection of the entire Southern Africa region. The weather pattern in this region is affected by the influx of the Southwestern Indian Ocean during spring, and the shift of the tropical temperate cloud band sea surface temperature (SST) from the central south Atlantic and off the coast of Southwest Africa [112,113,114].
Our findings further corroborate other studies in Malawi [109,115] that also reported conflicting messages between the perceptions of farmers and the time series climate data, and attributed these differences to the ease of remembering the occurrence of extreme climate events. However, contrary to our findings, Kalanda-Johua et al. [58] reported that the perceptions of farmers in the Mulanje district of Malawi were similar to the meteorological data, but these perceptions reflected climate variability just like in our study. The failure to ascertain the fishers’ perceptions as significant climatic changes could mean that the climate was variable [116].

6.2. Perceived Impact of Climate Change on Fish Catches

Our findings demonstrated the awareness of fishers’ knowledge on the causes of poor fish catches over time. One of the factors raised by the fishers was changes in climate (low precipitation, droughts and high temperatures). Despite the insignificant trends in our meteorological data, the perceived changes directly affect fish production [117,118,119,120,121,122]. For instance, high rainfall brings nutrient fluxes to the lake through rivers and boosts fish production [123]. High temperature and strong winds also facilitate primary production which makes food available for fish through water mixing [124]. Despite high temperatures being good for primary production, Lake Malawi has a complex circulation pattern in its surface temperature meaning that there is no well-defined temperature distribution pattern [125]. Furthermore, the respondents during the focus group discussions cited low lake levels as being another cause of low fish catches. However, in Lake Malawi, low lake levels increase the speciation process which increases fish abundance [126]. In general, these perceived changes have the capacity to increase fish catches and distribution, unlike in agriculture. Therefore, the fishers might have constructed their perceptions based on agricultural failures, because even though these respondents all own fishing gear, their main occupation was shown to be significantly different from their income source. This might mean they are part-time fishers but are predominantly farmers. Thus, the problem of low fish catches cannot be entirely attributed to the perceived changes in climate. The study also recognizes that a clear picture of the direct relationship between the perceived climate variables and fish catches can only be validated through modelling of the two, which was beyond the scope of this study.
Furthermore, the study also failed to attribute low fish catches to fishing location, because many fishers (76%) were operating in the deep offshore waters known to have a huge unexploited fish biomass [127], but they still experienced low fish catches. Therefore, the problem of low fish abundance could be distributed throughout the entire lake.
This study also noted an increase in unsustainable fishing gears, which includes small mesh sized nets without size selectivity for catching fish [128]. The reduced mesh sizes and increased fishing time observed in this study could be a sign of an overfished resource, as a response to decline in the large fish sizes at the top of the food web [129]. These results corroborate with [12,13,130,131] who all reported that Malawi fisheries are overexploited. Even though the use of small mesh sized nets is illegal in Malawi fisheries [97], fishers are still using them. This could be attributed to weak enforcement of the laws and also to the need to survive. However, our results also corroborate with Ha and van Dijk [132], who found that the violation of fishing regulations by Vietnamese fishers had caused resource decline. However, these results provide a platform to explore other livelihood sources for the fishers to deter unsustainable fishery exploitation. The observed behaviour of the fishers occurred due to their vulnerability, causing them to adopt and develop strategies to cope with the situation.

6.3. Coping Strategies for Low Fish Catches and Their Determinant Factors

Apart from the observed unsustainable fishing methods, the study also revealed that a proportion of the fishers (25%) had not changed their fishing behaviour. Failure to adjust to low fish catches despite having access to weather information, could be interpreted as the fisheries still being a major livelihood source. This corroborates with Bryan et al. [133] who found that not all farmers who had perceived climatic changes had adjusted their behaviour. Additionally [134] found that an increase in fishing dependency could be a sign of decreasing viability of agricultural livelihood opportunities, as small-scale fishers are opportunists, driven by fluctuating fish catches.
On the other hand, others (75%) expanded agricultural land, ventured into small businesses, and provided casual labour services to agriculture and fishing. The presence of many coping strategies and the ability to widen alternative strategies has been found to characterize fishers subjected to the effects of climate change [135]. However, small-scale fishers in Malawi are also known to have several coping strategies for low fish catches, which include farming and migrating to other fishing grounds [7,134,136,137]. The adjustment of livelihood sources in this study may be not permanent but rather, a diversification strategy as a response to low fish catches [7,138]. These strategies are meant to spread out efforts between the most profitable activities [137], which includes agriculture, a sector that is a basic source of income for over 80% of Malawians [139].
However, the decision to adjust behaviour due to low fish catches was influenced by the household head’s age, marital status, education level, annual income and membership to the fish conservation committee. All the coping strategies are labour-intensive and require physical strength, which older fishers are more likely to lack [140]. This study found that age increases the probability of adjusting. This could be the case because an increase in age is associated with having experience with practical solutions related to dealing with exposure to extreme weather events. These results corroborate with Bryan et al. [133], Pangapanga et al. [3] and Maddison [102], who conducted studies in Ethiopia, Malawi and several African countries, respectively, and also found that age significantly increases the propensity to adjust to the effects of climate change.
The study also observed that the magnitude of a fisher’s annual income increased the likelihood of adjusting. High income levels build adaptive capacity [141] that could enable fishers to diversify into other initiatives. Families with high income levels are responsive to climate change [142]. High income from fishing promotes the willingness to invest into other initiatives that provide a cushion against household emergencies caused by future low fish catches [143].
We also found out that education increases the probability of adjusting because education is normally positively correlated to access to climate information [102,133,142]. The more educated the fishers are, the more climate information they have; this is important in helping them to be forward-looking in their plans, compared to being reactional.
Furthermore, the reason why marital status was a significant factor could be the fact that the study area is predominant matrilineal [144]. In their study, Nagoli and Chiwona-Karltun [33] revealed that matrilineal systems affect coping strategies, as in most cases, men have to leave their households in search of green pastures. This practice improves the financial status of the family, as it supplements fishing incomes with remittances.
The study revealed that being a member of the fish conservation club reduced the probability of adjusting. This might be contrary to good steward practice in sustainable fisheries management where members of such clubs should be the ones spearheading conservation initiatives [145]. However, in this study, only 35% of those who adjusted were members of such clubs. Their persistence in fishing could be attributed to knowledge of the fishing locations where good stocks of fish can be exploited, as most of them stated that they fish in the offshore areas.
Despite the logistic regression model being correctly specified, some obvious variables (e.g., household size, household head sex) which are known to affect coping behaviour were not statistically significant (p > 0.05) [100,140,146]. For example, gender influences coping behaviour due to the different roles that men and women have to do, as determined by sociocultural constructs [147], like ownership of fishing gears and participation in other fishery-related activities [148]. Furthermore, this might explain why our sample size was biased towards men as the act of catching fish is male-dominated [149].

7. Conclusions

Fishers of Nkhotakota perceive that the climate has changed and in this study, they explained how this has affected their fishing behaviour. They perceive that they have experienced increased incidences of droughts, erratic rainfall, extremely hot temperatures, Mwera winds and flooding. However, these perceptions did not corroborate with time series meteorological data for the area, which reveals a variable climate and non-significant changes. Despite these perceived changes and low fish catches, fishing is still the main livelihood source. The study further failed to fully ascertain whether low fish catches are due to climate change, even though climate plays a major role in fish distribution. There is a need to model climate trends and fish catches to ascertain such a relationship. However, low fish catches could be influenced by the long-term use of destructive and unselective fishing gears, leading to overfishing. The results indicate the need to be cautious of how extreme weather events are defined and framed. This has implications for the development of local sustainable adaptation strategies, which rely on the use of perceptions.
This study has also shown that fishers have multiple livelihood strategies to cope with the experienced changes and this enhances their adaptive capacity. Fishers adjusted to low fish catches by expanding their agricultural farming land, running small businesses and providing casual labour services to farming and fishing. The ability to cope with such changes was strongly influenced by different socioeconomic factors. Despite the need for the fishers to adapt to the climate-related changes, the identified coping strategies might have negative long-term impacts on the availability of fish, which is still a cheap protein source in Malawi. Some of these choices for adjusting are not permanent and might not give the fishery room to return to its normal state. Therefore, either the fishers should be regulated through closed seasons or encouraged to use sustainable fishing methods, but this requires the Malawi Government to institute strong policies to control input targets for fisheries. A study of this nature could also be used to inform the management of other natural resource-based livelihoods when claims related to climate change are perceived to affect livelihoods.

Supplementary Materials

The following are available online at https://www.mdpi.com/2225-1154/6/2/34/s1, File S1: Household survey questionnaire, File S2: Correlation results for factors affecting adaptation to low fish catches.

Author Contributions

Moses Majid Limuwa was involved in designing the research, data collection and data analysis, and developing the manuscript. Bishal Kumar Sitaula and Trond Storebakken were involved significantly at each stage of the manuscript’s writing as well as in designing the study, field scoping, and in the review of the study tools. Friday Njaya reviewed the study tools and framing of the context in which the study was conducted and was also involved in reviewing of the manuscript.

Acknowledgments

This work was supported by the Norwegian Ministry of Foreign Affairs through funding to the Government of Malawi on the Capacity Building for Managing Climate Change Programme in Malawi (CABMACC) [Grant number MWI–2011-11/0007]. We would like to thank the Programmes Coordinating Office at the Lilongwe University of Agriculture and Natural Resources (LUANAR) for the support they provided in the technical planning of the field activities. Furthermore, we thank the field supervisors, enumerators, the local structures (District officials, Chiefs, fishers, beach village committees) for smooth facilitation of the field activities. We further recognise the role that Abel Musopole played in gathering time series climate data and special thanks to Late Ishmael Misinga on data handling; Dawit Gebregziabher Mekonen for the insight in the data analysis and Christopher Sinkonde for cartography services. Finally, we are thankful to the reviewers for their constructive comments in shaping this paper.

Conflicts of Interest

The authors declare no conflict of interest.

References

  1. Food and Agriculture Organization (FAO). 2016 the State of Food and Agriculture: Climate Change, Agriculture and Food Security; FAO: Rome, Italy, 2016; p. 194. [Google Scholar]
  2. Smith, J.B.; Klein, R.J.; Huq, S. Climate Change, Adaptive Capacity and Development; Imperial College Press: London, UK, 2003. [Google Scholar]
  3. Pangapanga, P.I.; Jumbe, C.B.; Kanyanda, S.; Thangalimodzi, L. Unravelling strategic choices towards droughts and floods’ adaptation in southern Malawi. Int. J. Disaster Risk Reduct. 2012, 2, 57–66. [Google Scholar] [CrossRef]
  4. Droppelmann, K.; Makuwira, J.; Kumwenda, I. All Eggs in One Basket: A Reflection on Malawi’s Dependence on Agricultural Growth Strategy; IFPRI: Washington, DC, USA, 2012; p. 36. [Google Scholar]
  5. Government of Malawi (GoM). Malawi Growth and Development Strategy (Mgds III) (2017–2022): Building a Productive, Competitive and Resilient Nation; Ministry of Finance, Economic Planning and Development: Lilongwe, Malawi, 2017.
  6. Chidanti-Malunga, J. Adaptive strategies to climate change in southern Malawi. Phys. Chem. Earth Parts A/B/C 2011, 36, 1043–1046. [Google Scholar] [CrossRef]
  7. Mvula, P.M. Fluctuating Fisheries and Rural Livelihoods at Lake Malawi. Ph.D. Thesis, University of East Anglia, Norwich, UK, 2002. [Google Scholar]
  8. Mills, D.J.; Westlund, L.; de Graaf, G.; Kura, Y.; Willman, R.; Kelleher, K. Under-Reported and Undervalued: Small-Scale Fisheries in the Developing World; CABI: Wallingford, UK, 2010. [Google Scholar]
  9. Smith, L.E.; Khoa, S.N.; Lorenzen, K. Livelihood functions of inland fisheries: Policy implications in developing countries. Water Policy 2005, 7, 359–383. [Google Scholar]
  10. Government of Malawi (GoM). National Fisheries and Aquaculture Policy; Department of Fisheries: Lilongwe, Malawi, 2016; p. 23.
  11. Tweddle, D.; Lewis, D. The biology of usipa (Engraulicypris sardella) in relation to fluctuations in productivity of Lake Malawi and species introductions. Collect. Rep. Fish. Res. Malawi Occas Pap. 1990, 1, 67–72. [Google Scholar]
  12. Weyl, O.; Mwakiyongo, K.; Mandere, D. An assessment of the nkacha net fishery of Lake Malombe, Malawi. Afr. J. Aquat. Sci. 2004, 29, 47–55. [Google Scholar] [CrossRef]
  13. Tweddle, D.; Cowx, I.; Peel, R.; Weyl, O. Challenges in fisheries management in the Zambezi, one of the great rivers of Africa. Fish. Manag. Ecol. 2015, 22, 99–111. [Google Scholar] [CrossRef]
  14. Weyl, O. Artisanal Fishery Catch-Assessment for the South-East Arm of Lake Malawi, 1994–1998; NARMAP Technical Report; Department of Fisheries: Lilongwe, Malawi, 1999.
  15. Weyl, O.; Nyasulu, T.; Rusuwa, B. Assessment of catch, effort and species changes in the pair-trawl fishery of southern Lake Malawi, Malawi, Africa. Fish. Manag. Ecol. 2005, 12, 395–402. [Google Scholar] [CrossRef]
  16. Van Zwieten, P.; Njaya, F.; Weyl, O. Effort Development and the Collapse of the Fisheries of Lake Malombe: Does Environmental Variability Matter? FAO Fisheries Technical Paper; FAO: Rome, Italy, 2003; pp. 132–164. [Google Scholar]
  17. Brander, K. Impacts of climate change on fisheries. J. Mar. Syst. 2010, 79, 389–402. [Google Scholar] [CrossRef]
  18. Cochrane, K.; De Young, C.; Soto, D.; Bahri, T. Climate Change Implications for Fisheries and Aquaculture; FAO Fisheries and Aquaculture Technical Paper; FAO: Rome, Italy, 2009; Volume 530, p. 212. [Google Scholar]
  19. Badjeck, M.-C.; Allison, E.H.; Halls, A.S.; Dulvy, N.K. Impacts of climate variability and change on fishery-based livelihoods. Mar. Policy 2010, 34, 375–383. [Google Scholar] [CrossRef]
  20. Poulard, J.-C.; Blanchard, F. The impact of climate change on the fish community structure of the eastern continental shelf of the Bay of Biscay. ICES J. Mar. Sci. 2005, 62, 1436–1443. [Google Scholar] [CrossRef]
  21. Cheung, W.W.; Lam, V.W.; Sarmiento, J.L.; Kearney, K.; Watson, R.; Pauly, D. Projecting global marine biodiversity impacts under climate change scenarios. Fish Fish. 2009, 10, 235–251. [Google Scholar] [CrossRef]
  22. McSweeney, C.; Lizcano, G.; New, M.; Lu, X. The UNDP climate change country profiles: Improving the accessibility of observed and projected climate information for studies of climate change in developing countries. Bull. Am. Meteorol. Soc. 2010, 91, 157–166. [Google Scholar] [CrossRef]
  23. Gama, A.C.; Mapemba, L.D.; Masikat, P.; Tui, S.H.-K.; Crespo, O.; Bandason, E. Modeling Potential Impacts of Future Climate Change in Mzimba District, Malawi, 2040–2070: An Integrated Biophysical and Economic Modeling Approach; International Food Policy Research Institute: Washington, DC, USA, 2014; Volume 8. [Google Scholar]
  24. Phiri, I.M.G.; Saka, A.R. The impact of changing environmental conditions on vulnerable communities in the Shire Valley, southern Malawi. In The Future of Drylands; Springer: Berlin, Germany, 2008; pp. 545–559. [Google Scholar]
  25. Saka, J.D.; Siable, P.; Hachigonta, S.; Sibanda, L.M. Southern African Agriculture and Climate Change: A Comprehensive Analysis-Malawi; International Food Policy Research Institute: Washington, DC, USA, 2012. [Google Scholar]
  26. Stevens, T.; Madani, K. Future climate impacts on maize farming and food security in Malawi. Sci. Rep. 2016, 6. [Google Scholar] [CrossRef] [PubMed]
  27. Zinyengere, N.; Crespo, O.; Hachigonta, S.; Tadross, M. Local impacts of climate change and agronomic practices on dry land crops in southern Africa. Agric. Ecosyst. Environ. 2014, 197, 1–10. [Google Scholar] [CrossRef]
  28. Vollmer, M.K.; Bootsma, H.A.; Hecky, R.E.; Patterson, G.; Halfman, J.D.; Edmond, J.M.; Eccles, D.H.; Weiss, R.F. Deep-water warming trend in Lake Malawi. Am. Soc. Limnol. Oceanogr. 2005, 50, 727–732. [Google Scholar] [CrossRef]
  29. Makwinja, R.; M’balaka, M. Potential impact of climate change on Lake Malawi chambo (Oreochromis spp.). J. Ecosyst. Ecogr. 2017, 6, 1–5. [Google Scholar]
  30. O’Reilly, C.M.; Alin, S.R.; Plisnier, P.-D.; Cohen, A.S.; McKee, B.A. Climate change decreases aquatic ecosystem productivity of Lake Tanganyika, Africa. Nature 2003, 424, 766–768. [Google Scholar] [CrossRef] [PubMed]
  31. Verburg, P.; Hecky, R.E.; Kling, H. Ecological consequences of a century of warming in Lake Tanganyika. Science 2003, 301, 505–507. [Google Scholar] [CrossRef] [PubMed]
  32. Jørstad, H.; Webersik, C. Vulnerability to climate change and adaptation strategies of local communities in Malawi: Experiences of women fish-processing groups in the Lake Chilwa Basin. Earth Syst. Dyn. 2016, 7, 977–989. [Google Scholar] [CrossRef]
  33. Nagoli, J.; Chiwona-Karltun, L. Uncovering human social networks in coping with Lake Chilwa recessions in Malawi. J. Environ. Manag. 2017, 192, 134–141. [Google Scholar] [CrossRef] [PubMed]
  34. Eriksen, S.; Aldunce, P.; Bahinipati, C.S.; Martins, R.D.A.; Molefe, J.I.; Nhemachena, C.; O’brien, K.; Olorunfemi, F.; Park, J.; Sygna, L. When not every response to climate change is a good one: Identifying principles for sustainable adaptation. Clim. Dev. 2011, 3, 7–20. [Google Scholar] [CrossRef]
  35. Halsnæs, K.; Shukla, P.; Garg, A. Sustainable development and climate change: Lessons from country studies. Clim. Policy 2008, 8, 202–219. [Google Scholar] [CrossRef]
  36. Folke, C.; Carpenter, S.; Elmqvist, T.; Gunderson, L.; Holling, C.S.; Walker, B. Resilience and sustainable development: Building adaptive capacity in a world of transformations. AMBIO A J. Hum. Environ. 2002, 31, 437–440. [Google Scholar] [CrossRef]
  37. Smit, B.; Wandel, J. Adaptation, adaptive capacity and vulnerability. Glob. Environ. Chang. 2006, 16, 282–292. [Google Scholar] [CrossRef]
  38. Taylor, J.G.; Stewart, T.R.; Downton, M. Perceptions of drought in the Ogallala Aquifer region. Environ. Behav. 1988, 20, 150–175. [Google Scholar] [CrossRef]
  39. McCarthy, J.J.; Canziani, O.F.; Leary, N.A.; Dokken, D.J.; White, K.S. Climate Change 2001: Impacts, Adaptation, and Vulnerability: Contribution of Working Group II to the Third Assessment Report of the Intergovernmental Panel on Climate Change; Cambridge University Press: Cambridge, UK, 2001. [Google Scholar]
  40. Füssel, H. Vulnerability: A generally applicable conceptual framework for climate change research. Glob. Environ. Chang. 2007, 17, 155–167. [Google Scholar] [CrossRef]
  41. Allison, E.H.; Perry, A.L.; Badjeck, M.C.; Neil Adger, W.; Brown, K.; Conway, D.; Halls, A.S.; Pilling, G.M.; Reynolds, J.D.; Andrew, N.L. Vulnerability of national economies to the impacts of climate change on fisheries. Fish Fish. 2009, 10, 173–196. [Google Scholar] [CrossRef]
  42. ŽUROVEC, O.; Čadro, S.; Sitaula, B.K. Quantitative assessment of vulnerability to climate change in rural municipalities of Bosnia and Herzegovina. Sustainability 2017, 9, 1208. [Google Scholar] [CrossRef]
  43. Slegers, M.F. “If only it would rain”: Farmers’ perceptions of rainfall and drought in semi-arid central Tanzania. J. Arid Environ. 2008, 72, 2106–2123. [Google Scholar] [CrossRef]
  44. Allen, T.; Prosperi, P. Modeling sustainable food systems. Environ. Manag. 2016, 57, 956–975. [Google Scholar] [CrossRef] [PubMed]
  45. Eagly, A.H.; Chaiken, S. The Psychology of Attitudes; Harcourt Brace Jovanovich College Publishers: Fort Worth, TX, USA, 1993. [Google Scholar]
  46. Grothmann, T.; Patt, A. Adaptive capacity and human cognition: The process of individual adaptation to climate change. Glob. Environ. Chang. 2005, 15, 199–213. [Google Scholar] [CrossRef]
  47. Ingold, T. The Perception of the Environment: Essays on Livelihood, Dwelling and Skill; Routledge: New York, NY, USA, 2000. [Google Scholar]
  48. Heathcote, R. Drought in Australia: A problem of perception. Geogr. Rev. 1969, 59, 175–194. [Google Scholar] [CrossRef]
  49. Gibson, J. The Ecological Theory of Visual Perception; Houghlon Mifflin: Boston, MA, USA, 1979. [Google Scholar]
  50. Smit, B.; Pilifosova, O. Adaptation to climate change in the context of sustainable development and equity. Sustain. Dev. 2003, 8, 9–40. [Google Scholar]
  51. Smit, B.; Pilifosova, O. From adaptation to adaptive capacity and vulnerability reduction. In Climate Change, Adaptive Capacity and Development; World Scientific: Singapore, 2003; pp. 9–28. [Google Scholar]
  52. Vedwan, N.; Rhoades, R.E. Climate change in the western Himalayas of India: A study of local perception and response. Clim. Res. 2001, 19, 109–117. [Google Scholar] [CrossRef]
  53. Leiserowitz, A. Climate change risk perception and policy preferences: The role of affect, imagery, and values. Clim. Chang. 2006, 77, 45–72. [Google Scholar] [CrossRef]
  54. Patt, A.G.; Schröter, D. Perceptions of climate risk in Mozambique: Implications for the success of adaptation strategies. Glob. Environ. Chang. 2008, 18, 458–467. [Google Scholar] [CrossRef]
  55. Apata, T.G.; Samuel, K.; Adeola, A. Analysis of climate change perception and adaptation among arable food crop farmers in South Western Nigeria. In Proceedings of the International Association of Agricultural Economists’ 2009 Conference, Beijing, China, 16–22 August 2009; pp. 16–22. [Google Scholar]
  56. Dessai, S.; Sims, C. Public perception of drought and climate change in southeast England. Environ. Hazards 2010, 9, 340–357. [Google Scholar] [CrossRef]
  57. Deressa, T.; Hassan, R.; Ringler, C. Perception of and adaptation to climate change by farmers in the Nile Basin of Ethiopia. J. Agric. Sci. 2011, 149, 23–31. [Google Scholar] [CrossRef]
  58. Kalanda-Joshua, M.; Ngongondo, C.; Chipeta, L.; Mpembeka, F. Integrating indigenous knowledge with conventional science: Enhancing localised climate and weather forecasts in Nessa, Mulanje, Malawi. Phys. Chem. Earth Parts A/B/C 2011, 36, 996–1003. [Google Scholar] [CrossRef]
  59. Osbahr, H.; Dorward, P.; Stern, R.; Cooper, S. Supporting agricultural innovation in Uganda to respond to climate risk: Linking climate change and variability with farmer perceptions. Exp. Agric. 2011, 47, 293–316. [Google Scholar] [CrossRef]
  60. Mubaya, C.P.; Njuki, J.; Mutsvangwa, E.P.; Mugabe, F.T.; Nanja, D. Climate variability and change or multiple stressors? Farmer perceptions regarding threats to livelihoods in Zimbabwe and Zambia. J. Environ. Manag. 2012, 102, 9–17. [Google Scholar] [CrossRef] [PubMed]
  61. Ogalleh, S.A.; Vogl, C.R.; Eitzinger, J.; Hauser, M. Local perceptions and responses to climate change and variability: The case of Laikipia district, Kenya. Sustainability 2012, 4, 3302–3325. [Google Scholar] [CrossRef]
  62. Amos, E.; Akpan, U.; Ogunjobi, K. Households’ perception and livelihood vulnerability to climate change in a coastal area of Akwa Ibom state, Nigeria. Environ. Dev. Sustain. 2015, 17, 887–908. [Google Scholar] [CrossRef]
  63. Chingala, G.; Mapiye, C.; Raffrenato, E.; Hoffman, L.; Dzama, K. Determinants of smallholder farmers’ perceptions of impact of climate change on beef production in Malawi. Clim. Chang. 2017, 142, 129–141. [Google Scholar] [CrossRef]
  64. O’Brien, K.; Eriksen, S.; Nygaard, L.P.; Schjolden, A. Why different interpretations of vulnerability matter in climate change discourses. Clim. Policy 2007, 7, 73–88. [Google Scholar] [CrossRef]
  65. McSweeney, C.; New, M.; Lizcano, G. UNDP Climate Change Country Profile: Malawi; United Nations Development Programme: New York, NY, USA, 2012; p. 27. [Google Scholar]
  66. Moyo, M.; Mvumi, B.M.; Kunzekweguta, M.; Mazvimavi, K.; Craufurd, P.; Dorward, P. Farmer perceptions on climate change and variability in semi-arid Zimbabwe in relation to climatology evidence. Afr. Crop Sci. J. 2012, 20, 317–335. [Google Scholar]
  67. Seehausen, O.; Knight, M.E.; Allender, C.J.; Robinson, R.L. How many species of Cichlid fishes are there in African lakes? Mol. Ecol. 2001, 10, 793–806. [Google Scholar]
  68. Government of Malawi (GoM). Malawi Population and Housing Census Preliminary Report; National Statistical Office (NSO): Zomba, Malawi, 2008; p. 23.
  69. Government of Malawi (GoM). Nkhotakota District Social Economic Profile; Nkhotakota District Council: Lilongwe, Malawi, 2010; p. 168.
  70. Government of Malawi (GoM). Malawi’s National Adaptation Programmes of Action (Napa) under the United Nations Framework Convention on Climate Change (UNFCCC), 1st ed.; Ministry of Mines, Natural Resources and Environment, Environmental Affairs Office: Lilongwe, Malawi, 2006; p. 58.
  71. Government of Malawi (GoM). Annual frame survey report of the small-scale fisheries. In Fisheries Bulletin 72; Department of Fisheries: Lilongwe, Malawi, 2015. [Google Scholar]
  72. Sipawe, R.; Namoto, W.; Mponda, O.; Bay, M. Analysis of Catch and Effort Data for the Fisheries of Nkhotakota 1976–1999; Fisheries Bulletin; Government of Malawi, Department of Fisheries: Lilongwe, Malawi, 2001.
  73. Creswell, J.W. Research Design: Qualitative, Quantitative and Mixed Methods Approaches, 4th ed.; Sage: Los Angeles, CA, USA, 2014; p. 273. [Google Scholar]
  74. Teddlie, C.; Yu, F. Mixed methods sampling: A typology with examples. J. Mixed Methods Res. 2007, 1, 77–100. [Google Scholar] [CrossRef]
  75. Kakota, T.; Nyariki, D.; Mkwambisi, D.; Kogi-Makau, W. Gender vulnerability to climate variability and household food insecurity. Clim. Dev. 2011, 3, 298–309. [Google Scholar] [CrossRef]
  76. Martin, S.M.; Lorenzen, K.; Bunnefeld, N. Fishing farmers: Fishing, livelihood diversification and poverty in rural Laos. Hum. Ecol. 2013, 41, 737–747. [Google Scholar] [CrossRef]
  77. Bryman, A. Social Research Methods, 4th ed.; Oxford University Press: New York, NY, USA, 2012; p. 809. [Google Scholar]
  78. Mosberg, M.; Eriksen, S.H. Responding to climate variability and change in dryland Kenya: The role of illicit coping strategies in the politics of adaptation. Glob. Environ. Chang. 2015, 35, 545–557. [Google Scholar] [CrossRef]
  79. Levy, P.; Lemeshow, S. Sampling of populations: Methods and applications; John Wiley & Sons: New York, NY, USA, 1999; p. 567. [Google Scholar]
  80. Maxwell, J.A. Qualitative Research Design: An Interactive Approach: An Interactive Approach; Sage: Los Angeles, CA, USA, 2013; Volume 41. [Google Scholar]
  81. Moustakas, C. Phenomenological Research Methods; Sage: Los Angeles, CA, USA, 1994. [Google Scholar]
  82. Patton, M.Q. Qualitative Evaluation and Research Methods; SAGE Publications, Inc: Los Angeles, CA, USA, 1990. [Google Scholar]
  83. Kibue, G.W.; Liu, X.; Zheng, J.; Pan, G.; Li, L.; Han, X. Farmers’ perceptions of climate variability and factors influencing adaptation: Evidence from Anhui and Jiangsu, China. Environ. Manag. 2016, 57, 976–986. [Google Scholar] [CrossRef] [PubMed]
  84. Musinguzi, L.; Efitre, J.; Odongkara, K.; Ogutu-Ohwayo, R.; Muyodi, F.; Natugonza, V.; Olokotum, M.; Namboowa, S.; Naigaga, S. Fishers’ perceptions of climate change, impacts on their livelihoods and adaptation strategies in environmental change hotspots: A case of Lake Wamala, Uganda. Environ. Dev. Sustain. 2015, 18, 1–19. [Google Scholar] [CrossRef]
  85. Braun, V.; Clarke, V. Using thematic analysis in psychology. Qual. Res. Psychol. 2006, 3, 77–101. [Google Scholar] [CrossRef]
  86. Mkonda, M.Y.; He, X. Vulnerability assessment of the livelihoods in Tanzania’s semi-arid agro-ecological zone under climate change scenarios. Climate 2018, 6, 1–14. [Google Scholar] [CrossRef]
  87. Li, R.-L.; Geng, S. Impacts of climate change on agriculture and adaptive strategies in China. J. Integr. Agric. 2013, 12, 1402–1408. [Google Scholar] [CrossRef]
  88. Nigatu, A.S.; Asamoah, B.O.; Kloos, H. Knowledge and perceptions about the health impact of climate change among health sciences students in Ethiopia: A cross-sectional study. BMC Public Health 2014, 14, 1. [Google Scholar] [CrossRef] [PubMed]
  89. Kendall, M. Multivariate Analysis; Charles Griffin: London, UK, 1975. [Google Scholar]
  90. Mann, H.B. Nonparametric tests against trend. Econom. J. Econom. Soc. 1945, 13, 245–259. [Google Scholar] [CrossRef]
  91. Pingale, S.M.; Khare, D.; Jat, M.K.; Adamowski, J. Trend analysis of climatic variables in an arid and semi-arid region of the Ajmer district, Rajasthan, India. J. Water Land Dev. 2016, 28, 3–18. [Google Scholar] [CrossRef]
  92. Von Storch, H. Misuses of statistical analysis in climate research. In Analysis of Climate Variability; Springer: Berlin, Germany, 1999; pp. 11–26. [Google Scholar]
  93. Yue, S.; Pilon, P.; Phinney, B.; Cavadias, G. The influence of autocorrelation on the ability to detect trend in hydrological series. Hydrol. Process. 2002, 16, 1807–1829. [Google Scholar] [CrossRef]
  94. Nkomwa, E.C.; Joshua, M.K.; Ngongondo, C.; Monjerezi, M.; Chipungu, F. Assessing indigenous knowledge systems and climate change adaptation strategies in agriculture: A case study of Chagaka village, Chikhwawa, Southern Malawi. Phys. Chem. Earth Parts A/B/C 2014, 67, 164–172. [Google Scholar] [CrossRef]
  95. Hosmer, D.W., Jr.; Lemeshow, S.; Sturdivant, R.X. Applied Logistic Regression; John Wiley & Sons: New York, NY, USA, 2013; Volume 398. [Google Scholar]
  96. Field, A. Discovering Statistics Using IBM Spss Statistics; Sage: London, UK, 2013. [Google Scholar]
  97. Banda, M.C. Lake Malawi Gillnet Fishery Management Policy Brief; Fisheries Research Unit: Monkey Bay, Mangochi, Malawi, 2009; p. 19. [Google Scholar]
  98. FAO. Fisheries Management in the South-East Arm of Lake Malawi, the Upper Shire and Lake Malombe, with Particular Reference to the Fisheries on Chambo (Oreochromis spp); FAO: Rome, Italy, 1993; Volume 21. [Google Scholar]
  99. Deressa, T.T.; Hassan, R.M.; Ringler, C.; Alemu, T.; Yesuf, M. Determinants of farmers’ choice of adaptation methods to climate change in the Nile Basin of Ethiopia. Glob. Environ. Chang. 2009, 19, 248–255. [Google Scholar] [CrossRef]
  100. Gaspare, L.; Bryceson, I.; Mgaya, Y. Temporal and spatial trends in size, biomass and abundance of groupers (Epinephelinae) in Mafia Island Marine Park: Fishers’ perceptions and underwater visual census surveys. Fish. Manag. Ecol. 2015, 22, 337–348. [Google Scholar] [CrossRef]
  101. Islam, M.M.; Sallu, S.; Hubacek, K.; Paavola, J. Limits and barriers to adaptation to climate variability and change in Bangladeshi coastal fishing communities. Mar. Policy 2014, 43, 208–216. [Google Scholar] [CrossRef]
  102. Maddison, D.J. The Perception of and Adaptation to Climate Change in Africa; World Bank: Washington, DC, USA, 2007; p. 51. [Google Scholar]
  103. Le Dang, H.; Li, E.; Bruwer, J.; Nuberg, I. Farmers’ perceptions of climate variability and barriers to adaptation: Lessons learned from an exploratory study in Vietnam. Mitig. Adapt. Strateg. Glob. Chang. 2014, 19, 531–548. [Google Scholar]
  104. Patt, G.P.; Schröter, D.; de la Vega–Leinat, A.C.; Klein, R.J.T. (Eds.) Research and assessment to support adaptation and mitigation: Common themes from the diversity of approaches. In Assessing Vulnerability to Global Environmental Change. Making Research Useful for Decision Making and Policy; Earthscan: London, UK, 2009; pp. 1–25. [Google Scholar]
  105. Tversky, A.; Kahneman, D. Availability: A heuristic for judging frequency and probability. Cognit. Psychol. 1973, 5, 207–232. [Google Scholar] [CrossRef]
  106. Marx, S.M.; Weber, E.U.; Orlove, B.S.; Leiserowitz, A.; Krantz, D.H.; Roncoli, C.; Phillips, J. Communication and mental processes: Experiential and analytic processing of uncertain climate information. Glob. Environ. Chang. 2007, 17, 47–58. [Google Scholar] [CrossRef]
  107. Broadhead, L.A.; Howard, S. Deepening the debate over ‘sustainable science’: Indigenous perspectives as a guide on the journey. Sustain. Dev. 2011, 19, 301–311. [Google Scholar] [CrossRef]
  108. Orlove, B.; Roncoli, C. Integration of Climate Information from Multiple Sources through Group Discussion in Ugandan farm Communities; Center for Research on Environmental Decisions, Columbia University: New York, NY, USA, 2006. [Google Scholar]
  109. Simelton, E.; Quinn, C.H.; Batisani, N.; Dougill, A.J.; Dyer, J.C.; Fraser, E.D.; Mkwambisi, D.; Sallu, S.; Stringer, L.C. Is rainfall really changing? Farmers’ perceptions, meteorological data, and policy implications. Clim. Dev. 2013, 5, 123–138. [Google Scholar]
  110. Nicholson, S.; Klotter, D.; Chavula, G. A detailed rainfall climatology for Malawi, Southern Africa. Int. J. Climatol. 2014, 34, 315–325. [Google Scholar] [CrossRef]
  111. Ngongondo, C.; Xu, C.-Y.; Gottschalk, L.; Alemaw, B. Evaluation of spatial and temporal characteristics of rainfall in Malawi: A case of data scarce region. Theor. Appl. Climatol. 2011, 106, 79–93. [Google Scholar] [CrossRef]
  112. Shongwe, M.; Van Oldenborgh, G.; Van Den Hurk, B.; De Boer, B.; Coelho, C.; Van Aalst, M. Projected changes in mean and extreme precipitation in Africa under global warming. Part I: Southern Africa. J. Clim. 2009, 22, 3819–3837. [Google Scholar] [CrossRef]
  113. Tirivarombo, S.; Hughes, D. Regional droughts and food security relationships in the Zambezi River Basin. Phys. Chem. Earth Parts A/B/C 2011, 36, 977–983. [Google Scholar] [CrossRef]
  114. Williams, A.P.; Funk, C. A westward extension of the warm pool leads to a westward extension of the walker circulation, drying Eastern Africa. Clim. Dyn. 2011, 37, 2417–2435. [Google Scholar] [CrossRef]
  115. Kasulo, V.; Chikagwa-Malunga, S.; Chagunda, M.; Roberts, D. The perceived impact of climate change and variability on smallholder dairy production in northern Malawi. Afr. J. Agric. Res. 2012, 7, 4830–4837. [Google Scholar] [CrossRef]
  116. Agard, J.; Schipper, E.; Birkmann, J.; Campos, M.; Dubeux, C.; Nojiri, Y.; Olsson, L.; Osman-Elasha, B.; Pelling, M.; Prather, M. Annex II: Glossary. Clim. Chang. 2014, 7, 1757–1776. [Google Scholar]
  117. Kolding, J.; van Zwieten, P.; Marttin, F.; Poulain, F. Fisheries in the Drylands of Sub-Saharan Africa “Fish Come with the Rains”; FAO Fisheries and Aquaculture Circular No. 1118; FAO: Rome, Italy, 2016; p. 64. [Google Scholar]
  118. Kolding, J.; van Zwieten, P.A. Relative lake level fluctuations and their influence on productivity and resilience in tropical lakes and reservoirs. Fish. Res. 2012, 115, 99–109. [Google Scholar] [CrossRef]
  119. Welcomme, R.L.; Cowx, I.G.; Coates, D.; Béné, C.; Funge-Smith, S.; Halls, A.; Lorenzen, K. Inland capture fisheries. Philos. Trans. R. Soc. B Biol. Sci. 2010, 365, 2881–2896. [Google Scholar] [CrossRef] [PubMed]
  120. Chifamba, P.C. The relationship of temperature and hydrological factors to catch per unit effort, condition and size of the freshwater sardine, Limnothrissa miodon (Boulenger), in lake Kariba. Fish. Res. 2000, 45, 271–281. [Google Scholar] [CrossRef]
  121. Mahere, T.; Mtsambiwa, M.; Chifamba, P.; Nhiwatiwa, T. Climate change impact on the limnology of Lake Kariba, Zambia–Zimbabwe. Afr. J. Aquat. Sci. 2014, 39, 215–221. [Google Scholar] [CrossRef]
  122. Clark, R.A.; Fox, C.J.; Viner, D.; Livermore, M. North sea cod and climate change–modelling the effects of temperature on population dynamics. Glob. Chang. Biol. 2003, 9, 1669–1680. [Google Scholar] [CrossRef]
  123. Bootsma, H.; Hecky, R. Nutrient cycling in Lake Malawi/Nyasa. In Water Quality Report: Lake Malawi/Nyasa Biodiversity Conservation Project. Southern African Development Community/Global Environmental Facility (SADC/GEF); Malawi Inland Fisheries Research Centre: Salima, Malawi, 1999; pp. 215–241. [Google Scholar]
  124. Patterson, G.; Hecky, R.; Fee, E. Effect of hydrological cycles on planktonic primary production in lake Malawi/Niassa. Adv. Ecol. Res. 2000, 31, 421–430. [Google Scholar]
  125. Chavula, G.; Brezonik, P.; Thenkabail, P.; Johnson, T.; Bauer, M. Estimating the surface temperature of lake Malawi using AVHRR and modis satellite imagery. Phys. Chem. Earth Parts A/B/C 2009, 34, 749–754. [Google Scholar] [CrossRef]
  126. Owen, R.; Crossley, R.; Johnson, T.; Tweddle, D.; Kornfield, I.; Davison, S.; Eccles, D.; Engstrom, D. Major low levels of lake Malawi and their implications for speciation rates in cichlid fishes. Proc. R. Soc. Lond. B Biol. Sci. 1990, 240, 519–553. [Google Scholar] [CrossRef]
  127. Thompson, A.; Allison, E. Potential yield estimates of unexploited pelagic fish stocks in Lake Malawi. Fish. Manag. Ecol. 1997, 4, 31–48. [Google Scholar] [CrossRef]
  128. Turner, J.L. Changes in the size structure of cichlid populations of Lake Malaŵi resulting from bottom trawling. J. Fish. Board Can. 1977, 34, 232–238. [Google Scholar] [CrossRef]
  129. Allan, J.D.; Abell, R.; Hogan, Z.; Revenga, C.; Taylor, B.W.; Welcomme, R.L.; Winemiller, K. Overfishing of inland waters. BioScience 2005, 55, 1041–1051. [Google Scholar] [CrossRef]
  130. Banda, M.; Jamu, D.; Njaya, F.; Makuliwa, M.; Maluwa, A. The Chambo Restoration Strategic Plan; WorldFish: Penang, Malaysia, 2005; Volume 71. [Google Scholar]
  131. Weyl, O.L.; Ribbink, A.J.; Tweddle, D. Lake Malawi: Fishes, fisheries, biodiversity, health and habitat. Aquat. Ecosyst. Health Manag. 2010, 13, 241–254. [Google Scholar] [CrossRef]
  132. Ha, T.T.P.; van Dijk, H. Fishery livelihoods and (non-) compliance with fishery regulations—A case study in Ca Mau Province, Mekong Delta, Viet Nam. Mar. Policy 2013, 38, 417–427. [Google Scholar] [CrossRef]
  133. Bryan, E.; Deressa, T.T.; Gbetibouo, G.A.; Ringler, C. Adaptation to climate change in Ethiopia and South Africa: Options and constraints. Environ. Sci. Policy 2009, 12, 413–426. [Google Scholar] [CrossRef]
  134. Allison, E.H.; Mvula, P.M. Fishing Livelihoods and Fisheries Management in Malawi; Overseas Development Group; LADDER Working Paper No. 23; University of East Anglia: Norwich, UK, 2002. [Google Scholar]
  135. Adeleke, M.L.; Wolff, M. Adaptation of the artisanal fisher folks to climate change in the coastal region of Ondo state, Nigeria. In Innovation in Climate Change Adaptation; Filho, W.L., Ed.; Springer: Dordrecht, The Netherlands, 2016; pp. 177–193. [Google Scholar]
  136. Chirwa, W.C. Fishing rights, ecology and conservation along southern Lake Malawi, 1920–1964. Afr. Aff. 1996, 95, 351–377. [Google Scholar] [CrossRef]
  137. Hatlebakk, M. Fishery as a livelihood strategy in Malawi. Analyzing a small LSMS sub-sample. J. Int. Dev. 2012, 24, 77–87. [Google Scholar] [CrossRef]
  138. Coulthard, S. Adaptation and conflict within fisheries: Insights for living with climate change. In Adapting to Climate Change: Thresholds, Values, Governance; Adger, W.N., O’Brien, K.L., Eds.; Cambridge University Press: New York, NY, USA, 2009; pp. 255–267. [Google Scholar]
  139. Government of Malawi (GoM). Household Socio-Economic Characterisctics Report Integrated Household Survey 2010–2011; National Statistical Office: Zomba, Malawi, 2012; p. 231.
  140. Tambo, J.A. Adaptation and resilience to climate change and variability in north-east Ghana. Int. J. Disaster Risk Reduct. 2016, 17, 85–94. [Google Scholar] [CrossRef]
  141. Adger, W.N. Social aspects of adaptive capacity. In Climate Change, Adaptive Capacity and Development; World Scientific: Singapore, 2003; pp. 29–49. [Google Scholar]
  142. Bryan, E.; Ringler, C.; Okoba, B.; Roncoli, C.; Silvestri, S.; Herrero, M. Adapting agriculture to climate change in Kenya: Household strategies and determinants. J. Environ. Manag. 2013, 114, 26–35. [Google Scholar] [CrossRef] [PubMed]
  143. McGrath, D.G.; Almeida, O.T.; Merry, F.D. The influence of community management agreements on household economic strategies: Cattle grazing and fishing agreements on the lower Amazon floodplain. Int. J. Commons 2007, 1, 67–88. [Google Scholar] [CrossRef]
  144. Phiri, K.M. Some changes in the matrilineal family system among the Chewa of Malawi since the Nineteenth Century. J. Afr. Hist. 1983, 24, 257–274. [Google Scholar] [CrossRef]
  145. Njaya, F. Governance challenges of the implementation of fisheries co-management: Experiences from Malawi. Int. J. Commons 2007, 1, 137–153. [Google Scholar] [CrossRef]
  146. Blythe, J.L.; Murray, G.; Flaherty, M. Strengthening threatened communities through adaptation: Insights from coastal Mozambique. Ecol. Soc. 2014, 19, 6. [Google Scholar] [CrossRef]
  147. Jerneck, A. Taking gender seriously in climate change adaptation and sustainability science research: Views from feminist debates and sub-saharan small-scale agriculture. Sustain. Sci. 2018, 13, 403–416. [Google Scholar] [CrossRef]
  148. Nunan, F.; Hara, M.; Onyango, P. Institutions and co-management in east African inland and Malawi fisheries: A critical perspective. World Dev. 2015, 70, 203–214. [Google Scholar] [CrossRef]
  149. Williams, M.J. Why look at fisheries through a gender lens? Development 2008, 51, 180–185. [Google Scholar] [CrossRef]
Figure 1. Vulnerability—perception conceptual framework (adapted from [38,39]).
Climate 06 00034 g001
Figure 2. Map of Malawi showing Nkhotakota district and the study area.
Climate 06 00034 g002
Figure 3. Mean total annual and warm-wet season precipitation (mm) for Dwangwa, Nkhotakota, Malawi from 1982–2016.
Climate 06 00034 g003
Figure 4. Annual precipitation anomalies for Dwangwa-Nkhotakota weather station from 1982 to 2016.
Climate 06 00034 g004
Figure 5. Mean annual maximum, mean annual minimum and mean temperatures for Dwangwa, Nkhotakota, Malawi in 1982–2016.
Climate 06 00034 g005
Figure 6. Annual maximum and minimum temperature anomalies for Dwangwa, Nkhotakota, Malawi in 1982–2016.
Climate 06 00034 g006
Table 1. Nkhotakota fishers’ (n = 112) coping strategies to low fish catches matched with their perceived climate exposure.
Agriculture BusinessLabour in AgricultureLabour in FisheriesNo Strategy
Extremely hot temperatures (%)1553142018
Incidences of flooding (%)300011
Persistent Mwera winds (%)1013212014
Erratic rainfall (%)4513293325
Increased drought incidences (%)2820362732
Total number of respondents (n)4015141528
Source: Fishers’ perceptions survey data, 2016.
Table 2. Description of explanatory variables for the determinants of coping strategies for Nkhotakota fishers (n = 112).
Explanatory VariableMeanStd. DeviationDescription
Household head sex 0.980.13Dummy takes value of 1 if male and 0 otherwise
Household head age43.711.4Continuous
Household head education4.583.53Continuous
Household head marital status 0.900.30Dummy takes value of 1 if married and 0 otherwise
Time stayed in the area by HHH33.0015.62Continuous
Household size6.03.40Continuous
Household head fishing experience21.4611.8Continuous
Fishing location0.240.43Dummy takes value of 1 if inshore and 0 otherwise
Membership to fish conservation club0.370.48Dummy takes value of 1 if a member and 0 otherwise
Income earned last year5.31.02Continuous—Log transformed
Access to weather information0.840.37Dummy takes value of 1 if have access and 0 otherwise
Access to other natural resources0.360.48Dummy takes value of 1 if have access and 0 otherwise
Extreme weather event (droughts)0.290.45Dummy takes value of 1 if extreme weather event is drought and 0 otherwise
Extreme weather event (floods)0.030.16Dummy takes value of 1 if extreme weather event is floods and 0 otherwise
Extreme weather event (extreme temperature)0.210.41Dummy takes value of 1 if extreme weather event is extreme temperature and 0 otherwise
Extreme weather event (erratic rain)0.320.47Dummy takes value of 1 if extreme weather event is erratic rains and 0 otherwise
Extreme weather event (Mwera winds)0.140.35Dummy takes value of 1 if extreme weather event is Mwera winds and 0 otherwise
Source: Fishers’ perceptions survey data, 2016 Notes: HHH is household head.
Table 3. Binary logistic regression analysis results of factors influencing Nkhotakota fishers’ (n = 108) ability to cope with perceived fish catch changes.
Explanatory VariablesCoefficientsStandard ErrorExp (B)
Household head sex−18.7627 9330.00
Age of household head0.12 ***0.041.12
Household head education0.16 *0.101.18
Household head marital status1.92 **0.966.85
Length stayed by household head in the area−0.030.020.98
Household size0.070.101.07
Fishing experience−0.030.030.98
Fishing location−0.260.700.77
Membership to fish conservation club−1.79 ***0.650.17
Annual fishing income0.73 **0.362.08
Access to other weather related information0.120.871.13
Access to other natural resources−0.740.670.48
Increased drought incidences −1.391.830.25
Increased flooding incidences−23.1021 1270.00
Increased extreme temperatures incidences−1.132.000.32
Increased incidences of erratic rainfall−1.011.800.37
Increased incidences of Mwera winds−0.871.940.42
Constant17.36 ***21 127
Source: Fishers’ perceptions survey data, 2016. Notes: n = 112. For binary variables (coping), no = 0 and yes = 1. *, **, and *** indicate significant coefficients at significance levels of 0.10, 0.05, and 0.01, respectively.

