Article

Subjective Human Perception of Open Urban Spaces in the Brazilian Subtropical Climate: A First Approach

Department of Geography, University of São Paulo (USP), 338 Prof. Lineu Prestes Avenue, São Paulo 05508-000, Brazil
*
Authors to whom correspondence should be addressed.
Climate 2018, 6(2), 24; https://doi.org/10.3390/cli6020024
Submission received: 1 March 2018 / Revised: 21 March 2018 / Accepted: 26 March 2018 / Published: 3 April 2018

Abstract

:
This research concerns a first approach to adapt the thermal comfort bands of the Physiological Equivalent Temperature (PET), New Standard Effective Temperature (SET), and Predicted Mean Vote (PMV) indices to Santa Maria’s population, Rio Grande do Sul, Brazil, on the basis of the application of perception/sensation questionnaires to inhabitants while, at the same time, recording meteorological attribute data. Meteorological and thermal sensation data were collected from an automatic weather station installed on paved ground in the downtown area, which contained the following sensors: a scale gauge; a global radiation sensor; a temperature and humidity sensor; a speed and wind direction sensor; a gray globe thermometer. First of all, air temperature, gray globe temperature, relative air humidity, wind speed, wind gust, global solar radiation and precipitation were collected. People were interviewed using a questionnaire adapted from the model established by ISO 10551. The results demonstrated the efficiency of the linear regression model and the adequacy of the interpretive indexes, presenting results different from those analyzed by other authors in different climatic zones. These differences meet the analyzed literature and attest to the effectiveness of the calibration method of the PET, SET, and PMV indices for the Brazilian subtropical climate. After calibration, the PET index hit rate increased from 32.8% to 69.3%. The SET index, which had an initial hit rate of 34.6% before calibration, reached a hit-rate of 64.9%, while the PMV index increased from 35.9% to 58.7%.

1. Introduction

Models for the prediction of thermal comfort employ seven- or nine-point thermal sensitivity scales for the assessment of the average person’s perception of atmospheric weather conditions in open spaces. Human thermal comfort ranges have been proposed or modified in recent years [1,2]. For decades, researchers have investigated ways to predict the thermal sensation of individuals in their typical environments on the basis of personal, environmental, and physiological variables. As a result, mathematical models that simulate the thermal responses of individuals in their environments were developed.
As a rule, the instruments used to construct this type of scale consist of questionnaires with items investigating respondents’ personal impressions of the atmospheric weather, while a meteorological station simultaneously measures several climatic attributes, such as air temperature, relative humidity, and wind speed [3,4,5].
Studies and human comfort indexes are being developed to measure thermal comfort in open spaces under uncontrolled conditions [6,7,8,9]. Some such studies focus on modeling and assessment methods from the thermophysiological perspective, e.g., those by Gulyas et al. [10] and Hoppe [1], whereas others are based on the relationships between the climate parameters that determine the thermal comfort level of humans outdoors [11,12].
A survey of cross-sectional studies that have investigated the thermal comfort patterns and preferences of people at different times of the year have detected a large number of studies that employed the indexes of the New Standard Effective Temperature (SET) [13], Predicted Mean Vote (PMV) [14], and Physiological Equivalent Temperature (PET) [15], relative to temperate [2,3,4,5,6,7,8,9,10,11,12,13,14,15,16,17,18] and hot and wet [19,20,21] climates.
In Brazil, Hirashima et al. [22] described interpretive ranges for the PET calibrated for two different climatic regions: Belo Horizonte, Brazil (tropical climate) and Kassel/Freiburg, Germany (temperate climate in both cases). In turn, Lucchese et al. [23] analyzed the thermal comfort of visitors to a public square in Campo Grande, Mato Grosso do Sul, Brazil, during the hot and cold seasons, and compared the predictive capacities of the PET, Universal Thermal Climate Index (UTCI), Perceived Equivalent Temperature (TEP), Sense of Thermal Comfort (YDS), and PMV indexes.
Krüger, Rossi, and Drach [24] described a preliminary procedure for the calibration of the PET for three different climatic regions: Curitiba, Brazil (subtropical climate), Rio de Janeiro, Brazil (tropical climate), and Glasgow, United Kingdom (high-latitude climate).
Several studies have detected differences in outdoor thermal comfort across different climatic regions [24,25,26,27] and have pointed to the need for additional fieldwork research on subjective human perception in different climatic regions [20], given that most of those surveys currently available have mainly been conducted in areas with temperate or tropical climates.
Lin’s study [28], developed in Taichung, Taiwan, showed that, unlike a temperate climate, in a subtropical climate, mild temperatures and weak sunshine are generally desirable during the warm season. In his field research, Lin [28] found that more than 90% of people visiting the public square in the summer chose to stand under shade trees or in constructed shelters, indicating the importance of shade in outdoor environments in a subtropical climate.
Cheng et al. [29], in his studies about outdoor thermal comfort under the influence of Hong Kong’s subtropical climate, revealed that air temperature, wind speed, and solar radiation intensity are the most influential factors in determining people’s thermal sensation. Based on the data collected, a predictive formula for estimating the subjective outdoor temperature sensation was also developed, highlighting the fact that wind speed change has a negative influence on thermal sensation, especially in the summer in Hong Kong [29,30].
For studies in which the PET index in subtropical climates was used, different patterns of definition of the thermal comfort zone for different locations were observed, even when these places are in the same climatic zone [12,13,14,15,16,17,18,19,20,21,22,23,24,25,26,27,28,29,30,31,32]. The same behavior can be observed for the SET and PMV indices as well [17,18,19,20,21,22,23,24,25,26,27,28,29,30,31,32,33,34,35].
A literature review showed that no substantial study using some of the main thermal comfort indexes has yet to be conducted, relative to the Brazilian subtropical region.
A survey of studies conducted in Brazil showed that the SET, PMV, and PET are some of the indexes more widely used for open spaces. However, they have not been applied relative to the Brazilian subtropical region, except for the PET, which was used by Rossi et al. [7] to define the thermal comfort range for Curitiba, Paraná.
Therefore, the aim of the present study was to adapt the thermal comfort range for the PET, SET, and PMV indexes relative to the population of Santa Maria, Rio Grande do Sul, Brazil, on the basis of the application of questionnaires investigating the inhabitants’ perceptions/sensations and simultaneously recording the local meteorological attributes.

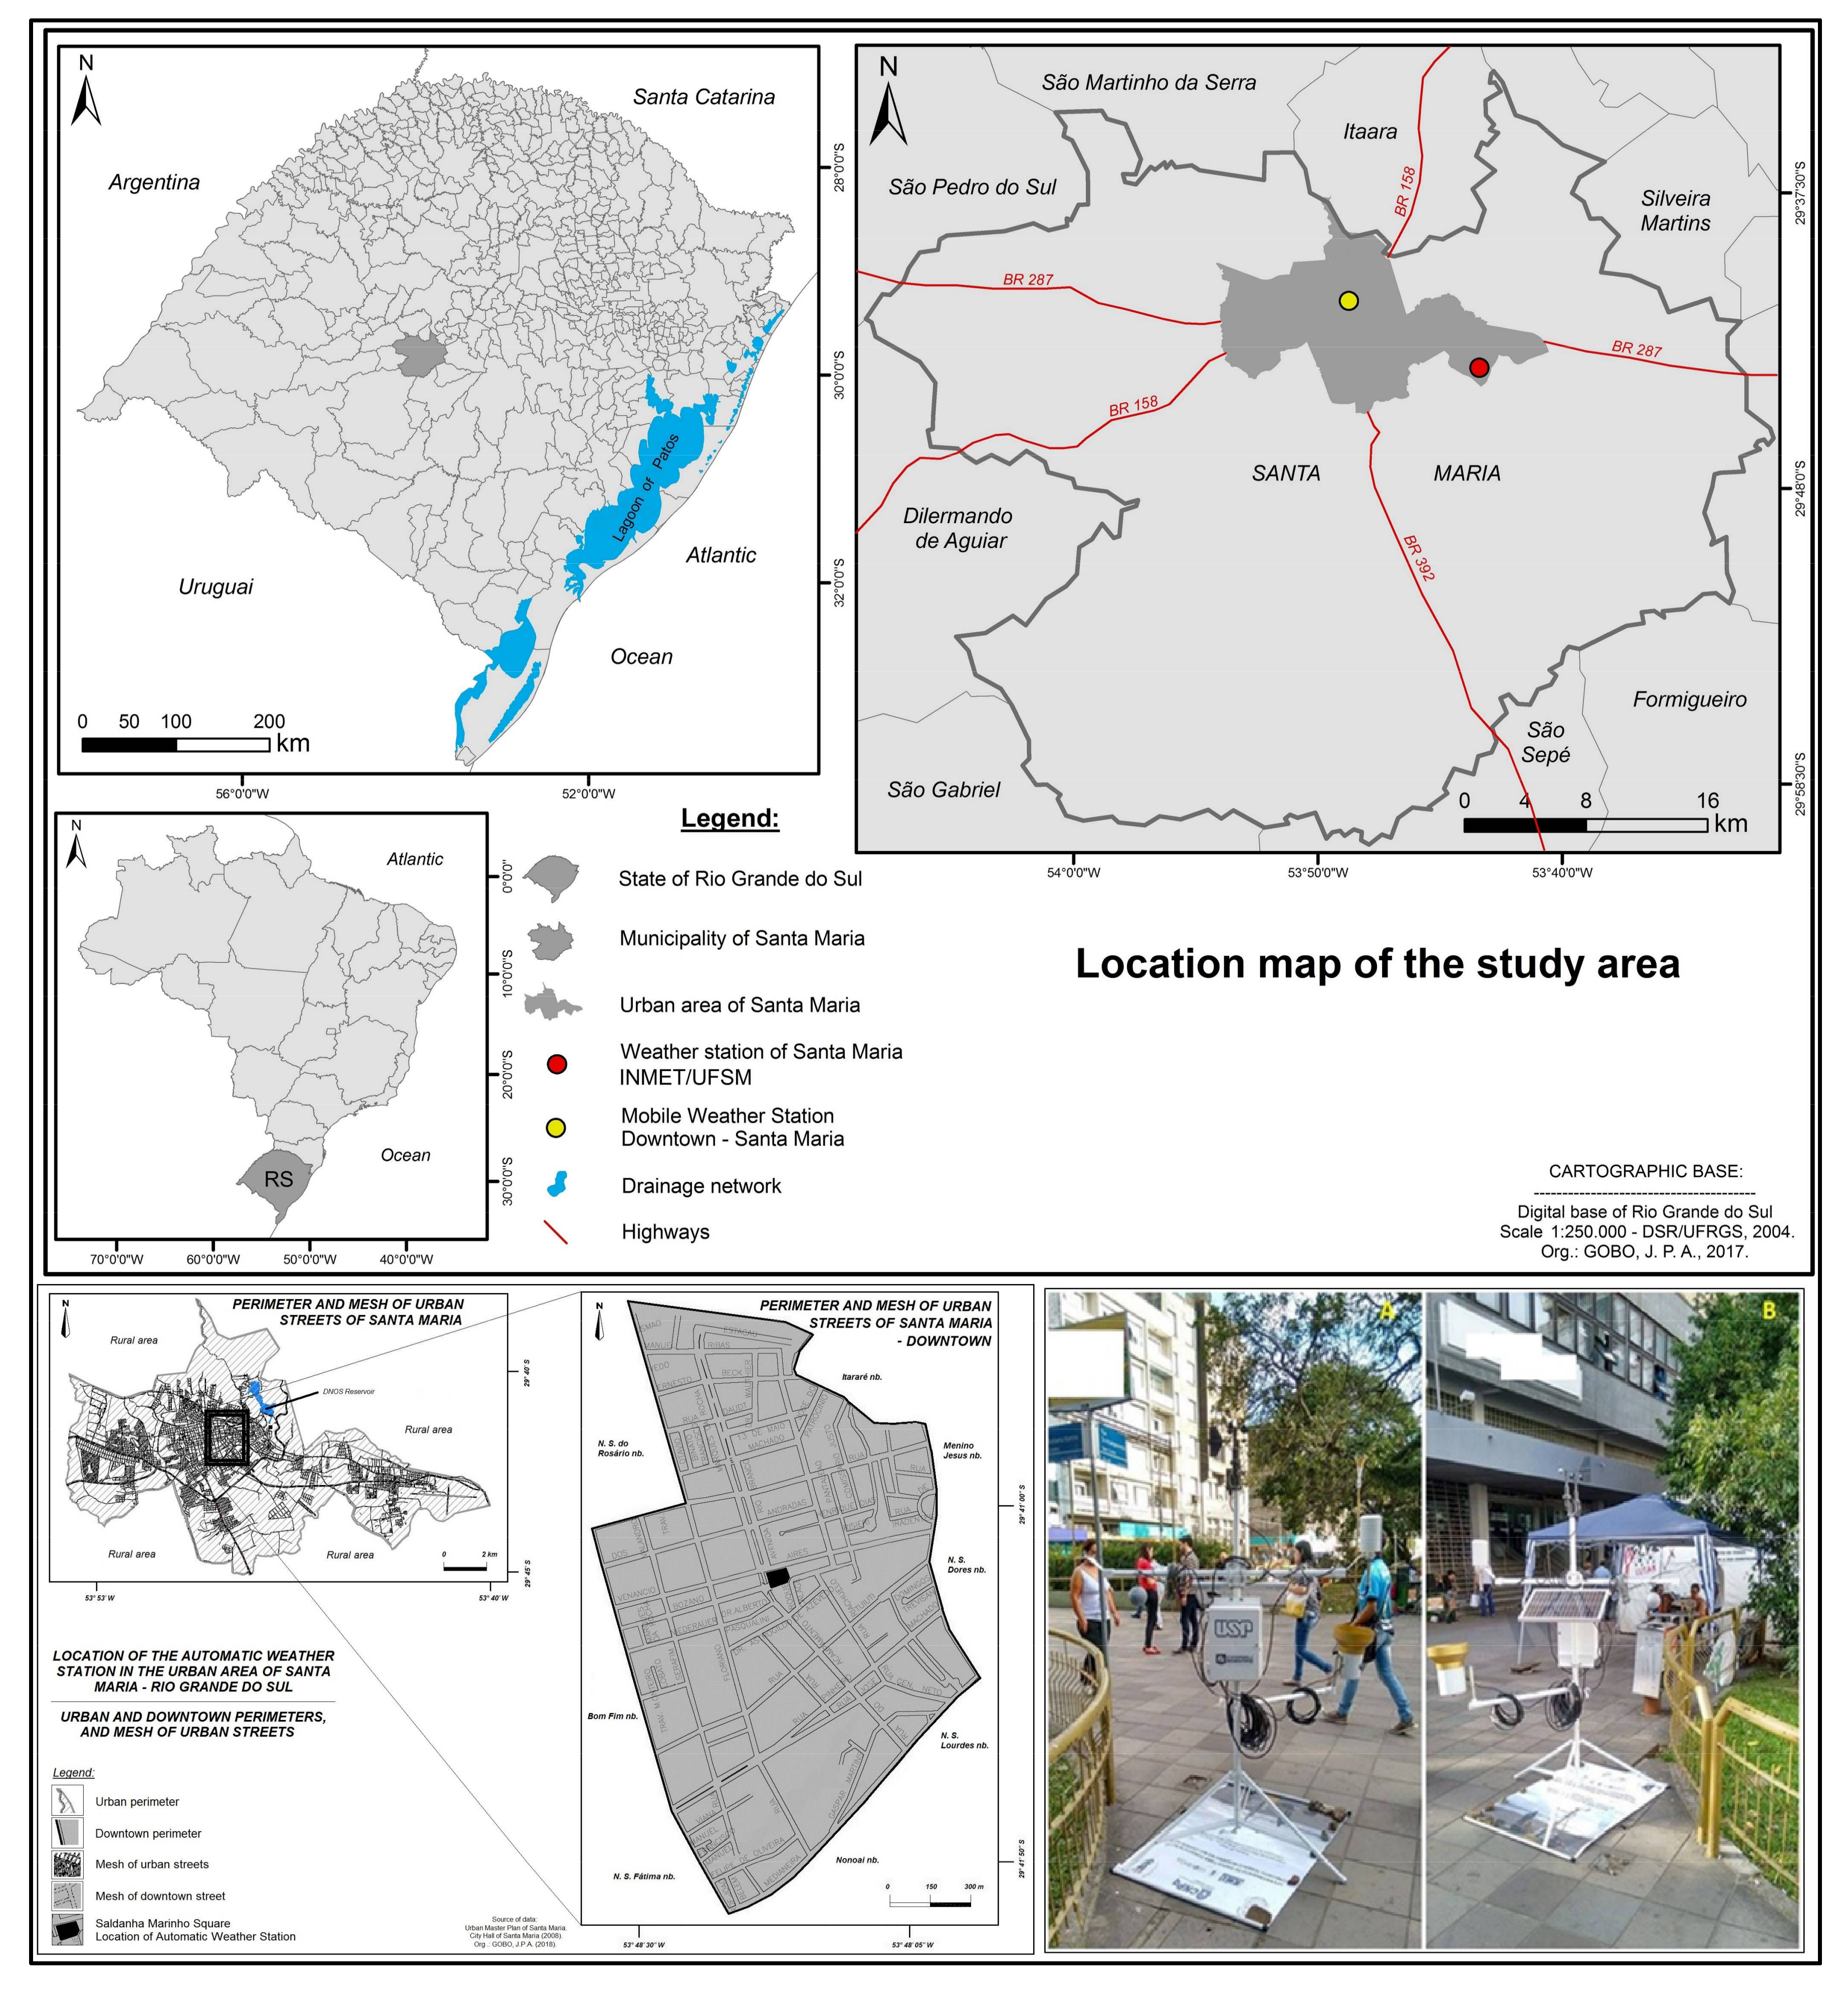
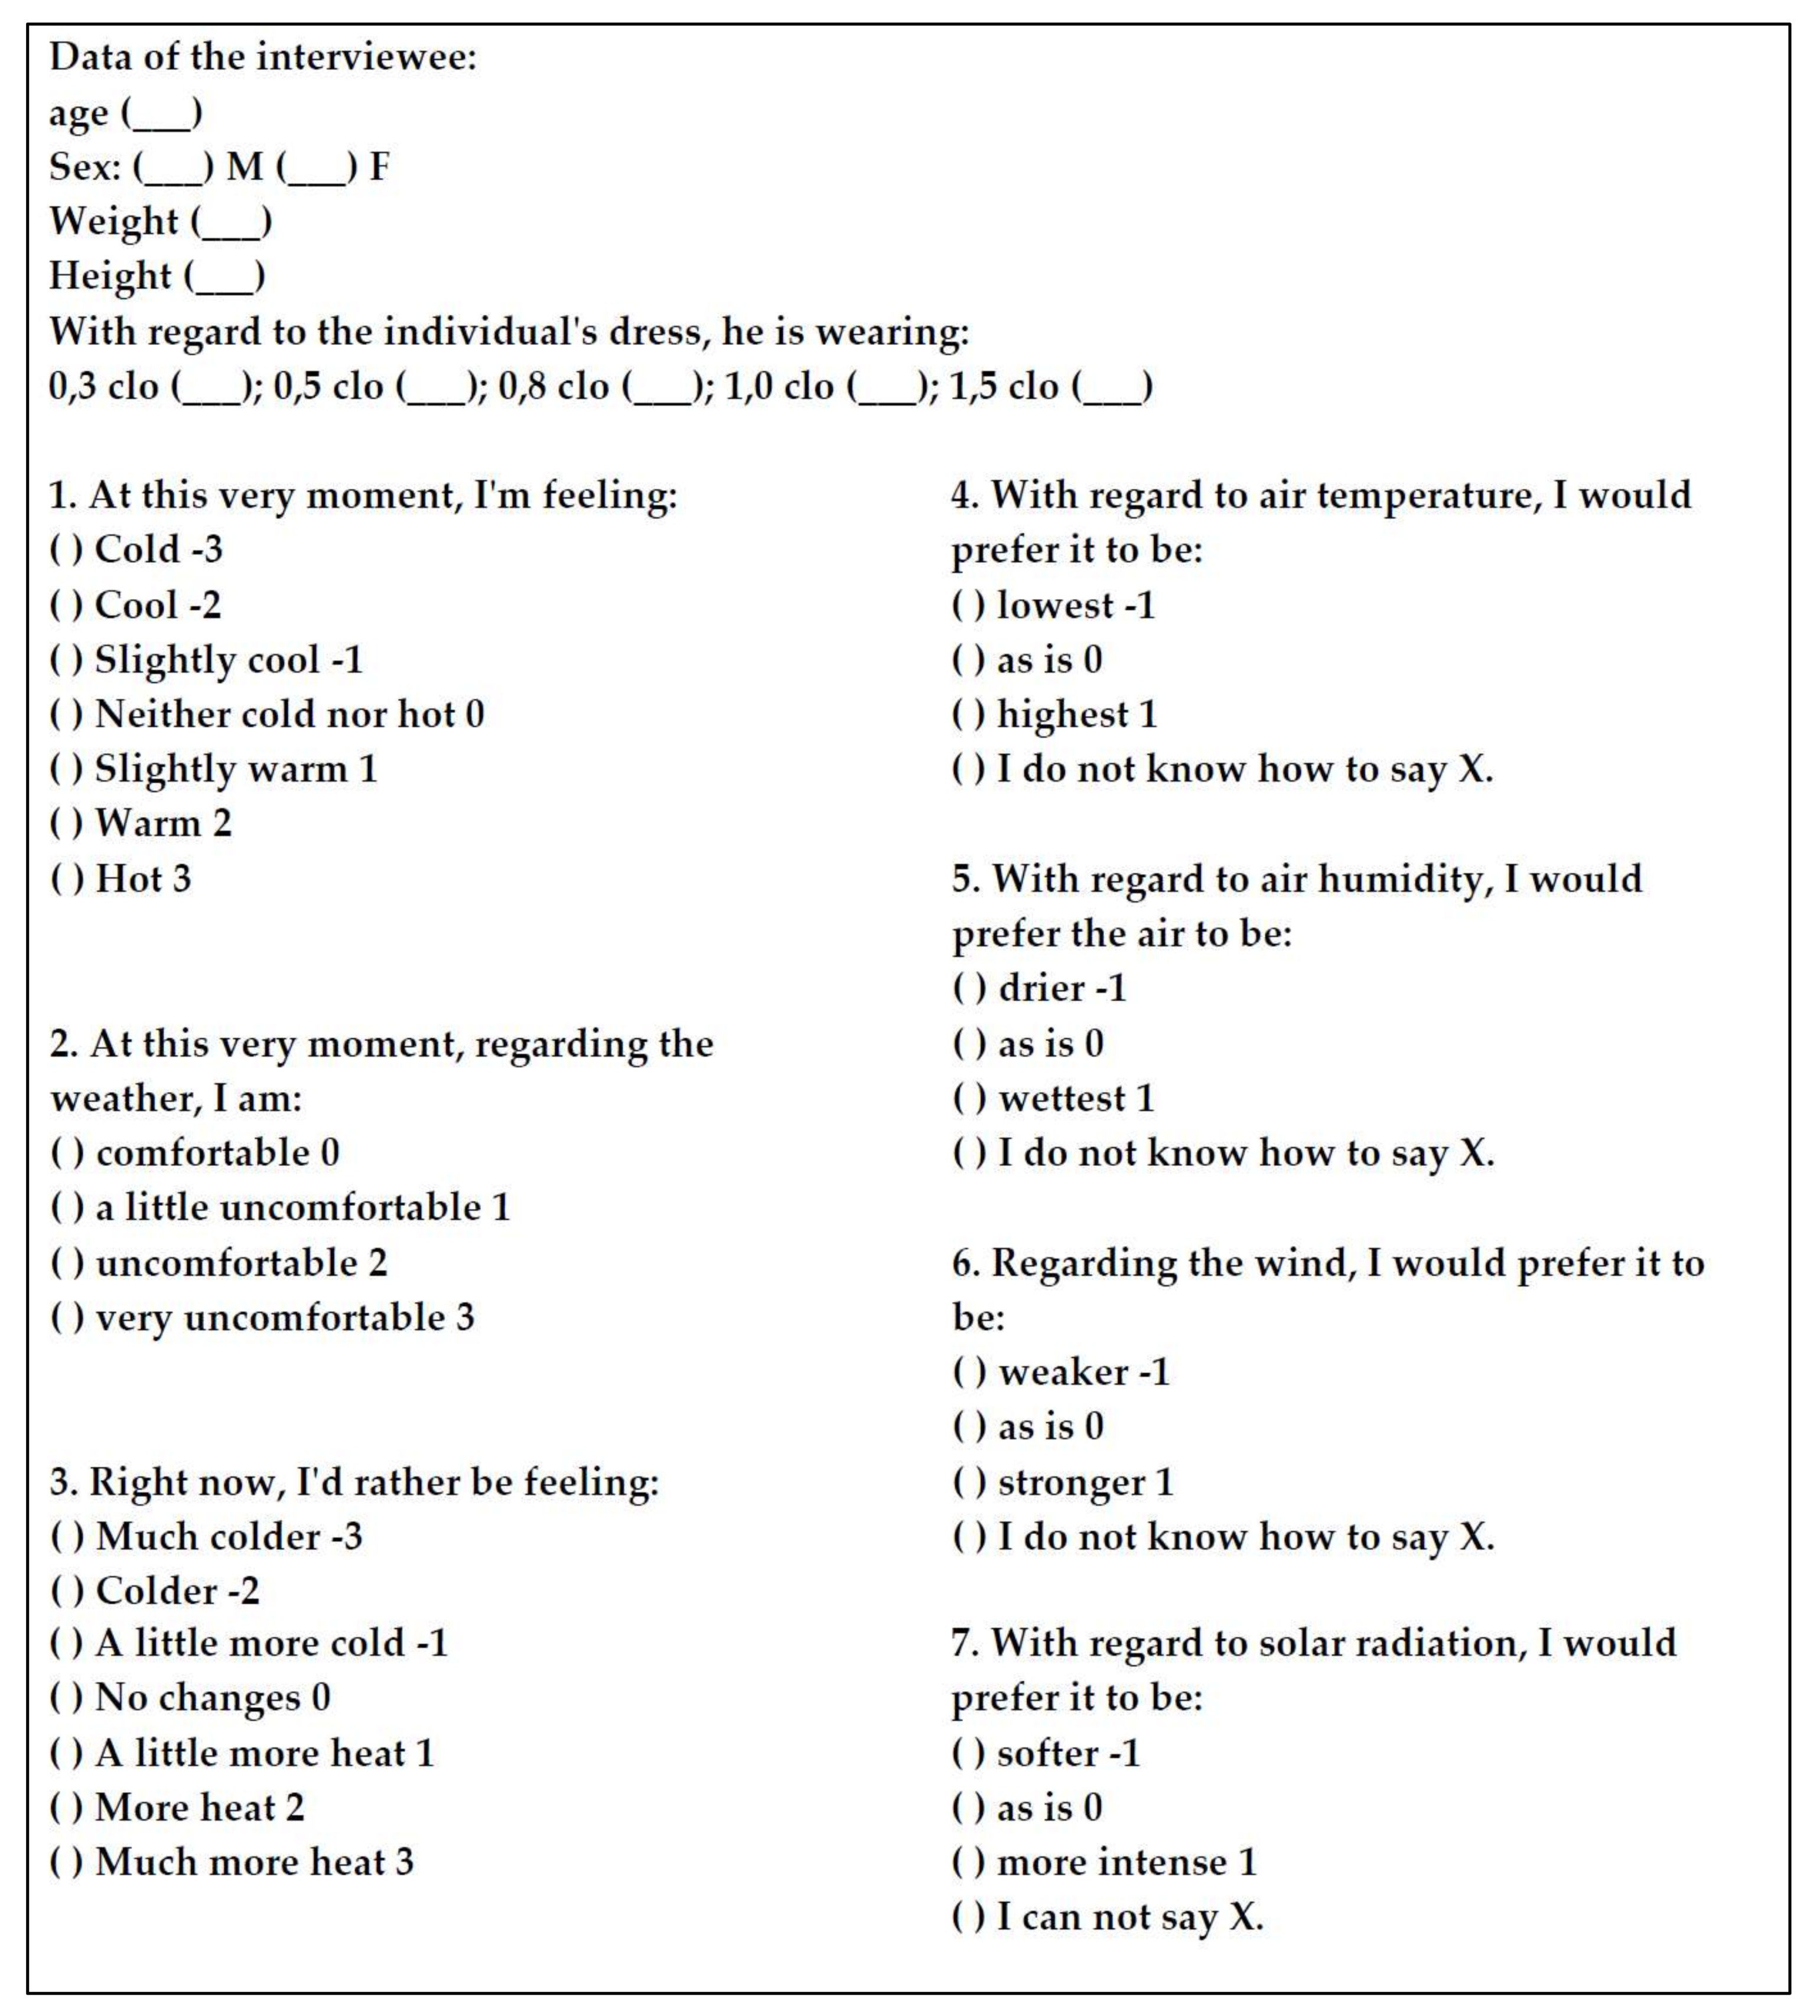
2. Materials and Methods

The meteorological and thermal sensation data required for the present study were collected. For this purpose, a Campbell CR100 Automatic Weather Station (AWS) was used, at a maximum height of 2.0 m, with a mobile aluminum tripod containing the following sensors: Rain gage model TE525 Tipping Bucket Rain Gage, with a resolution of 0.10 mm; global radiation sensor model LI200X Pyranometer, with a resolution of 0.2 kW·m−2; temperature and humidity sensor model HMP35C Temperature and Relative Humidity Probe, with resolutions of 0.1 °C and 0.6%; speed and wind direction sensor models 03001 R.M. Young Wind Setry Set 03101 R.M. Young Wind Sentry Anemometer 03301 R. M. Young Wind Sentry Vane, with resolutions of 0.5 m·s−1 and 5°; TMCx-HD gray globe thermometer, with a resolution of 0.03 °C. Primary data on air temperature, gray globe temperature—because the station was set up in an open space exposed to direct solar radiation [4]—relative humidity, wind speed, wind gusts, global solar radiation, and rain were collected. The station was placed on a paved area in Saldanha Marinho Square in downtown Santa Maria, where the flow of people is intense (Figure 1).
Field data collection was performed 5–7 August 2015, 17–19 January 2016 and 6–8 July 2016. Collection of meteorological data and interviews with the local population were performed from 9:00 a.m. to 5:00 p.m. solar time, on each of the aforementioned days and periods.
On the days of field research, an atypical climatic situation, popularly known as “little summer inside winter” and due to an atmospheric block, was observed during 5–7 August 2015, which is characterized by a persistent high pressure anomaly (anticyclone belt around 30 degrees of latitude), with relatively slow displacement of high pressures, and may persist for several days. During the January 2016 field research days, it was possible to identify a pattern compatible with Santa Maria’s normal climatological averages for this month, presenting high temperatures with maximums above 32 °C. In the next winter analysis, in July 2016, above-average temperatures for Santa Maria during this month were observed, mainly in the first day of analysis, but with periods of temperatures within the range expected in this season.
In the present study, only those individuals who had resided in the town for more than one year were interviewed to derive a function of the individual thermal history and environmental memory, as observed by Nikolopoulou [36], in a total of 1728 interviews. Interviewees also had to exhibit 0.3 to 1.5 of clothing insulation, which corresponds to wearing jeans and T-shirt or a suit [37] and 300 W of physical activity, because only people in motion (walking) were included [38]. The questionnaire administered was an adaptation of the one included in standard ISO 10551 [3] (Figure 2).
The AWS meteorological data were used to calculate the PET, SET, and PMV according to the RayMan model [39,40].
Following the calculation of the aforementioned indexes for the three analyzed periods (August 2015, June 2016, and July 2016), two multiple-linear regression models were fitted [41] to adjust the thermal comfort range of each index to the average thermal preference pattern of the interviewees. For this purpose, a code to optimize the proportion of hits of the models was formulated through changes in the cutoff points (index classes).
The multiple-linear regression method is described by the following equation:
Y = α 1 x 1 + α 2 x 2 + α 3 x 3 + α n x n + c
where n is the number of terms in the equation; αn corresponds to the (constant) parameters obtained by the regression; c is the constant that corresponds to the point where the fitted line intersects the y-axis; Y is the independent variable; xn are the dependent variables.
What we called the Index Mean is actually the mean of the responses obtained during fieldwork for a given value of the climatic variables, during a 20 min interval. Because Y is a discrete random variable with a finite number of possible values, we considered that an equation for the expected values of discrete random variables (finite case) afforded the best technique by which to calculate the expected value of the Index Mean for a given interval of time, as the responses were limited to the ANSI/ASHRAE 55 [42] 7-point thermal sensation scale:
E [ y ] = k = 1 n y k p k
where yk is the possible value, and pk is its corresponding probability in an independent assay.
In the case of the present study:
I m e a n = n = 1 n I k p k
where Ik is the Index Mean, and pk is the corresponding probability estimated by dividing the number of responses for a given index by the number of interviews conducted over a given interval of time.
That is, I1 = −3, I2 = −2, I3 = −1, I4 = 0, I5 = 1, I6 = 2, and I7 = 3, and p1, p2, p3, p4, p5, and p6 are the probabilities of each respective I, obtained as n u m b e r   o f   o c c u r r e n c e s t o t a l   n u m b e r   o f   i n t e r v i e w s   a l o n g   t h e   i n t e r v a l , resulting in:
I m e a n = n = 1 n I k p k = ( 3 ) p 3 + ( 2 ) p 2 + ( 1 ) p 1 + ( 0 ) p 0 + ( 1 ) p 1 + ( 2 ) p 2 + ( 3 ) p 3
This method is more appropriate for the obtained responses than calculating the weighted mean or the median.
New cutoff points were established for the values of the PMV, PET, and SET obtained on the assessment days. For this purpose, an optimization algorithm was used that had the original cutoff points of the indexes as its point of departure.
However, in the case of the indexes based on equivalent temperature analogies (i.e., PET and SET), we could not obtain the originally intended interpretive ranges, because, by principle, the interpretation of values is obtained from analogies between temperatures instead of interpretive scales. Nevertheless, we chose to use Hoppe’s [43] classes for the PET, and Jendritzky’s [44] classes for the PMV. In turn, the SET was described without the original ranges, but with the calibration ranges alone.

3. Results

Considering that the hit rate obtained in the linear model was approximately 45%, the results of the logistic model showed an index rate similar to 45%.
By analyzing the distribution of the values of the thermal comfort indexes as a function of the meteorological variables at each instant, together with the interviewees’ responses to question 1 (“At this exact moment, I’m feeling ___.”), we sought to obtain an index that is able to satisfactorily describe the thermal comfort of Santa Maria’s population.
Just as Lucchese et al. [23] found for Campo Grande, Mato Grosso do Sul, Brazil, the limited predictive ability of the analyzed indexes (less than 50% precision) did not efficiently represent the respondents’ thermal sensation reports. Thus, new cutoff points were established for such indexes, which were based on two multiple-linear regression models [41] and the use of an optimization code of the proportion of hits of the models through changes in the cutoff points. The optimized values are described in Table 1, which illustrates the rationale underlying the procedure, namely, to find range sizes that maximize the number of hits.

3.1. Calibration of Interpretive Ranges for the Predicted Mean Vote (PMV)

Relative to the PMV, the cutoff point found for the thermal comfort range following calibration was within the interval −1 to 0.8, which thusly differed from that suggested by Jendritzky et al. [44], i.e., −0.5 to 0.5 (Table 2).
The comparison of the cutoff points obtained for Santa Maria, following calibration of the PMV ranges, to those found by Monteiro [45] shows a subtle difference, with the interval reported by the latter being from −0.9 to 0.6. However, the maximum and minimum cutoff points were 4 and 3.1, respectively.
Having been developed in an interior setting under the assumption of comfortable average temperature and sweat rate, its applicability to an outdoor environment is limited. The same finding was observed by Lai et al. [2] who, using microclimatic monitoring and interviews with the population in a park of Tianjin, China, analyzed outdoor thermal comfort under different climatic conditions through UTCI, PMV, PET, and Thermal Sensation Vote (TSV), and they compared with Lin’s [28], in Taiwan, and Pantavou’s et al. [16] studies. The analysis indicated that the PMV overestimated the outdoor thermal sensation by 1.3, leading the authors to conclude that the wide fluctuations in the outer thermal parameters resulted in frequent deviations from the neutral state and, therefore, its use was not indicated.

3.2. Calibration of Interpretive Ranges for the New Standard Effective Temperature (SET)

In the case of the SET, we could not find the interpretive ranges suggested by the original authors. The cutoff points for the comfort range were 17 °C and 23 °C, whereas the maximum and minimum values of the scale calibrated for Santa Maria were 33 °C and 6 °C, respectively (Table 3).
The comparison of the calibrated SET values for Santa Maria to those values for São Paulo [46] evidence a significant similarity between the cutoff points for the interpretive ranges, particularly with regard to the comfort range, which for São Paulo extended from 17 °C to 22 °C. The maximum and minimum cutoff points of the interpretive ranges for São Paulo were practically identical to those for Santa Maria, i.e., 33 °C and 5 °C, respectively.
Considering the differences in climate and thermal preference between the populations of Santa Maria and São Paulo (subtropical and tropical climates, respectively), one might infer that the SET did not perform satisfactorily in terms of calibration for the subtropical climate. This finding might be accounted for by the lack of a reference interpretive range for this procedure.
When the results of SET found for Santa Maria were compared with those of Xi et al. [46], who studied thermal comfort at the Guangzhou University of Technology campus in southern China’s subtropical climate region, the results pointed out that the comfort zone for young students in the summer of Guangzhou would be around 24 °C, only 1 °C above the upper limit of the comfort zone observed in Santa Maria. The authors also noted that cities in the subtropical climate zone in which the sky-vision factor (SVF) is very high receive more short-wave radiation and long-wave reflections, which may create an external, thermal overheated environment during the summer [46].
To check the patterns of thermal comfort and population preference in different seasons, Lin et al. [17] conducted 1644 interviews with simultaneous outdoor micrometeorological measurements in central Taiwan, in a hot and humid climatic zone. The results indicated a SET deviation of 1.3 °C relative to neutral temperatures between hot and cold seasons and a SET of 1.8 °C at the preferred temperature between hot and cold seasons. The authors observed that the SET’s comfort range for Taiwan was between 25.4 °C and 28.9 °C, much more than that observed for Santa Maria.

3.3. Calibration of Interpretive Ranges for the Physiological Equivalent Temperature (PET)

The calibration of the PET performed by Monteiro [45] for São Paulo found a comfort range similar to that obtained for Santa Maria, with cutoff points of 17 °C and 22 °C; the same was true for the cases of the maximum and minimum values of 33 °C and 5 °C, respectively.
Following calibration, the comfort range extended from 16 °C to 24 °C, which shows little difference with regard to the cutoff range reported by Jendritzky [47], i.e., 18 °C to 23 °C (Table 4).
The SET, just as the PET, is an index based on equivalent temperatures; as with the PET, for neither of these indexes were we able to locate the original interpretive ranges. Thus, we used Jendritzky’s [47] ranges, because the ranges found after calibration were lower, for instance, than those reported by Monteiro [45] for São Paulo, ranging from 18 °C to 26 °C.
In turn, Krüger, Rossi, and Drach [24] found an average of 25 °C as defining the comfort range for Curitiba through the use of a binary method, according to the values of the assessed index. These authors performed a preliminary calibration of the PET for three different climatic regions. Thus, any comparison between the results of calibration for Curitiba and Santa Maria would not be valid, because the studies differ from a methodological point of view. For this reason, the authors advocate a standardization of the protocols used for the assessment of comfort in open spaces [24].
The comparison of the thermal comfort range calibrated for the PET in Santa Maria to that calibrated by Lucchese et al. [23] for Campo Grande showed a difference, mainly with respect to the beginning of the range of discomfort due to cold, with the ranges of comfort being from 21 °C to 28 °C and from 16 °C to 24 °C for Campo Grande and Santa Maria, respectively. This difference might be partially attributed to the different climate characteristics of Campo Grande and Santa Maria, because the former is located in an area of transition between the humid subtropical (Cfa) and tropical wet (Aw) climates (Köppen–Geiger) [23], and the latter is located entirely within the humid, subtropical climatic zone.
Farajzadeh et al. [18] compared simple thermal comfort indexes and indices derived from energy balance models in northwestern Iran, using air temperature, solar radiation, relative humidity, cloud cover, and wind speed data from 13 weather stations during the period from 1986 to 2007, using the Bioklima and RayMan models. The indices based on the human energy balance showed a significant correlation with each other, with an R value above 90% and a lowest R value of 70%, related to the subjective temperature index (STI). In addition, the indices based on relatively simple formulas had low correlation with the UTC and the PET [24], probably because of the radiation factor in the equations. The results of this analysis indicated the UTCI and the PET as the most adequate indices for determining the conditions of thermal comfort [18].
When the PET results for Santa Maria are compared with those observed by Kántor, Kovács, and Takács [48], who calibrated the PET index from more than 5800 outdoor comfort questionnaires in the city of Szeged, Hungary, using different analysis procedures for 78 days of monitoring, the results found varied according to the season and the method of analysis used, and the average comfort range was from 17.1 °C to 21 °C. This is a threshold of only 4 °C, which is much less in comparison to Santa Maria, where the difference between the lower and upper limits of the comfort range was 8 °C.

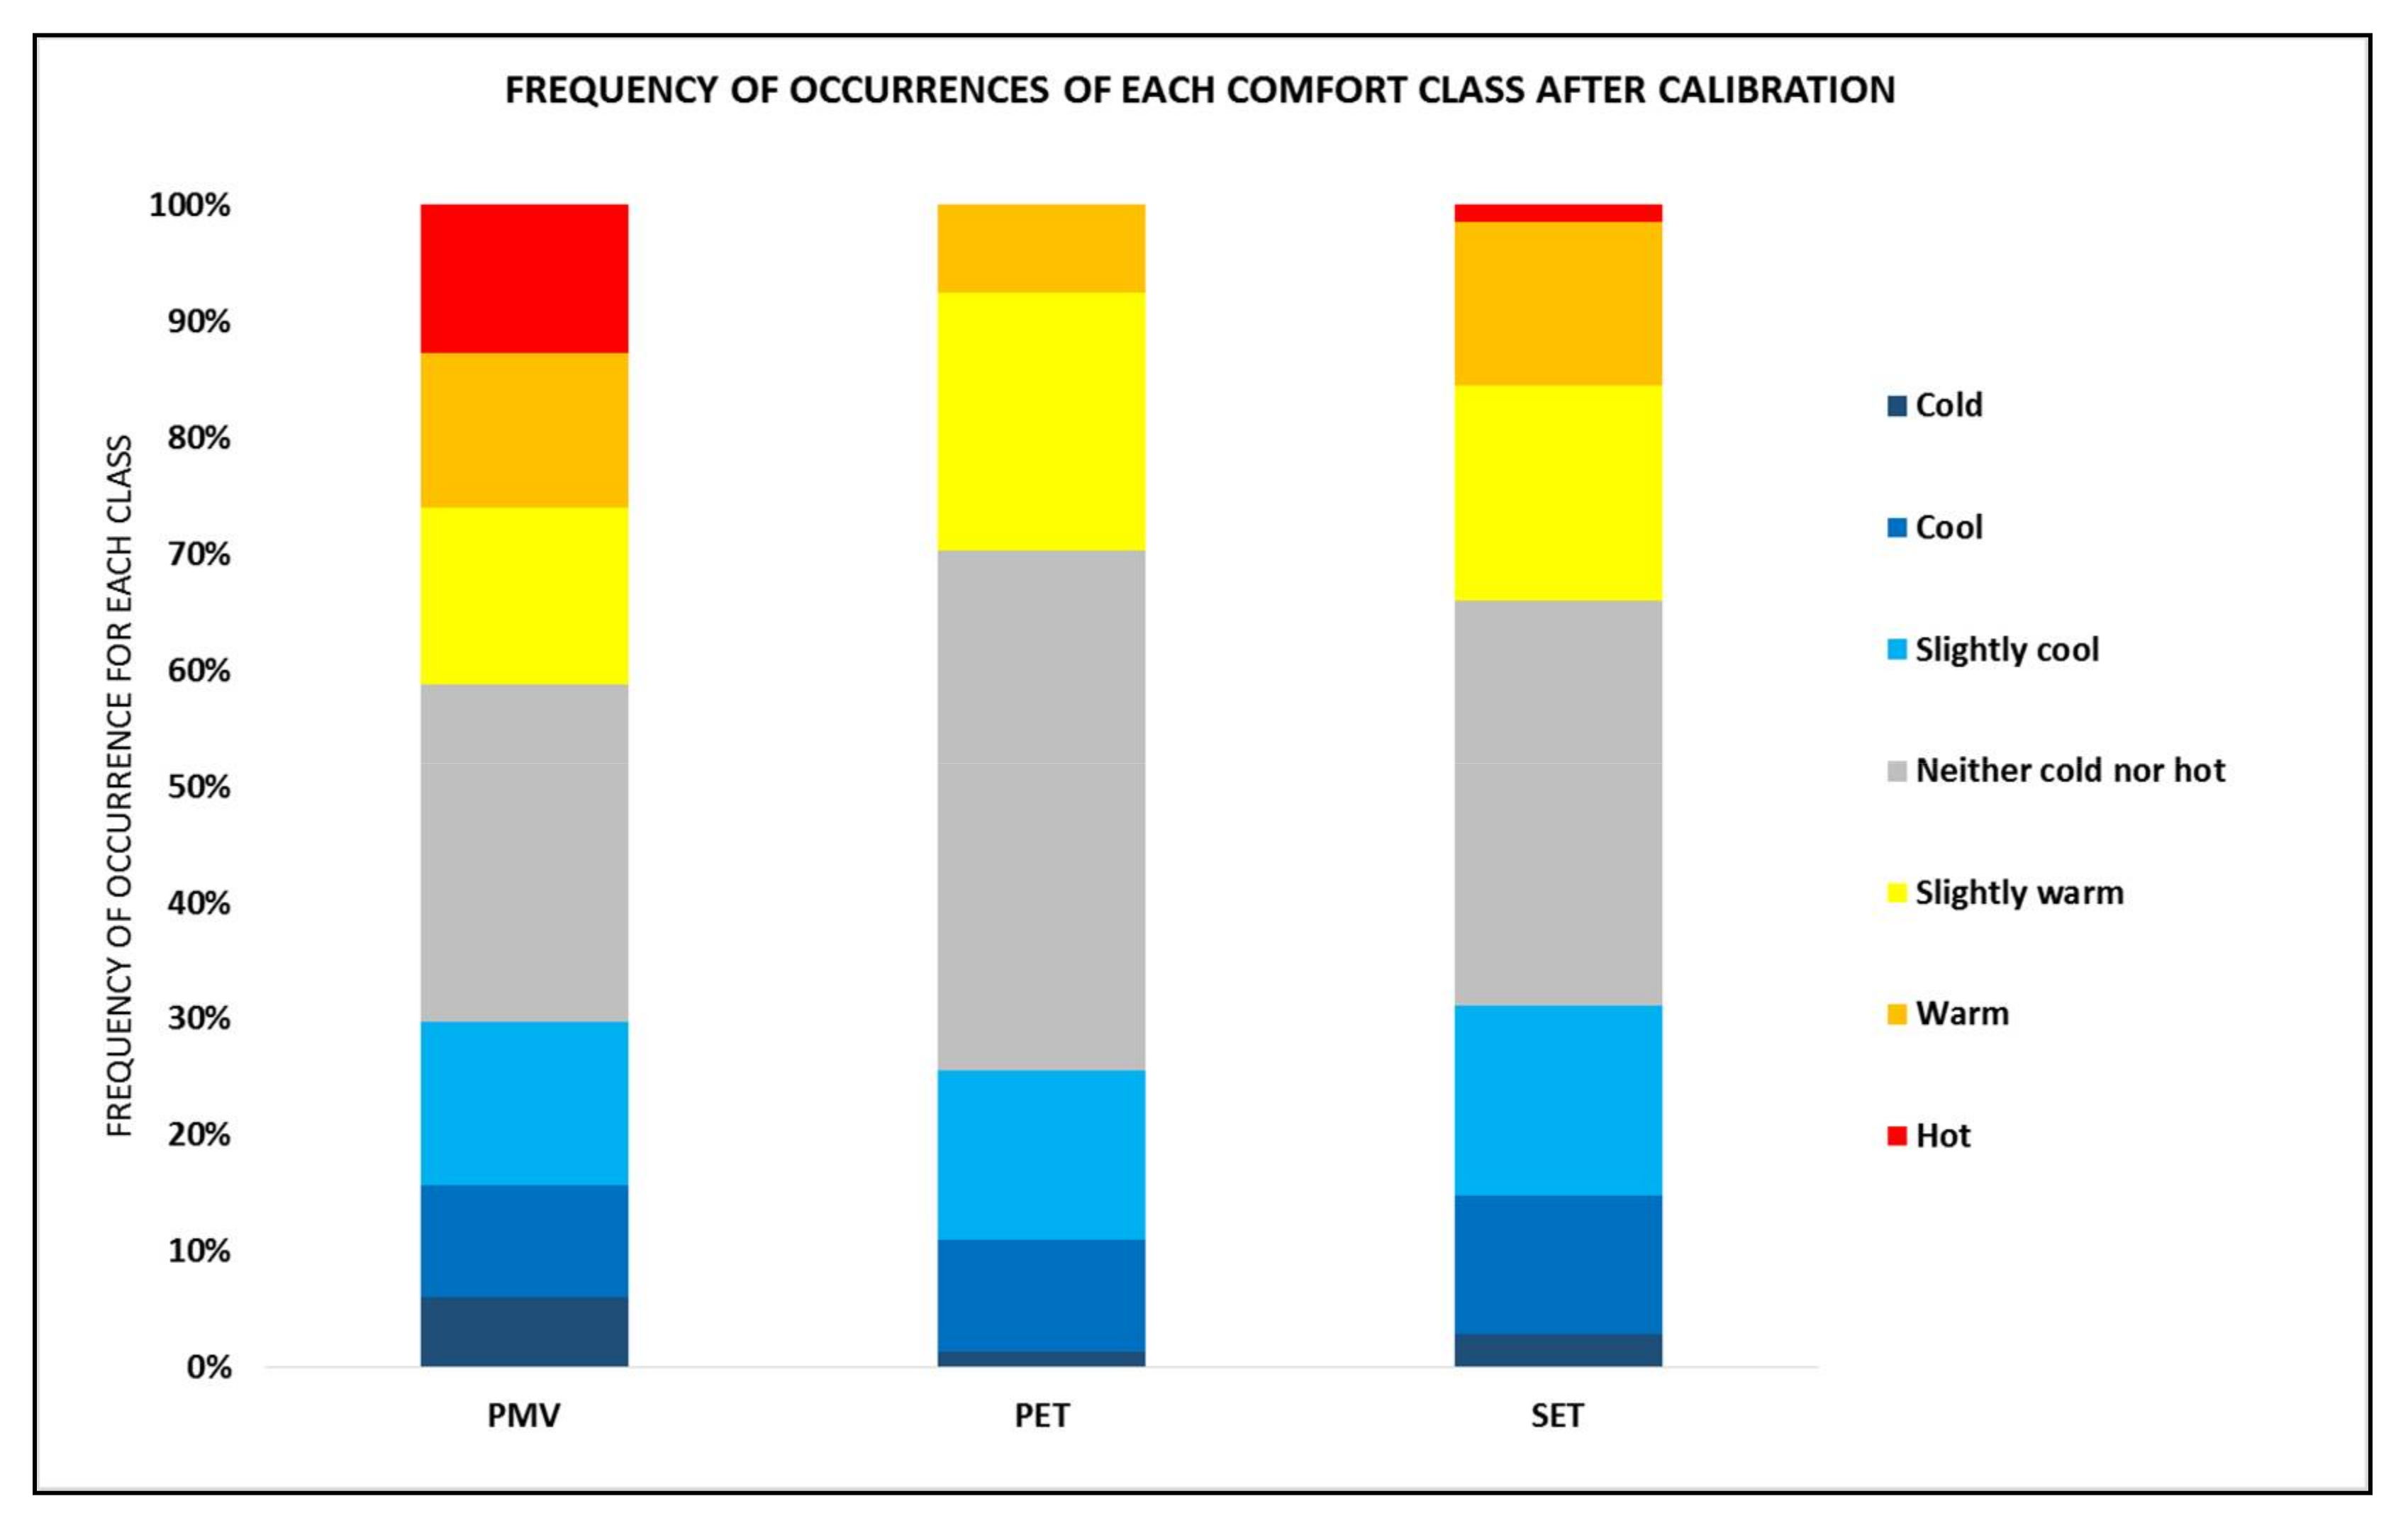
3.4. Analysis–Synthesis of the Calibration Suggested for the Interpretive Ranges of the PET, SET, and PMV

Following calibration of the interpretive ranges of the analyzed indexes, as shown in Table 1, their percent hit rates were very low relative to the average votes of the investigated population.
After calibration, the hit rate for the PET shifted from 32.8% to 69.3%, that for the SET from 34.6% to 64.9%, and that for the PMV from 35.9% to 58.7%.
Figure 3 depicts a visual analysis of the percent distribution of the interpretive ranges of the investigated indexes vis-à-vis the number of occurrences relative to each such range across the entire analyzed period.
As Figure 3 shows, class “neither cold nor hot” exhibited the highest percentage of occurrences for all three investigated indexes across the entire analyzed period. The PET was the single index not associated with an occurrence of the class “hot”, following calibration.

4. Conclusions

We conclude that the analyzed scores allowed the estimation of the thermal comfort classes for an individual at a given time as a function of the values of the observed climatic conditions, which validates the linear regression method for determining the adequacy of the interpretive ranges of each index.
The results of the present study show the efficiency of the linear regression model for the purpose of adapting the interpretive ranges of the investigated indexes, because their values differed from those reported by other authors for other climatic regions. These differences agree with the surveyed literature and reinforce the validity of the calibration method for the PET, SET, and PMV relative to the Brazilian subtropical climate.
From the statistical point of view, there is still a need for a larger approach based on a more comprehensive daily analysis and a wider variety of climatic conditions. By this reasoning, the present study can be defined as “a first approach”.
Further studies are needed on the effectiveness of the indices used in this research for open urban spaces in a subtropical climate, especially taking into account more detailed aspects of the characteristics and preferences of the individuals interviewed, such as the local demographic distribution, ethnicity, socioeconomic distribution, and thermal history, as well as the lifestyle and the frequency of the use of air conditioning, especially in places with well-defined climatic seasons, as the studied area. All such care, coupled with an appropriate standard method, is a suggestion for future studies that may fill the gaps still left.

Acknowledgments

The authors thank the National Counsel of Technological and Scientific Development (CNPq).

Author Contributions

This paper is one part of the doctoral thesis of the first author under the guidance of the second author.

Conflicts of Interest

The authors declare no conflict of interest.

References

  1. Höppe, P. Different aspects of assessing indoor and outdoor thermal comfort. Energy Build. 2002, 34, 661–665. [Google Scholar] [CrossRef]
  2. Lai, D.; Guo, D.; Hou, Y.; Lin, C.; Chen, Q. Studies of outdoor thermal comfort in northern China. Build. Environ. 2014, 77, 110–118. [Google Scholar] [CrossRef]
  3. International Organization for Standardization (ISO). Ergonomics of the Thermal Environment—Assessment of the Influence of the Thermal Environment Using Subjective Judgement Scales; ISO 10551; ISO: Geneva, Switzerland, 1995. [Google Scholar]
  4. International Organization for Standardization (ISO). Ergonomics of the Thermal Environment—Instruments for Measuring Physical Quantities; ISO 7726; ISO: Geneva, Switzerland, 1998. [Google Scholar]
  5. Johansson, E.; Thorsson, S.; Emmanuel, R.; Krüger, E. Instruments and methods in outdoor thermal comfort studies e the need for standardization. Urban Clim. 2014, 10, 346–366. [Google Scholar] [CrossRef]
  6. Bröde, P.; Krüger, E.L.; Rossi, F.A.; Faila, D. Predicting urban outdoor thermal comfort by the Universal Thermal climate index UTCI—A case study in Brazil. Int. J. Biometeorol. 2012, 56, 471–480. [Google Scholar] [CrossRef] [PubMed]
  7. Rossi, F.A.; Krüger, E.L.; Bröde, P. Definição de faixas de conforto e desconforto térmico para espaços abertos em Curitiba, PR, com o índice UTCI. Ambiente Construído 2012, 12, 41–59. [Google Scholar] [CrossRef]
  8. Zambrano, L.; Malafaia, C.; Bastos, L.E.G. Thermal Comfort Evaluation in Outdoor Space of Tropical Humid Climate. In Proceedings of the PLEA 23rd Conference on Passive and Low Energy Architecture, Geneva, Switzerland, 6–8 September 2006. [Google Scholar]
  9. Rossi, F.A.; Krüger, E.L.; Guimarães, I.A. Modelo preditivo de sensação térmica em espaços abertos em Curitiba, PR. Ra’e Ga. 2013, 29, 209–238. [Google Scholar] [CrossRef]
  10. Gulyas, A.; Unger, J.; Matzarakis, A. Assessment of the microclimatic and human comfort conditions in a complex urban environment: Modelling and measurements. Build. Environ. 2006, 41, 1713–1722. [Google Scholar] [CrossRef]
  11. Cheng, V.; Ng, E. Thermal comfort in urban open spaces for Hong Kong. Archit. Sci. Rev. 2006, 49, 236–242. [Google Scholar] [CrossRef]
  12. Spagnolo, J.; Dear, R. A field study of thermal comfort in outdoor and semi-outdoor environments in subtropical Sydney Australia. Build. Environ. 2003, 38, 721–738. [Google Scholar] [CrossRef]
  13. Gagge, A.P.; Stolwijk, J.A.J.; Nish, Y. An effective temperature scale based on a simple model of human physiological regulatory response. ASHRAE Trans. 1971, 77, 247–263. [Google Scholar]
  14. Fanger, P.O. Thermal Comfort; McGraw-Hill Book Company: New York, NY, USA, 1970. [Google Scholar]
  15. Höppe, P. The physiological equivalent temperature: A universal index for the assessment of the thermal environment. Int. J. Biometeorol. 1999, 43, 71–75. [Google Scholar] [CrossRef] [PubMed]
  16. Pantavou, K.; Theoharatos, G.; Santamouris, M.; Asimakopoulos, D. Outdoor thermal sensation in a Mediterranean climate and a comparison with UTCI. Build. Environ. 2013, 66, 82–95. [Google Scholar] [CrossRef]
  17. Lin, T.P.; Dear, R.; Hwang, R.L. Effect of thermal adaptation on seasonal outdoor thermal comfort. Int. J. Climatol. 2011, 31, 302–312. [Google Scholar] [CrossRef]
  18. Farajzadeh, H.; Saligheh, M.; Alijani, B.; Matzarakis, A. Comparison of selected thermal indices in the northwest of Iran. Nat. Environ. Chang. 2015, 1, 1–20. [Google Scholar]
  19. Nasira, R.A.; Ahmada, S.S.; Ahmedb, A.Z. Psychological Adaptation of Outdoor Thermal Comfort in Shaded Green Spaces in Malaysia. Procedia Soc. Behav. Sci. 2012, 68, 865–878. [Google Scholar] [CrossRef]
  20. Yang, W.; Wong, N.H.; Jusuf, S.K. Thermal comfort in outdoor urban spaces in Singapore. Build. Environ. 2013, 59, 426–435. [Google Scholar] [CrossRef]
  21. Villadiego, K.; Velay-Dabat, M.A. Outdoor thermal comfort in a hot and humid climate of Colombia: A field study in Barranquilla. Build. Environ. 2014, 75, 142–152. [Google Scholar] [CrossRef]
  22. Hirashima, S.; Katzschner, A.; Ferreira, D.; Assis, E.S.; Katzschner, L. Thermal comfort comparison and evaluation in different climates Toulouse, Françe. In Proceedings of the 9th International Conference on Urban Climate (ICUC), Toulouse, France, 20–24 July 2015. [Google Scholar]
  23. Lucchese, J.R.; Mikuri, L.P.; De Freitas, N.V.S.; Andreasi, W.A. Application of selected indices on outdoor thermal comfort assessment in Midwest Brazil. Int. J. Energy Environ. 2016, 7, 291–302. [Google Scholar]
  24. Krüger, E.L.; Rossi, F.A.; Drach, P. Calibration of the physiological equivalent temperature index for three different climatic regions. Int. J. Biometeorol. 2017, 61, 1323–1336. [Google Scholar] [CrossRef] [PubMed]
  25. Hirashima, S.Q.S.; Assis, E.S.; Nikolopoulou, M. Daytime thermal comfort in urban spaces: A field study in Brazil. Build. Environ. 2016, 107, 245–253. [Google Scholar] [CrossRef]
  26. Zeng, Y.; Dong, L. Thermal human biometeorological conditions and subjective thermal sensation in pedestrian streets in Chengdu, China. Int. J. Biometeorol. 2015, 59, 99–108. [Google Scholar] [CrossRef] [PubMed]
  27. Golasi, I.; Salata, F.; de Lieto Vollaro, E.; Coppi, M. Complying with the demand of standardization in outdoor thermal comfort: A first approach to the Global Outdoor Comfort Index (GOCI). Build. Environ. 2018, 130, 104–119. [Google Scholar] [CrossRef]
  28. Lin, T.P. Thermal perception, adaptation and attendance in a public square in hot and humid regions. Build. Environ. 2009, 44, 2017–2026. [Google Scholar] [CrossRef]
  29. Cheng, V.; Ng, E.; Chan, C.; Givoni, B. Outdoor thermal comfort study in sub-tropical climate: A longitudinal study based in Hong Kong. Int. J. Biometeorol. 2012, 56, 43–56. [Google Scholar] [CrossRef] [PubMed]
  30. Chen, L.; Wen, Y.; Zhang, L.; Xiang, W.N. Study of thermal comfort and space use in an urban park square in cool and cold seasons in Shanghai. Build. Environ. 2015, 94, 644–653. [Google Scholar] [CrossRef]
  31. Li, K.; Zhang, Y.; Zhao, L. Outdoor thermal comfort and activities in the urban residential community in a humid subtropical area of China. Energy Build. 2016, 133, 498–511. [Google Scholar] [CrossRef]
  32. Liu, W.; Zhang, Y.; Deng, Q. The effects of urban microclimate on outdoor thermal sensation and neutral temperature in hot-summer and cold-winter climate. Energy Build. 2016, 128, 190–197. [Google Scholar] [CrossRef]
  33. Zhao, L.; Zhoua, X.; Li, L.; Heb, S.; Chena, R. Study on outdoor thermal comfort on a campus in a subtropical urban area in summer. Sustain. Cities Soc. 2016, 22, 164–170. [Google Scholar] [CrossRef]
  34. Jeong, M.A.; Park, S.; Song, G.S. Comparison of human thermal responses between the urban forest area and the central building district in Seoul, Korea. Urban For. Urban Green. 2016, 15, 133–148. [Google Scholar] [CrossRef]
  35. Song, G.S.; Jeong, M.A. Morphology of pedestrian roads and thermal responses during summer, in the Urban area of Bucheon city, Korea. Int. J. Biometeorol. 2016, 60, 999–1014. [Google Scholar] [CrossRef] [PubMed]
  36. Nikolopoulou, M.; Baker, N.; Steemers, K. Thermal comfort in outdoor urban spaces: Understanding the human parameter. Sol. Energy 2001, 70, 227–235. [Google Scholar] [CrossRef]
  37. International Organization for Standardization (ISO). Ergonomics of the Thermal Environment—Estimation of Thermal Insulation and Water Vapour Resistance of a Clothing Ensemble; ISO 9920; ISO: Geneva, Switzerland, 2007. [Google Scholar]
  38. International Organization for Standardization (ISO). Ergonomics of the Thermal Environment—Determination of Metabolic Rate; ISO 8996; ISO: Geneva, Switzerland, 2004. [Google Scholar]
  39. Matzarakis, A. Modelling radiation fluxes in simple and complex environments—Application of the RayMan model. Int. J. Biometeorol. 2007, 51, 323–334. [Google Scholar] [CrossRef] [PubMed]
  40. Matzarakis, A. Climate Change: Temporal and spatial dimension of adaptation possibilities at regional and local scale. In Tourism and the Implications of Climate Change: Issues and Actions; Schott, C., Ed.; Emerald Group Publishing: Bingley, UK, 2010; Volume 3, pp. 237–259. [Google Scholar]
  41. Neter, J.; Wasserman, W.; Kutner, M.H. Applied Linear Statistical Models: Regression, Analysis of Variance, and Experimental Designs; IRWIN: Burr Ridge, IL, USA, 1990. [Google Scholar]
  42. Ansi/Ashrae. Standard 55: Thermal Environmental Conditions for Human Occupancy; American Society of Heating, Refrigerating and Air-conditioning Engineers: Atlanta, GA, USA, 2004. [Google Scholar]
  43. Höppe, P. Die Physiologisch Äquivalente Temperatur PET. Ann. Meteorol. 1997, 33, 108–112. [Google Scholar]
  44. Jendritzky, G.; Sönning, W.; Swantes, H.J. Ein Objektives Bewertungsverfahren zur Beschreibung des Thermischen Milieus in der Stadt- und Landschaftsplanung (‘Klima-Michel-Modell’); Beiträge der Akademie für Raumforschung und Landesplanung, Bd. 28; Akademic für Raumforschung und Lancksplanung: Hannover, Germany, 1979. [Google Scholar]
  45. Monteiro, L.M. Modelos Preditivos de Conforto Térmico: Quantificação de Relações Entre Variáveis Microclimáticas e de Sensação Térmica Para Avaliação e Projeto de Espaços Abertos. Ph.D. Thesis, Universidade de São Paulo, São Paulo, Brazil, 2008. [Google Scholar]
  46. Xi, T.; Li, Q.; Mochida, A.; Meng, Q. Study on the outdoor thermal environment and thermal comfort around campus clusters in subtropical urban areas. Build. Environ. 2012, 52, 162–170. [Google Scholar] [CrossRef]
  47. Jendritzky, G. Selected Questions of Topical Interest in Human Bioclimatology. Int. J. Biometeorol. 1991, 35, 139–150. [Google Scholar] [CrossRef] [PubMed]
  48. Kántor, N.; Kovács, A.; Takács, Á. Seasonal differences in the subjective assessment of outdoor thermal conditions and the impact of analysis techniques on the obtained results. Int. J. Biometeorol. 2016, 60, 1615–1635. [Google Scholar] [CrossRef] [PubMed]
Figure 1. Location of the study area and automatic weather station.
Climate 06 00024 g001
Figure 2. Questionnaire [3].
Climate 06 00024 g002
Figure 3. Frequency of occurrences relative to each interpretive range after calibration across the entire analyzed period.
Climate 06 00024 g003
Table 1. Classes corresponding to score intervals following the calculation of optimized cutoff points and hit rates of the analyzed indexes. PMV, Predicted Mean Vote; PET, Physiological Equivalent Temperature; SET, New Standard Effective Temperature (SET).
Thermal Comfort LevelScoreIndexHit Rate
Cold(−∞; −2.379]PMV35.9%
Cool(−2.379; −1.335]PET32.8%
Slightly cool(−1.335; −0.254]SET34.6%
Neither cold nor hot(−0.254; 0.965]
Slightly warm(0.965; 1.412]
Warm(1.412; 2.040]
Hot(2.040; +∞)
Table designed by the author.
Table 2. Cutoff points for classes corresponding to variable Response to Question 1 (*) of the questionnaire, calibrated for PMV.
PMV Jendritzky et al. (1979)Calibrated PMV
>2.5Hot<−3.6Cold
1.5 to 2.5Warm −3.6 to −2.3Cool
0.5 to 1.5Slightly warm−2.3 to −1.0Slightly cool
−0.5 to 0.5Comfortable−1.0 to 0.8Neither cold nor hot
−1.5 to −0.5Slightly cool0.8 to 1.9Slightly warm
−2.5 to −1.5Cool1.9 to 3.5Warm
<−2.5Cold>3.5Very warm
(*) “At this exact moment, I’m feeling ___”. Table designed by the author.
Table 3. Cutoff points for classes corresponding to the variable Response to Question 1 (*) of the questionnaire, calibrated for the SET.
Calibrated SET
<6Cold
6–12Cool
12–17Slightly cool
17–23Neither cold nor hot
23–29Slightly warm
29–33Warm
>33Hot
(*) “At this exact moment, I’m feeling ___”. Table designed by the author.
Table 4. Cutoff points for classes corresponding to the variable Response to Question 1 (*) of the questionnaire, calibrated for the PET.
PET Jendritzky (1991)Calibrated PET
<4Cold<5Cold
4–8Cool5–11Cool
8–18Moderately cool11–16Slightly cool
18–23Comfortable16–24Neither cold nor hot
23–35Moderately hot24–30Slightly warm
35–41Warm30–39Warm
>41Hot>39Hot
(*) “At this exact moment, I’m feeling ___?” Table designed by the author.

