Demonstrating the Effect of Forage Source on the Carbon Footprint of a Canadian Dairy Farm Using Whole-Systems Analysis and the Holos Model: Alfalfa Silage vs. Corn Silage

Abstract
1. Introduction
2. Materials and Methods
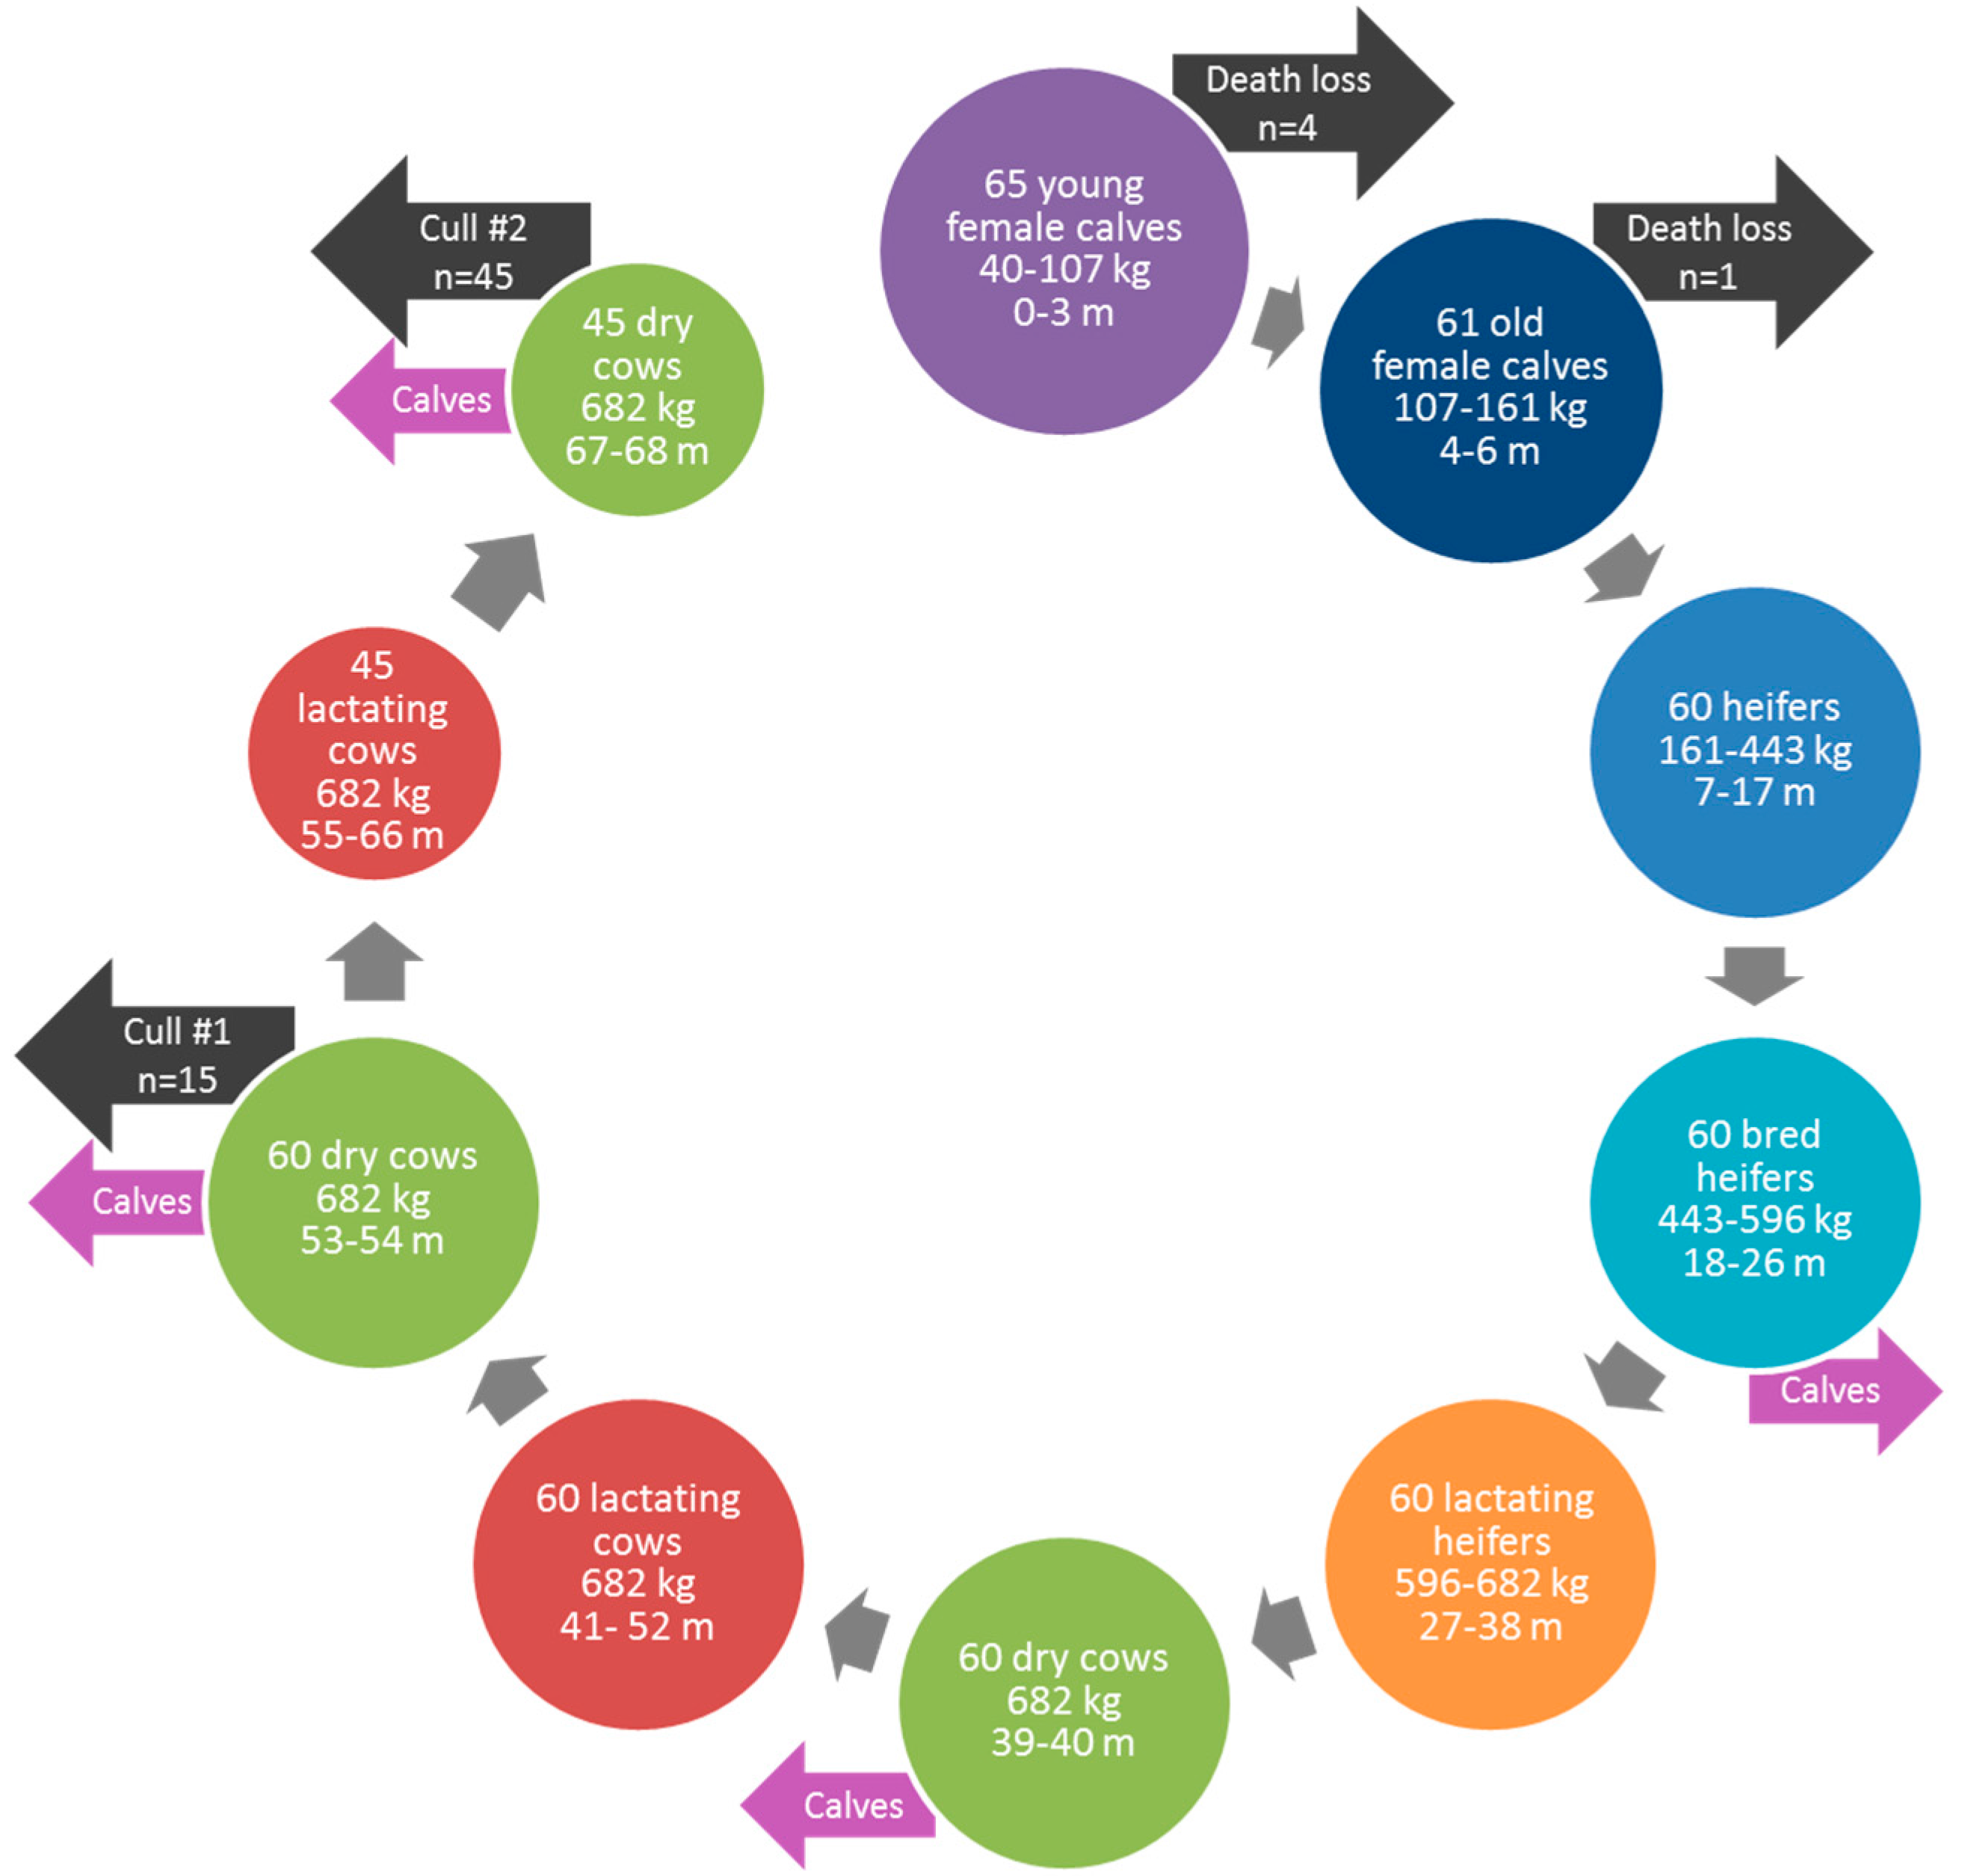
2.1. Animal Management
2.1.1. Herd Dynamics and Diet
2.1.2. Milk Production and Housing
2.2. Crop Production and Imported Feed
2.3. Quantification of GHG Emissions
2.3.1. Holos Model
2.3.2. GHG Emissions from Livestock Management
2.3.3. GHG Emissions from Crop and Feed Production and Imported Feed
2.3.4. Functional Unit and Co-Product Allocation
- kg of FPCM (standardized to 4% fat, 3.3% protein);
- kg of meat, live weight;
- kg of meat, carcass weight;
- kg of protein;
- MJ of energy;
- ha of farm land; and
- kg of manure N.
2.3.5. Soil Carbon
3. Results
3.1. Greenhouse Gas Emissions
3.2. Production
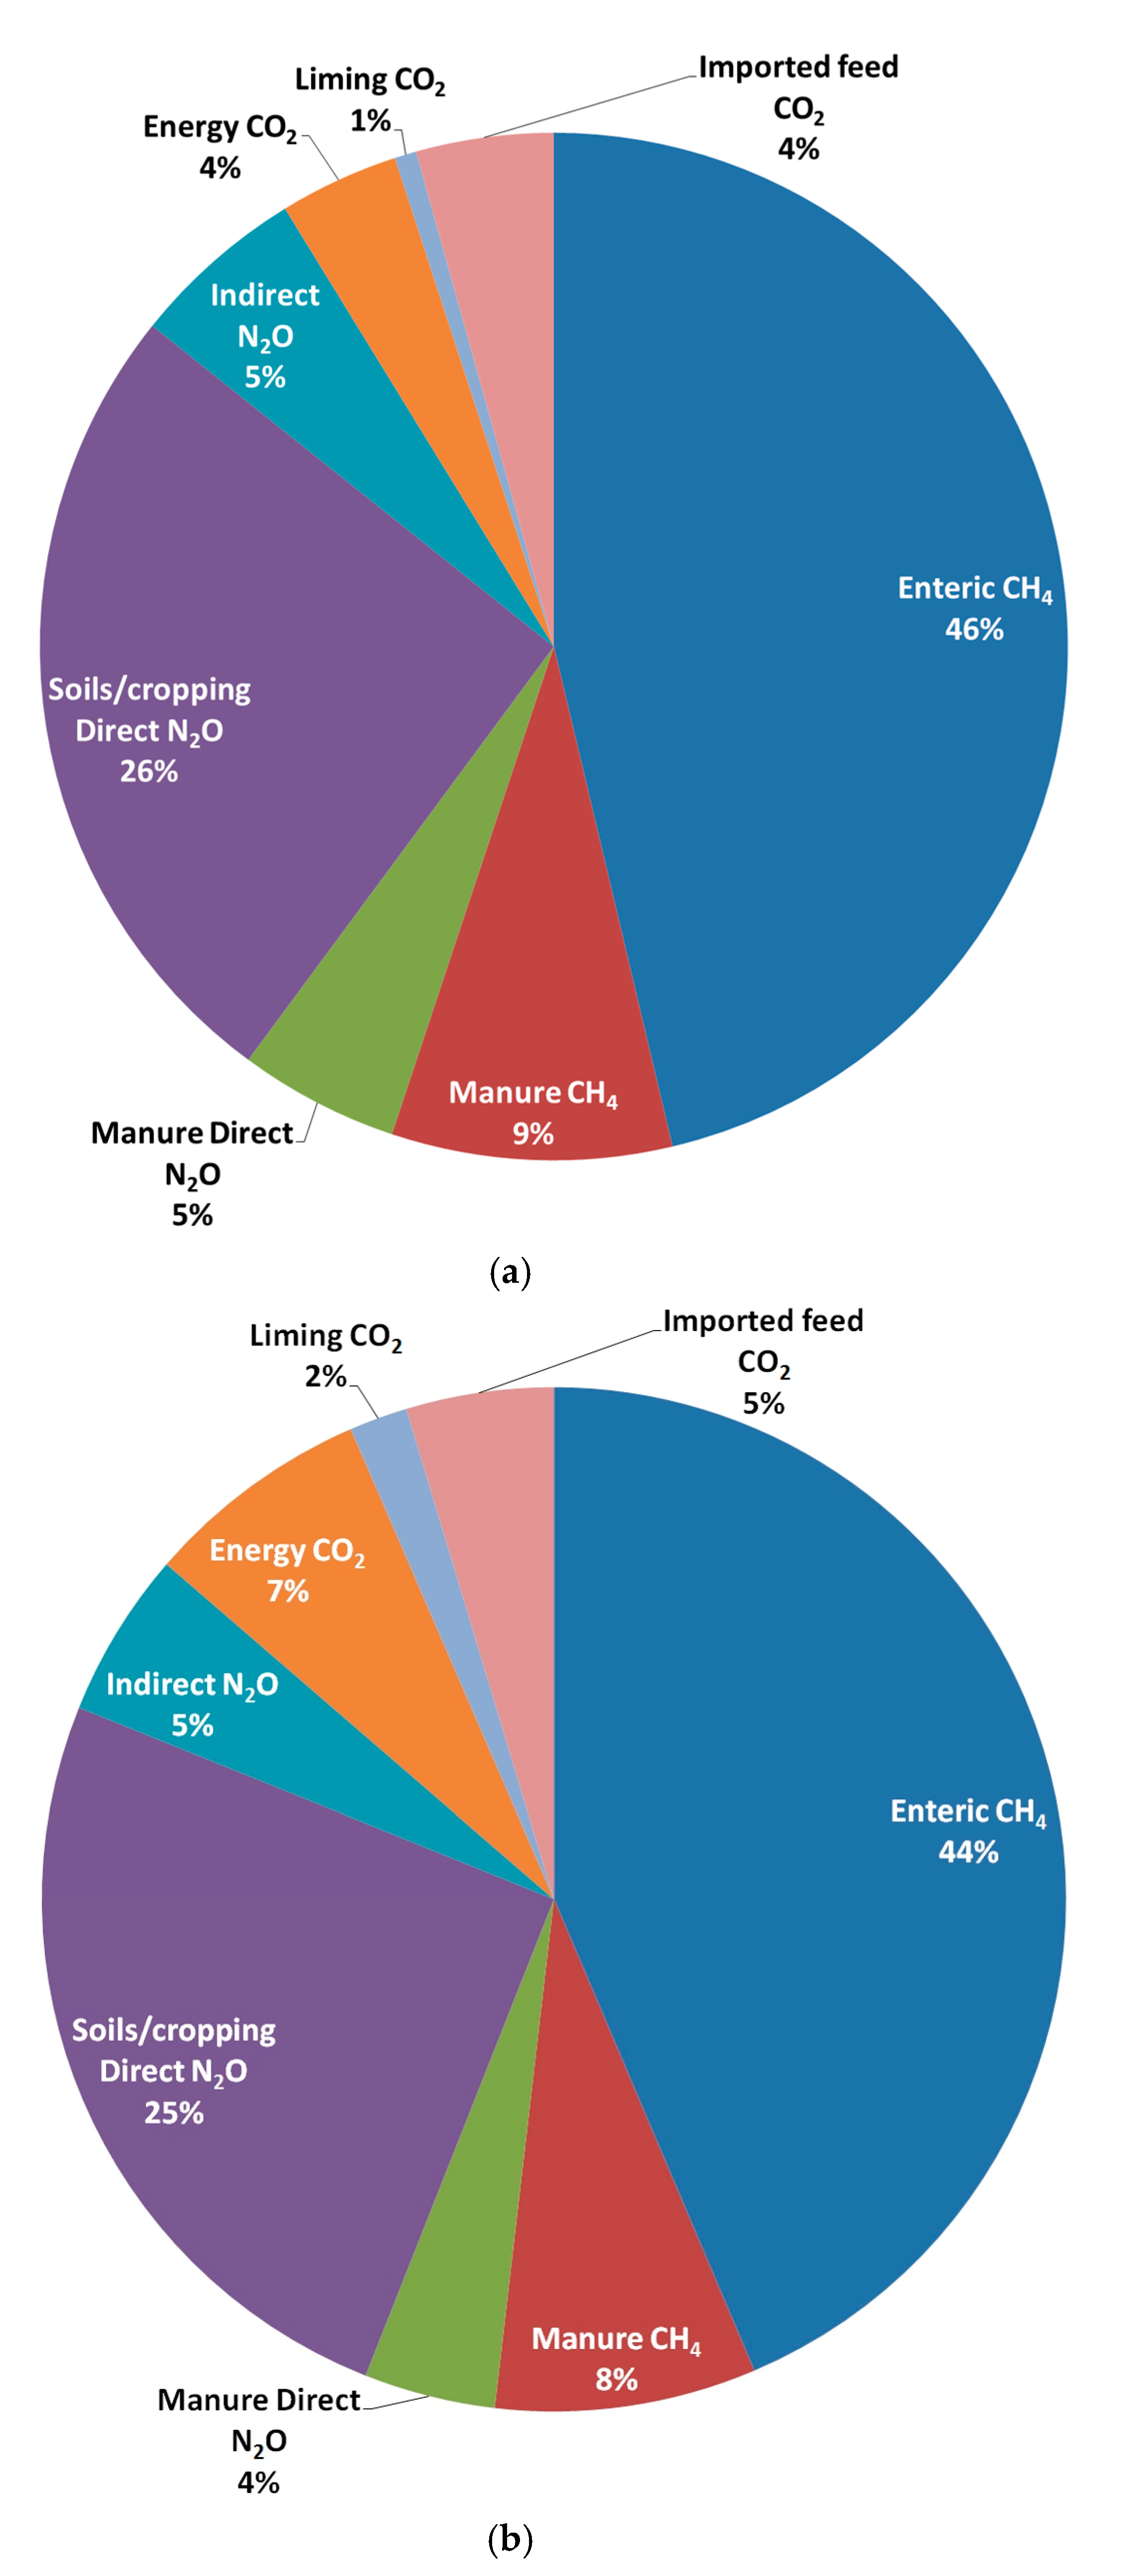
3.3. Emissions Breakdown
3.4. Land Base
3.5. Greenhouse Gas Intensity
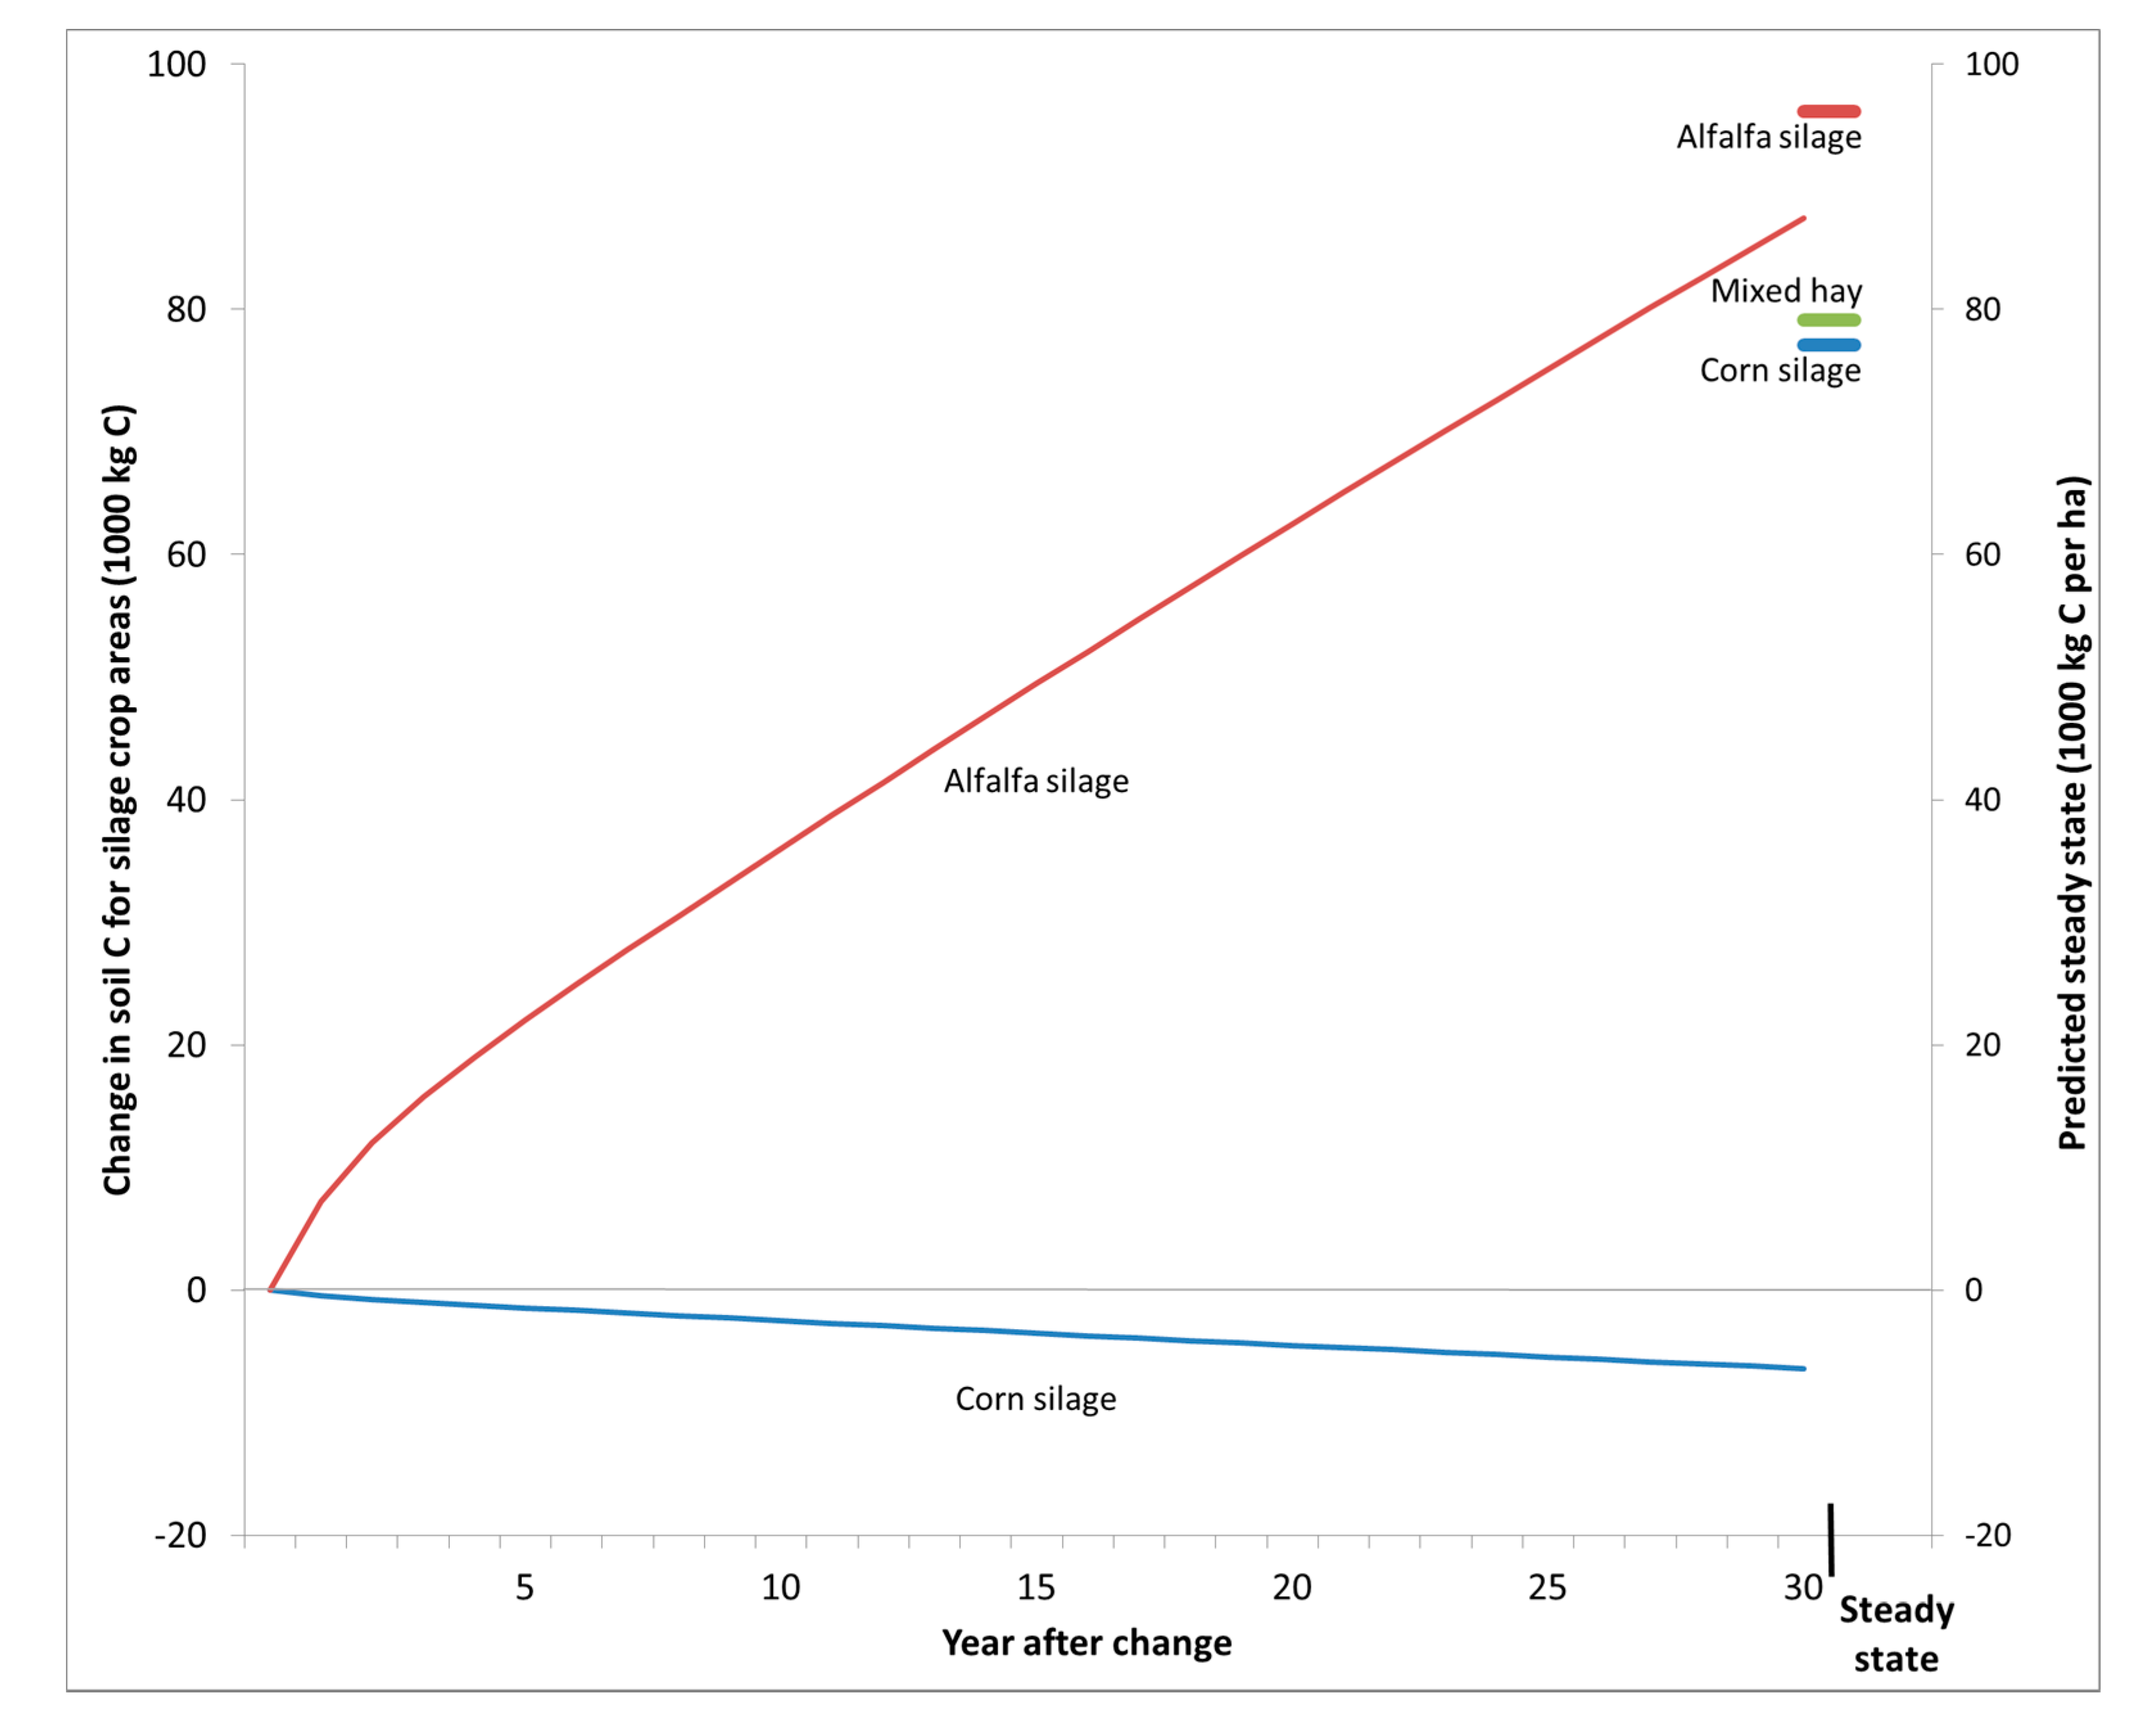
3.6. Soil Carbon
4. Conclusions
Acknowledgments
Author Contributions
Conflicts of Interest
References
- Food and Agriculture Organization of the United Nations (FAO). Tackling Climate Change through Livestock. A Global Assessment of Emissions and Mitigation Opportunities; Food and Agriculture Organization of the United Nations—Animal Production and Health Division: Rome, Italy, 2013. [Google Scholar]
- O’Mara, F.P. The significance of livestock as a contributor to global greenhouse gas emissions today and in the near future. Anim. Feed Sci. Technol. 2011, 166–167, 7–15. [Google Scholar] [CrossRef]
- Food and Agriculture Organization of the United Nations (FAO). Greenhouse Gas Emissions from the Dairy Sector: A Life Cycle Assessment; Food and Agriculture Organization of the United Nations—Animal Production and Health Division: Rome, Italy, 2010. [Google Scholar]
- Thoma, G.; Popp, J.; Nutter, D.; Shonnard, D.; Ulrich, R.; Matlock, M.; Kim, D.S.; Neiderman, Z.; Kemper, N.; East, C.; et al. Greenhouse gas emissions from milk production and consumption in the United States: A cradle-to-grave life cycle assessment circa 2008. Int. Dairy J. 2013, 31, S3–S14. [Google Scholar] [CrossRef]
- Canadian Dairy Information Centre. Historical Milk Production. Available online: dairyinfo.gc.ca/index_e.php?s1=dff-fcil&s2=msp-lpl&s3=hmp-phl (accessed on 16 October 2017).
- Environment Canada. National Inventory Report 1990–2013: Greenhouse Gas Sources and Sinks in Canada; Environment Canada: Gatineau, QC, Canada, 2015.
- Vergé, X.P.C.; Dyer, J.A.; Desjardins, R.L.; Worth, D. Greenhouse gas emissions from the Canadian dairy industry in 2001. Agric. Syst. 2007, 94, 683–693. [Google Scholar] [CrossRef]
- Mc Geough, M.J.; Little, S.M.; Janzen, H.H.; McAllister, T.A.; McGinn, S.M.; Beauchemin, K.A. Life-cycle assessment of greenhouse gas emissions from dairy production in Eastern Canada: A case study. J. Dairy Sci. 2012, 95, 5164–5175. [Google Scholar] [CrossRef] [PubMed]
- Eckard, R.J.; Grainger, C.; de Klein, C.A.M. Options for the abatement of methane and nitrous oxide from ruminant production: A review. Livest. Sci. 2010, 130, 47–56. [Google Scholar] [CrossRef]
- Martin, C.; Morgavi, D.P.; Doreau, M. Methane mitigation in ruminants: From microbe to the farm scale. Animal 2010, 4, 351–365. [Google Scholar] [CrossRef] [PubMed]
- Hristov, A.N.; Oh, J.; Lee, C.; Meinen, R.; Montes, F.; Ott, T.; Firkins, J.; Rotz, A.; Dell, C.; Adesogan, A.; et al. Mitigation of Greenhouse Gas Emissions in Livestock Production—A Review of Technical Options For Non-CO2 Emissions; FAO Animal Production and Health Paper No. 177; Gerber, P.J., Henderson, B., Makkar, H.P.S., Eds.; Food and Agriculture Organization of the United Nations: Rome, Italy, 2013. [Google Scholar]
- Knapp, J.R.; Laur, G.L.; Vadas, P.A.; Weiss, W.P.; Tricarico, J.M. Invited review: Enteric methane in dairy cattle production: Quantifying the opportunities and impact of reducing emissions. J. Dairy Sci. 2014, 97, 3231–3261. [Google Scholar] [CrossRef] [PubMed]
- Hassanat, F.; Gervais, R.; Julien, C.; Massé, D.I.; Lettat, A.; Chouinard, P.Y.; Petit, H.V.; Benchaar, C. Replacing alfalfa silage with corn silage in dairy cow diets: Effects on enteric methane production, ruminal fermentation, digestion, N balance, and milk production. J. Dairy Sci. 2013, 96, 4553–4567. [Google Scholar] [CrossRef] [PubMed]
- Benchaar, C.; Hassanat, F.; Gervais, R.; Chouinard, P.Y.; Petit, H.V.; Massé, D.I. Methane production, digestion, ruminal fermentation, nitrogen balance, and milk production of cows fed corn silage- or barley silage-based diets. J. Dairy Sci. 2014, 97, 961–974. [Google Scholar] [CrossRef] [PubMed]
- Paustian, K.; Andrén, O.; Janzen, H.H.; Lal, R.; Smith, P.; Tian, G.; Tiessen, H.; Van Noordwijk, M.; Woomer, P.L. Agricultural soils as a sink to mitigate CO2 emissions. Soil Use Manag. 1997, 13, 230–244. [Google Scholar] [CrossRef]
- Follett, R.F. Soil management concepts and carbon sequestration in cropland soils. Soil Till. Res. 2001, 61, 77–92. [Google Scholar] [CrossRef]
- Jarecki, M.K.; Lal, R. Crop Management for Soil Carbon Sequestration. Crit. Rev. Plant Sci. 2003, 22, 471–502. [Google Scholar] [CrossRef]
- Rotz, C.A.; Montes, F.; Chianese, D.S. The carbon footprint of dairy production systems through partial life cycle assessment. J. Dairy Sci. 2010, 93, 1266–1282. [Google Scholar] [CrossRef] [PubMed]
- Flysjo, A.; Henriksson, M.; Cederberg, C.; Ledgard, S.; Englund, J.-E. The impact of various parameters on the carbon footprint of milk production in New Zealand and Sweden. Agric. Syst. 2011, 104, 459–469. [Google Scholar] [CrossRef]
- Del Prado, A.; Chadwick, D.; Cardenas, L.; Misselbrook, T.; Scholefield, D.; Merino, P. Exploring systems responses to mitigation of GHG in UK dairy farms. Agric. Ecosyst. Environ. 2010, 136, 318–332. [Google Scholar] [CrossRef]
- Vellinga, T.V.; Hoving, I.E. Maize silage for dairy cows: Mitigation of methane emissions can be offset by land use change. Nutr. Cycl. Agroecosyst. 2010, 89, 413–426. [Google Scholar] [CrossRef]
- Janzen, H.H.; Angers, D.A.; Boehm, M.; Bolinder, M.; Desjardins, R.L.; Dyer, J.A.; Ellert, B.H.; Gibb, D.J.; Gregorich, E.G.; Helgason, B.L.; et al. A proposed approach to estimate and reduce net greenhouse gas emissions from whole farms. Can. J. Soil Sci. 2006, 86, 401–418. [Google Scholar] [CrossRef]
- Little, S.M.; Lindeman, J.; Maclean, K.; Janzen, H.H. Holos—A Tool to Estimate and Reduce GHGs from Farms; Methodology and Algorithms for Version 2.0; Agriculture and Agri-Food Canada: Ottawa, ON, Canada, 2013.
- Marshall, I.B.; Schut, P.H.; Ballard, M. A National Ecological Framework for Canada: Attribute Data; Agriculture and Agri-Food Canada: Ottawa, ON, Canada, 1999. Available online: sis.agr.gc.ca/cansis/nsdb/ecostrat/1999report/index.html (accessed on 18 September 2017).
- Soil Landscapes of Canada Working Group (SLC). Soil Landscapes of Canada Version 3.2. Agriculture and Agri-Food Canada. (Digital Map and Database at 1:1 Million Scale). Available online: sis.agr.gc.ca/cansis/nsdb/slc/v3.2/index.html (accessed on 25 September 2017).
- United States Department of Agriculture (USDA). Dairy 2007, Heifer Calf Health and Management on US Dairy Operations. # 550.0110; United States Department of Agriculture: Animal and Plant Health Inspection Service: Veterinary Services (USDA:APHIS:VS): Centers for Epidemiology and Animal Health (CEAH): Fort Collins, CO, USA, 2010. [Google Scholar]
- Valacta Inc. L’évolution de la production laitière québécoise. In Le Producteur de Lait Québécois; Valacta Inc.: Sainte-Anne-de-Bellevue, QC, Canada, 2009. [Google Scholar]
- Guyader, J.; Little, S.; Kröbel, R.; Benchaar, C.; Beauchemin, K. Comparison of greenhouse gas emissions from corn- and barley-based dairy production systems in Eastern Canada. Agric. Syst. 2017, 152, 38–46. [Google Scholar] [CrossRef]
- CRAAQ. Référence Economique: Foin AGDEX 120/854; Maïs-Fourrager AGDEX 111/821a; Maïs-Grain AGDEX 111/821b; Orge d’alimentation Animale AGDEX 114/821a; Soya AGDEX 141/821; Centre de Référence en Agriculture et Agroalimentaire du Québec: Québec, QC, Canada, 2010. [Google Scholar]
- Rotz, C.A.; Muck, R.E. Changes in forage quality during harvest and storage. In Forage Quality, Evaluation, and Utilization; Fahey, G.C., Collins, M., Mertens, D.R., Moser, L.E., Eds.; American Society of Agronomy, Crop Science Society of America, Soil Science Society of America: Madison, WI, USA, 1994; pp. 828–868. ISBN 9780891181194. [Google Scholar]
- Janzen, H.H.; Beauchemin, K.A.; Bruinsma, Y.; Campbell, C.A.; Desjardins, R.L.; Ellert, B.H. The fate of nitrogen in agroecosystems: An illustration using Canadian estimates. Nutr. Cycl. Agroecosyst. 2003, 67, 85–102. [Google Scholar] [CrossRef]
- Nagy, C.N. Energy and Greenhouse Gas Emissions Coefficients for Inputs Used in Agriculture. In Report to the Prairie Adaptation Research Collaborative; Centre for Studies in Agriculture, Law and the Environment: Saskatoon, SK, Canada, 2000. [Google Scholar]
- O’Brien, D.; Capper, J.L.; Garnsworthy, P.C.; Grainger, C.; Shalloo, L. A case study of the carbon footprint of milk from high-performing confinement and grass-based dairy farms. J. Dairy Sci. 2014, 97, 1835–1851. [Google Scholar] [CrossRef] [PubMed]
- Intergovernmental Panel on Climate Change (IPCC). 2006 IPCC Guidelines for National Greenhouse Gas Inventories; National Greenhouse Gas Inventories Programme; Eggleston, H.S., Buendia, L., Miwa, K., Ngara, T., Tanabe, K., Eds.; IGES: Prefecture, Japan, 2006. [Google Scholar]
- Rochette, P.; Worth, D.E.; Lemke, R.L.; McConkey, B.G.; Pennock, D.J.; Wagner-Riddle, C.; Desjardins, R.L. Estimation of N2O emissions from agricultural soils in Canada. I. Development of a country-specific methodology. Can. J. Soil Sci. 2008, 88, 641–654. [Google Scholar] [CrossRef]
- Environment Canada. National Inventory Report 1990–2012—Greenhouse Gas Sources and Sinks in Canada; Environment Canada: Gatineau, QC, Canada, 2014.
- Dabbour, M.; Bahnasawy, A.; Ali, S.; El-Haddad, Z. Energy Consumption in Manufacturing of Different Types of Feeds. Available online: www.academia.edu/8373073/ENERGY_CONSUMPTION_IN_MANUFACTURING_OF_DIFFERENT_TY PES_OF_FEEDS (accessed on 20 September 2015).
- CGB Enterprises, Inc. Soybean Processing. Available online: www.cgb.com/businessunits/soybeanprocessing.aspx (accessed on 15 June 2016).
- United States Department of Agriculture (USDA). Agricultural Marketing Service. Available online: marketnews.usda.gov/mnp/ls-report-config (accessed on 21 June 2016).
- Adom, F.; Workman, C.; Thoma, G.; Shonnard, D. Carbon footprint analysis of dairy feed from a mill in Michigan, USA. Int. Dairy J. 2013, 31 (Suppl. 1), S21–S28. [Google Scholar] [CrossRef]
- Myhre, G.; Shindell, D.; Bréon, F.-M.; Collins, W.; Fuglestvedt, J.; Huang, J.; Koch, D.; Lamarque, J.-F.; Lee, D.; Mendoza, B.; et al. Anthropogenic and Natural Radiative Forcing. In Climate Change 2013: The Physical Science Basis. Contribution of Working Group I to the Fifth Assessment Report of the Intergovernmental Panel on Climate Change; Stocker, T.F., Qin, D., Plattner, G.-K., Tignor, M., Allen, S.K., Boschung, J., Nauels, A., Xia, Y., Bex, V., Midgley, P.M., Eds.; Cambridge University Press: Cambridge, UK; New York, NY, USA, 2013. [Google Scholar]
- National Research Council (NRC). Nutrient Requirements of Dairy Cattle: Seventh Revised Edition; The National Academies Press: Washington, DC, USA, 2001. [Google Scholar] [CrossRef]
- Bolinder, M.A.; Janzen, H.H.; Gregorich, E.G.; Angers, D.A.; VandeBygaart, A.J. An approach for estimating net primary production and annual carbon inputs to soil for common agricultural crops in Canada. Agric. Ecosyst. Environ. 2007, 118, 29–42. [Google Scholar] [CrossRef]
- International Organization for Standardization (ISO). Greenhouse Gases—Carbon Footprint of Products—Requirements and Guidelines for Quantification and Communication, Technical Specification 14067; ISO: Geneva, Switzerland, 2013. [Google Scholar]
- International Dairy Federation (IDF). A Common Carbon Footprint Approach for Dairy—The IDF Guide to Standard Lifecycle Assessment Methodology for the Dairy Sector; International Dairy Federation: Brussels, Belgium, 2015. [Google Scholar]
- United States Department of Agriculture (USDA). National Nutrient Database for Standard Reference Release 28. Available online: www.nal.usda.gov/fnic/foodcomp/search/ (accessed on 20 September 2017).
- Institut de la Statistique du Québec (ISQ). Gouvernement du Québec. Available online: www.stat.gouv.qc.ca/statistiques/agriculture/production-laitiere/statistiques_qc_mrc_cre.html (accessed on 21 September 2017).
- Agriculture and Agri-food Canada (AAFC). Red Meat Market Information—Price Reports. Available online: www.agr.gc.ca/redmeat/pri_eng.htm (accessed on 21 September 2015).
- Alberta Agriculture and Rural Development. Alberta Farm Input Survey Prices. Available online: www.agric.gov.ab.ca/app21/farminputprices (accessed on 21 September 2017).
- Schils, R.L.M.; Verhagen, A.; Aarts, H.R.M.; Šebek, L.B.J. A farm level approach to define successful mitigation strategies for GHG emissions from ruminant livestock systems. Nutr. Cycl. Agroecosyst. 2005, 71, 163–175. [Google Scholar] [CrossRef]
- O’Brien, D.; Shalloo, L.; Patton, J.; Buckley, F.; Grainger, C.; Wallace, M. A life cycle assessment of seasonal grass-based and confinement dairy farms. Agric. Syst. 2012, 107, 33–46. [Google Scholar] [CrossRef]
- Del Prado, A.; Mas, K.; Pardo, G.; Gallejones, P. Modelling the interactions between C and N farm balances and GHG emissions from confinement dairy farms in northern Spain. Sci. Total Environ. 2013, 465, 156–165. [Google Scholar] [CrossRef] [PubMed]
- Andrén, O.; Kätterer, T. ICBM: The introductory carbon balance model for exploration of soil carbon balances. Ecol. Appl. 1997, 7, 1226–1236. [Google Scholar] [CrossRef]
- Kröbel, R.; Bolinder, M.A.; Janzen, H.H.; Little, S.M.; Vandenbygaart, A.J.; Kätterer, T. Canadian farm-level soil carbon change assessment by merging the greenhouse gas model Holos with the Introductory Carbon Balance Model (ICBM). Agric. Syst. 2016, 143, 76–85. [Google Scholar] [CrossRef]
- Bolinder, M.A.; VandenBygaart, A.J.; Gregorich, E.G.; Angers, D.A.; Janzen, H.H. Modeling soil organic carbon stock change for estimating whole-farm greenhouse gas emissions. Can. J. Soil Sci. 2006, 86, 419–429. [Google Scholar] [CrossRef]
- VandenBygaart, A.J.; Gregorich, E.G.; Angers, D.A.; Bolinder, M.A.; Janzen, H.H.; Campbell, C.A. Modeling soil organic carbon change in Canadian agroecosystems: Testing the Introductory Carbon Balance Model. In Soil Carbon Sequestration and the Greenhouse Effect; SSSA Spec. Publ. 57; Lal, R., Follett, R.F., Eds.; Soil Science Society of America: Madison, WI, USA, 2009; pp. 13–28. ISBN 978-0-89118-859-9. [Google Scholar]
- Bolinder, M.A.; Andrén, O.; Kätterer, T.; Parent, L.-E. Soil organic carbon sequestration potential for Canadian agricultural ecoregions calculated using the introductory carbon balance model. Can. J. Soil Sci. 2008, 88, 451–460. [Google Scholar] [CrossRef]
- Kätterer, T.; Andersson, L.; Andrén, O.; Persson, J. Long-term impact of chronosequential land use change on soil carbon stocks on a Swedish farm. Nutr. Cycl. Agroecosyst. 2008, 81, 145–155. [Google Scholar] [CrossRef]
- Andrén, O.; Kätterer, T.; Karlsson, T. ICBM regional model for estimations of dynamics of agricultural soil carbon pools. Nutr. Cycl. Agroecosyst. 2004, 70, 231–239. [Google Scholar] [CrossRef]
- National Academies of Sciences, Engineering, and Medicine (NASEM). Nutrient Requirements of Beef Cattle: Eighth Revised Edition; The National Academies Press: Washington, DC, USA, 2016. [Google Scholar] [CrossRef]
- Chadwick, D.; Sommer, S.; Thorman, R.; Fangueiro, D.; Cardenas, L.; Amon, B.; Misselbrook, T. Manure management: Implications for greenhouse gas emissions. Anim. Feed Sci. Technol. 2011, 166–167, 514–531. [Google Scholar] [CrossRef]
- Dong, R.L.; Zhao, G.Y.; Chai, L.L.; Beauchemin, K.A. Prediction of urinary and fecal nitrogen excretion by beef cattle. J. Anim. Sci. 2014, 92, 4669–4681. [Google Scholar] [CrossRef] [PubMed]
- Jayasundara, S.; Wagner-Riddle, C. Greenhouse gas emissions intensity of Ontario milk production in 2011 compared with 1991. Can. J. Anim. Sci. 2013, 94, 155–173. [Google Scholar] [CrossRef]
- O’Brien, D.; Shalloo, L.; Buckley, F.; Horan, B.; Grainger, C.; Wallace, M. The effect of methodology on estimates of greenhouse gas emissions from grass-based dairy systems. Agric. Ecosyst. Environ. 2011, 141, 39–48. [Google Scholar] [CrossRef]
- Guyader, J.; Janzen, H.H.; Kroebel, R.; Beauchemin, K.A. Invited Review: Forage utilization to improve environmental sustainability of ruminant production. J. Anim. Sci. 2016, 94, 3147–3158. [Google Scholar] [CrossRef] [PubMed]
- Smith, P. Do grasslands act as a perpetual sink for carbon? Glob. Chang. Biol. 2014, 20, 2708–2711. [Google Scholar] [CrossRef] [PubMed]


| Animal Group | Lactating Cows | Dry Cows, Bred Heifers, Heifers | Calves | Calves | Veal Calves | Veal Calves | ||
|---|---|---|---|---|---|---|---|---|
| Scenario/Age Group | Alfalfa Silage | Corn Silage | Alfalfa Silage | Corn Silage | 4–6 Months | 0–3 Months | 4–6.5 Months | 0–3 Months |
| Feed ingredient (% dry matter (DM)) | ||||||||
| Alfalfa silage | 56.4 | - | 27.0 | - | - | - | - | - |
| Corn silage | - | 56.4 | - | 27.0 | - | - | - | - |
| Corn grain, ground | 25.5 | 12.4 | - | - | 1.75 | 10.5 | 100.0 | 40.0 |
| Barley grain | - | - | - | - | 1.75 | 10.5 | - | - |
| Soybean meal | 2.2 | 16.2 | - | - | 1.25 | 7.5 | - | - |
| Soybean hulls | 5.9 | 5.8 | - | - | - | - | - | - |
| Grass/legume hay | 3.2 | 3.2 | 73.0 | 73.0 | 95.0 | - | - | - |
| Corn gluten feed | 2.1 | 3.0 | - | - | - | - | - | - |
| Rumen inert fat | 2.0 | - | - | - | - | - | - | - |
| Urea | - | 0.2 | - | - | - | - | - | - |
| Calcium carbonate | 0.5 | 0.6 | - | - | - | - | - | - |
| Potassium carbonate | - | 0.4 | - | - | - | - | - | - |
| Mineral/vitamin supplement | 2.3 | 1.8 | - | - | 0.25 | 1.5 | - | - |
| Milk replacer | - | - | - | - | - | 70.0 | - | 60.0 |
| Diet characteristics | ||||||||
| Total digestible nutrient content (% DM) | 67.7 | 70.5 | 58.5 | 60.2 | 59.5 | 89.4 | 88.0 | 89.2 |
| Crude protein (% DM) | 16.8 | 15.6 | 18.9 | 15.3 | 20.4 | 19.4 | 9.0 | 15.6 |
| Ym (% gross energy intake) | 5.85 | 5.27 | 6.80 | 6.50 | 6.50 | 0.90 | 3.00 | 1.20 |
| Item | Alfalfa Silage Scenario | Corn Silage Scenario |
|---|---|---|
| Milk production (kg head−1 day−1) | 32.3 | 34.3 |
| Fat and protein corrected milk (FPCM) (kg head−1 day−1) a | 30.7 | 30.5 |
| Milk fat (%) | 3.88 | 3.26 |
| Milk protein (%) | 3.04 | 3.22 |
| Characteristic | Alfalfa Silage | Corn Silage | Mixed Hay | Corn Grain | Barley Grain | Soybean | Barley Silage f |
|---|---|---|---|---|---|---|---|
| Agronomic characteristics | |||||||
| Yield (kg ha−1) a | 6000 | 10,000 | 5020 | 8300 | 3100 | 2700 | 7000 |
| Nitrogen fertilizer rate (kg N ha−1) b | 0 | 150 | 0 | 160 | 80 | 20 | n.a. |
| Phosphorus fertilizer rate (kg P2O5 ha−1) b | 0 | 50 | 0 | 50 | 35 | 40 | n.a. |
| Herbicide use b | No | Yes | No | Yes | Yes | Yes | n.a. |
| Harvest/ storage loss (%) c | 12 | 12 | 12 | 3 | 3 | 3 | n.a. |
| Feed wastage (%) c | 5 | 5 | 20 | 0 | 0 | 0 | n.a. |
| Moisture content (%) d | 0 | 0 | 13 | 15 | 12 | 14 | 0 |
| Lime application (kg CaCO3 ha−1) e | 0 | 500 | 0 | 500 | 300 | 200 | n.a. |
| Relative dry matter allocation | |||||||
| Yield ratio d | 0.40 | 0.72 | 0.40 | 0.47 | 0.38 | 0.30 | 0.72 |
| Above ground residue ratio d | 0.10 | 0.08 | 0.10 | 0.38 | 0.47 | 0.45 | 0.13 |
| Below ground residue ratio d | 0.50 | 0.20 | 0.50 | 0.15 | 0.15 | 0.25 | 0.15 |
| Residue nitrogen content (kg N kg−1) | |||||||
| Above ground d | 0.015 | 0.013 | 0.015 | 0.005 | 0.007 | 0.006 | n.a. |
| Below ground d | 0.015 | 0.007 | 0.015 | 0.007 | 0.010 | 0.010 | n.a. |
| Yearly crop area (ha) | |||||||
| Alfalfa silage scenario | 29.05 | 0 | 18.62 | 9.83 | 0.08 | 4.33 | n.a. |
| Corn silage scenario | 0 | 18.17 | 17.75 | 5.79 | 0.08 | 15.49 | n.a. |
| Source | Emission Factor | Unit | Source |
|---|---|---|---|
| Crop production | |||
| Cropping corn silage | 161.0 | kg ha−1 | Little et al. [23] |
| Cropping alfalfa silage | 56.7 | kg ha−1 | Little et al. [23] |
| Cropping mixed hay | 56.7 | kg ha−1 | Little et al. [23] |
| Cropping corn grain | 161.0 | kg ha−1 | Little et al. [23] |
| Cropping barley grain | 126.0 | kg ha−1 | Little et al. [23] |
| Cropping soybean | 149.1 | kg ha−1 | Little et al. [23] |
| Herbicide manufacture for corn silage | 0.696 | kg ha−1 | Little et al. [23] |
| Herbicide manufacture for corn grain | 0.696 | kg ha−1 | Little et al. [23] |
| Herbicide manufacture for barley grain | 1.392 | kg ha−1 | Little et al. [23] |
| Herbicide manufacture for soybean | 0.696 | kg ha−1 | Little et al. [23] |
| N fertilizer manufacture | 3.59 | kg CO2e (kg N)−1 | Nagy [32] |
| P fertilizer manufacture | 0.5699 | kg CO2e (kg P2O5)−1 | Nagy [32] |
| Lime manufacture and transport | 0.043 | kg CO2e (kg CaCO3)−1 | O’Brien et al. [33] |
| Lime degradation | 0.44 | kg CO2e (kg CaCO3)−1 | IPCC [34] |
| N2O emissions-direct | 0.017 | kg N2O-N (kg N)−1 | Rochette et al. [35] |
| Leaching/runoff fraction | 0.3 | kg N (kg N)−1 | Rochette et al. [35] |
| N2O emissions-indirect due to leaching/runoff | 0.0075 | kg N2O-N (kg N)−1 | IPCC [34] |
| Volatilization fraction | 0.1 | kg N (kg N)−1 | IPCC [34] |
| N2O emissions-indirect due to volatilization | 0.01 | kg N2O-N (kg N)−1 | IPCC [34] |
| Crop processing | |||
| Drying corn | 0.014 | kg CO2e kg−1 | Vergé et al. [7] |
| Grinding corn | 0.0119 | g CO2e kg−1 | Environment Canada [36]; Dabbour et al. [37] |
| Processing and transport of soy meal | 0.0738 | kg CO2e kg−1 | Derived from CGB [38]; USDA [39] |
| Transport of soy hulls | 0.0013 | kg CO2e kg−1 | Derived from Mc Geough et al. [8]; CGB [38]; USDA [39] |
| Imported feed | |||
| Corn gluten feed | 1.061 | kg CO2e kg−1 | O’Brien et al. [33] |
| Rumen inert fat | 0.66 | kg CO2e kg−1 | Adom et al. [40] |
| Urea | 3.30 | kg CO2e kg−1 | Adom et al. [40] |
| Calcium carbonate | 0.013 | kg CO2e kg−1 | Adom et al. [40] |
| Potassium carbonate a | 1.59 | kg CO2e kg−1 | Adom et al. [40] |
| Mineral/vitamin supplement | 1.59 | kg CO2e kg−1 | Adom et al. [40] |
| Milk replacer | 0.00134 | kg CO2e kg−1 | O’Brien et al. [33] |
| Item | Alfalfa Silage System | Corn Silage System |
|---|---|---|
| Food production per cycle | ||
| Fat and protein corrected milk (FPCM) (kg) a | 1,802,328 | 1,789,906 |
| Milk energy (MJ) | 5,652,106 | 5,605,060 |
| Milk protein (kg) | 54,005 | 60,999 |
| Total live weight (kg) | 75,591 | 75,591 |
| Total carcass weight (kg) | 45,355 | 45,355 |
| Meat energy (MJ) b | 552,419 | 552,419 |
| Meat protein (kg) b | 7855 | 7855 |
| Total energy (MJ) b | 6,204,525 | 6,157,479 |
| Total protein (kg) b | 61,860 | 68,854 |
| Manure N per cycle (kg) | 32,001 | 27,476 |
| Required land area (ha year−1) | 61.90 | 57.28 |
| kg FPCM ha−1 year−1 | 4853 | 5208 |
| GHG emissions per cycle (kg CO2e) | ||
| Enteric CH4 | 1,036,657 | 976,453 |
| Manure CH4 | 197,380 | 184,590 |
| Manure N2O-direct | 112,528 | 92,974 |
| Soils/cropping N2O-direct | 573,340 | 561,986 |
| Indirect N2O (all sources) | 123,365 | 117,595 |
| Energy CO2 | 84,006 | 160,408 |
| Liming CO2 c | 15,346 | 41,176 |
| Imported feed (CO2) | 96,787 | 104,236 |
| Total | 2,239,408 | 2,239,418 |
| Item | Alfalfa Silage System | Corn Silage System |
|---|---|---|
| kg CO2e ha−1 a | 36,181 | 39,098 |
| kg CO2e (kg total protein)−1 b | 36.20 | 32.52 |
| kg CO2e (MJ total energy)−1 | 0.36 | 0.36 |
| 100% allocation to milk | ||
| Emission allocation to milk (%) | 100 | 100 |
| kg CO2e (kg FPCM)−1 c | 1.24 | 1.25 |
| kg CO2e (kg live weight)−1 | 0 | 0 |
| kg CO2e (kg carcass weight)−1 | 0 | 0 |
| Economic allocation | ||
| Emission allocation to milk (%) | 89.7 | 89.6 |
| kg CO2e (kg FPCM)−1 c | 1.11 | 1.12 |
| kg CO2e (kg live weight)−1 | 3.06 | 3.08 |
| kg CO2e (kg carcass weight)−1 | 5.10 | 5.13 |
| Economic allocation—manure as co-product | ||
| Emission allocation to milk (%) d | 87.3 | 87.5 |
| kg CO2e (kg FPCM)−1 c | 1.08 | 1.10 |
| kg CO2e (kg live weight)−1 | 2.98 | 3.01 |
| kg CO2e (kg carcass weight)−1 | 4.96 | 5.01 |
| kg CO2e (kg manure nitrogen)−1 | 1.63 | 1.65 |
| IDF (2015) allocation—calculated | ||
| Emission allocation to milk (%) | 74.7 | 74.5 |
| kg CO2e (kg FPCM)−1 c | 0.93 | 0.93 |
| kg CO2e (kg live weight)−1 | 7.50 | 7.56 |
| kg CO2e (kg carcass weight)−1 | 12.51 | 12.59 |
| IDF (2015) allocation—default | ||
| Emission allocation to milk (%) | 88.0 | 88.0 |
| kg CO2e (kg FPCM)−1 c | 1.09 | 1.10 |
| kg CO2e (kg live weight)−1 | 3.56 | 3.56 |
| kg CO2e (kg carcass weight)−1 | 5.93 | 5.93 |
© 2017 by the authors. Licensee MDPI, Basel, Switzerland. This article is an open access article distributed under the terms and conditions of the Creative Commons Attribution (CC BY) license (http://creativecommons.org/licenses/by/4.0/).
Share and Cite
Little, S.M.; Benchaar, C.; Janzen, H.H.; Kröbel, R.; McGeough, E.J.; Beauchemin, K.A. Demonstrating the Effect of Forage Source on the Carbon Footprint of a Canadian Dairy Farm Using Whole-Systems Analysis and the Holos Model: Alfalfa Silage vs. Corn Silage. Climate 2017, 5, 87. https://doi.org/10.3390/cli5040087
Little SM, Benchaar C, Janzen HH, Kröbel R, McGeough EJ, Beauchemin KA. Demonstrating the Effect of Forage Source on the Carbon Footprint of a Canadian Dairy Farm Using Whole-Systems Analysis and the Holos Model: Alfalfa Silage vs. Corn Silage. Climate. 2017; 5(4):87. https://doi.org/10.3390/cli5040087
Chicago/Turabian StyleLittle, Shannan M., Chaouki Benchaar, H. Henry Janzen, Roland Kröbel, Emma J. McGeough, and Karen A. Beauchemin. 2017. "Demonstrating the Effect of Forage Source on the Carbon Footprint of a Canadian Dairy Farm Using Whole-Systems Analysis and the Holos Model: Alfalfa Silage vs. Corn Silage" Climate 5, no. 4: 87. https://doi.org/10.3390/cli5040087
APA StyleLittle, S. M., Benchaar, C., Janzen, H. H., Kröbel, R., McGeough, E. J., & Beauchemin, K. A. (2017). Demonstrating the Effect of Forage Source on the Carbon Footprint of a Canadian Dairy Farm Using Whole-Systems Analysis and the Holos Model: Alfalfa Silage vs. Corn Silage. Climate, 5(4), 87. https://doi.org/10.3390/cli5040087