Article

Assessing the Value of Systematic Cycling in a Polluted Urban Environment

Department of Electronics, Information and Bioengineering (DEIB), Politecnico di Milano, 20133 Milan, Italy
*
Author to whom correspondence should be addressed.
Climate 2017, 5(3), 65; https://doi.org/10.3390/cli5030065
Submission received: 26 July 2017 / Revised: 17 August 2017 / Accepted: 18 August 2017 / Published: 24 August 2017
(This article belongs to the Special Issue Urban Climate, Air Pollution, and Public Health)

Abstract

:
The positive health effects of systematic cycling are weighted against the negative effects due to higher pollutant inhalation in the actual case of the city of Milan in northern Italy. The paper first evaluates the actual use of bikes in the city, and then considers why and how much such an active mobility style can be expanded. Two models are used to compare the outcome of cycling on the specific population sample with the equivalent path travelled by car. The first model computes the long term effects of the physical activity, and the second evaluates the exacerbation of some relevant diseases due to the exposure to high levels of pollutants, in the case at hand, mainly particulate matter with diameter smaller than 10 μm (PM10). According to these two models, the overall balance for public health is always in favour of systematic biking. Even the current level of biking, low in comparison to other European cities, allows a considerable economic advantage on the order of tens of millions euros per year. This may increase to hundreds of millions if the biking level of more bike-friendly cities is reached. Despite being much less relevant from the economic viewpoint, the study also estimates the reduction of pollution and greenhouse gas emissions corresponding to the assumed biking levels.

Graphical Abstract

1. Introduction

Cycling in an urban environment, often characterised by poor air quality, produces both positive and negative effects.
Positive effects can be observed on human health as a consequence of the physical activity performed during cycling, and on the environment, since a bicycle is a zero emission means of transport. From an economical point of view, using a bicycle allows for the saving of money, for example, expenses on fuel consumption, and it can also contribute to the creation of new jobs. The European Cyclists’ Federation [1] estimated that cycling generates annually over one billion euros of investments that make cycling one of the largest green employers in Europe.
The negative effects on human health are a consequence of the increased exposure to urban stressors, such as air pollution, noise, and accidents.
Recently, a number of studies have recognized and quantified the impacts on human health of cycling in urban environments (e.g., [2,3,4]). At the same time, real-world experiments are being undertaken in order to understand if the benefits of cycling can outweigh damages related to the inhalation of polluted air. For instance, in New York City and in Pittsburgh in the U.S., as well as in Toronto, Canada [5] and Piacenza, Italy [6], sample groups of bike commuters are equipped with pollution sensors and an array of health monitors to evaluate the inhaled dose and the health consequences of exposure to air pollutants. More in general, many studies have quantified the health effects of moving in different city microenvironments (e.g., [7,8,9,10]).
The objective of this work is to evaluate the sustainability of cycling in a specific urban area: Milan in northern Italy. The attention is focused on human health; so, benefits related to physical activity and damages due to air pollution are assessed and compared with reference to the urban environment of a middle-size, highly polluted city.
As in previous works, such as Tainio et al. [4], the impacts of cycling are appraised by combining two models, one estimating benefits and the other focusing on health and economic losses related to increased exposure. Therefore, data related to level of cycling and of pollutants in the atmosphere are needed, as well as information about the base-case health conditions of the population sample, such as the mortality rate.
The evaluation assumes that a bicycle is used as the alternative to a car. In average cities (with an equivalent diameter of 10 to 20 km), cycling mobility can represent a valid alternative to a car because average bike and car speeds are comparable as consequence of traffic and because car drivers have to spend a non-negligible amount of time looking for parking.
According to a survey by the American company INRIX [11], in Milan, people spend approximately 52 h per year searching for available parking lots. This confirms a previous study [12] that revealed that people moving to the city centre spent a quarter of their travel time in parking operations.
In this study, we considered the strengths and weakness of systematic cycling for trips to a work/study place; therefore, long-term effects are assessed. Before presenting the results in detail, the effect of cycling on human health is briefly summarized in the following Section, followed by a presentation of the specific characteristics of the case study. The tools adopted for the evaluation are introduced in Section 2. Section 3 analyses the possible consequences of different scenario assumptions, and, finally, some conclusions about actions to be undertaken to promote the population’s wellbeing are drawn in Section 4.

1.1. Effetcs of Biking on Human Health

Positive effects related to physical activity carried out during cycling appear as a reduction in terms of morbidity and mortality (see, for instance, [13]). A study performed in the U.K. [14] on a large sample of more than 250,000 workers, who use different means of transport to reach a work place, shows that people using a bicycle gain the benefit of a risk reduction in global mortality equal to 41%, while the reduction in terms of mortality related to heart disease is equal to 52%.
Though a precise mechanistic description of the long-term effect of cycling is not yet fully available, the data show a lower frequency in the occurrence of some diseases, such as cardiovascular diseases, stroke, colon cancer, breast cancer, type II diabetes, anxiety, and depression. According to Robinson et al. [15], this reduction is due to the fact that physical activity improves aerobic capacity and insulin sensitivity, has positive consequences on the muscle–skeletal system, blood pressure, and memory, and decreases levels of stress hormones [16].
On the opposite side, cyclists are exposed to higher doses of air pollution, which constitutes possibly the most significant stressor in the urban environment.
As is well-known, the exposure to air pollutants results in respiratory and cardiovascular diseases that lead to an increase in morbidity and mortality. The literature on this topic is extremely rich, starting from the seminal paper by Dockery et al. [17], and has been reviewed many times (e.g., [18,19]) and under various perspectives, until recently [20,21]. Landrigan [22] summarized the situation, estimating that air pollution was responsible for 4 million deaths worldwide in 2015. The consequences of exposure to air pollution are increased by the higher values of the ventilation rate of cycling. As with all active mobility styles, cyclists show faster respiration with respect to car drivers or public transport passengers, so the amount of inhaled dose of polluted air is greater when people choose a bicycle for urban trips.
Even limiting the urban stressors to air pollution, the problem is not completely defined. The mix of different pollutants normally present may determine different consequences in different classes of peoples (see again [8]). Furthermore, the pollutant mix differs during the year with, for instance, PM (particulate matter) prevailing in winter and Ozone in summer. Additionally, there may be strong differences in the spatial distribution of pollutants within a city. For instance, concentrations may substantially differ on the two sides of a street canyon and are much higher at traffic lights where cars accelerate, with substantially higher emissions (see, e.g., [23]).
How to account for these time and space differences is still an open problem (see for instance [24,25]). However, future emission patterns as well as future meteorology are affected by a large uncertainty, and the specific path of potential and future cyclists is not known. This prevents the possibility of linking the pollution distribution with the dose inhaled by cyclists in a coherent way. We can thus only rely on a simple general indicator, i.e., the spatial yearly average of the concentration, as in most of the studies quoted above. We also assume a “winner-takes-all” approach and consider only the effects of the most relevant pollutant. A linear approach that sums up all of the impacts of different pollutants can in fact overestimate the negative effects, since air pollutants are strongly correlated [26]. Thus, PM10 (particulate matter with diameter smaller than 10 μm) is the proxy indicator chosen, because it is representative of the mix of air pollutants, it is highly related to adverse health events, it has a fairly uniform distribution on wide areas, and its concentration is critical for many cities, such as Milan [27].

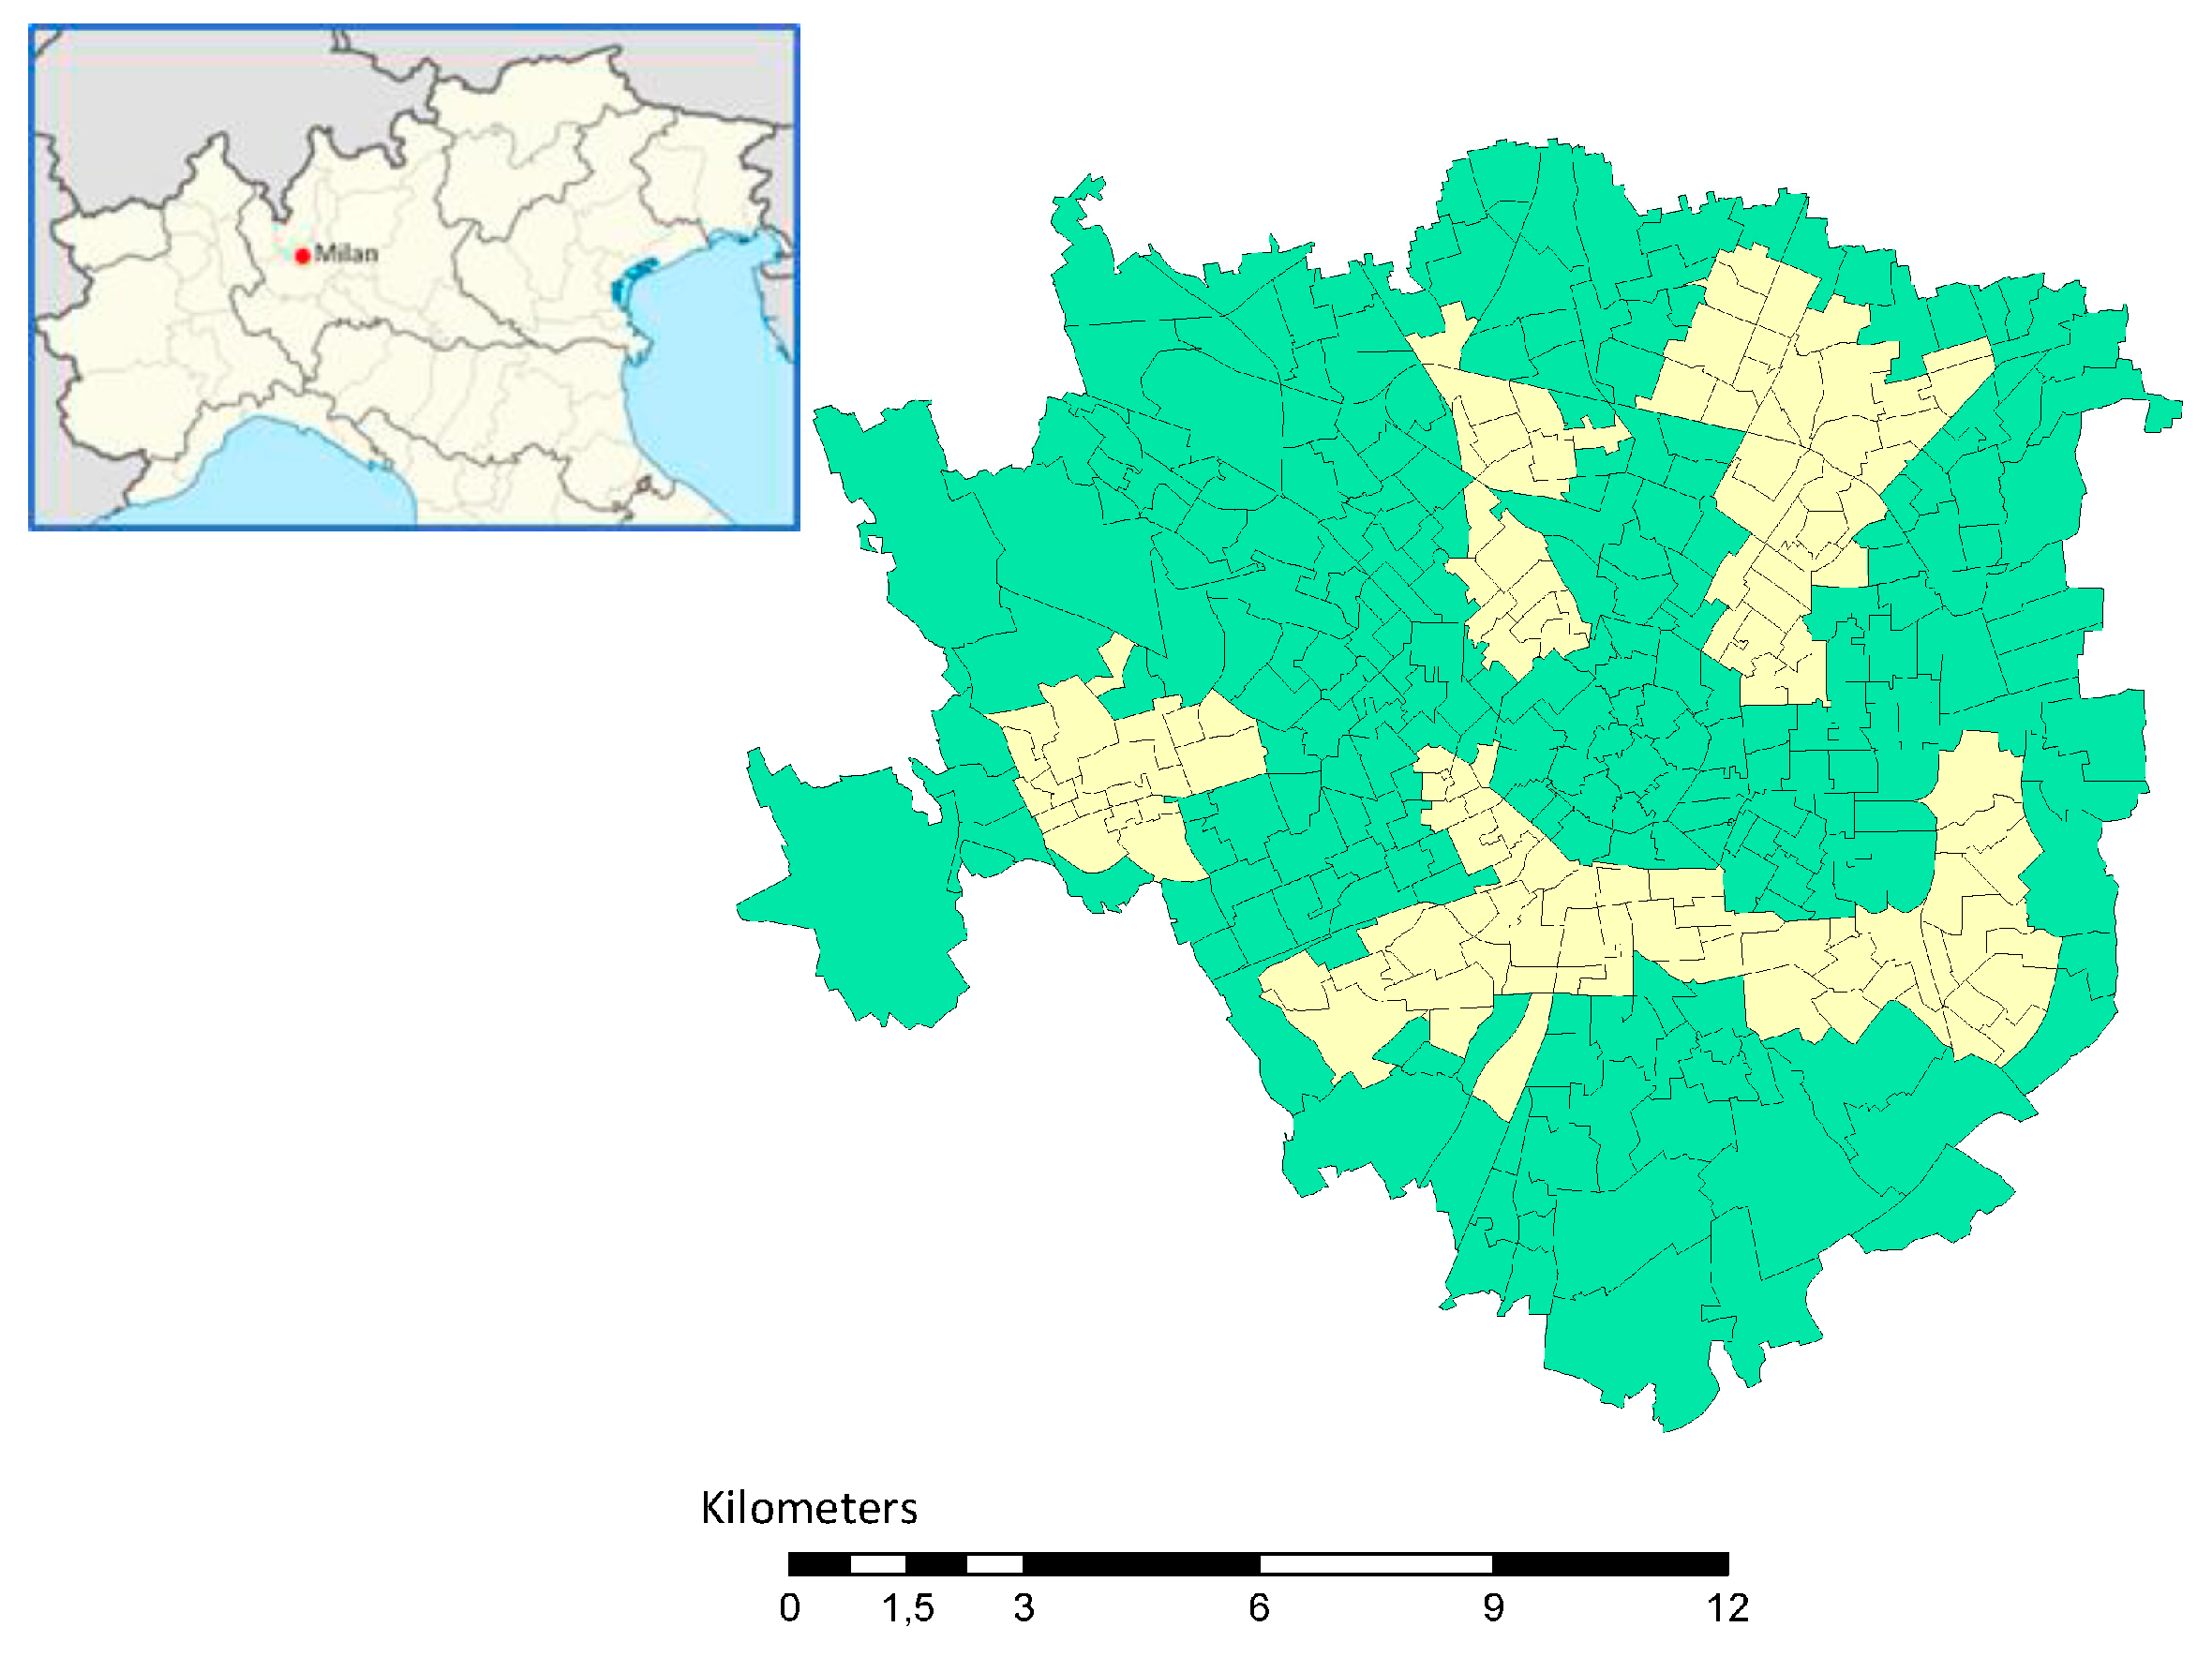
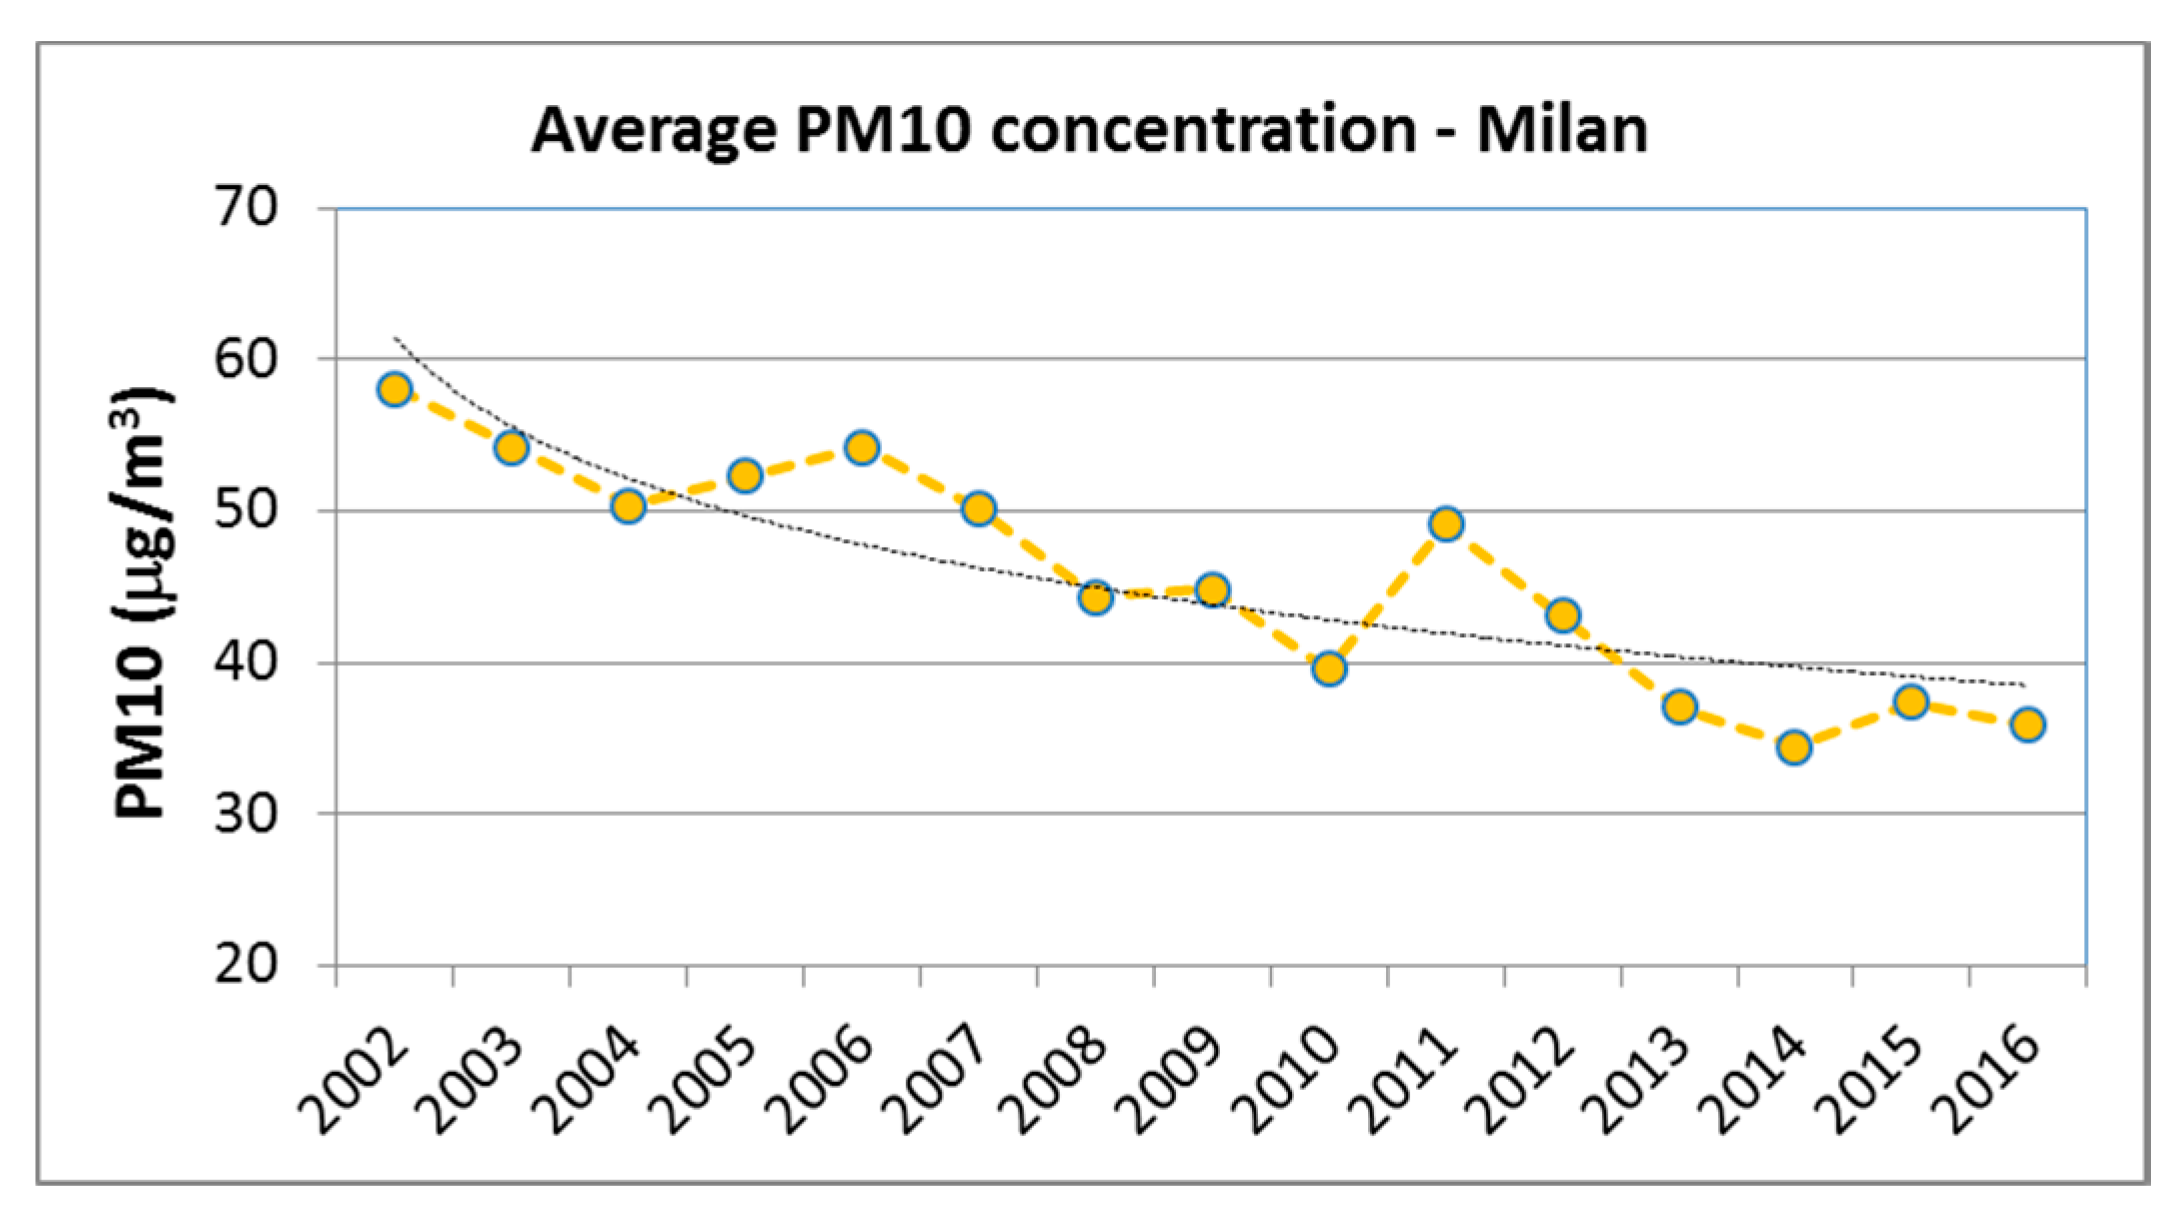
1.2. The Case of Milan

The city of Milan is in the centre of northern Italy, in an area where peculiar circulation conditions often determine poor air quality, particularly for PM and NOx.
In Milan, cycling mobility is growing: a census [28] reports that the number of cyclists has risen by 56% between 2002 and 2014, and bicycle drawing from the municipal bike sharing system has risen by 244% between 2008 and 2014 [29].
Nevertheless, cycling mobility in Milan is much less widespread than in other European countries, such as the Netherlands or Denmark.
In the Netherlands, the European country characterised by the highest number of cyclists, 26% of daily trips are by bike; in Amsterdam, a bicycle is used in 32% of daily trips, and there are more than 700 km of cycle paths [30,31].
In Italy, only 5% of daily journeys are by bike. In particular, in Milan, in 2013, cycling mobility represented 5.7% of daily trips, while 30.2% of the trips were by car. The Urban Plan for Sustainable Mobility [29] estimates an increase of bicycle trips to 7.1% by 2024, while car trips will be reduced to 22.9%. Also, cycle paths are not widely spread: their length is approximately 167 km, and they are not linked in a single network.
However, in Milan, there are also opportunities to promote cycling mobility.
The average length of systematic trips in the city can be evaluated by looking at the origin–destination matrix [32], which identifies the number of equivalent vehicles (the number of cars and motor-scooters, the last weighted with a homogenization coefficient equal to 0.5) in movement between the 373 zones (Figure 1) that compose the city of Milan on a weekday in traffic peak time between 8:00 a.m. and 9:00 a.m. Using Geographical Information Systems techniques, one can calculate the distance between the centres of gravity of the zones, and, by comparing data on distances and data on numbers of vehicles, we found that 80% of car and motor-scooter trips cover a distance of less than 5 km. This distance can be easily run by bike in 20–30 min, if we assume an average cycling speed of 10 or more km/h.
Also, weather conditions can help in promoting cycling mobility. In Milan, the number of rainy days per month is less than in Amsterdam, and the temperatures are usually milder (Figure 2).
Moreover, the morphology is flat, which constitutes another incentive to choose a bicycle.
The other side of the coin of biking in Milan is air pollution, a critical issue in the city, as already mentioned.
The main air pollutants (PM10, PM2.5, NO2, O3, CO, SO2, and benzene) are monitored by the local environmental agency (ARPA Lombardia), and, for instance, in 2015 the PM10, PM2.5, NO2, and O3 concentrations were higher than at least one of the limits set by legislation in force. In particular, PM10 exceeded both the annual limit of an average of 40 μg/m3 and the daily limit, which establishes that the daily average particulate matter concentration should not be higher than 50 μg/m3 for more than 35 days per year: in 2015, the mean annual concentration was 42 μg/m3, and the daily limit has been exceeded for 99 days, even when considering only weekdays.
Given these high concentrations, the negative effects caused by the increased exposure to air pollution cannot be disregarded when evaluating the impacts of cycling on human health.

2. Materials and Methods

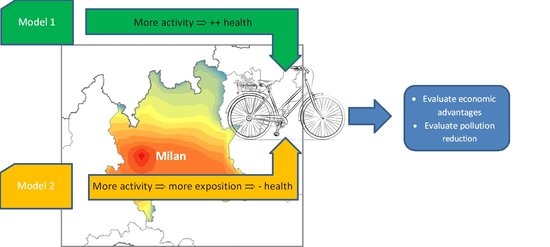
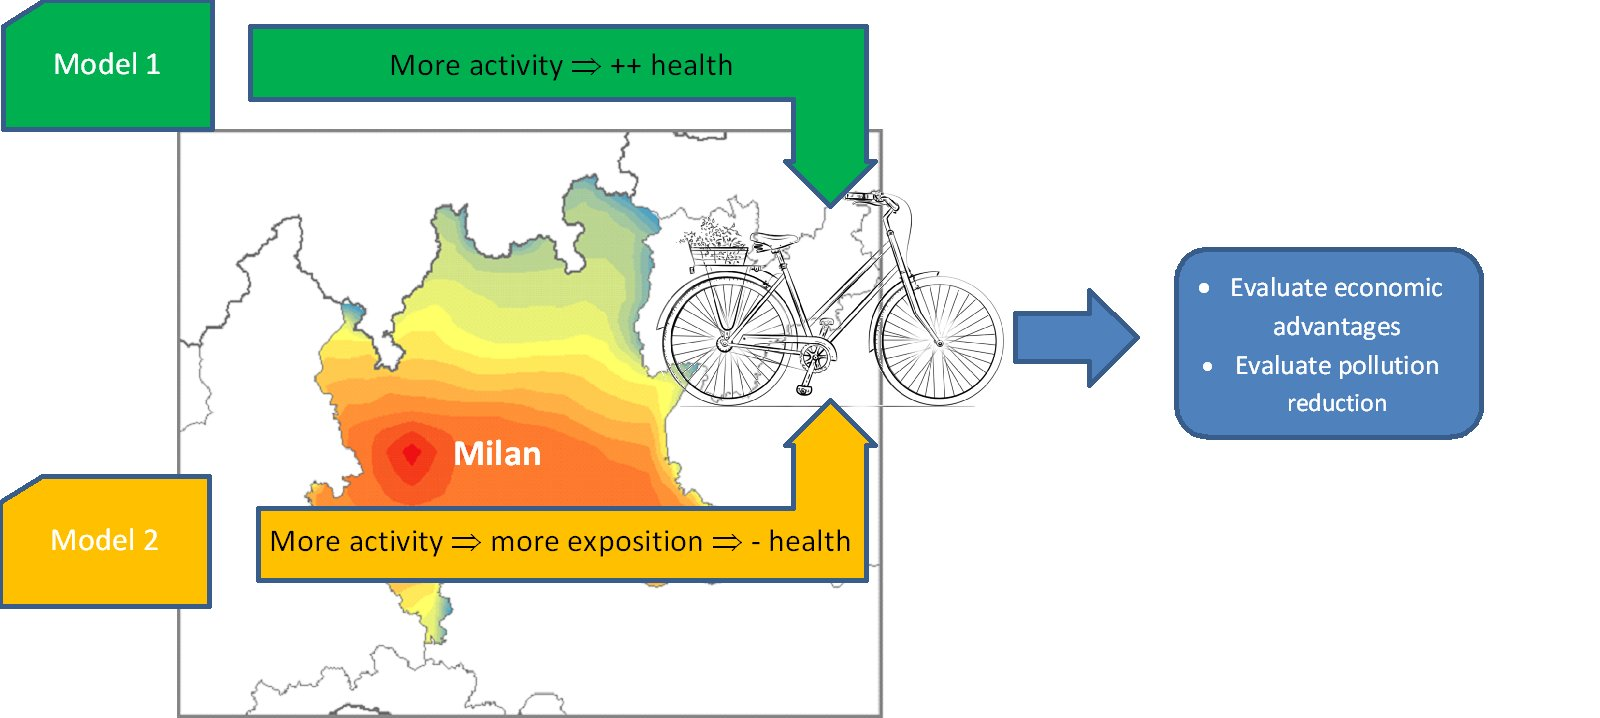
2.1. Cycling Benefits Model

The positive effects produced by physical activity can be assessed using the Health Economic Assessment Tool (HEAT) for cycling model, developed by the WHO in 2014.
The model calculates the reduction of mortality risk and the related economic value, given a level of cycling in a population sample.
HEAT for cycling estimates the effects on mortality and not on morbidity because the current evidence on morbidity is more limited [34]. In particular, the assessment refers to all-cause mortality, because such data are more significant and easily available than cause-specific ones, and because this assumption reduces the model parameters to just one [35].
Systematic cycling, i.e., a constant physical activity all the year round, normally connected with daily trips to work and to school, determines detectable benefits to human health only after a certain time: HEAT assumes that the positive effects will be fully realized after five years.
The model can be implemented to plan a new infrastructure, to evaluate the reduced mortality from past and current levels of cycling and the related economic consequences, and to provide an input to more comprehensive economic appraisal exercises.
HEAT for cycling must be used on a wide sample of a population (to make average values meaningful) in the range of 20–64 years, which should not be characterised by an already high average level of physical activity (i.e., professional sports).
The data required for the evaluation are:
  • The number of cyclists or the amount of trips in terms of average trips per person per day or of the total number of trips observed each day in the studied area; in this case, the proportion of trips that are return journeys needs to be entered;
  • The average time or the average distance spent by bike per person every day. One factor can be transformed into the other by assuming a constant value for speed. HEAT assumes by default a speed value of 14 km/h, on the basis of studies about usual trips to work/study places in Copenhagen and Stockholm [36];
  • The number of days per year when the sample uses a bicycle;
  • The current mortality rate expressed as the number of deaths for every 100,000 inhabitants;
  • The standard value of statistical life, namely an indicator of the economic value of human life;
  • The time period over which economic benefits are calculated (equal to 10 years by default);
  • The discount rate (by default, this value is set to 5%) to account for the delay between the starting of the physical activity and realisation of the corresponding benefits;
  • If available, the cost to promote cycling mobility.
The standard value of statistical life (VSL) is a method to value human life and it is critical to turn evaluations about mortality rates into monetary values. It is normally derived using the willingness-to-pay approach, which means how much a representative sample of the population would be willing to pay in monetary terms for a policy that would reduce their annual risk of dying, for instance, from 3 to 2 in 10,000. By default, HEAT implements the VSL values estimated by the OECD.
The model computes:
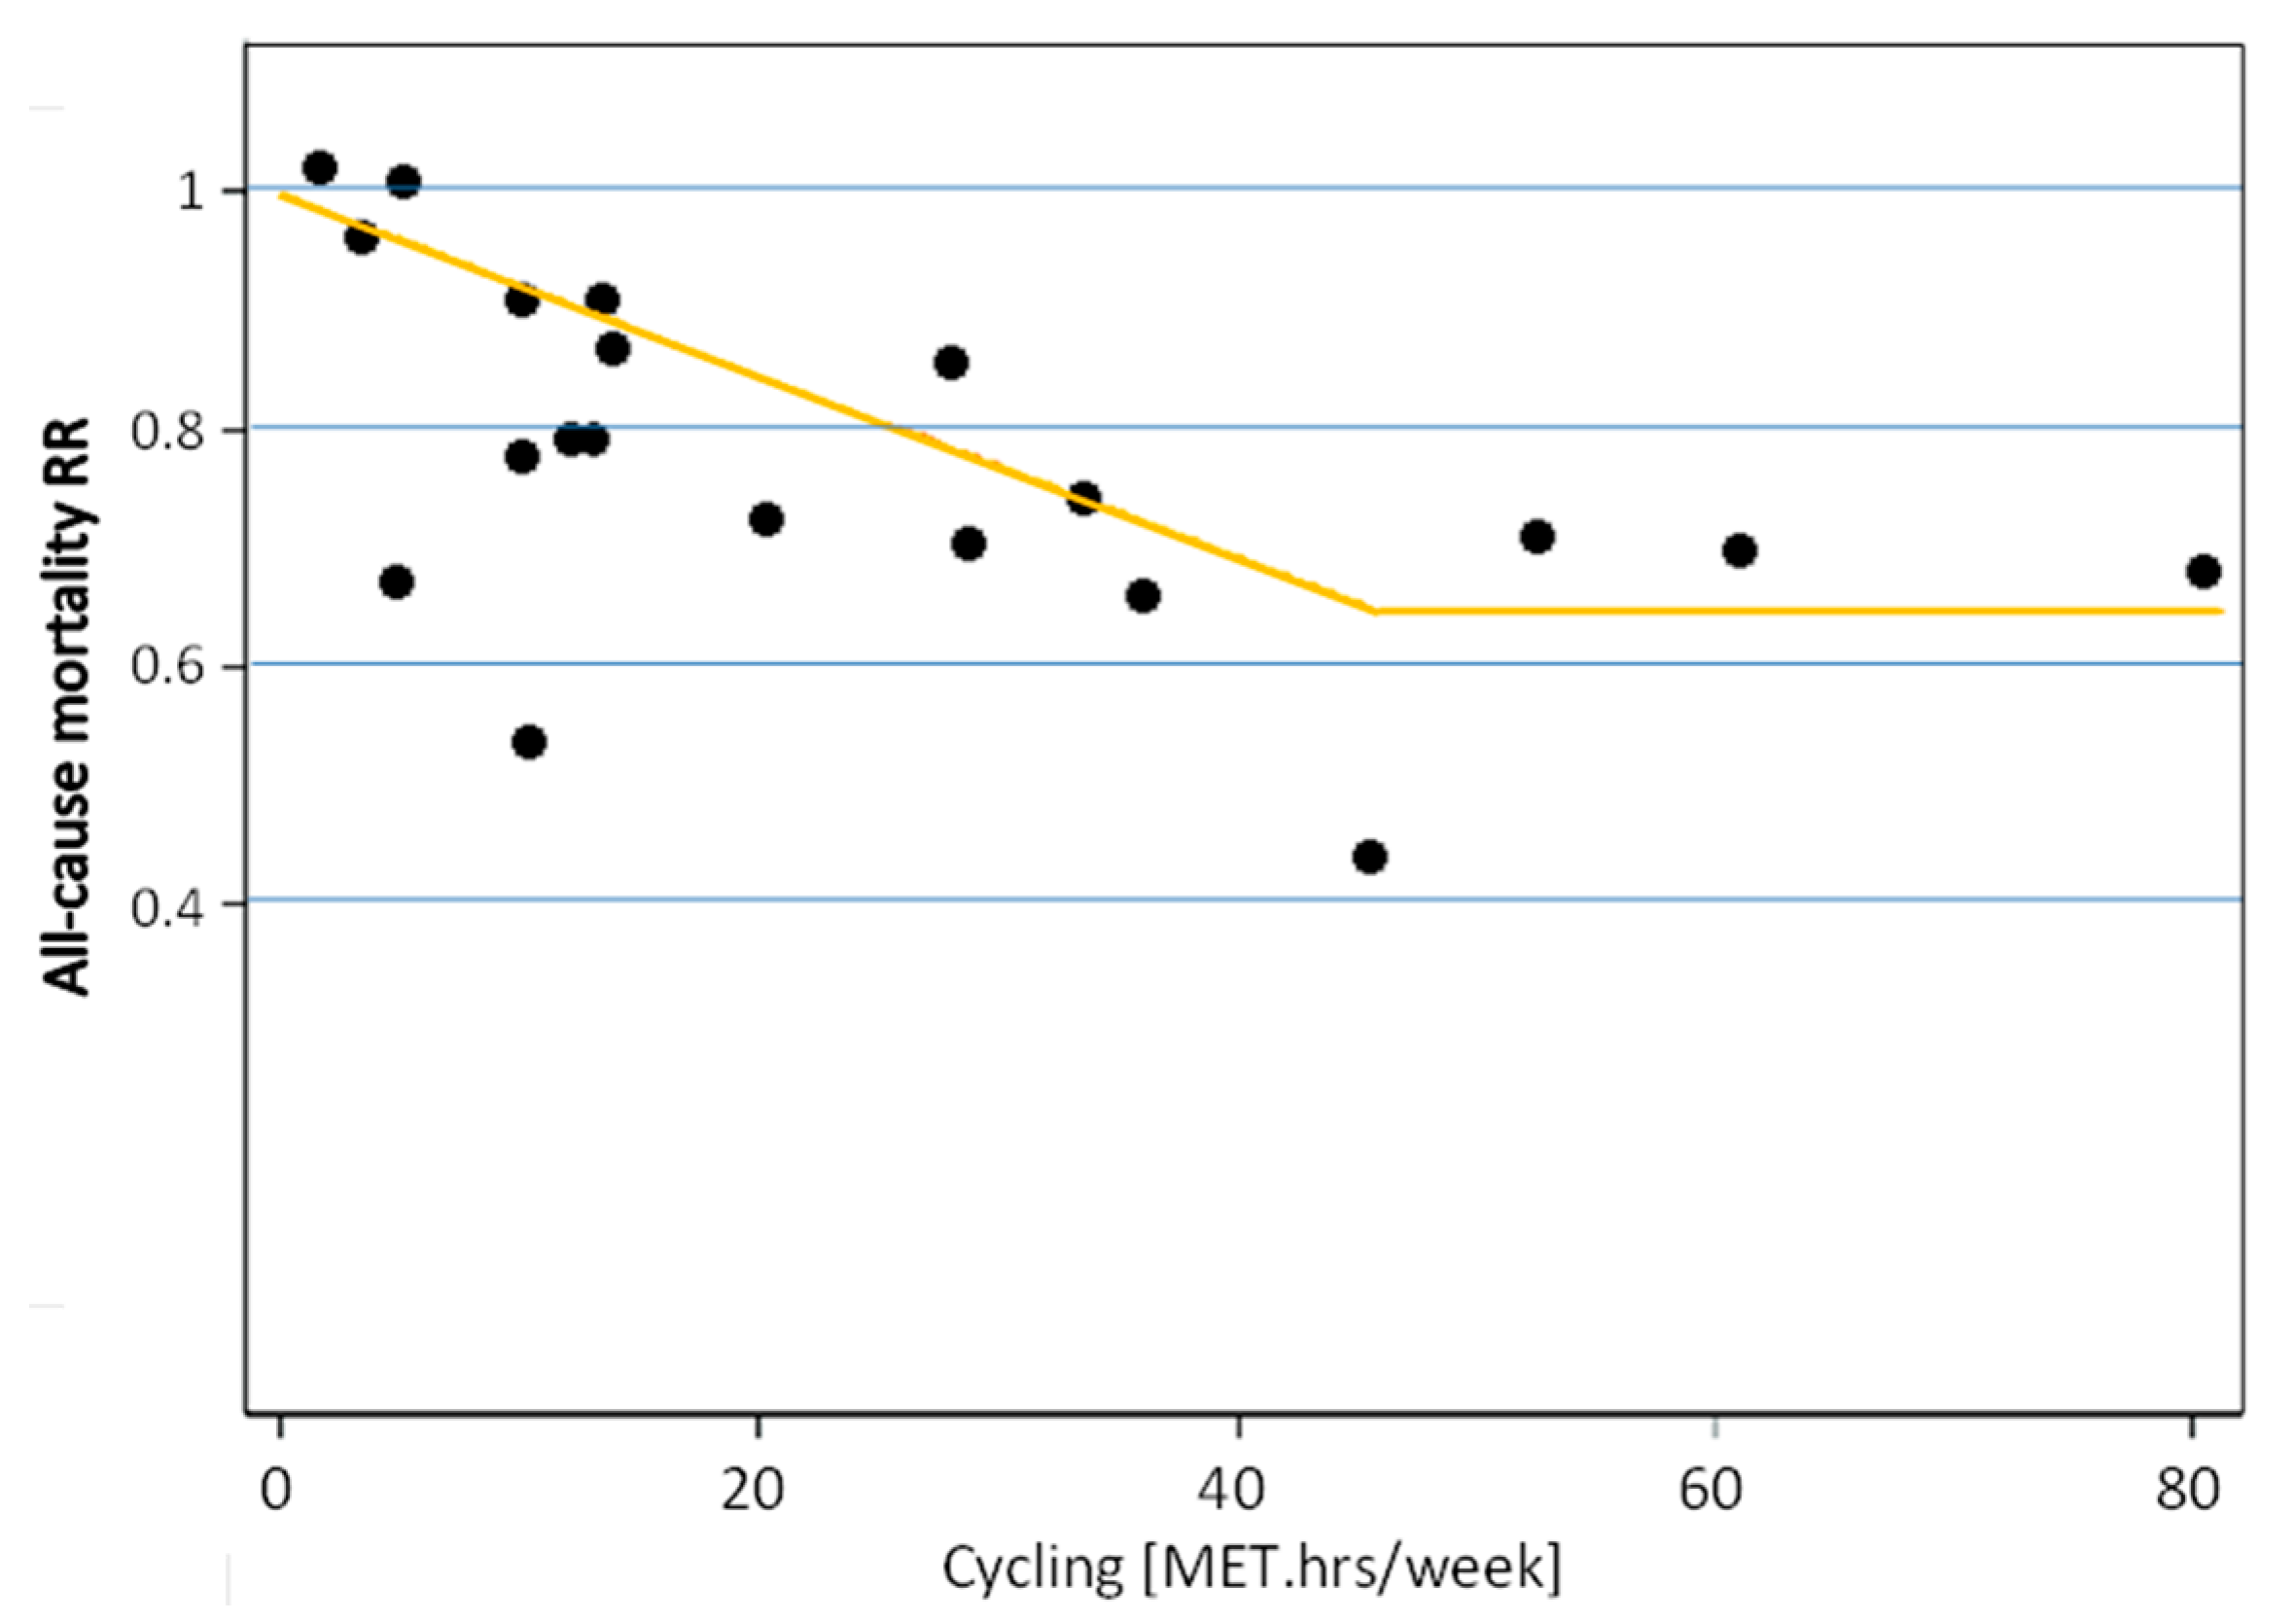
  • The risk reduction in mortality;
  • The reduction in mortality levels within the sample population;
  • The maximum and mean annual benefits and their current values; and
  • The total benefit accumulated over 10 years and its current value.
The reduced mortality risk rate (R%) is computed with the equation:
R ( % ) = ( 1 R R ) ( V o l u m e   o f   c y c l i n g R e f e r e n c e   v o l u m e   o f   c y c l i n g )
where RR represents the reduction coefficient (relative risk) of mortality, V o l u m e   o f   c y c l i n g measures the time (minutes per week) spent by bike by each cyclist of the sample, while R e f e r e n c e   v o l u m e   o f   c y c l i n g stands for the amount of minutes per week per person taken as reference and is equal to 100 min/week per 52 weeks per year.
The model assumes a linear response function (i.e., RR does not depend on the amount of activity) with a relative risk equal to 0.90 (CI 0.87–0.94) for regular physical activity performed for 11.25 metabolic equivalent of task (MET)-hours per week, that is for 100 min per week for 52 weeks of the year using 6.8 MET as an average intensity for cycling. MET is a measure expressing the energy cost of physical activities normalised to a resting metabolic rate set equal to 3.5 mL O2 kg−1 min−1: a MET in the range of 1.5–3 identifies a light intensity physical activity, a MET in the range of 3–6 a moderate intensity exercise, and an MET greater than 6 a high intensity physical activity [37].
This assumption of linearity derives from a number of studies (see Figure 3), but is obviously meaningful only in a range not too far from the reference volume. Indeed, to avoid inflated values at the upper end of the range, the risk reduction estimated by HEAT for cycling is capped: after 45% risk reduction, no significant further decrease is calculated (see the yellow line in Figure 3). Furthermore, the studies used for model calibration are mostly relative to the middle-size cities of industrialized countries (which means a certain type of population). Its application to completely different contexts would require an extensive new calibration.
The reduction in mortality level R, namely the decrease in the number of annual deaths, is evaluated by the product between the reduction in mortality risk and the mortality value (M) expected if the sample would have not been active (Equation (2)). M in turn depends on the number of cyclists (n) and on the non-active population’s mortality rate (m).
R = R ( % ) M
M =   m   n 100 , 000
The standard value of statistical life is used to convert such an estimate into the economic benefits of cycling.
The maximum annual benefit is estimated as the product between the reduction in mortality level and VSL, while the mean annual benefit averages the maximum benefit taking into account the time periods selected for the uptake of cycling (1 year), the build-up of health benefits (5 years), and the time period over which the economic effects are calculated.
The total benefits over 10 years, as well as the mean and maximum annual benefits, are weighted by the discount rate to calculate the current monetary value.
The benefits of biking for non-transport activities are not considered in the model [34].

2.2. Cycling Costs Model

To evaluate the negative effects caused by the inhalation of particulate matter, we implemented a model developed by Rojas-Rueda et al. [39].
As with HEAT for cycling, this model (R-R model, in the following) does not consider the consequences of air pollution on morbidity, but assesses the increase in mortality levels resulting from the inhaled dose of PM10. Also, in this case, only long-term effects are considered, which means a systematic exposure to certain concentrations of PM10. This makes the model compatible with the assumptions in HEAT.
The approach needs again to define a reference scenario (rest condition) representing the basic exposure to the air pollutants of the sample.
The input data required are:
  • The mean annual concentration of PM10 in the area of interest;
  • The average trip duration in minutes or distance travelled in kilometres;
  • The current mortality rate;
  • The number of people exposed to air pollution, that, in our case, is the number of cyclists;
  • The relative risk ( R R 10 ) , estimating the number of cases of death attributable to an increase of 10 μg/m3 in PM10 concentration; and
  • The ventilation rate, which assumes higher values for activity characterised by higher energy expenditure, such as cycling.
The model computes the increase in mortality level and the economic evaluation of damages caused by an increased inhalation of polluted air through the standard value of statistical life.
The inhaled dose of polluted air is calculated as the product of ventilation rate, trip duration (T), and PM10 concentration (C).
I n h a l e d   d o s e   ( μ g day ) = V e n t i l a t i o n   r a t e   ( m 3 h ) T ( h/day ) C ( μ g / m 3 ) .
In this model, as well as in HEAT, the dose–response function, which estimates the number of deaths caused by the inhaled dose of pollutant, is implemented through the relative risk (RR), computed as:
R R = exp ( ln ( R R 10 ) ( E q u i v a l e n t   c h a n g e 10 ) ) .
It thus depends on the change in long-term PM10 exposure that would result from a modal shift compared to the reference scenario (Equivalent change). This is calculated as:
E q u i v a l e n t   c h a n g e   ( μ g / m 3 ) = ( ( T o t a l   i n h a l e d   d o s e R e f e r e n c e   i n h a l e d   d o s e ) 1 ) C ( μ g / m 3 )
where Total inhaled dose is the sum of the inhaled doses in the reference scenario and during an activity, for example cycling, and C is the mean annual concentration of particulate matter.
The increase in mortality risk caused by exposure to polluted air is estimated using Equation (7).
A ( % ) = R R 1 R R .
By multiplying A (%) by M, we can assess the number of deaths caused each year by the physical activity in an environment with the given PM10 concentration [35].
In the following case study, we assume that a bicycle is used as the alternative to a car, so the model must be run twice, considering firstly cycling, and secondly driving, as activities different from the reference rest scenario. In order to evaluate the impact of cycling, the number of deaths resulting from car exposure is then subtracted from the number of deaths related to cycling exposure.

2.3. Analysis of Diffferent Scenarios

We have examined four different scenarios, which have a number of assumptions and parameters in common. They are listed in Table 1 and explained below.

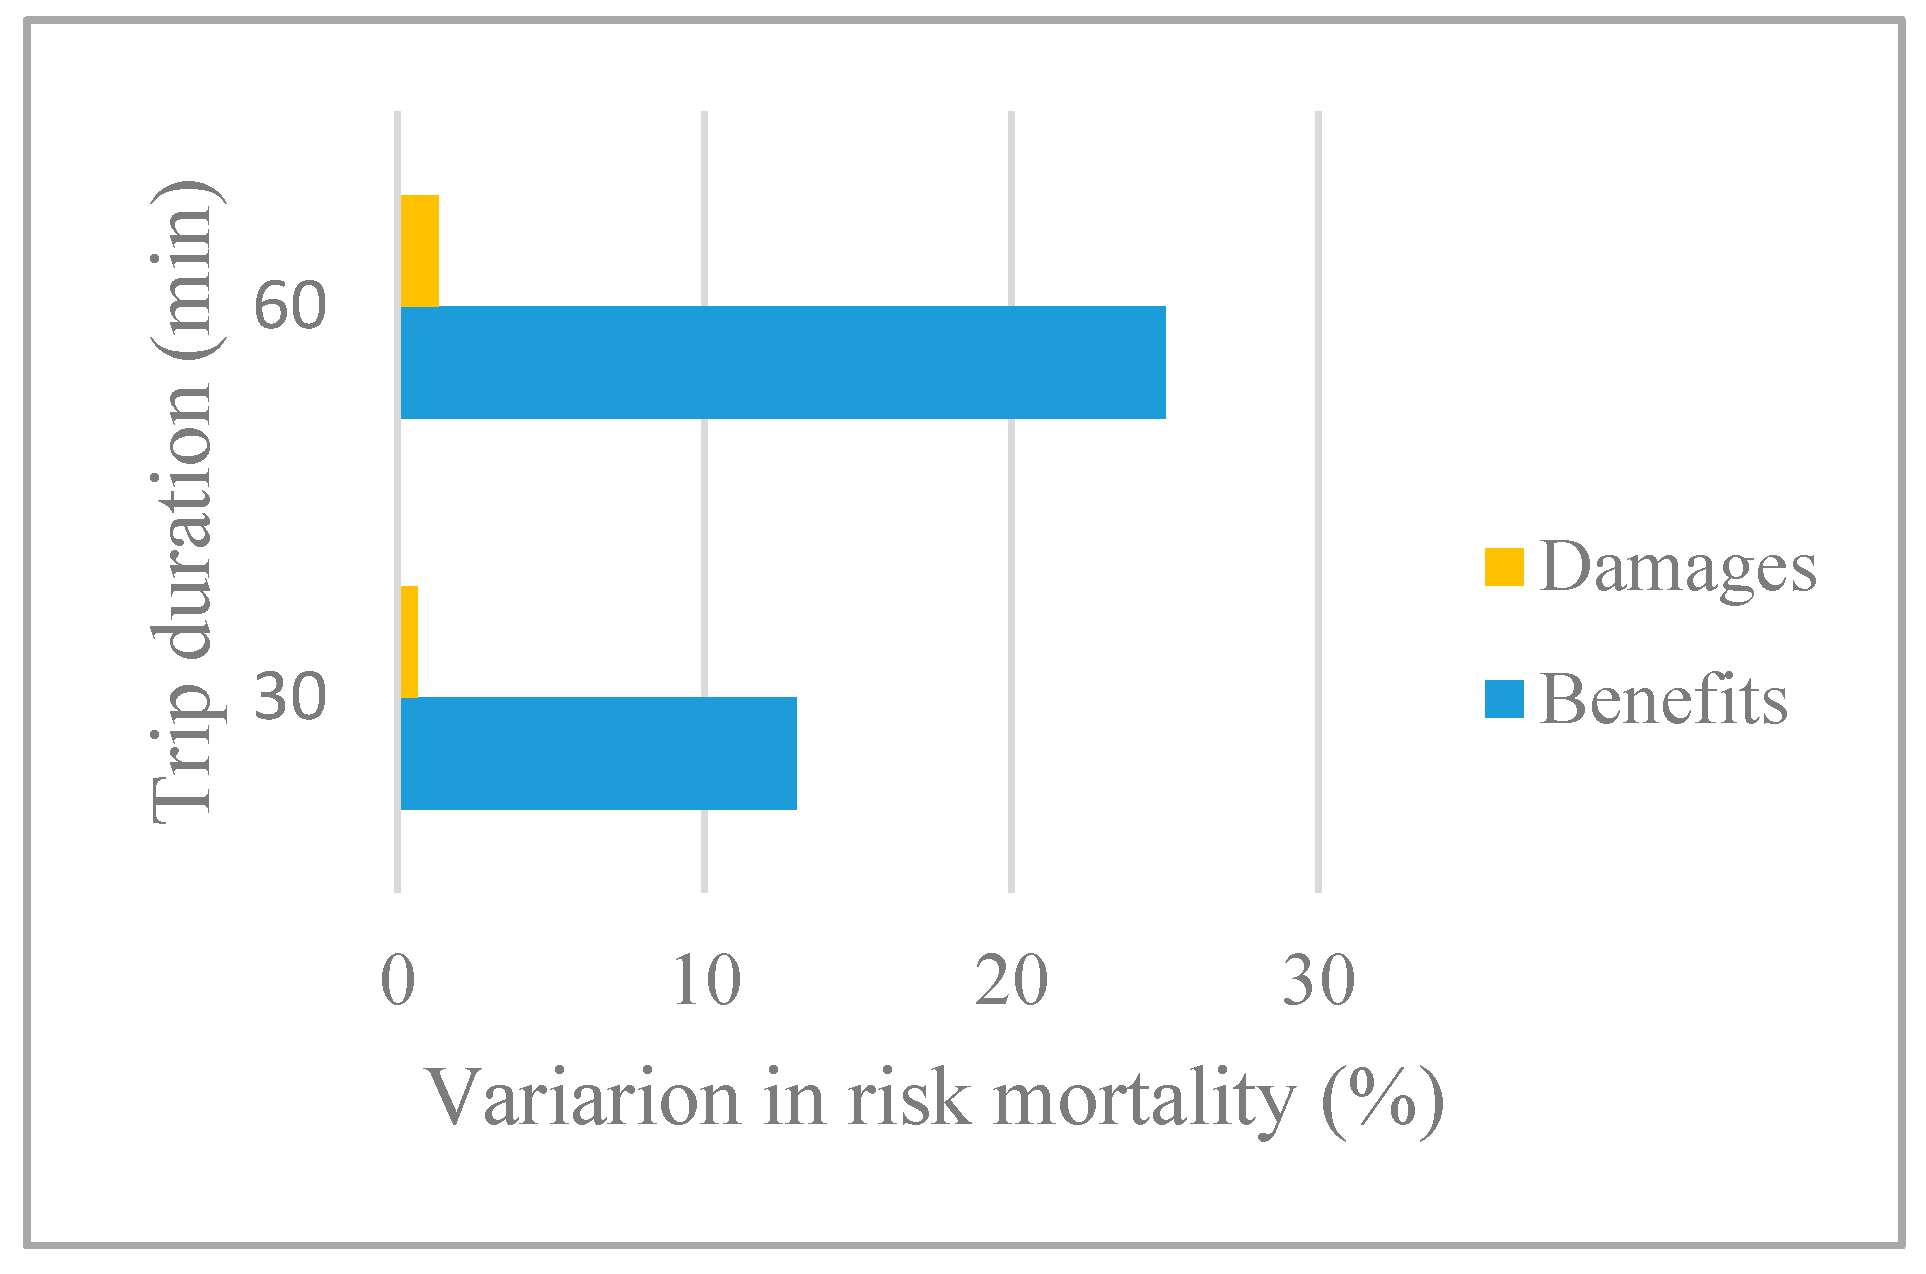
2.3.1. Trip Duration

The average distance taken as reference is set equal to 7 km, which stands for a trip duration of 30 min by bike, if the default speed value implemented in HEAT for cycling is considered. This duration corresponds to the level of cycling defining a physically active person [40].
We tested also the possibility of doubling such an amount in order to evaluate the output sensitivity to trip duration.
To define a term of comparison, we also need the trip duration by car, as well as by bike. In Milan, the average hourly car speed ranges from a minimum value of 14.8 km/h to a maximum value of 17.5 km/h [29] at different times; we thus adopted an average car speed of 16.15 km/h. Since a car’s speed is slightly higher than a bike’s speed, a car’s trips are a bit faster, and rest periods that are complementary to trip duration, are different for the two means of transport.
The assumption that the distance covered by car and by bike is the same may be considered rather conservative for bikes, since they can normally run on different (normally shorter) routes within the city and do not have to follow the same lanes as cars. Additionally, as already pointed out, car trips may be 25% longer due to the time spent looking for a free parking stall. These unfavourable hypotheses are partly compensated for by the assumption of a biking speed of 14 km/h, as assumed by HEAT, which represents a situation of reserved and connected bike paths, which is definitely not true for the case at hand.

2.3.2. Day per Year

We assumed the number of working days of 2015, because systematic cycling represents only daily trips to a work or study place. The National Statistical Institute (ISTAT) counted an average of 1704 effective working hours. This results in 213 day/years by working 8 h per day or in 227 days by working 7.5 h; therefore, we fixed 220 days as the input given to the HEAT and R-R models.

2.3.3. Mortality Rate

The assumed mortality rate was derived from that reported for the city of Milan in 2015 in the age group between 20 and 64 years. We refer to this target because people in this group are more likely to move every day in the city to reach their work or study place and because this is coherent with the target population of HEAT for cycling [34].
The input to the models has been calculated modifying the ratio between deaths and inhabitants actually measured in the city. This was necessary, since a small portion of the inhabitants systematically uses bicycles for daily urban trips, and thus enjoys the consequent positive effects. The mortality of the non-active population used for the HEAT and R-R models is thus higher than that officially reported.

2.3.4. Standard Value of Statistical Life

Even if HEAT for cycling provides a standard value of statistical life for Italy, we implemented a value related to the Lombardy region (to which Milan belongs), because the VSL depends on variables, such as GDP per capita, income level, income growth, and inflation [35], that vary strongly across Italy.
We obtain the VSL for Lombardy weighing that for Italy in proportion to GDP ratio:
V S L L o m b a r d y = V S L I t a l y G D P L o m b a r d y G D P I t a l y
where GDPLombardy is equal to 34,900 €, greater than that of GDPItaly, which is equal to 26,500 € [41].

2.3.5. RR10

The value of relative risk estimating the number cases of death for an increase of 10 μg/m3 in PM10 concentration, reported by Künzli et al. [26], has been used.

2.3.6. Ventilation Rate

Ventilation rate depends on energy expenditure, and assumes different values for different activities. Therefore, in this study, we have to define three values: for rest conditions, for bicycle, and for car.
We assumed the values of ventilation rates recommended by Vlachokostas et al. [7] for rest situation and car, while the ventilation rate corresponding to a bicycle speed of 14 km/h has been obtained from a linear regression depending on ventilation rate values reported by the same study and related to a bicycle speed of 8 km/h and 19.3 km/h (Table 2).
The data input varying across scenarios are the number of cyclists (or people exposed to air pollution) and PM10 concentration.
As for the number of people currently using a bicycle to move inside Milan, we estimated it from the already mentioned modal split, by assuming that all bike journeys are made by people in the age range 20–64 years, because this group is more likely to move regularly every day.
For particulate matter, we took into account the annual average concentration only of weekdays, when trips to reach work or study places take place. Moreover, we assume that cyclists and car drivers are exposed to the same PM10 concentration, because the travel itineraries of cyclists and drivers are unknown, so we cannot define specific microenvironments, and the studies reported in the literature lead to conflicting results [37,42].
The specific setting of each scenario is described below.

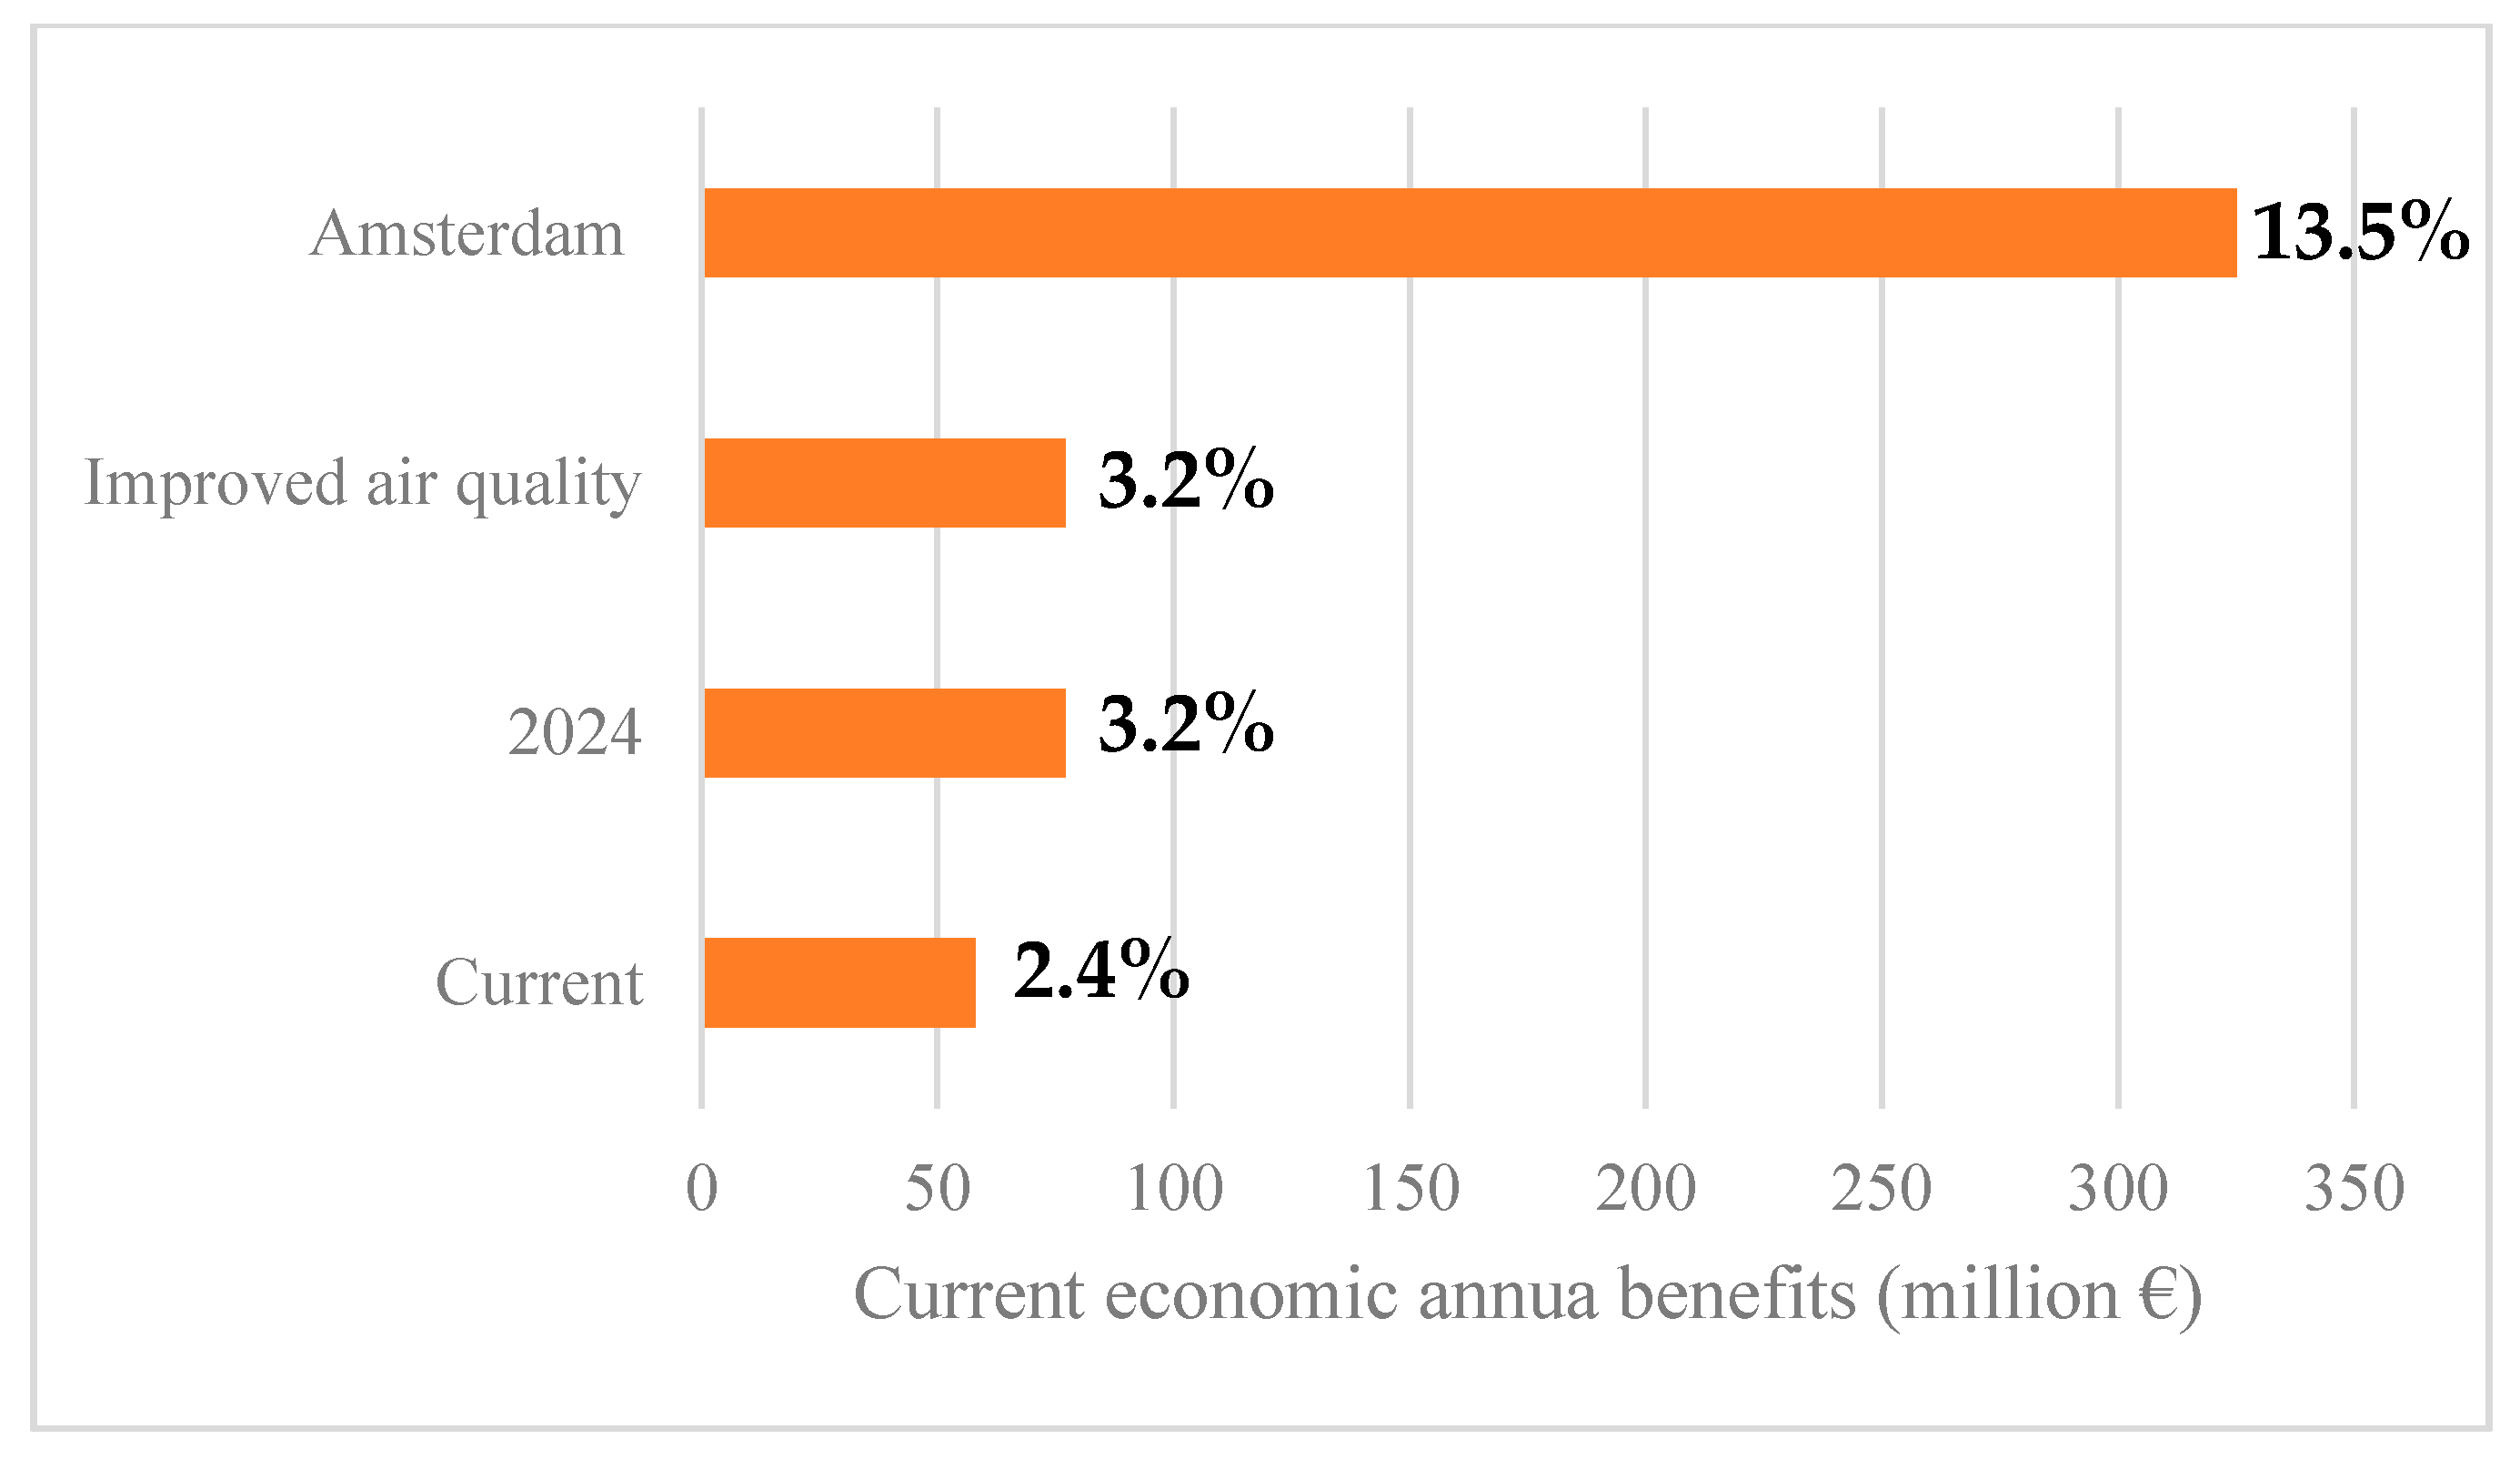
2.3.7. Current Scenario

The first scenario analyses the current situation in Milan.
The level of cycling is based on 2013 data from the municipality [29], when the total number of daily trips was about 3 million, 5.7% of which, namely about 170,000, were by bike. We assume that each person of the sample completes two bike trips each day (to reach a work place and to go back home), so the number of cyclists results in about 85,000.
A mean annual value of PM10 concentration of 42 μg/m3, as estimated from 2015 monitoring data, was assumed.

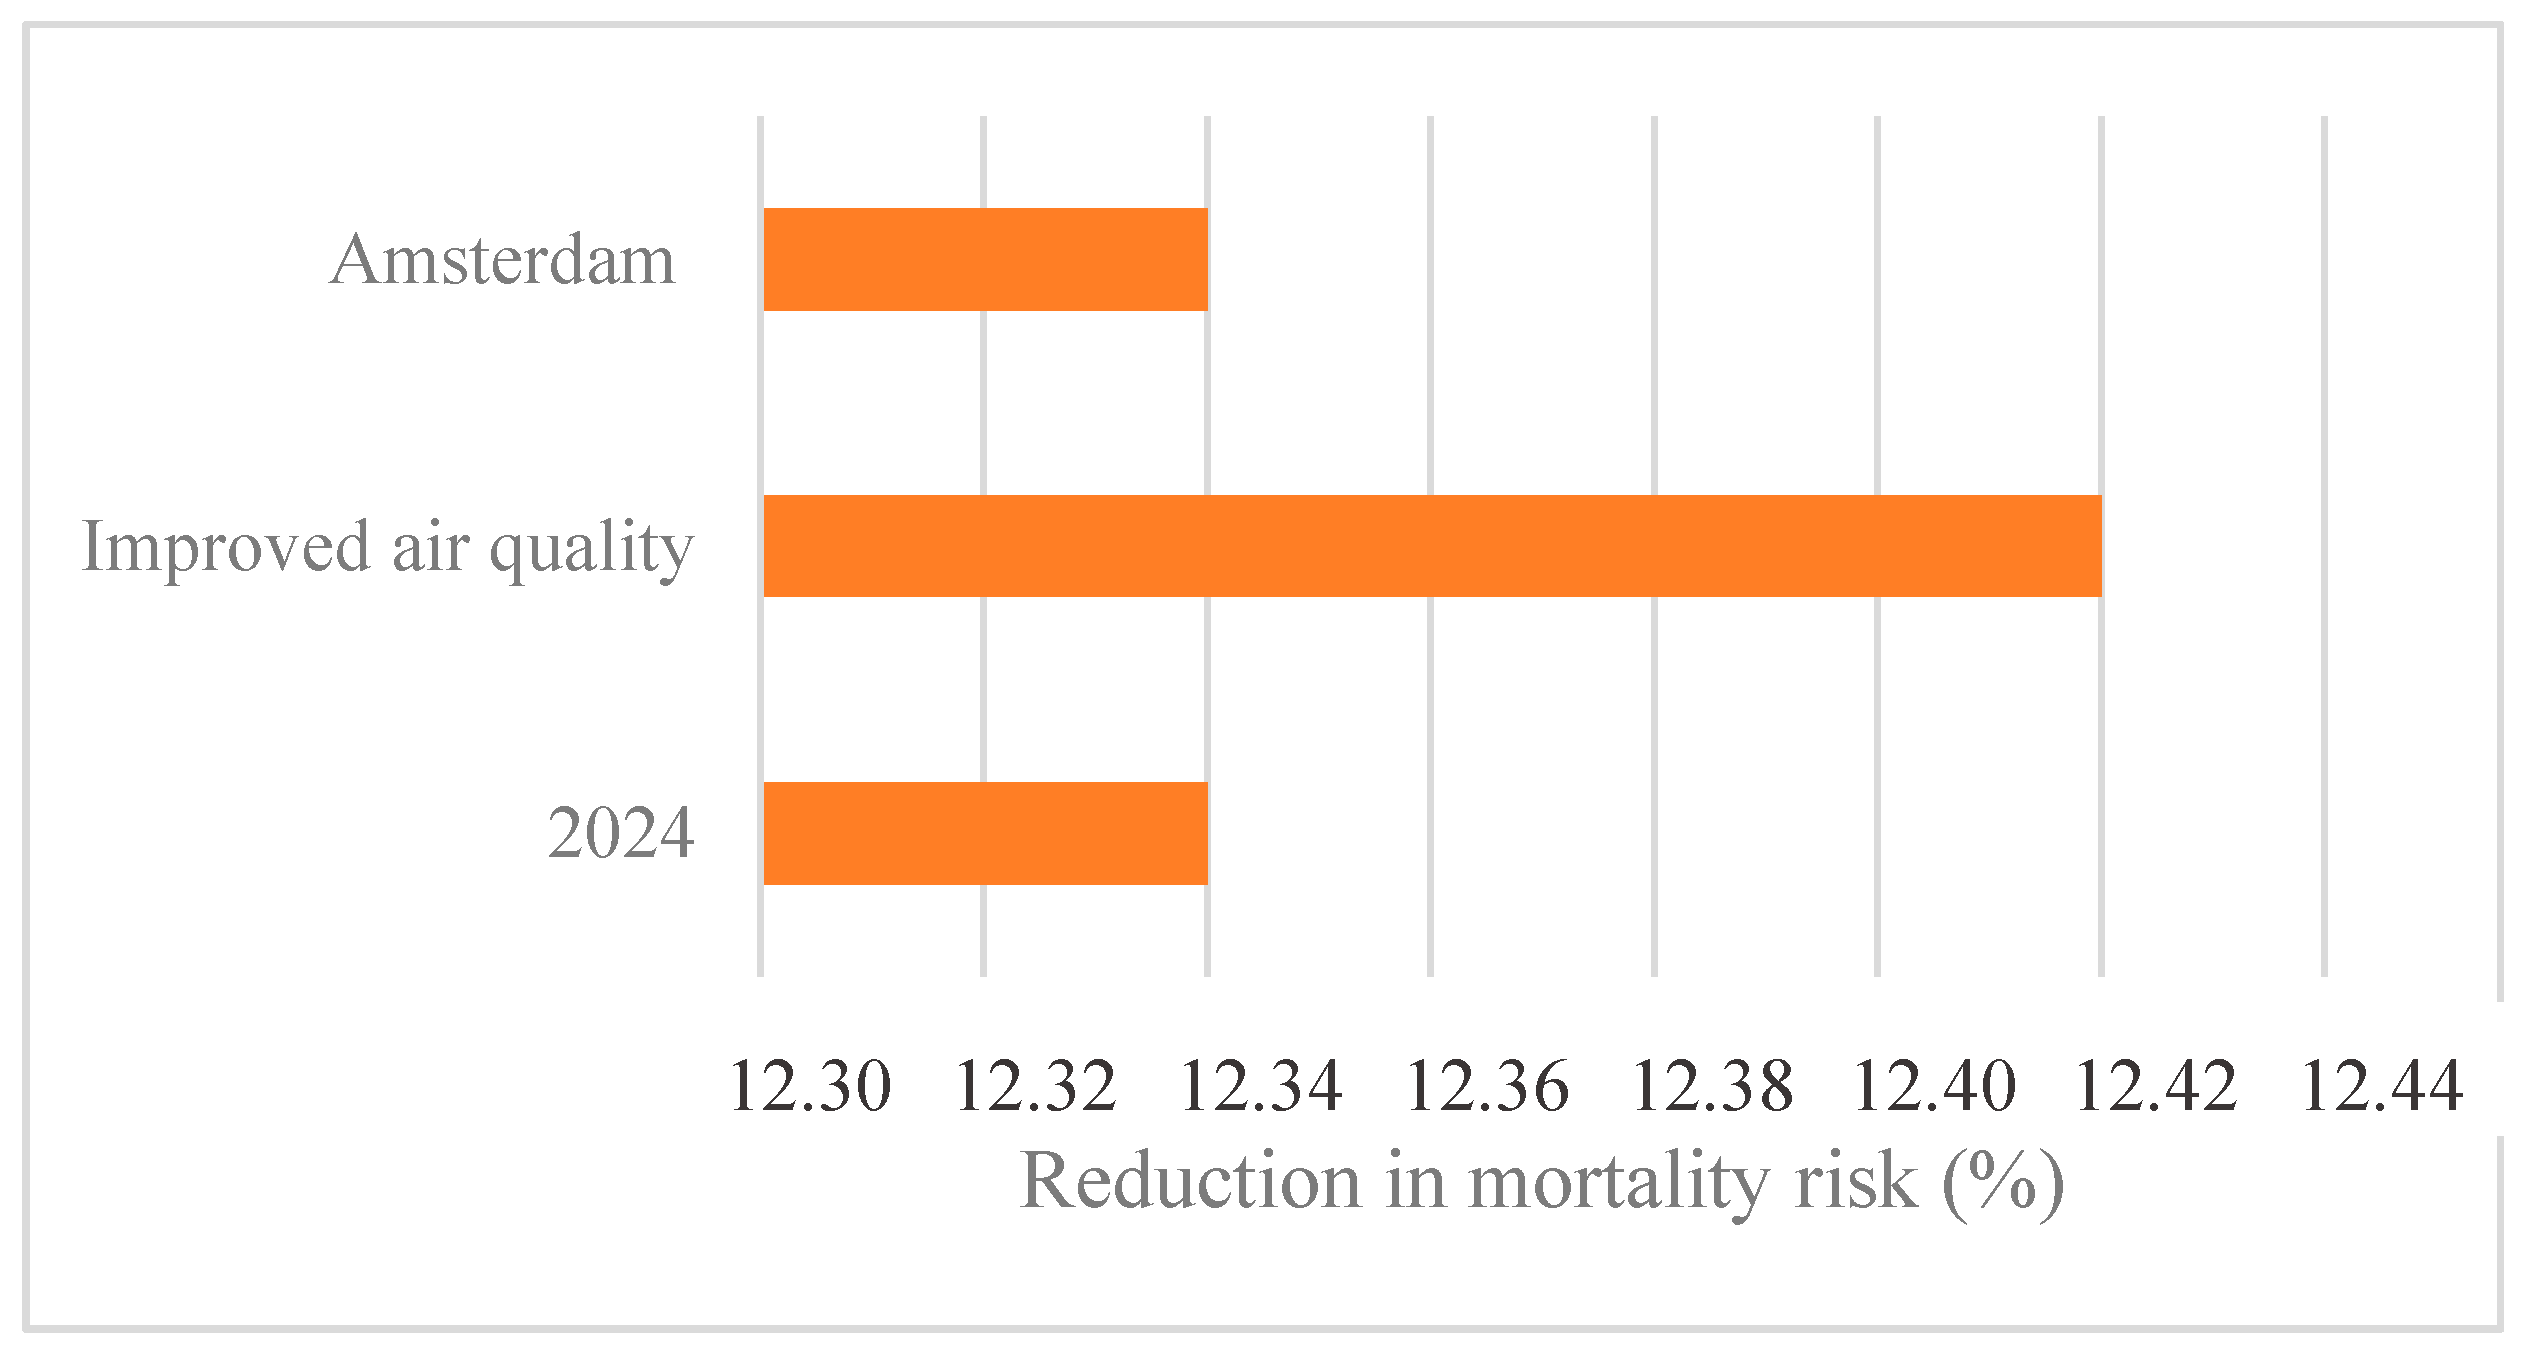
2.3.8. 2024 Scenario

The “2024” scenario simulates a future situation in which we assume a greater number of cyclists, based on modal split estimated for 2024 by the Plan of Urban Sustainable Mobility [29].
Daily movements should increase to 3,176,000, with 7.1%, namely about 225,000, by bike, corresponding to 113,000 cyclists. The assumed PM10 concentration remains equal to the current scenario.

2.3.9. Improved Air Quality Scenario

This scenario describes a future situation different from scenario 2024 only for pollutant concentration, as we suppose a decrease in PM10 level of 5 μg/m3. This reduction is consistent with the slightly decreasing trend of PM10 observed in Milan in the last fifteen years (Figure 4). The transport modes are the same as in the previous scenario.

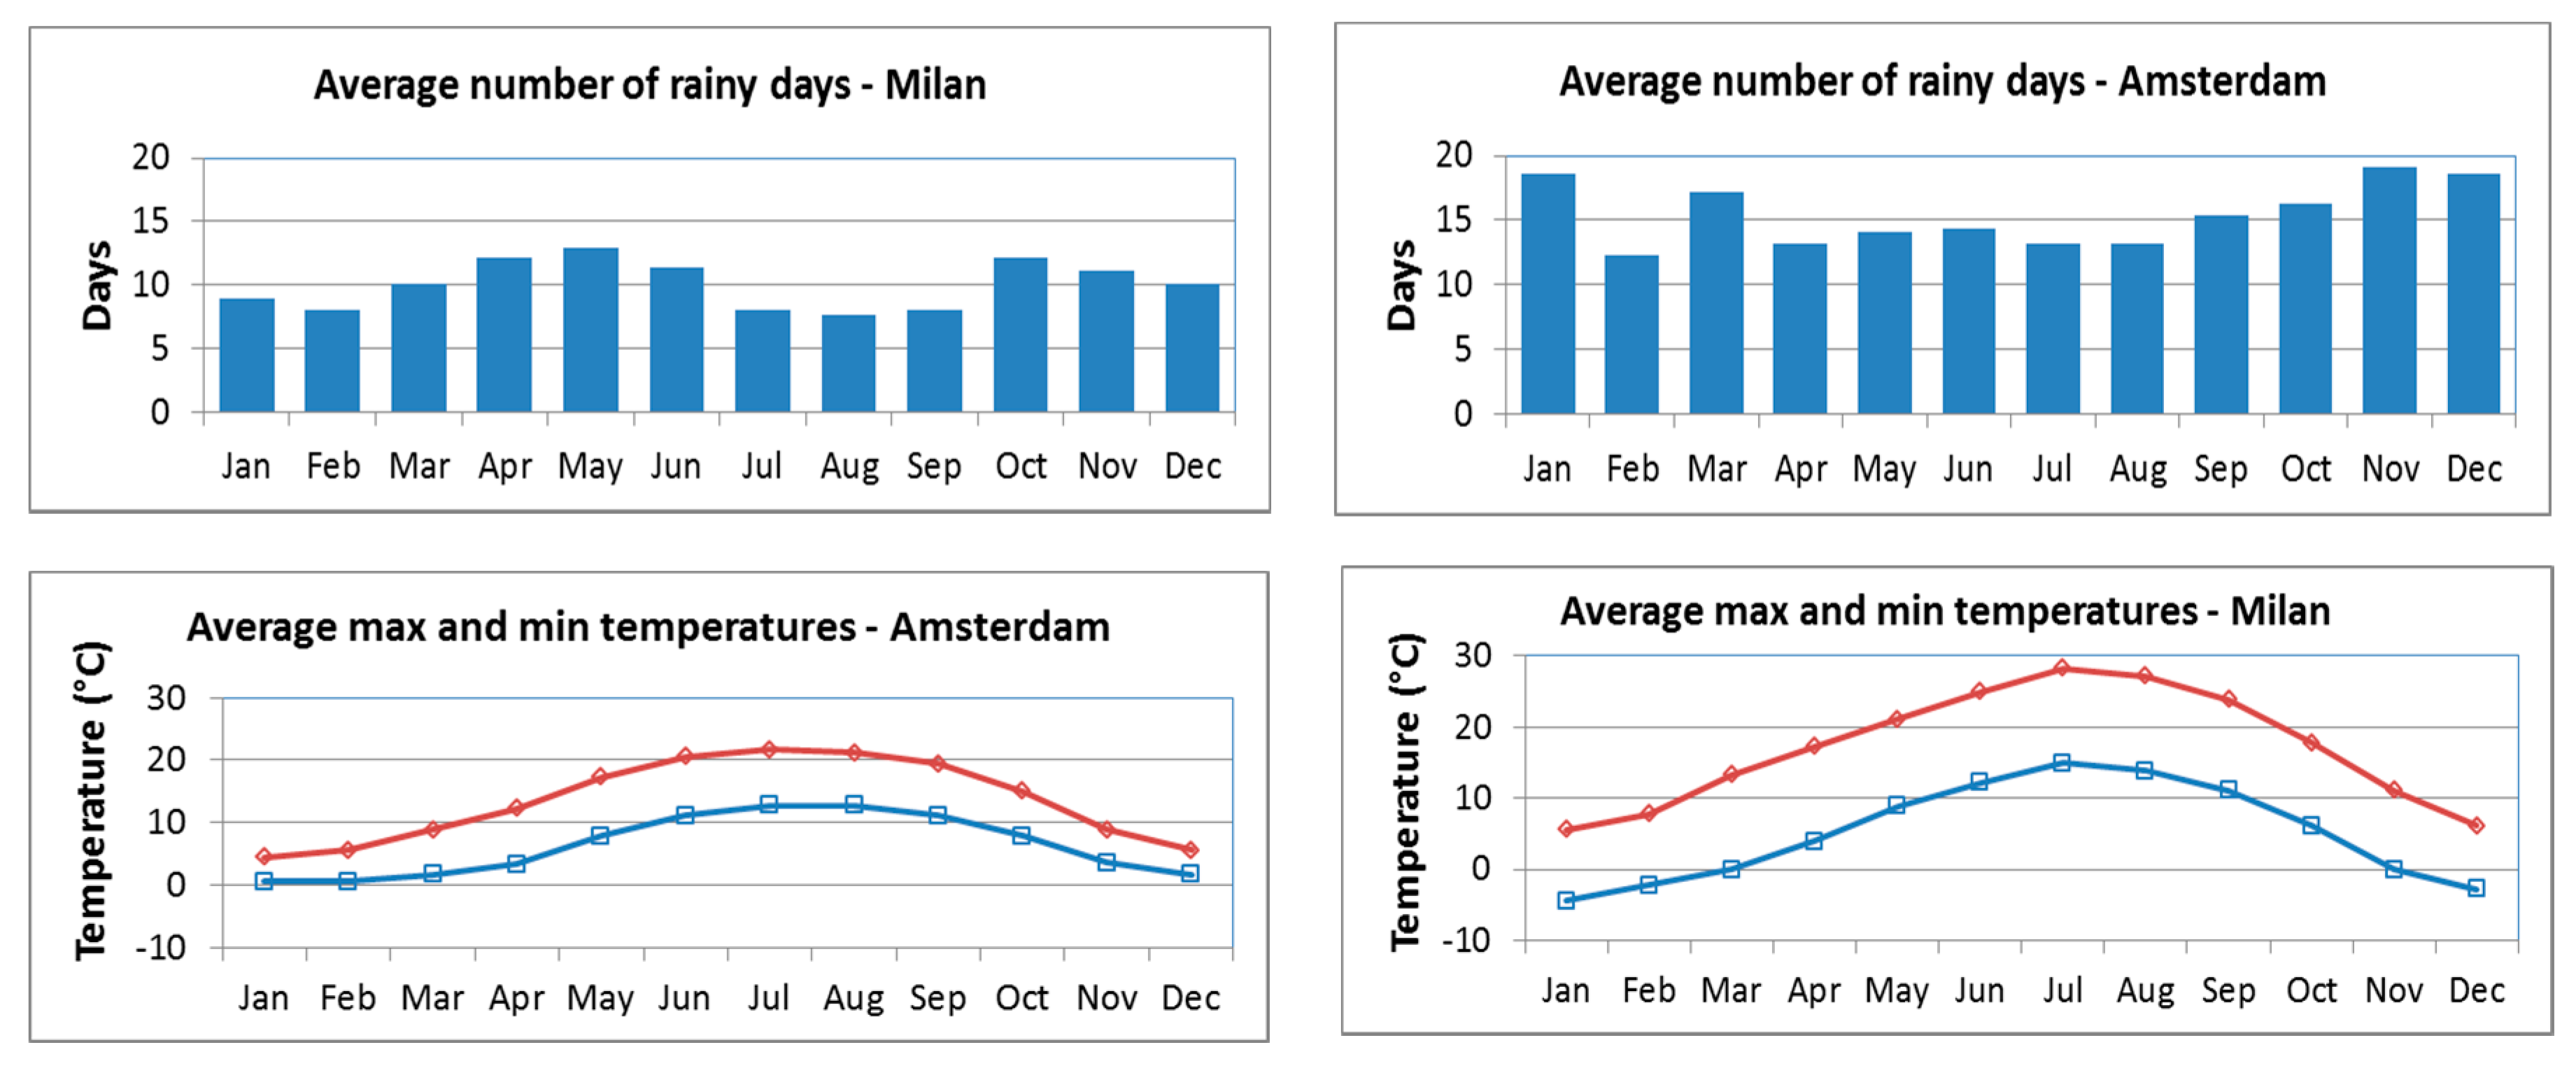
2.3.10. Amsterdam Scenario

The Amsterdam scenario assumes that Milan can reach Amsterdam’s cycling situation.
We apply the percentage of bicycle journeys typical of Amsterdam (32%) to the number of daily trips registered in Milan in 2013 (2,978,000), and, as in previous scenarios, we assume two trips per person each day. This results in an amount of cyclists that is slightly below half a million.
The PM10 concentration is set to be equal to 42 μg/m3, as in the current scenario.

3. Results

3.1. Cost–Benefit Anaysis

By analysing and comparing the outputs of the HEAT for cycling model and of the model used to evaluate the effect of PM10 inhalation (R-R model), it turns out that the benefits are far greater than the damages in all of the scenarios considered. In particular, the benefits to damages ratio ranges from 19 to 22, and it remains remarkably stable under different scenarios, thus confirming the robustness of the evaluation. Table 3 shows all of the results in detail in terms of changes with respect to a completely inactive population. Part of the benefits listed have already been acquired, since a portion of daily trips is already by bike.
The highest benefits–damages ratio corresponds to the “Improved air quality scenario” thanks to the reduction in PM10 concentration that leads to fewer adverse effects.
Therefore, in Milan, despite the high level of particulate matter inhaled during cycling, the positive consequences resulting from physical activity are far greater than the disadvantages, and cycling can be thus considered a highly beneficial mobility mode.
The negative effects, reported in Table 3, are obtained by subtracting the negative consequences experienced when car is used to effects related to cycling in order to comply with the assumption that a bicycle is used as the alternative to a car. If we consider, for example, the 2024 scenario, the mortality risk when people choose bicycles and cars for 30 min/day increases by about 1.56 and 0.39, respectively, under the same PM10 exposure and by assuming that cyclists and car drivers travel on the same path. This difference is due to the lower ventilation rate characterising car drivers with respect to cyclists.
If we analyse the relationship between the outputs of the models and trip duration, it results that both advantages and disadvantages raise linearly with the increment in time. For example, we can observe (Figure 5) that, in the 2024 scenario, if we increase the trip duration from 30 min/day to 60 min/day, the reduction in risk mortality estimated by HEAT goes from 13% to 25%, while the increase in mortality risk due to the inhalation of polluted air increases from 0.66% to 1.33%.
This linear pattern can obviously be observed for all of the scenarios and for all of the outputs provided by the models.
Since the positive effects are far greater than the negative ones for all scenarios analysed, we focus the attention on net benefits.
The impacts of cycling in terms of mortality risk in different scenarios are summarised in Figure 6. Mortality risk depends on travel time and on PM10 concentration; therefore, it is unchanged (equal to 12.34%) in the 2024 and Amsterdam scenarios, while it increases in the improved air quality scenario because of the lower PM10 levels assumed. Nevertheless, a reduction of 12% in particulate matter concentration (from 42 μg/m3 to 37 μg/m3) corresponds to an output variation of less than 1% (from 12.34% to 12.42%), so the net benefits are robust to change in pollutant level. Again, this is due to the fact that the advantages are far more consistent than the adverse effects.
The output describing change in mortality level, namely in number of deaths per year, is illustrated in Figure 7.
Unlike mortality risk, the results on mortality level change for different scenarios because they depend on the number of people in the sample. Death reduction is expressed as the percentage of the number of deaths in the age range 20–64 years, in the city, with reference to 2015.
In the current situation, the level of cycling and the amount of inhaled PM10 are already responsible for a death reduction of 1.3% with respect to a non-active population, while in both future scenarios (2024 and improved air quality) the benefit increases to 1.6%, since they do not obviously depend on the pollutant concentration. Variation in mortality level is, on the contrary, sensible to the number of cyclists: in the Amsterdam scenario, where there is an increase in the dimension of the sample, the mortality reduction is approximately 7%, much higher than the results found in the other scenarios.
When the benefits of cycling mobility on mortality are translated into monetary terms (Figure 8), the current situation already provides a reduction of 58 million €/year (the activity has already been going on for years), with respect to a completely inactive population. This represents 2.4% of the health cost paid each year by the city of Milan. Such a value has been estimated by weighing the value available for the Lombardy region for 2010, 18 billion € [41], with a factor given by the ratio of Milan and Lombardy inhabitants, and it turns out to be around 2.4 billion €/year.
In the 2024 and improved air quality scenarios, the economic advantages increase up to approximately 77 million €/year, i.e., 3.2% of the health expenditure, while the greatest positive effects, 325 million €/year, equal to 13.5% of the health cost, are achieved in the Amsterdam scenario.

3.2. Effects on CO2 and PM10 Emissions

We quantified the possible reduction of CO2 and PM10 emissions in the atmosphere, compared to the current situation, if the number of cyclists assumed by the 2024 and Amsterdam scenarios will use a bicycle in alternative to the car.
This estimation makes use of CO2 and PM10 emission factors, which are different for petrol and diesel cars and for European classes. For each pollutant, we estimate two average emission factors, one for petrol cars and one for diesel cars, as a weighted average of the emission factor of a Euro class (provided by INEMAR, Lombardy Region Air Emission Inventory [44]) and the number of vehicles belonging to that category (Table 4).
The second value needed is the number of petrol and diesel cars replaced by bicycles: it is obtained by applying the percentage of petrol and diesel vehicles to the number of cyclists assumed in the scenarios; therefore, the number of vehicles replaced by bike is different for the 2024 and Amsterdam scenarios (Table 5).
Finally, the reduction of CO2 and PM10 emissions is calculated as the product of the reduced number of cars, the related emission factor, and the average distance covered in each trip (set equal to 7 km).
If the 2024 scenario is implemented, the reduction of CO2 and PM10 emissions would be approximately 7600 t and 2 t, respectively, per year, while in the Amsterdam scenario the reduction can be on the order of 100,000 t of CO2 and 28 t of PM10 (Table 6).
Such reductions represent only a small portion of the total annual emissions of these substances in Milan due to urban traffic: the decrease in emission is around 0.6% of traffic emission for the 2024 scenario and 8% for the Amsterdam scenario. Traffic, in turn, constitutes about 44% of the overall PM10 emissions and 30% of GHG emissions of the city. Additionally, it must be noted that, in the present case, PM10 emissions are only a component of particulate matter concentration, since this is (for about half) of secondary origin, and thus is determined by the atmospheric chemistry of other precursors, like NOx and volatile organic compounds. Given the complexity of the emission and meteorological situation, these reductions will thus determine only a very small, though positive, impact on the overall air quality of the city [45].

4. Discussion and Conclusions

As damages are negligible compared to benefits, the model outputs are robust to variation in PM10 concertation: a decrease of 12% in the level of particulate matter results in a variation of less than 1% in mortality risk reduction.
The model outputs are on the contrary sensible to the number of cyclists, the key variable on which local authorities must act: the economic benefits can increase from the current value on the order of tens of millions of euros per year up to a few hundreds of millions if the number of people systematically using bicycles grows up to the percentage of Amsterdam.
Besides the particulate matter concentration and the number of cyclists, the outputs depend on trip duration too: in particular, there is a linear relationship between health/economic benefits and time spent travelling by bike.
These results are obtained by assuming that the PM10 mean annual concentration is the same in the entire city of Milan and that cyclists and car drivers are exposed to the same concentration of pollutants. This may not be the case if they travel through different microenvironments or if cars are equipped with sophisticated filters for cleaning interior air. In this study, we estimated only the effects of cycling on human health and air quality, but other impacts should be taken into account when performing a comprehensive analysis of bicycle sustainability.
Other advantages indeed result in a more liveable urban environment. When bicycles replace cars in urban trips, less road infrastructure is necessary. A parked bicycle occupies less than 8% of the area used by a car and a 2 m large cycle path has a capacity of 2000 cyclists per hour, while the same capacity in terms of cars requires a 4 m large road [46]. The freed spaces can be changed into parks and green areas that make the city a better place to live [16].
Other positive consequences are observed from an economic point of view, since the spread of cycling mobility creates new workplaces in, for example, bike production, sale, and service [47]. According to the same study by the World Health Organization, if the city of Rome could reach the level of cycling of Copenhagen, the number of new jobs related to the cycling industry would be equal to 3500.
Also, the reduction in fuel expenditure is a positive effect, but is likely to be only a negligible percentage of the overall transportation budget in the specific case of Milan. Finally, bikes reduce urban traffic noise which cause annoyance, sleep disturbance, and cardio-vascular diseases, such as hypertension [38].
Cycling in an urban environment could potentially lead to some negative effects, the most important of which are traffic accidents involving cyclists. Indeed, the number of deadly accidents per kilometre is higher between cyclists than car drivers: de Hartog et al. [48] estimated that the ratio between the number of deaths of cyclists and car drivers is equal to 5.5.
However, disadvantages due to collisions soften if cycling increases; this phenomenon, known as “safety in numbers” [49], means that the current Italian value of about 10 cyclists every 100 million km losing their lives in traffic accidents may go down to the Netherlands value of about 1, when the average distance increases from 1 to 3 km per person per day.
The evaluation reported in the present study proves the sustainability of using bicycles systematically even in a polluted urban environment. The cost-effectiveness of this means of transport has been shown in different studies from around the world, e.g., in United Kingdom and Finland, Belgium, and New Zealand [16].
Cycling mobility must thus be encouraged. Actions promoting cycling mobility, such as bike sharing and the construction of cycle paths, do not immediately result in an increase in the number of cyclists [50]; therefore, actions discouraging the use of cars, such as the implementation of congestion charges and 30 km/h zones, need to be considered. For example, in Milan, a congestion charging area, AREA C, has been active since 2012 on each weekday in the historic city centre and covers an area of 8.2 km2. AREA C imposes a ban on circulation to most polluting vehicles, allows free access to electric cars, and restricts access to the city centre of all other vehicle categories by applying a daily charge of 5 €. This regulation reduced the traffic by about 30% from January 2012 to June 2014, so it appears to be an efficient intervention to reduce car trips in the centre of the city. Nevertheless, traffic is still consistent in Milan: the INRIX [11] report places Milan at the tenth position in Europe for traffic congestion, at about half of the congestion of London, which has about seven times as many inhabitants. To further reduce the use of cars, congestion charging can be implemented in other parts of the city and the price of a daily ticket can be increased as in other European cities.
The available modelling tools, such as HEAT for cycling and the R-R model, may play a key role in mobility planning. They can be easily implemented for many urban environments and allow to introduce human health considerations in the benefits/cost analyses related to transportation and urban planning, in general.

Acknowledgments

The study was funded by the department own resources.

Author Contributions

Giorgio Guariso conceived and designed the study; Giulia Malvestiti collected the data and implemented the models; Giorgio Guariso and Giulia Malvestiti analyzed the results and wrote the paper.

Conflicts of Interest

The authors declare no conflicts of interest.

References

  1. ECF. EU Cycling Strategy. Recommendations for Delivering Green Growth and Effective Mobility System in 2030. 2017. Available online: https://ecf.com/sites/ecf.com/files/EUCS_full_doc_small_file.pdf (accessed on 5 July 2107).
  2. Tainio, M.; De Nazelle, A.J.; Götschi, T.; Kahlmeier, S.; Rojas-Rueda, D.; Nieuwenhuijsen, M.J.; Hérick De Sá, T.; Kelly, P.; Woodcock, J. Can air pollution negate the health benefits of cycling and walking? Prev. Med. 2016, 87, 233–236. [Google Scholar] [CrossRef] [PubMed]
  3. Woodward, A.; Samet, J. Active transport: Exercise trumps air pollution, almost always. Prev. Med. 2016, 87, 237–238. [Google Scholar] [CrossRef] [PubMed]
  4. Tainio, M.; Monsivais, P.; Jones, N.; Brand, C.; Woodcock, J. Mortality, Greenhouse Gas Emissions, and Consumer Cost Impacts of Replacing Short Car Trips with Cycling: A Health Impact Assessment Study. J. Transp. Health 2017, 5, S71. [Google Scholar] [CrossRef]
  5. Kaufman, R. Novel air pollution study gauges individual cyclists’ risks. Eos 2017, 98, 13. [Google Scholar] [CrossRef]
  6. Lonati, G.; Ozgen, S.; Ripamonti, G.; Signorini, S. Variability of Black Carbon and Ultrafine Particle Concentration on Urban Bike Routes in a Mid-Sized City in the Po Valley (Northern Italy). Atmosphere 2017, 8, 40. [Google Scholar] [CrossRef]
  7. Vlachokostas, Ch.; Achillas, Ch.; Michailidou, A.V.; Moussiopoulos, Ν. Measuring combined exposure to environmental pressures in urban areas: An air quality and noise pollution assessment approach. Environ. Int. 2012, 39, 8–18. [Google Scholar] [CrossRef] [PubMed]
  8. Spinazzè, A.; Cattaneo, A.; Peruzzo, C.; Cavallo, D.M. Modeling Population Exposure to Ultrafine Particles in a Major Italian Urban Area. Int. J. Environ. Res. Public Health 2014, 11, 10641–10662. [Google Scholar] [CrossRef] [PubMed] [Green Version]
  9. Spinazzè, A.; Cattaneo, A.; Scocca, D.R.; Bonzini, M.; Cavallo, D.M. Multi-metric measurement of personal exposure to ultrafine particles in selected urban microenvironments. Atmos. Environ. 2015, 110, 8–17. [Google Scholar] [CrossRef]
  10. Xu, L.; Ren, C.; Yuan, C.; Nichol, J.E.; Goggins, W.B. An Ecological Study of the Association between Area-Level Green Space and Adult Mortality in Hong Kong. Climate 2017, 5, 55. [Google Scholar] [CrossRef]
  11. INRIX. Traffico in Calo in Italia per il Secondo Anno Consecutivo. 2016. Available online: http://inrix.com/press-releases/scorecard-it/ (accessed on 5 July 2107).
  12. CamCom (Camera di Commercio, Industria e Artigianato di Milano). 2003. Available online: http://www.mi.camcom.it (accessed on 5 July 2107).
  13. De Nazelle, A.; Nieuwenhuijsen, M.J.; Antó, J.M.; Brauer, M.; Briggs, D.; Braun-Fahrlander, C.; Cavill, N.; Cooper, A.R.; Desqueyroux, H.; Fruin, S.; et al. Improving health through policies that promote active travel: A review of evidence to support integrated health impact assessment. Environ. Int. 2011, 37, 766–777. [Google Scholar] [CrossRef] [PubMed]
  14. Celis-Morales, C.A.; Lyall, D.M.; Welsh, P.; Anderson, J.; Steel, L.; Guo, Y.; Maldonado, R.; Mackay, D.F.; Pell, J.P.; Sattar, N.; et al. Association between active commuting and incident cardiovascular disease, cancer, and mortality: Prospective cohort study. BMJ 2017, 375, j1456. [Google Scholar] [CrossRef] [PubMed]
  15. Robinson, M.M.; Dasari, S.; Kanopka, A.R.; Carter, R.E.; Lanza, I.R.; Sreekumaran Nair, K. Enhanced Protein Translation Underlies Improved Metabolic and Physical Adaptations to Different Exercise Training Modes in Young and Old Humans. Cell Metab. 2017, 25, 581–592. [Google Scholar] [CrossRef] [PubMed]
  16. ECF. The EU Cycling Economy—Arguments for an Integrated EU Cycling Policy. European Cyclists’ Federation, Brussels. 2016. Available online: https://ecf.com/groups/eucycling-economy (accessed on 5 July 2107).
  17. Dockery, D.W.; Pope, C.A., III; Xu, X.; Spengler, J.D.; Ware, J.H.; Fay, M.E.; Ferris, B.G., Jr.; Speizer, F.E. An Association between Air Pollution and Mortality in Six U.S. Cities. N. Engl. J. Med. 1993, 329, 1753–1759. [Google Scholar] [CrossRef] [PubMed]
  18. Brunekreef, B.; Holgate, S.T. Air pollution and health. Lancet 2002, 360, 1233–1242. [Google Scholar] [CrossRef]
  19. Pope, C.A., III; Dockery, D.W. Health Effects of Fine Particulate Air Pollution: Lines that Connect. J. Air Waste Manag. Assoc. 2006, 56, 709–742. [Google Scholar] [CrossRef] [PubMed]
  20. Khafaie, M.; Yajnik, C.; Salvi, S.; Ojha, A. Critical review of air pollution health effects with special concern on respiratory health. J. Air Pollut. Health 2016, 1, 123–136. [Google Scholar]
  21. Viaene, P.; Belis, C.A.; Blond, N.; Bouland, C.; Juda-Rezler, K.; Karvosenoja, N.; Martilli, A.; Miranda, A.; Pisoni, E.; Volta, M. Air quality integrated assessment modelling in the context of EU policy: A way forward. Environ. Sci. Policy 2016, 65, 22–28. [Google Scholar] [CrossRef]
  22. Landrigan, P.J. Air pollution and health. Lancet Public Health 2017, 2, e4–e5. [Google Scholar] [CrossRef]
  23. Vardoulakis, S.; Fisher, B.E.A.; Pericleous, K.; Gonzalez-Flesca, N. Modelling air quality in street canyons: A review. Atmos. Environ. 2003, 37, 155–182. [Google Scholar] [CrossRef]
  24. Dominici, F.; Peng, R.D.; Barr, C.D.; Bell, M.L. Protecting Human Health from Air Pollution: Shifting from a Single-Pollutant to a Multi-pollutant Approach. Epidemiology 2010, 21, 187–194. [Google Scholar] [CrossRef] [PubMed]
  25. Billionnet, C.; Sherrill, D.; Annesi-Maesano, I. Estimating the Health Effects of Exposure to Multi-Pollutant Mixture. Ann. Epidemiol. 2012, 22, 126–141. [Google Scholar] [CrossRef] [PubMed]
  26. Künzli, N.; Kaiser, R.; Medina, S.; Studnicka, M.; Chanel, O.; Filliger, P.; Herry, M.; Horak, F., Jr.; Puybonnieux-Texier, V.; Quénel, P.; et al. Public-health impact of outdoor and traffic-related air pollution: A European assessment. Lancet 2000, 356, 795–801. [Google Scholar] [CrossRef]
  27. Blengio, G.; De Noi, L.; Falcone, S.; Manservisi, S. La valutazione del rischio sanitario correlato all’inquinamento atmosferico nei centri urbani. Azienda ULSS 22 Regione Veneto Direzione Sanitaria 2014, 5–31. [Google Scholar]
  28. FIAB Milano Ciclobby. 13 Censimento dei Ciclisti Milanesi. 2014. Available online: http://www.ciclobby.it (accessed on 5 July 2107).
  29. Comune di Milano. Piano Urbano Della Mobilità Sostenibile. Milano. Documento di Piano. 2015. Available online: http://comune.milano.it (accessed on 5 July 2107).
  30. Fietsberaad. The Bicycle Capitals of the World: Amsterdam and Copenhagen. Publication no. 7a. 2010. Available online: http://www.fietsberaad.nl (accessed on 5 July 2107).
  31. Amsterdam Marketing, the City Marketing Organisation of the Amsterdam Metropolitan Area. Available online: www.iamsterdam.com (accessed on 21 August 2107).
  32. Environmental and Mobility Agency of Milan (AMAT). Available online: www.amat-mi.it (accessed on 5 July 2107).
  33. World Weather and Climate Information. Available online: www.weather-and-climate.com (accessed on 21 August 2107).
  34. World Health Organization (WHO). Health Economic Assessment Tools (HEAT) for Walking and for Cycling. Economic Assessment of Transport Infrastructure; WHO Regional Office for Europe: Copenhagen, Denmark, 2014. [Google Scholar]
  35. World Health Organization (WHO). Development of the Health economic assessment tools (HEAT) for walking and cycling. In Proceedings of the Consensus Workshop: Meeting Report, Bonn, Germany, 1–2 October 2013; WHO Regional Office for Europe: Copenhagen, Denmark, 2014. [Google Scholar]
  36. Schantz, P.; Stigell, E. Distance, time and velocity as input data in cost-benefit analyses of physically active transportation. In Proceedings of the 2nd International Congress of Physical Activity and Public Health, Amsterdam, The Netherlands, 13–16 April 2008; p. 270. Available online: http://www.gih.se/mhe (accessed on 5 July 2107).
  37. Bigazzi, A.Y. Determination of active travel speed for minimum air pollution inhalation. Int. J. Sustain. Transp. 2017, 11, 221–229. [Google Scholar] [CrossRef]
  38. World Health Organization (WHO). Economic Valuation of Transport-Related Health Effects. Review of Methods and Development of Practical Approaches, with Special Focus on Children; WHO Regional Office for Europe: Copenhagen, Denmark, 2008. [Google Scholar]
  39. Rojas-Rueda, D.; De Nazelle, A.; Tainio, M.; Nieuwenhuijsen, M.J. The health risks and benefits of cycling in urban environments compared with car use: Health impact assessment study. BMJ (Clin. Res. Ed.) 2011, 343. [Google Scholar] [CrossRef] [PubMed] [Green Version]
  40. Grabow, M.L.; Spak, S.N.; Holloway, T.; Stone, B., Jr.; Mednick, A.C.; Patz, J.A. Air quality and exercise-related health benefits from reduced car travel in the midwestern United States. Environ. Health Perspect. 2012, 120, 68–76. [Google Scholar] [CrossRef] [PubMed]
  41. Lombardy Regional Census Report. Available online: www.asr-lombardia.it (accessed on 5 July 2107).
  42. Ozgen, S.; Ripamonti, G.; Malandrini, A.S.; Ragetti, M.S.; Lonati, G. Particle number and mass exposure concentrations by commuter transport modes in Milan, Italy. AIMS Environ. Sci. 2016, 3, 168–184. Available online: http://www.aimspress.com/article/10.3934/environsci.2016.2.168 (accessed on 5 July 2107). [CrossRef]
  43. Environmental Agency of the Lombardy Region. Available online: www2.arpaLombardia.it/sites/QAria (accessed on 5 July 2107).
  44. Lombardy Region Air Emission Inventory. Available online: http://inemar.arpalombardia.it (accessed on 5 July 2107).
  45. Regione Lombardia, Piano Regionale degli Interventi per la Qualità dell’Aria, 2013. Available online: http://www.regione.lombardia.it (accessed on 22 August 2107).
  46. FIAB (Federazione Italiana Amici della Bicicletta) Onlus. Usare la Bicicletta nelle aree Urbane. Posizione ufficiale dell’EFC European Cyclists’ Federation. 2008. Available online: http://www.fiab-onlus.it/downl2/cycling.pdf (accessed on 5 July 2107).
  47. WHO. Unlocking New Opportunities: Jobs in Green and Healthy Transport; World Health Organisation, Regional Office for Europe, WHO Regional Office for Europe: Copenhagen, Denmark, 2014. [Google Scholar]
  48. De Hartog, J.J.; Boogaard, H.; Nijland, H.; Hoek, G. Do the health benefits of cycling outweigh the risks? Environ. Health Perspect. 2010, 118, 1109–1116. [Google Scholar] [CrossRef] [PubMed]
  49. Jacobsen, P.L. Safety in numbers: More walkers and bicyclists, safer walking and bicycling. Inj. Prev. 2003, 9, 795–801. [Google Scholar] [CrossRef]
  50. Guglieri, V.; Silva, G. La Ciclabilità in Lombardia: Questione Politica o Sviluppo Infrastrutturale? Bachelor’s Thesis, Politecnico di Milano, Milan, Italy, 2016. [Google Scholar]
Figure 1. Map of Milan with the traffic origin zones (green) taken into account to evaluate average trip length.
Climate 05 00065 g001
Figure 2. Number of rainy days per month in Milan (top left) and Amsterdam (top right) and monthly average of the maximum and minimum temperature in Milan (lower left) and Amsterdam (lower right) (data from [33]).
Climate 05 00065 g002
Figure 3. Response function (continuous line) for relative risk (RR) implemented in the Health Economic Assessment Tool (HEAT) for cycling on the basis of various studies (black dots) (adapted from [38]). MET, metabolic equivalent of task.
Climate 05 00065 g003
Figure 4. Yearly average particulate matter with diameter smaller than 10 μm (PM10) concentration in Milan and a possible interpolating trend (data from [43]).
Climate 05 00065 g004
Figure 5. Variation in mortality risk for different trip durations under the 2024 scenario conditions.
Climate 05 00065 g005
Figure 6. Reduction in mortality risk when travel duration is set equal to 30 min/day.
Climate 05 00065 g006
Figure 7. Absolute and percentage reduction in the number of deaths in the age range of 20–64, in Milan, in 2015.
Climate 05 00065 g007
Figure 8. Annual economic benefits and percentage of the health cost paid each year by the city of Milan.
Climate 05 00065 g008
Table 1. Values of data input unchanged for different scenarios. VSL, standard value of statistical life.
Trip Duration by Bike (Min/Day)30–60
Trip duration by car (min/day)26–52
Activity days/year220
Base mortality rate (death/100,000 inhabitants)157.2
VSL (million €)4.7
Discount rate (%)5
RR101.043
Ventilation rate at rest (m3/h)0.54
Ventilation rate when biking (m3/h)2.28
Ventilation rate when driving (m3/h)0.66
Table 2. Ventilation rate corresponding to a bicycle speed of 8 km/h and 19.3 km/h [7].
Bicycle 8 km/h (m3/h)1.5
Bicycle 19.3 km/h (m3/h)3
Table 3. Outputs of the HEAT for cycling and the R-R models for different scenarios when trip duration is equal to 30 min/day.
2024Improved Air Quality ScenarioAmsterdam Scenario
Variation in mortality risk (%)HEAT131313
R-R0.660.580.66
Variation in mortality levelHEAT222295
R-R115
Average annual value (M€)HEAT8181343
R-R4.23.718
Economic value over 10 years (M€)HEAT8138133440
R-R4337181
Benefits/Damages ratio192219
Table 4. CO2 and PM10 average emission factors corresponding to petrol and diesel cars.
Average Emission Factor
CO2 (g/km)PM10 (mg/km)
Petrol180.4626.26
Diesel167.5179.77
Table 5. Number of petrol and diesel car replaced by bike in the differest scenarios analysed.
Number of Cars Replaced by Bike
PetrolDiesel
∆scenario current-202417,3689324
∆scenario current-Amsterdam243,997121,670
Table 6. Reduction in CO2 and PM10 emissions due to the increase in the number of cyclists assumed by the 2024 and Amsterdam scenarios compared to the current situation (trip distance of 7 km) and percentage of traffic emissions reduction in Milan.
CO2∆Scenario Current-2024∆Scenario Current-AmsterdamPM10∆Scenario Current-2024∆Scenario Current-Amsterdam
t/year7600100,000t/year228
%0.607.7%0.598.3

