Article

A Climate Change Assessment via Trend Estimation of Certain Climate Parameters with In Situ Measurement at the Coasts and Islands of Viet Nam

Viet Nam Institute for Sea and Island Research, 83 Nguyen Chi Thanh, Dong Da, Ha Noi , Viet Nam
Climate 2017, 5(2), 36; https://doi.org/10.3390/cli5020036
Submission received: 27 March 2017 / Revised: 5 May 2017 / Accepted: 16 May 2017 / Published: 20 May 2017

Abstract

:
This study presents results on an assessment of climate change in the nearshore and coastal areas of Viet Nam through an evaluation of trends of certain climatic parameters (air temperature, sea water temperature, sea level, and number of typhoons landed at the Vietnamese coast by year) using time series data of hydro-meteorological records at the coasts and islands of Viet Nam. The method used for the trend evaluation is the Mann–Kendall test ran at the 5% significance level and Spearman rank correlation coefficient. It was found that there is an extremely likely increasing trend of air temperature for almost all observation stations at the coasts and islands of Viet Nam. However, it was unable to confirm a general trend for sea surface water temperature; except for very few stations in semi-closed waters, there is no clear trend in annual average sea water temperature at a majority of stations. Additionally, there is an extremely likely rising trend of sea level at a majority of stations with reliable data, but the rates of increase are very different for different stations. The reasons for discrepancies in the trend of annual average sea water temperature and sea level at different stations are still not understood, but it seems that an assessment of the vertical movement of the ground surface at the stations is necessary to have an accurate assessment of the rate of sea level rise due to climate change and of the influence of general circulation in the East Viet Nam Sea on the trend of sea water temperature in that location. It is also found that there is a likely decreasing trend in the frequency of typhoons landed at the Vietnamese coast; however, this trend might not be due to climate change, but to climate variability.

1. Introduction

According to the IPCC [1], based on the results of an evaluation using the longest available data set (1901–2012), it is certain that the surface of almost the entire globe has experienced warming; and accordingly, it is certain that the surface air temperature shows a tendency to increase. It is also certain that the mean sea level is rising on a global scale. Results of the evaluation on the trend of typhoon activities in the past do not show a clear trend in the tropical cyclone frequency globally; however, the projection results indicate that in the future it is likely that globally the tropical cyclone frequency will either decrease or remain unchanged. The report of the IPCC (2013) [1] also suggests that changes in atmospheric circulation due to climate change are important for local climate change.
The climate changes gradually in Viet Nam—a country with a length of more than 1600 km in the north–south direction—as it stretches through many latitudes, from 8° N to 23° N. The North of the country has two distinct seasons: dry, cold winter (December to February) with a daily average air temperature of about 16–18 °C and hot, wet summer (June to August) with a daily average air temperature of about 28–30 °C. In between the distinct seasons, there are also two transitional seasons: cool, humid spring (March to May) and cool, wet autumn (September to November). On the other hand, the South of the country is always hot and has two different distinct seasons, dry (December to May) and wet (June to November) [2], with daily average temperature changes between 26 and 29 °C. With these geographical characteristics, it is expected that climate change in the country is different for different regions.
There has been much research on the assessment of climate change in Viet Nam [3,4,5,6,7]. It was found [4,5] that, over the past 50 years, average air temperature in Viet Nam increased by about 0.5 °C. Air temperature during winter increases more rapidly than that during summer. The observed data at marine hydrometeorological stations at the coast and islands in Viet Nam show that the sea level at almost all stations has a tendency to increase. The average sea level rise rate along the coast of Viet Nam is about 2.9 mm/year. Along the coast of Viet Nam, the sea levels at the coast of the center of Central Viet Nam and at the coast of South West Viet Nam rise faster than that at other coasts.
It should be stressed that the uncertainty of all the above-mentioned results were not assessed, despite the scatter of data, as shown later in this study. Additionally, an explanation of the reasons for the differences on sea level rise rate at different stations has not been provided. Thus, it is difficult for policy makers and other stakeholders to use such results for developing adaptation measures.
Lin et al. [8] used data derived from satellite and in situ measurements to study the thermal variability in the South China Sea. They found that the sea surface temperature (SST) increased from 1982 to 2005 at a rate of 0.276 °C per decade. They also remarked that changes in the SST in Viet Nam have not been assessed.
One very important task in climate change assessment is evaluating the trend in the frequency of tropical cyclones. Kajikawa and Wang [9] found that the number of tropical cyclones passing through the South China Sea (SCS) and the Philippine Sea over the 1994–2008 period is about double those that occurred over the 1979–1993 period. They further supposed that the enhanced tropical cyclone activity over the area is attributed to a significant increase in SST over the Equatorial Western Pacific from the 1980s to the 2000s. On the other hand, Goh and Chan [10] found that the total number of tropical cyclones in the South China Sea is below normal in El Niño events but above normal during La Niña events.
This study presents results of the evaluation on the trend of certain climate parameters for the assessment of climate change in the nearshore and coastal areas of Viet Nam. The study was carried out by using in situ measured data at stations on the coasts and islands of Viet Nam. The analyzed method used in the study is the Mann–Kendall test [11,12,13,14,15] runs at 5% significance level on time series of recorded data. The existence of the trend was justified by using Spearman Rank correlation coefficient at a 5% significance level. Based on the test results, the climate change trend at each station is evaluated and assessed.

2. Material and Methods

2.1. Methods

The analysis was carried out by using Mann–Kendall method [12,16,17,18,19]. This is a robust test and may help avoid false tendency generated by outliers; the test also does not require a specified statistical distribution of samples. This method is widely used in analyzing climate data [20,21]. Verification on the existence of the tendency is carried out by examining the Spearman rank correlation coefficient at the 5% significant level by assuming a Student’s t distribution of the random variables. This is because, when the sample size n is larger than 20, the assumption of the test statistic t following the Student’s t distribution with an n − 2 degree of freedom is reasonable. For small sample sizes, statistical tables can be used to determine whether Spearman rank correlation coefficient ρ is significantly different from zero. The lowest values of the Spearman rank correlation coefficient ρ for confirming the existence of trend with significant level α = 0.05 for different sizes of data samples are shown in Table 1 [22].
In this study, the Mann–Kendall test Z for evaluation of trends for sample size greater than 30 is used. For this case using a confidence level of 95%, a significant trend is confirmed if the value of Z is greater than 1.96. For the case of a sample size less than 30, trends with a confidence level of 95% is confirmed by using Spearman rank correlation coefficient follows values in Table 1. Once a significant trend is confirmed, the tendency equation is established by Theil’s and Sen’s slope estimator tests [23]. However, if the annual time series for certain parameters at some stations are shorter than 30 years, the Mann–Kendall test Z is still used for such data series, and the results are used only for reference.

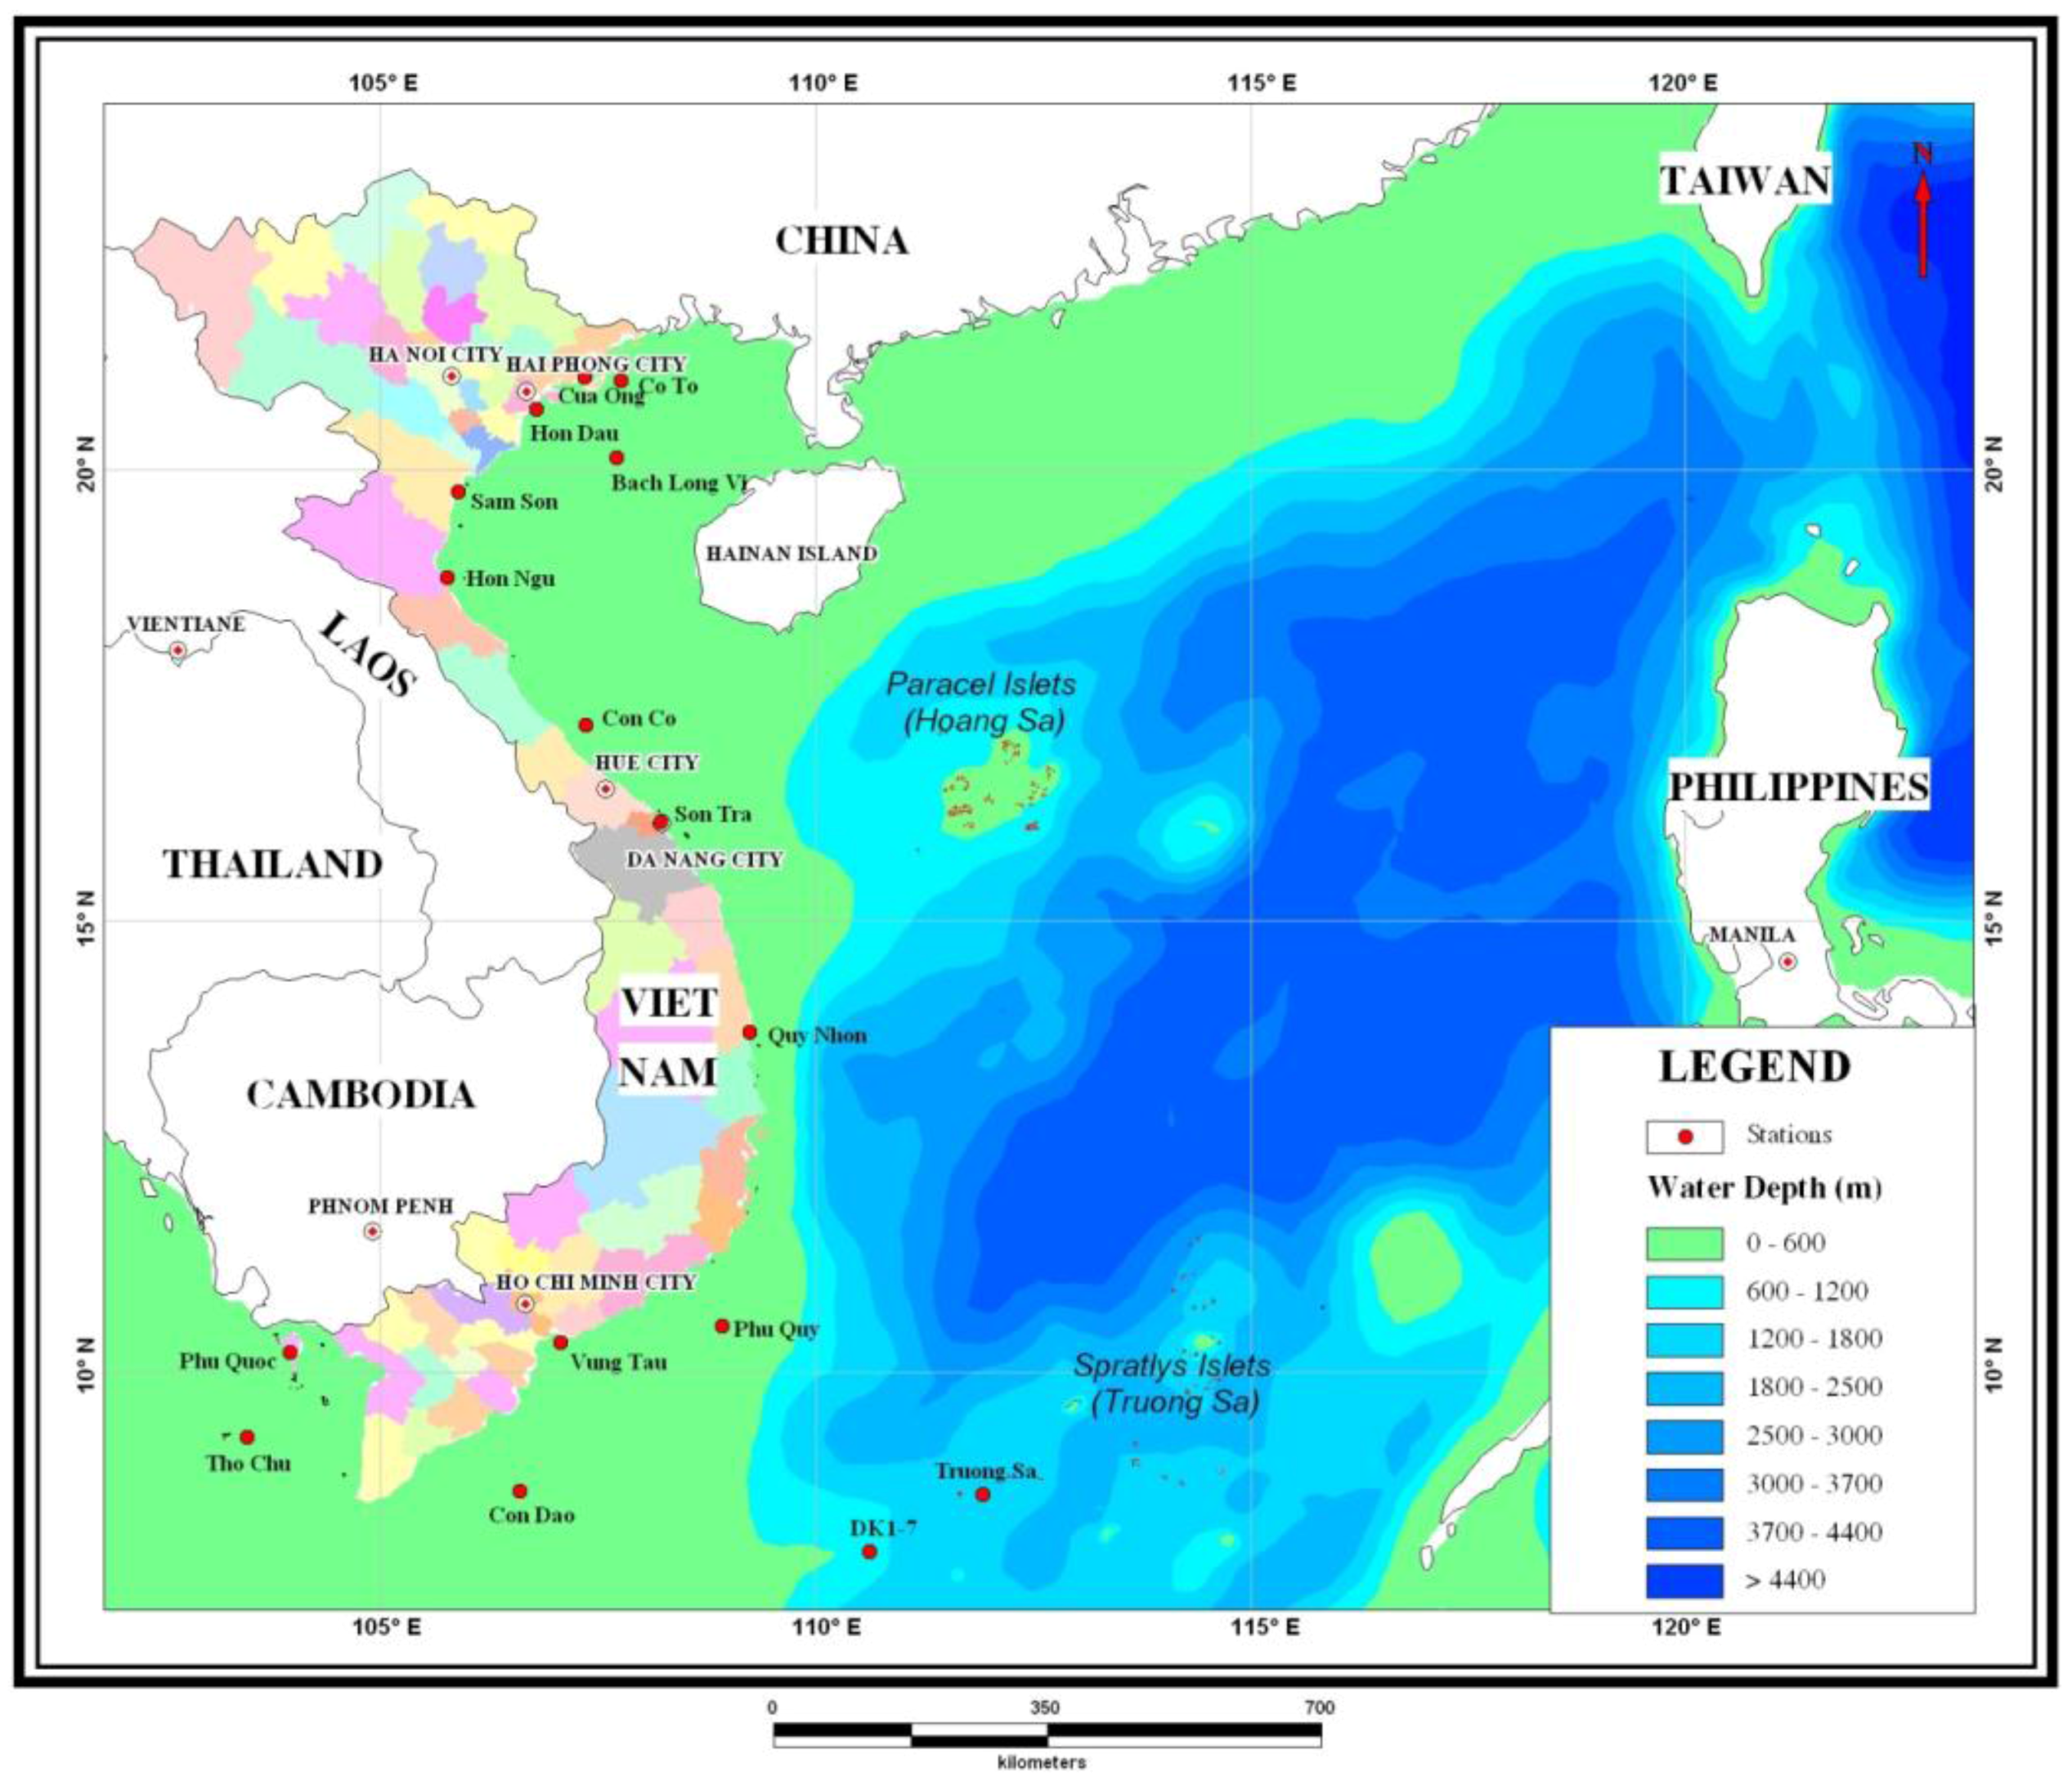
2.2. Data Used for the Study

The data used in this study are in situ measured data of air temperature, water temperature, and water level at observation stations at the coasts and on the islands of Viet Nam as shown in Table 2 and Figure 1. The typhoon data were obtained from the Tokyo Typhoon Center, Regional Specialized Meteorological Center (RSMC), and Japan Meteorological Agency (JMA).
As shown in Table 2, the data at different stations at the coasts and on the islands of Viet Nam have different measurement periods. This is due to long wars and a lack of resources, financial or personal. The analysis of different climate parameters was made only with available data, which means that certain parameters were not analyzed at stations where data were not available. Because of the non-homogeneous data, as discussed earlier, data from Table 1 are used for determining the Spearman rank correlation coefficient for different sizes of data samples.
It should be mentioned that the measurements of climatic parameters at the stations in Table 2 were carried out 24 times (every hour) or 4 times (at 1 h, 7 h, 13 h, and 19 h) per day for the measurement period. However, to evaluate the trend of the climatic parameter, only annual average values are used. Then, the measured data were averaged for one year, and the obtained data were used for analysis.

3. Results and Discussion

3.1. Air Temperature

Results of the Mann–Kendall test and Spearman rank correlation coefficient evaluation for the detection of trends in annual average air temperature at different stations at the coasts and islands of Viet Nam are shown in Table 3. In the table, trends of change in annual average air temperature at the stations are also shown.
It can be seen in Table 3 that, except for five stations—Sam Son, Hon Ngu, Con Co, Hue, and Phu Quy—the trend of increase in annual average air temperature is notable for all remaining stations along the coasts and on the islands of Viet Nam. On average, the rate of increase in annual average air temperatures for stations with a significant trend is about 0.2 °C per decade. The rate of air temperature increase in Northern Viet Nam is higher than that in the Central and Southern Viet Nam. There is no tendency to increase in annual average air temperature at stations on the coast of North Central Viet Nam: Sam Son, Hon Ngu, and Con Co. The reason for this is not clear and might be due to the fact that changes in the monsoon system due to climate change [9] and changes in sea influence through changes in circulation [1] mitigate the air heating up at this place. Air temperature at Phu Quy, an offshore station at Southern Central Viet Nam, shows a trend similar to that of Sam Son, Hon Ngu, and Con Co. Even though it is not clear, the air temperature at Hue, a station at just South of Con Co, shows a decreasing trend. On the other hand, with a small distance of about 100 km in the South of Hue station, the air temperature at Son Tra shows a very clear increasing trend. This abrupt change in the trends of the annual average temperature at the two places might be due to the influence of a high mountain range in between them. Thus, even at the coast, geographical features may have a large influence on local climate change. The air temperatures at Truong Sa (Spratlys) and Con Dao, offshore islands, show a very clear increasing trend.
From Table 3, it can be said that the near surface air temperature at a majority of stations at the coasts and islands of Viet Nam shows an extremely likely tendency to increase. With the general picture of the increasing trend of air temperature at the stations, the lack of (sometimes negative) trend factors of air temperature at Sam Son, Hon Ngu, Con Co, Phu Quy, and Hue needs more investigation for a proper explanation.

3.2. Water Temperature

Recently, coral bleaching was found at various places in Viet Nam [24]. It was found by the same author that coral bleaching and mass coral death occurred during hot summer days. Research from around the world [25,26,27,28,29] found that the sea water temperature increase due to climate change is lethal to coral reefs by causing bleaching. Thus, it is very important to evaluate the trend of sea water temperature in the context of climate change. Previous studies, such as MONRE [4,5], have not addressed this issue.
Results of the evaluation of the trend in annual average in situ measured sea water temperature at stations at the coasts and islands of Viet Nam are shown in Table 4. The table also expresses trends in annual average sea water temperature at some stations where trends exist.
The sea water temperature was not measured at Hue. Due to discontinuity, the data at Bach Long Vi were not suitable for statistical analysis. The Son Tra station is located at a river mouth, which implies that water temperature is strongly influenced by river water and is also not suitable for statistical analysis. Therefore, in Table 4, there are no results for the three above-mentioned stations. It can be seen in Table 4 that out of 12 stations with reliable data, the water temperature data at only four stations—Cua Ong, Co To, Hon Dau (in the North), and Phu Quoc (in the South)—show a notable trend. Even with a low value of the Spearman rank correlation coefficient, it can be said that an increasing trend in sea water temperature can be seen at Hon Ngu. It should be noted that Co To and Hon Dau are located at relatively open waters in the Tonkin Gulf, and the other two stations (Cua Ong and Phu Quoc) are located at relatively shielded waters. At all five stations located at open waters (Sam Son, Con Co, Phu Quy, Truong Sa, and Con Dao), the water temperature data do not show a clear trend. Therefore, it seems that ocean circulation, especially the upwelling near the Vietnamese coast [30], so far diminishes the sea surface water heating due to climate change in the Viet Nam Seas. However, the sea surface water temperature data at two shielded stations (Bai Chay and Vung Tau) also show no trend. With the above-mentioned facts, it can be said that the heating due to climate change of the sea water nearshore and near the islands of Viet Nam is not a simple process and needs more research to understand.

3.3. Water Level

Results of the trend evaluation for annual average sea water level using data recorded at stations are shown in Table 5. In the table, trends of sea level at stations where trend exists are also shown.
There are no recorded data for the sea level at Hue; moreover, since the Son Tra station is located at the mouth of a river, the sea level data, similar to the water temperature data, at this station is not reliable enough for statistical analysis to find a trend. The time series of the sea water level at Truong Sa and Hon Ngu are too short for statistical analysis and thus were also excluded. As a result, in Table 5, there are no results of analysis for Hon Ngu, Hue, Son Tra, and Truong Sa stations. Table 5 shows that water level data at stations with reliable data in general show a tendency to increase, but the rate of increase is very different for different stations. The largest value of the sea level rise rate of 0.527 cm/year is found at Cua Ong, while the data at a nearby station, Co To, show a decreasing trend. At the same time, the data at Con Co show no trend. Therefore, the findings of this study in general are in agreement with that of MONRE [4,5], except a large discrepancy in the rates of increase for different stations. As it is commonly known that the vertical movement of the ground surface can have a very large influence on the results of evaluation of sea level rise, an assessment of the change in ground surface elevation in the vertical direction is necessary for comparing the sea level rise rate at different stations.
The negative trend of the water level at Co To is still not understood. As the sea level is measured relative to the station datum, the negative trend can be explained either by the lowering of the sea level or the rising of the station datum (or the ground surface) due to tectonic plate movement. Since we do not have information on the vertical movement of the ground surface at Co To, this issue requires new research. Additionally, discrepancies in sea level rise rates at stations along the coasts and islands of Viet Nam found in this study do not confirm findings by MONRE [4,5] that, along the coast of Viet Nam, the sea levels at the coast of the center of Central Viet Nam and at the coast of South West Viet Nam rise faster than that at other coasts. In fact, it seems that sea level rise rate is largest at Cua Ong (0.527 cm/year) in the North and smaller at Con Dao (0.252 cm/year) and Phu Quoc (0.244 cm/year) in the South.
From the above-mentioned findings, it can be remarked that an extremely likely rising trend is found for the sea level along the coast and near islands of Viet Nam. The accurate rising rate of the sea level should be evaluated with an accurate evaluation of the vertical movement of the ground surface.

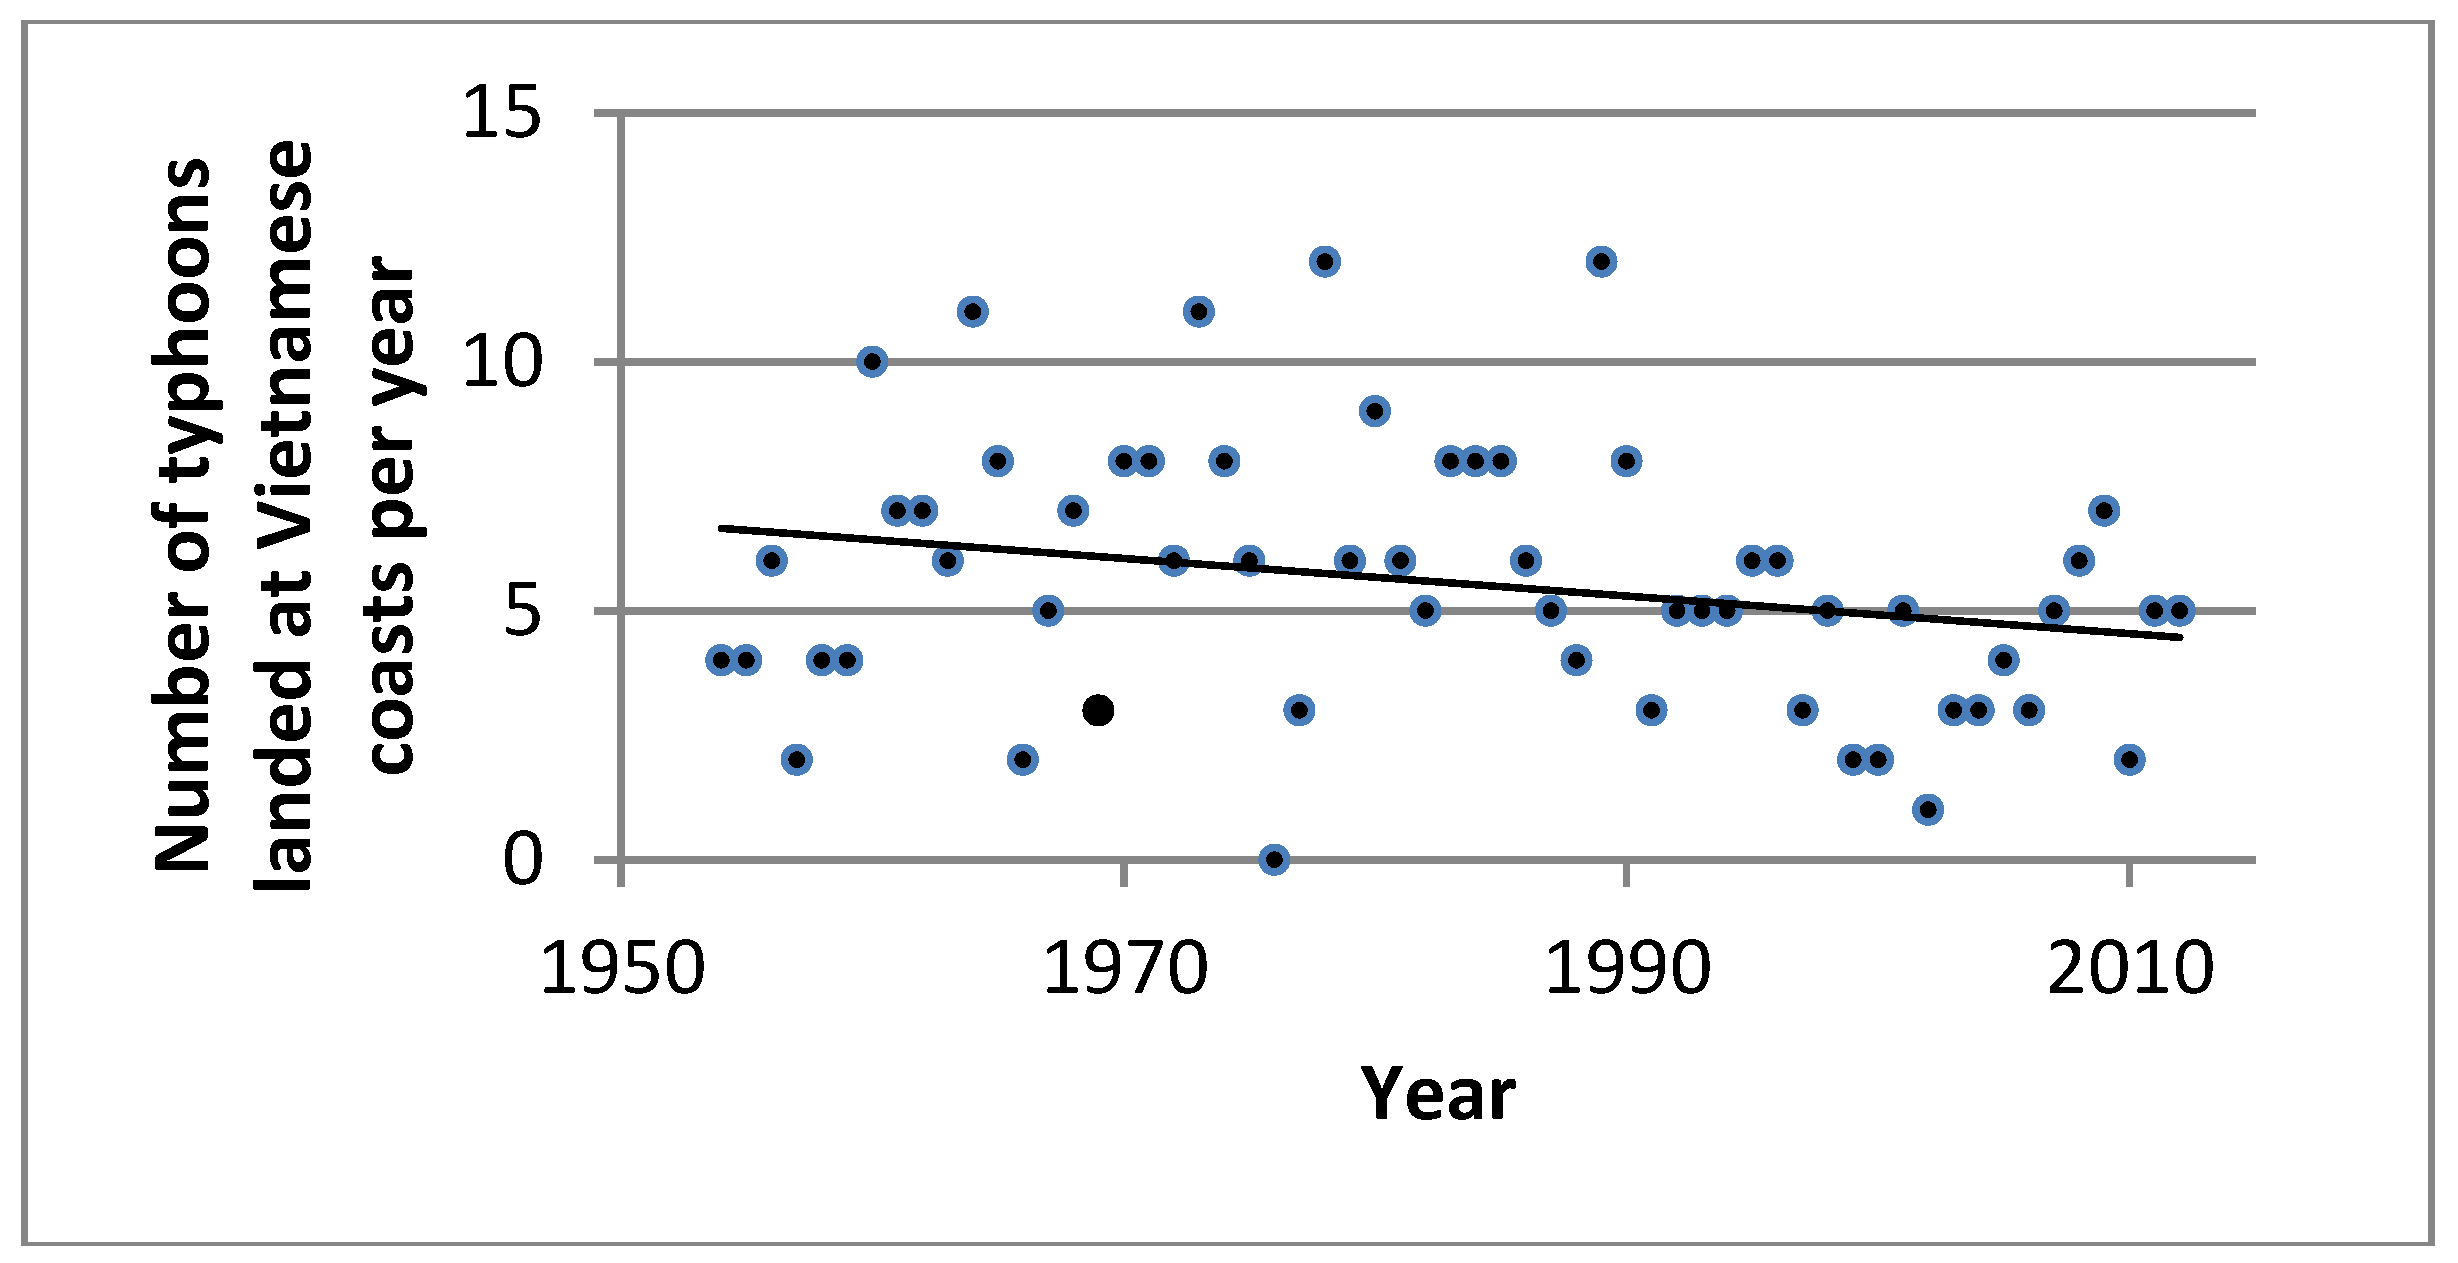
3.4. Number of Typhoon Landed at the Vietnamese Coasts

The typhoon data used for this study are from the Tokyo Typhoon Center, Regional Specialized Meteorological Center (RSMC), JMA (1951–2012), checked with the data recorded at the Hydrometeorological Service of Viet Nam (1954–2012). To use the data from the two sources, the data in the period from 1954 to 2012 were used.
The numbers of typhoons landed at the coasts of Viet Nam per year (frequency of typhoons landed at the Vietnamese coasts) for the study period are shown in Figure 2. During the 59 years between 1954 and 2012, there were 328 typhoons that landed at the coasts of Viet Nam. The years 1978 and 1989 have the highest frequency of typhoons (12 typhoons), and the years 1964 and 1973 showed the second highest frequency of typhoons (11 typhoons). The year 1976 has no recorded typhoons, and the year 2002 experienced 1 typhoon.
From Figure 2, it is clear that the average frequency of typhoons landed at the coasts of Viet Nam during the period between 1960 and 1989 (6.83 typhoons/year) is larger than that during the period from 1990 to 2009 (4.35 typhoons/year). The difference in the data is very significant, and it can be seen from the figure that yearly variation in the frequency of typhoons landed at the Vietnamese coast is much larger than the trend, if any trend exists. Calculated results show that the Z value of the Mann–Kendall test for this case is −1.96, and the Spearman rank correlation coefficient ρ is 0.244. Thus, with the confidence level of 95%, values of the test parameters, Z and ρ, are not large enough for the confirmation on the existence of a trend of the frequency of typhoons landed at Vietnamese coast. However, the absolute value of Z is significantly larger than the critical Z value (1.645) for the confidence level of 90%. Additionally, a negative value of Z indicates that the trend is decreasing. Additionally, since the data series is not sufficiently long and provided that the scatter of data is very large, it can be remarked that there is still not enough evidence to relate the frequency of typhoons landed at Vietnamese coasts to climate change. In fact, for the study period, the frequency of typhoons is not increasing, but even decreasing with the increase of air temperature.
The above-mentioned findings in this study show a contradiction with other findings [9,31]: despite the increase in the number of typhoons entering the South China Sea during the last two decades, the number of typhoons landed at the coasts of Viet Nam for the same period decreased. The findings are also in agreement with the projections of the IPCC [1] that in the future it is likely that globally the typhoon frequency will either decrease or remain unchanged. However, reasons for this are still unclear. On the other hand, with this short data series, the decreasing trend in the frequency of typhoons landed at Vietnamese coasts evaluated in this study might be due to climate variability—not climate change.

4. Conclusions and Future Outlook

(1)
It is extremely likely that there is a trend of increase of annual average air temperature at all coastal and nearshore island stations throughout Viet Nam.
(2)
Extremely likely trends of increase in annual average sea water temperature were found only at a few partially sheltered stations. The sea water temperature data at all stations located at open waters and at some stations located at sheltered waters do not show an increasing trend. It seems that the general circulation in the East Viet Nam Sea has a large influence on the heating of the sea surface water, but the phenomenon of heating of the sea surface water in the area is very complicated and needs more investigations to understand.
(3)
It is extremely likely that the sea level near the coasts and islands of Viet Nam is rising. A large discrepancy in the rate of sea water level rise evaluated at different stations shows that the vertical movement of the ground surface might have a significant influence on the rate of sea level rise and needs to be accurately assessed. Then, the conclusion by MONRE (2009, 2012) that average sea level rise rate along the coast of Viet Nam is about 2.9 mm/year should be used with care.
(4)
It is very likely that there is a decrease trend in the frequency of typhoons landed at Vietnamese coasts during the period from 1954 to 2012. However, the unclear trend of decrease in the frequency of typhoons landed at Vietnamese coasts might represent climate variability and does not necessarily represent a general trend due to climate change.
(5)
Policymakers in Viet Nam should consider the level of uncertainties in evaluating climate change trend based on the data at the coast and island of Viet Nam and thus in climate change scenario projections when developing climate change adaptation policies in future.

Acknowledgments

This study is a part of the national research project “Climate-scale variations in the monsoon system and impacts to East Viet Nam Sea”, funded by the Ministry of Science and Technology of Viet Nam.

Conflicts of Interest

The author declares no conflict of interest. The founding sponsor had no role in the design of the study; in the collection, analyses, or interpretation of data; in the writing of the manuscript, and in the decision to publish the results.

References

  1. Intergovernmental Panel on Climate Change (IPCC). Climate Change 2013: The Physical Science Basis. Cambrige University Press, 2013. Available online: http://www.ipcc.ch/report/ar5/wg1/ (accessed on 18 May 2017).
  2. Pham, N.T.; Phan, T.D. The Climate of Viet Nam; Ha Noi Science and Engineering Publisher: Ha Noi, Vietnam, 1995. [Google Scholar]
  3. Ho, T.; Phan, V.; Le, N.; Nguyen, Q. Extreme climatic events over Viet Nam from observational data and RegCM3 projections. Clim. Res. 2011, 49, 87–100. [Google Scholar] [CrossRef]
  4. Ministry of Natural Resources and Environment of Viet Nam (MONRE). Climate Change Scenarios and Sea Level Rise for Viet Nam; Report; 2009. Available online: http://www.preventionweb.net/files/11348_ClimateChangeSeaLevelScenariosforVi.pdf (accessed on 18 May 2017).
  5. Ministry of Natural Resources and Environment of Viet Nam (MONRE). Climate Change Scenarios and Sea Level Rise for Vietnam; Report; Natural Resource and Environment Publisher: Ha Noi, Vietnam, 2012.
  6. Mai, V.K.; Redmond, G.; McSweeney, C.; Tran, T. Evaluation of dynamically downscaled ensemble climate simulations for Vietnam. Int. J. Climatol. 2014, 34, 2450–2463. [Google Scholar]
  7. Ngo-Duc, T.; Kieu, C.; Thatcher, M.; Nguyen-Le, D.; Phan-Van, T. Future climate projections for Vietnam based on three regional climate models. Clim. Res. 2014. [Google Scholar] [CrossRef]
  8. Lin, Y.L.; Ho, C.R.; Zheng, Q.N.; Huang, S.J.; Kuo, N.J. Variability of sea surface temperature and warm pool area in the South China Sea and its relationship to the western Pacific warm pool. J. Oceanogr. 2011, 67, 719–724. [Google Scholar] [CrossRef]
  9. Kajikawa, Y.; Wang, B. Interdecadal change of the South China Sea Summer Monsoon Onset. J. Clim. 2011, 25, 3207–3218. [Google Scholar] [CrossRef]
  10. Goh, A.Z.C.; Chan, J.C.L. Interannual and interdecadal variations of tropical cyclone activity in the South China Sea. Int. J. Climatol. 2010, 30, 827–843. [Google Scholar] [CrossRef]
  11. Hamed, K.H.; Rao, A.R. A modified Mann–kendall trend test for autocorrelated data. J. Hydrol. 1998, 204, 182–196. [Google Scholar] [CrossRef]
  12. Karmeshu, N. Trend Detection in Annual Temperature & Precipitation using the Mann Kendall Test—A Case Study to Assess Climate Change on Select States in the Northeastern United States. Available online: http://repository.upenn.edu/mes_capstones/47 (accessed on 18 May 2017).
  13. Sen, P.K. Estimates of the regression coefficient based on Kendall’s Tau. J. Am. Stat. Assoc. 1968, 63, 1379–1389. [Google Scholar] [CrossRef]
  14. Yue, S.; Pilon, P.; Phinney, B.; Cavadias, G. The influence of autocorrelation on the ability to detecttrend in hydrological series. Hydrol. Processes 2002, 16, 1807–1829. [Google Scholar] [CrossRef]
  15. Yue, S.; Wang, C. The Mann–kendall test modified by effective sample size to detect trend in serially correlated hydrological series. Water Resour. Manag. 2004, 18, 201–218. [Google Scholar] [CrossRef]
  16. Kendall, M.G. Rank Correlation Methods; Griffin: London, UK, 1955. [Google Scholar]
  17. Mann, HB. Non-Parametric Tests against Trend. Econometrica 1945, 13, 245–259. [Google Scholar] [CrossRef]
  18. Murumkar, A.R.; Arya, D.S. Trend and periodicity analysis in rainfall pattern of Nira Basin, Central India. Am. J. Clim. Chang. 2014, 3, 60–70. [Google Scholar] [CrossRef]
  19. Haan, C.T. Statistical Methods in Hydrology; Iowa State University Press: Ames, IA, USA, 1995. [Google Scholar]
  20. Lazaro, R.; Rodrigo, F.S.; Gutierrez, L.; Domingo, F.; Puigdefabregas, J. Analysis of a 30-year rainfall record (1967–1997) in semi-arid SE Spain for implications on vegetation. J. Arid Environ. 2001, 48, 373–395. [Google Scholar] [CrossRef]
  21. Mirza, M.Q.; Warrick, R.A.; Ericksen, N.J.; Kenny, G.J. Trends and persistence in precipitation in the Ganges, Brahmaputra and Meghna river basins. Hydrol. Sci. J. 1998, 43, 845–858. [Google Scholar] [CrossRef]
  22. Ramsey, P.H. Critical values for Spearman’s rank order correlation. J. Educ. Stat. 1989, 14, 245–253. [Google Scholar] [CrossRef]
  23. Gilbert, R.O. “6.5 Sen’s Nonparametric Estimator of Slope”, Statistical Methods for Environmental Pollution Monitoring; John Wiley and Sons: Hoboken, NJ, USA, 1987. [Google Scholar]
  24. Vu, T.C. Assessing Impacts of Climate Change and Sea Level Rise on Island Districts in Viet Nam and Proposing Adaptation Measures; Research project report submitted to the Ministry of Natural Resources and Environment of Viet Nam; Natural Resources and Environment Publisher: Ha Noi, Vietnam, 2013. (In Vietnamese) [Google Scholar]
  25. Bryant, D.; Burke, L.; McManus, J.; Spaulding, M. Reefs at Risk: A Map-Based Indicator of Threats to the World’s Coral Reefs; World Resources Institute: Washington, DC, USA, 1998. [Google Scholar]
  26. Hoegh-Guldberg, O. Climate change, coral bleaching and the future of the worldís coral reefs. Mar. Freshw. Res. 1999, 50, 839–866. [Google Scholar] [CrossRef]
  27. Aronson, R.B.; Precht, W.F.; MacIntyre, I.G.; Murdoch, T.J.T. Ecosystems: Coral bleach-out in Belize. Nature 2000, 405, 36. [Google Scholar] [CrossRef] [PubMed]
  28. Glynn, P.W. El Niño-Southern Oscillation mass mortalities of reef corals: A model of high temperature marine extinctions? In Organism-Environment Feedbacks in Carbonate Platforms and Reefs; Insalaco, E., Skelton, P., Palmer, T., Eds.; Geological Society Special Pub. No. 151; The Geological Society of London: London, UK, 2000; Volume 178, pp. 117–133. [Google Scholar]
  29. Wilkinson, C. Status of Coral Reefs of the World 2008; Australian Institute of Marine Science: Townsville, Australia, 2008. [Google Scholar]
  30. Dipper, J.W.; Nguyen, K.V.; Hein, H.; Ohde, T.; Loick, N. Monsoon-induced upwelling off the Vietnamese coast. Ocean Dyn. 2007, 57, 46–62. [Google Scholar] [CrossRef]
  31. Nguyen, K.C.; Walsh, K.J.E. Interannual, decadal, and transient greenhouse simulation of tropical cyclone-like vortices in a regional climate model of the South Pacific. J. Clim. 2001, 14, 3043–3054. [Google Scholar] [CrossRef]
Figure 1. Marine hydrometeorological observation stations at the coasts and islands of Viet Nam.
Climate 05 00036 g001
Figure 2. Numbers of typhoons landed at Vietnamese coasts per year.
Climate 05 00036 g002
Table 1. Critical values of the Spearman rank correlation coefficient for confirming the existence of trend with 95% confidence level for sample size n for two-sided distribution [22].
n−2102030405060708090100
α = 0.050.6480.4470.3620.3130.2790.2550.2350.2200.2070.197
Table 2. Marine hydrometeorological observation stations at the coasts and islands of Viet Nam.
No.Name of the StationLatitudeLongitudeYears of Data Use for Air TemperatureYears of Data Use for Water TemperatureYears of Data Use for Sea Level
1Cua Ong21°01′107°21′1961–20121986–20121962–2012
2Co To20°59′107°46′1959–20121960–20121960–2012
3Bai Chay20°57′107°04′1961–20121962–20121962–2012
4Hon Dau20°40′106°48′1956–20121956–20121957–2012
5Bach Long Vi20°08′107°43′1960–20121998–20121998–2012
6Sam Son19°45′105°54′1961–1965; 1994–20121998–20121998–2012
7Hon Ngu18°48′105°46′1961–20121962–20122009–2012
8Con Co17°10′107°22′1975–20121993–20121980–2012
9Hue107°35′16°26′1961–1974; 1978–2012
10Son Tra16°06′108°13′1976–2012
11Phu Quy10°31′108°56′1979–20121980–20121980–2013
12Vung Tau10°20′107°04′1979–20121983–20121978–2012
13Truong Sa8°39′111°55′1977–1985; 1986–20121986–20121986–2012
14Con Dao8°41′106°36′1978–20121980–20121980–2012
15Phu Quoc10°13′103°58′1979–20121986–20121979–2012
Table 3. Results of trend evaluation for air temperature.
No.Name of the StationMann–Kendall TestSpearman Rank Correlation CoefficientTrend
ZTrendρTrend
1Cua Ong4.22Y0.54Y0.021 ± 0.016
2Co To3.13Y0.47Y0.017 ± 0.015
3Bai Chay4.81Y0.62Y0.022 ± 0.015
4Hon Dau5.33Y0.65Y0.025 ± 0.017
5Bach Long Vi4.61Y0.59Y0.025 ± 0.018
6Sam Son1.19N0.24N
7Hon Ngu−0.87N0.23N
8Con Co2.77Y0.20N
9Hue−4.18Y0.28Y−0.007 ± 0.005
10Son Tra3.26Y0.52Y0.017 ± 0.012
11Phu Quy1.50N0.42Y0.011 ± 0.009
12Vung Tau4.8Y0.78Y0.028 ± 0.012
13Truong Sa3.32Y0.53Y0.019 ± 0.010
14Con Dao3.91Y0.66Y0.020 ± 0.010
15Phu Quoc3.29Y0.50Y0.015 ± 0.010
Table 4. Results of trend evaluation for sea water temperature.
No.Name of the StationMann–Kendall TestSpearman Rank Correlation CoefficientTrend
ZTrendρTrend
1Cua Ong2.84Y0.49Y0.025 ± 0.003
2Co To2.62Y0.36Y0.011 ± 0.013
3Bai Chay−0.30N0.15N
4Hon Dau2.58Y0.36Y0.010 ± 0.012
5Bach Long Vi
6Sam Son0.16N
7Hon Ngu2.75Y0.22N0.016 ± 0.013
8Con Co0.42N0.11N
9Hue
10Son Tra
11Phu Quy0.39N0.05N
12Vung Tau1.00N0.07N
13Truong Sa1.54N0.30
14Con Dao0.34N0.12
15Phu Quoc2.96Y0.53Y0.18 ± 0.11
Table 5. Results of trend evaluation for sea water level.
No.Name of the StationMann–Kendall TestSpearman Rank Correlation CoefficientTrend (cm/year)
ZTrendρTrend
1Cua Ong6.70Y0.87Y0.527 ± 0.256
2Co To−4.10Y0.59Y−0.152 ± 0.107
3Bai Chay3.49Y0.41Y0.207 ± 0.207
4Hon Dau6.37Y0.74Y0.378 ± 0.221
5Bach Long Vi0.20N0.10N
6Sam Son3.17Y0.69Y0.415 ± 0.252
7Hon Ngu
8Con Co0.00N0.012N
9Hue
10Son Tra
11Phu Quy4.29Y0.64Y0.357 ± 0.187
12Vung Tau3.32Y0.59Y0.368 ± 0.211
13Truong Sa
14Con Dao3.18Y0.56Y0.252 ± 0.149
15Phu Quoc2.76Y0.41Y0.244 ± 0.201

