
Climate Change Impacts on the Hydrological Processes of a Small Agricultural Watershed


Abstract
:1. Introduction
2. Material and Methods
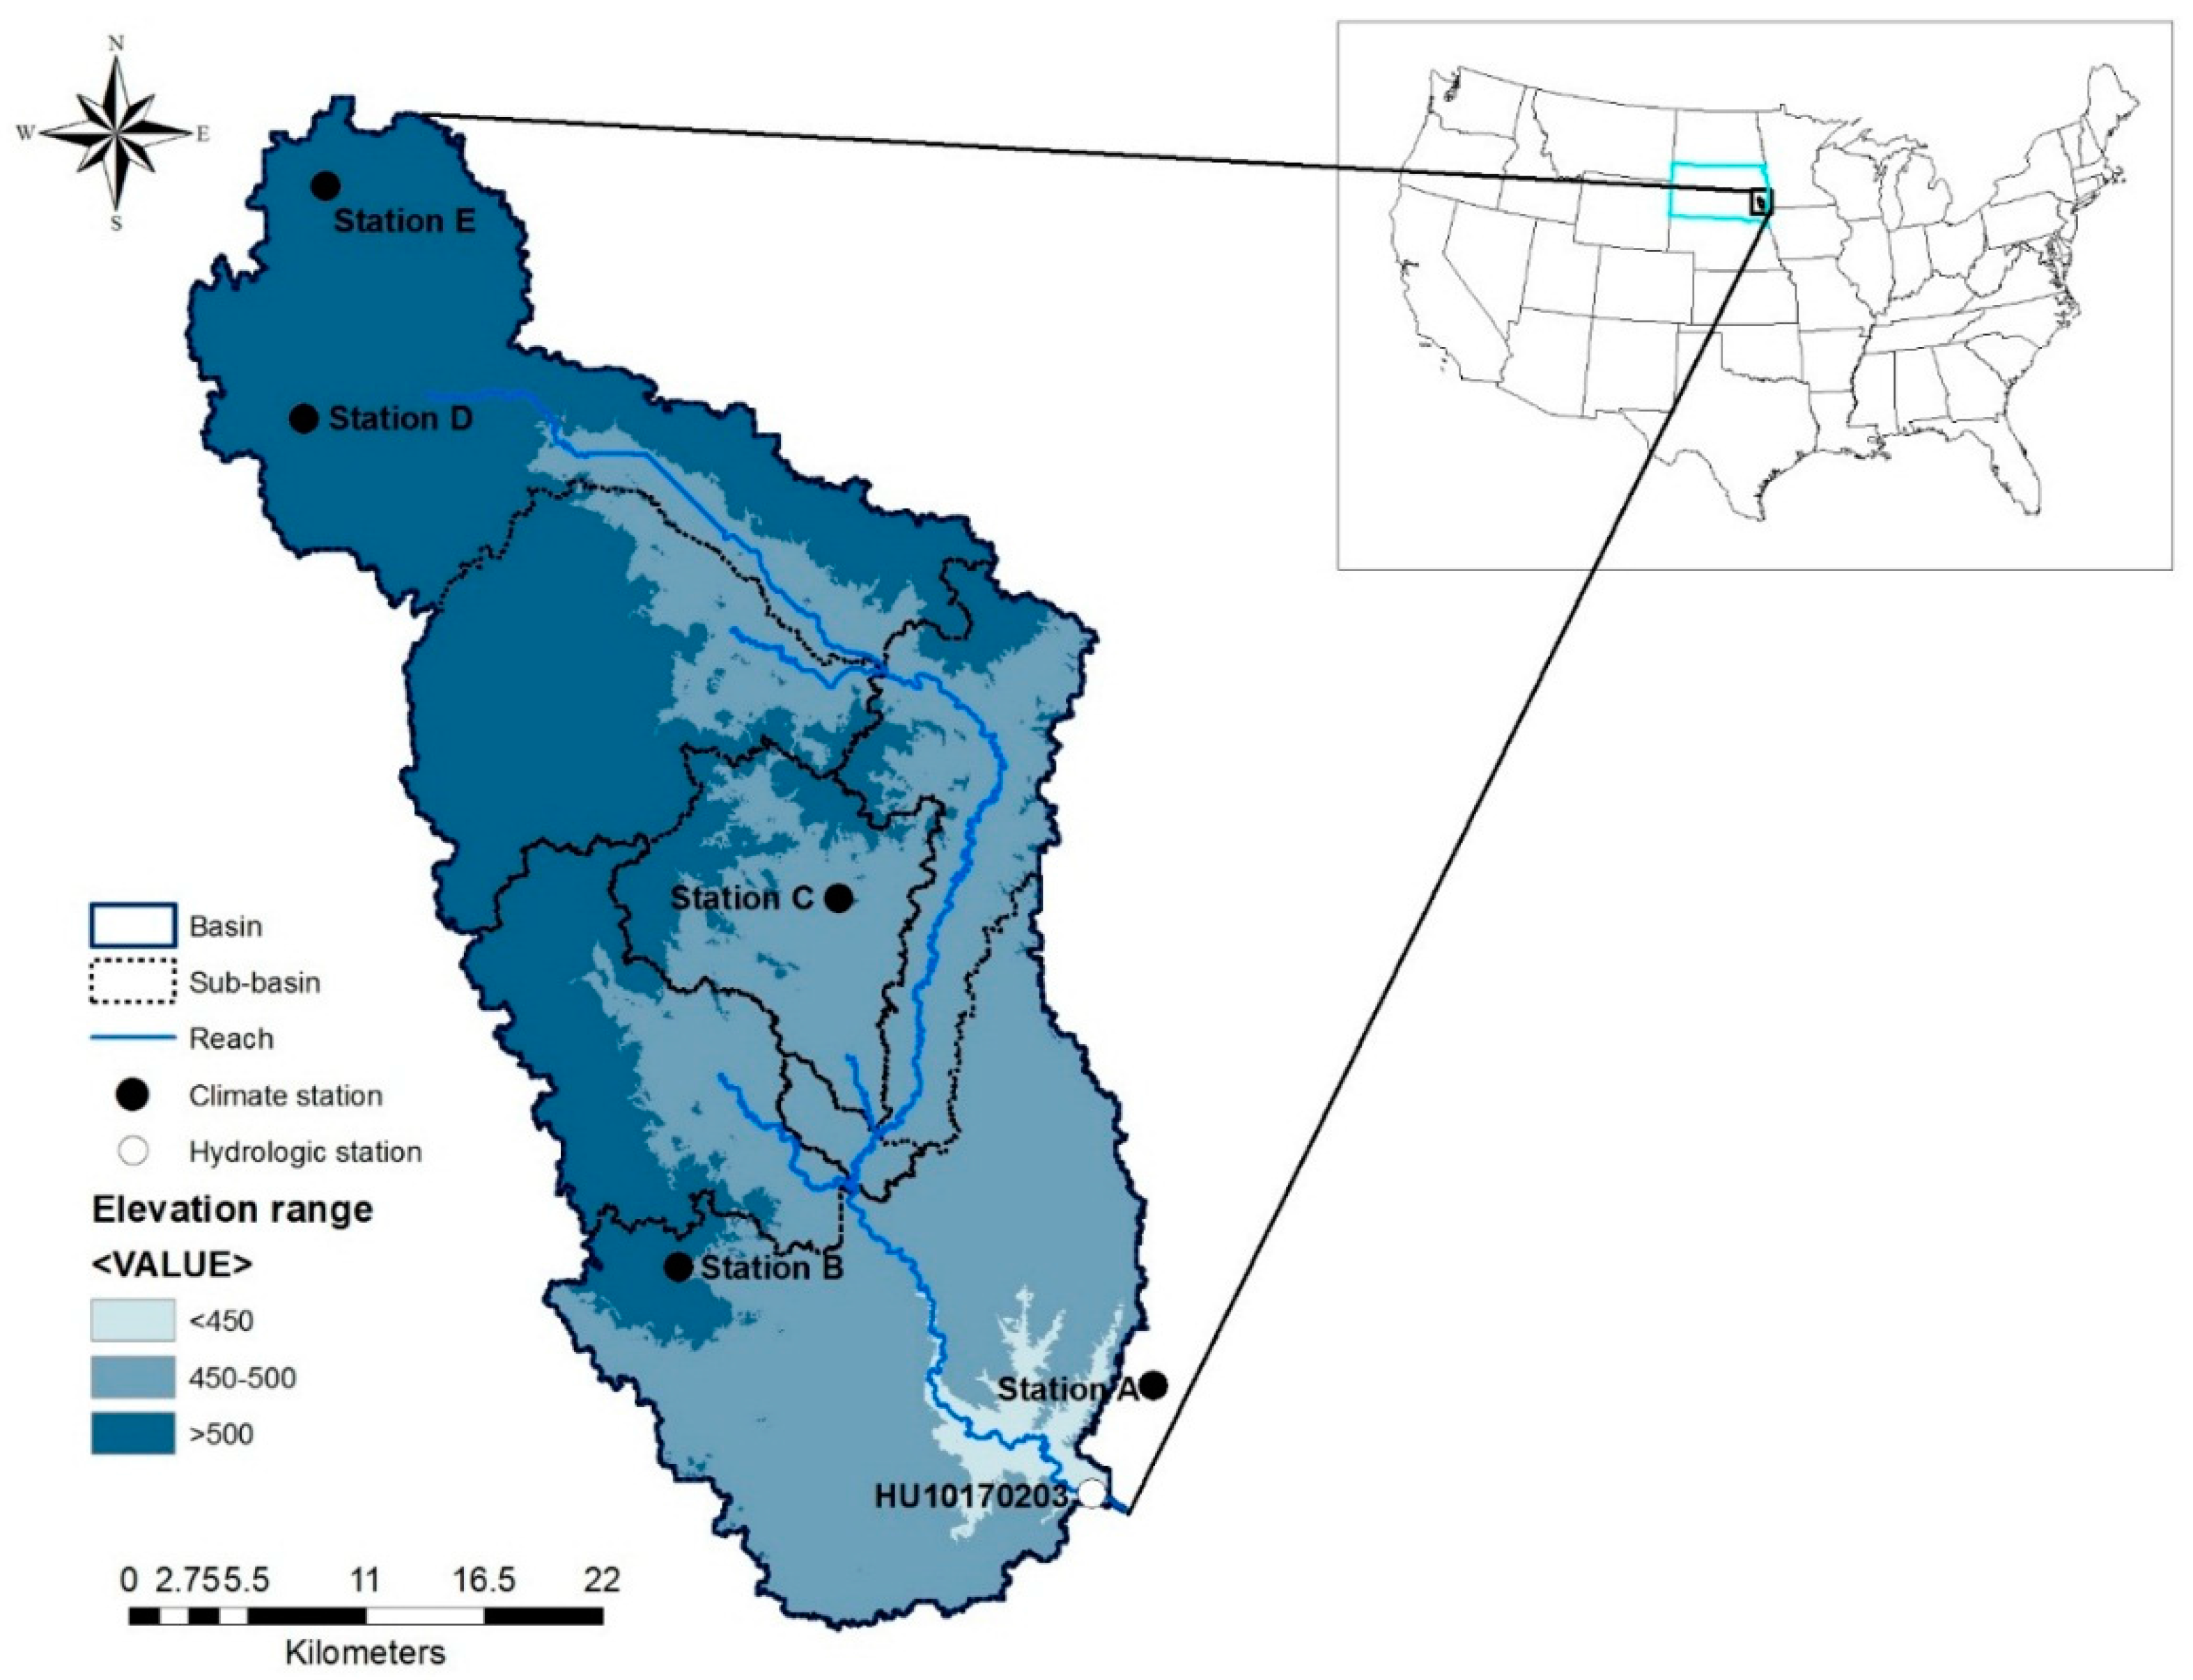
2.1. Study Site
2.2. SWAT (Soil Water Assessment Tool) Model
2.3. Input Data and Model Set Up
2.3.1. Topography, Soil, and Land Use Data
2.3.2. Weather Data
2.3.3. Observed Stream Flow
2.4. Model Set up for Calibration and Validation
2.5. Projected Climate Change Scenarios
3. Results
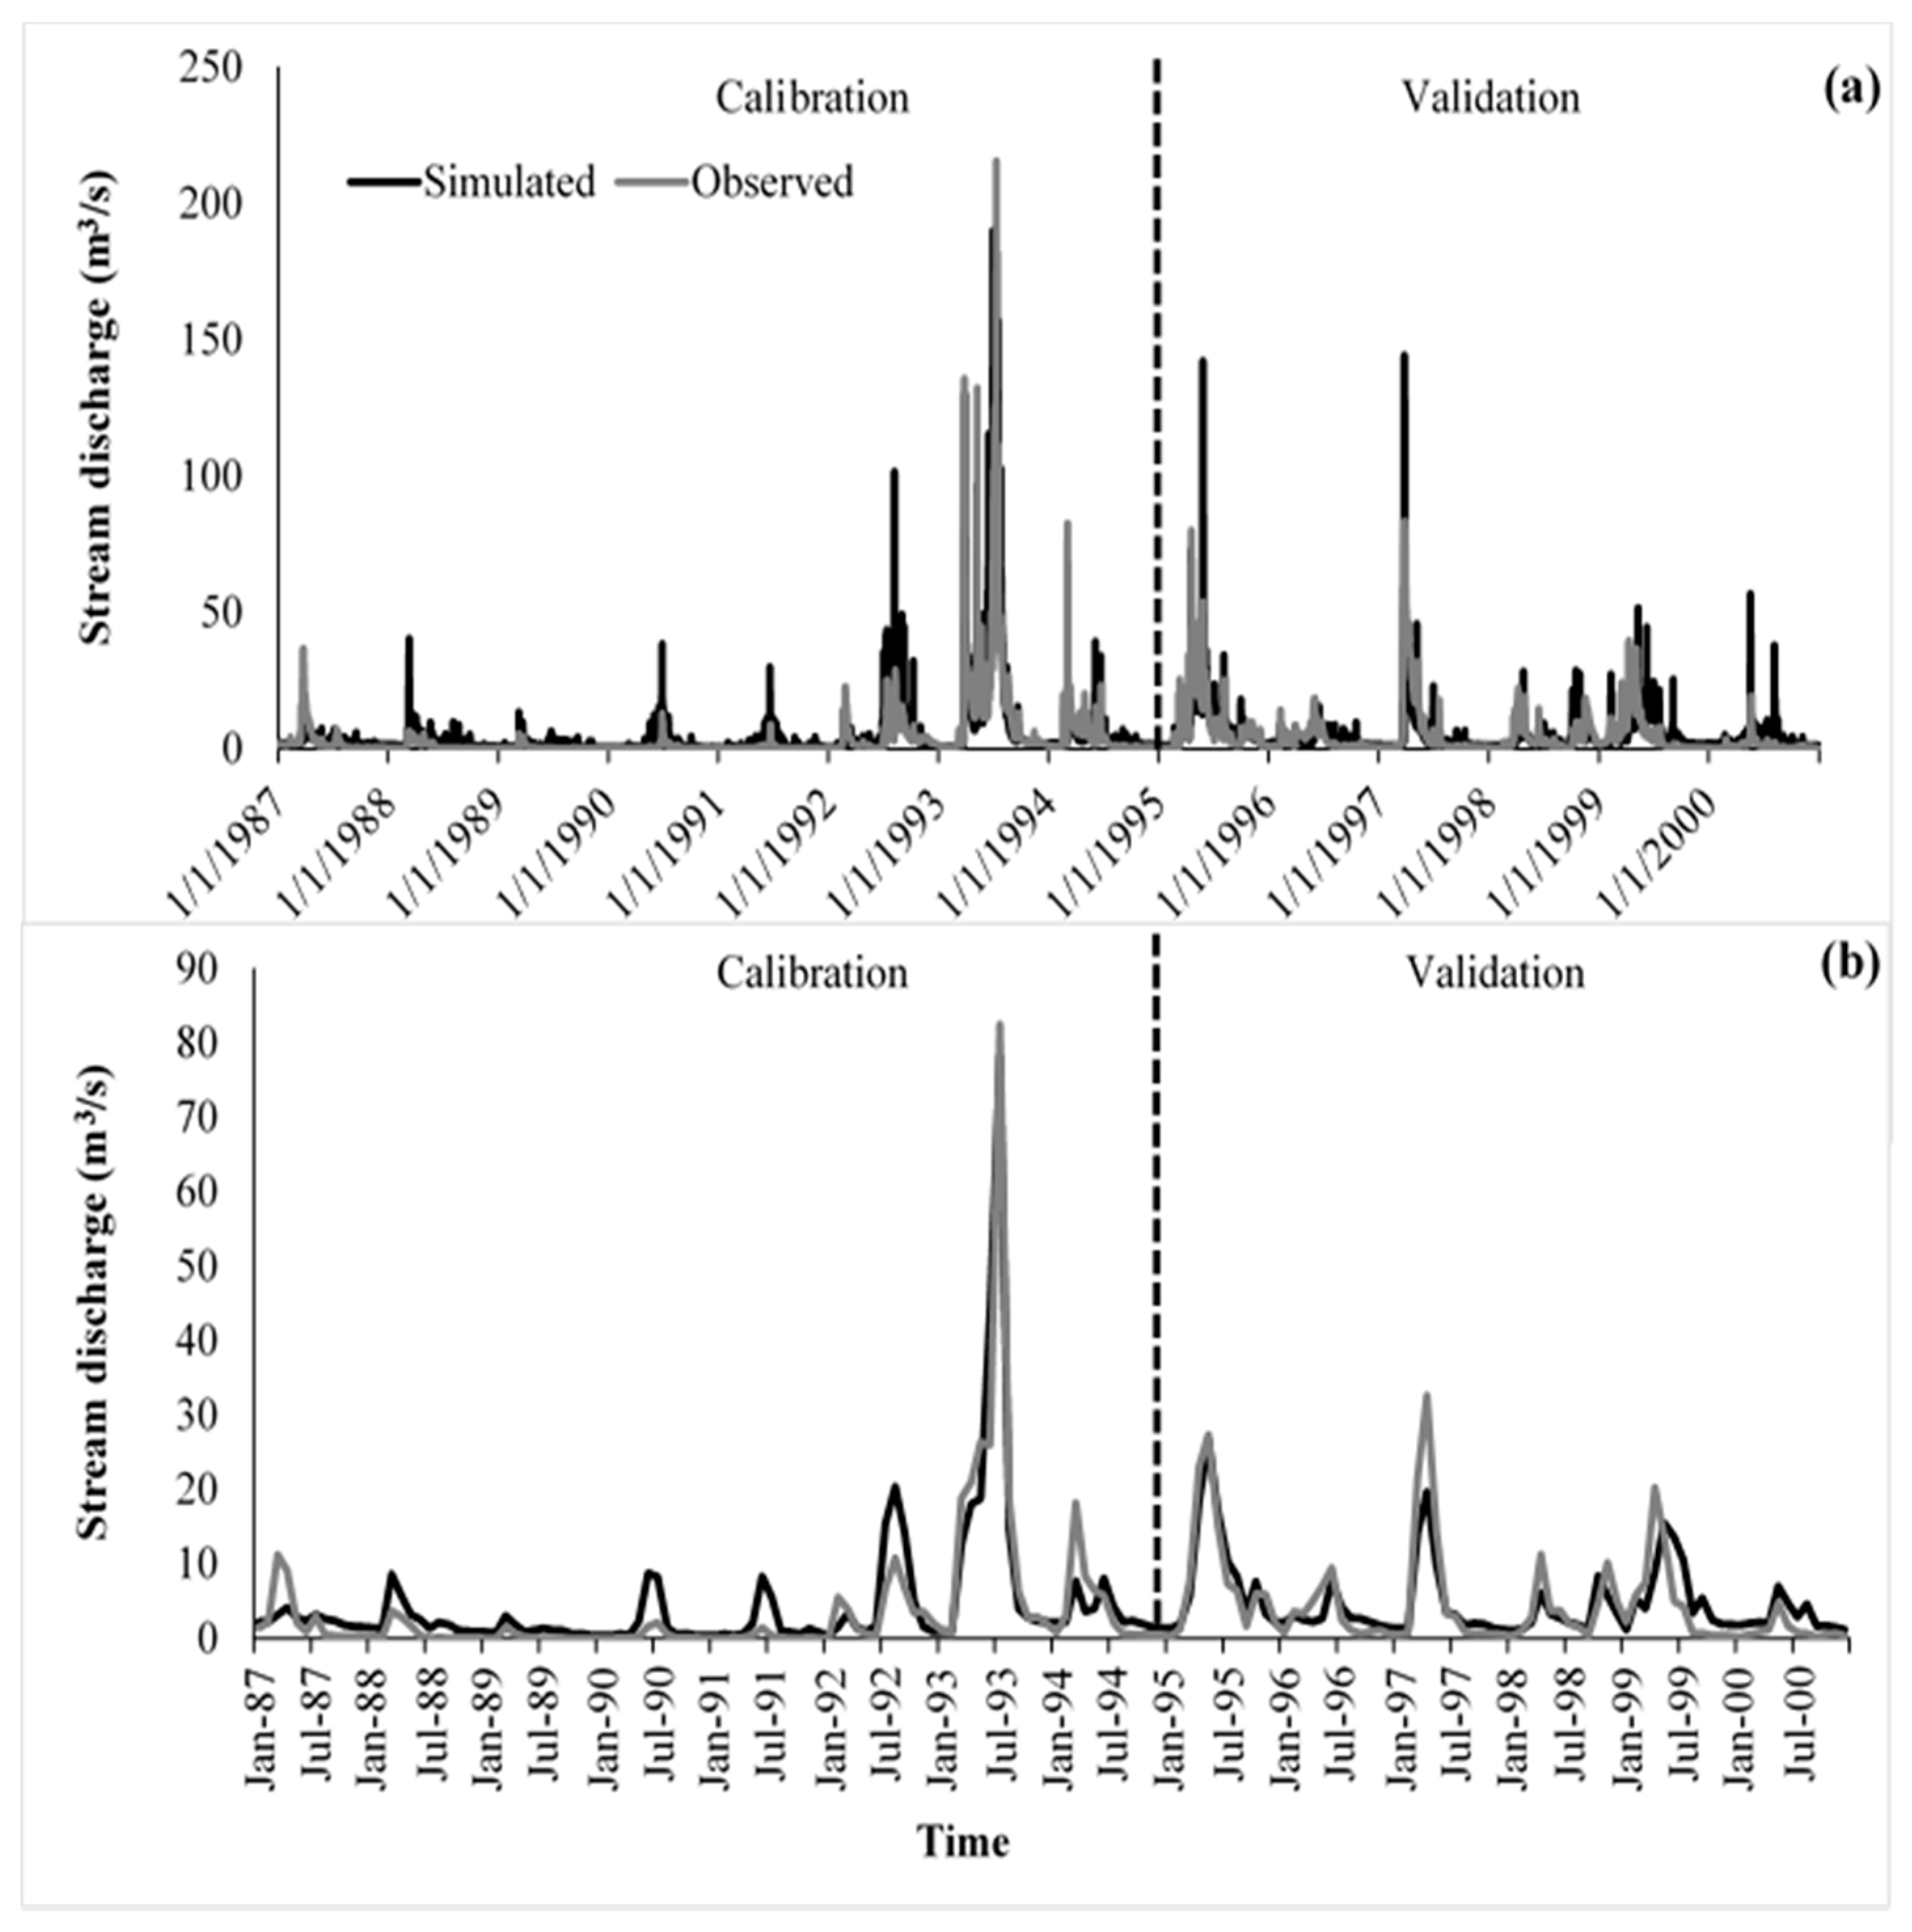
3.1. SWAT Model Calibration and Validation
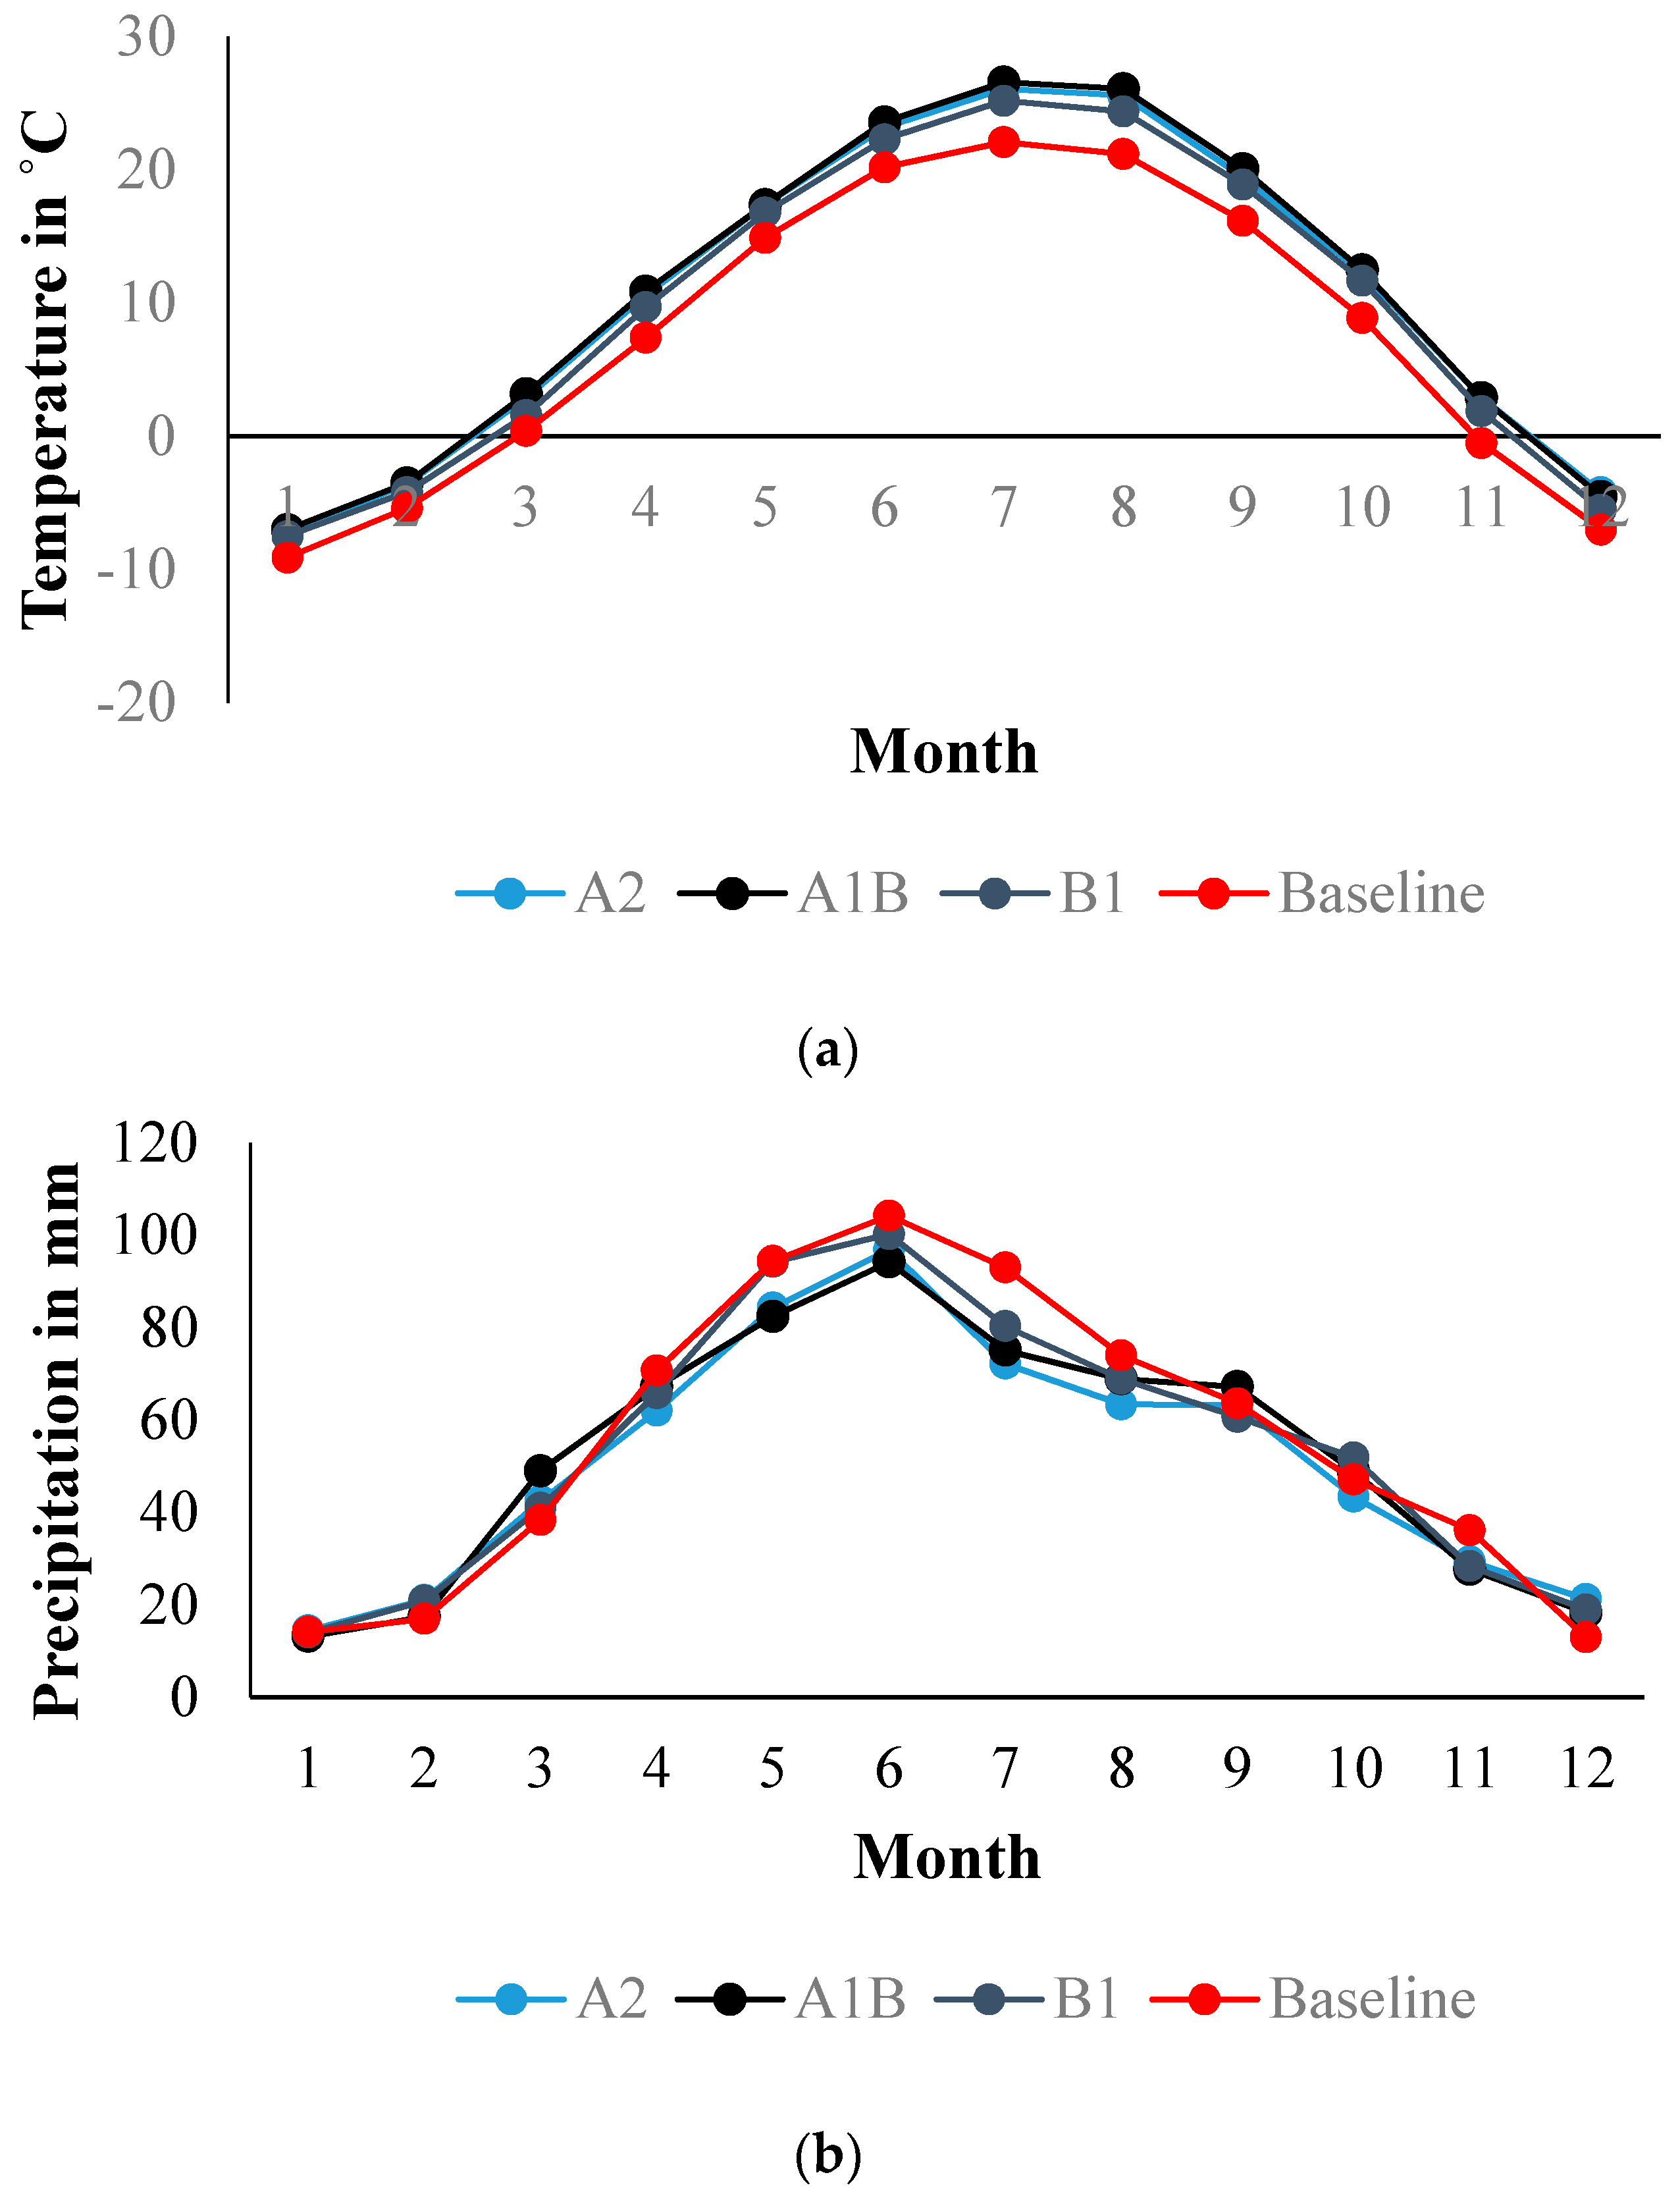
3.2. Projected Climate Condition
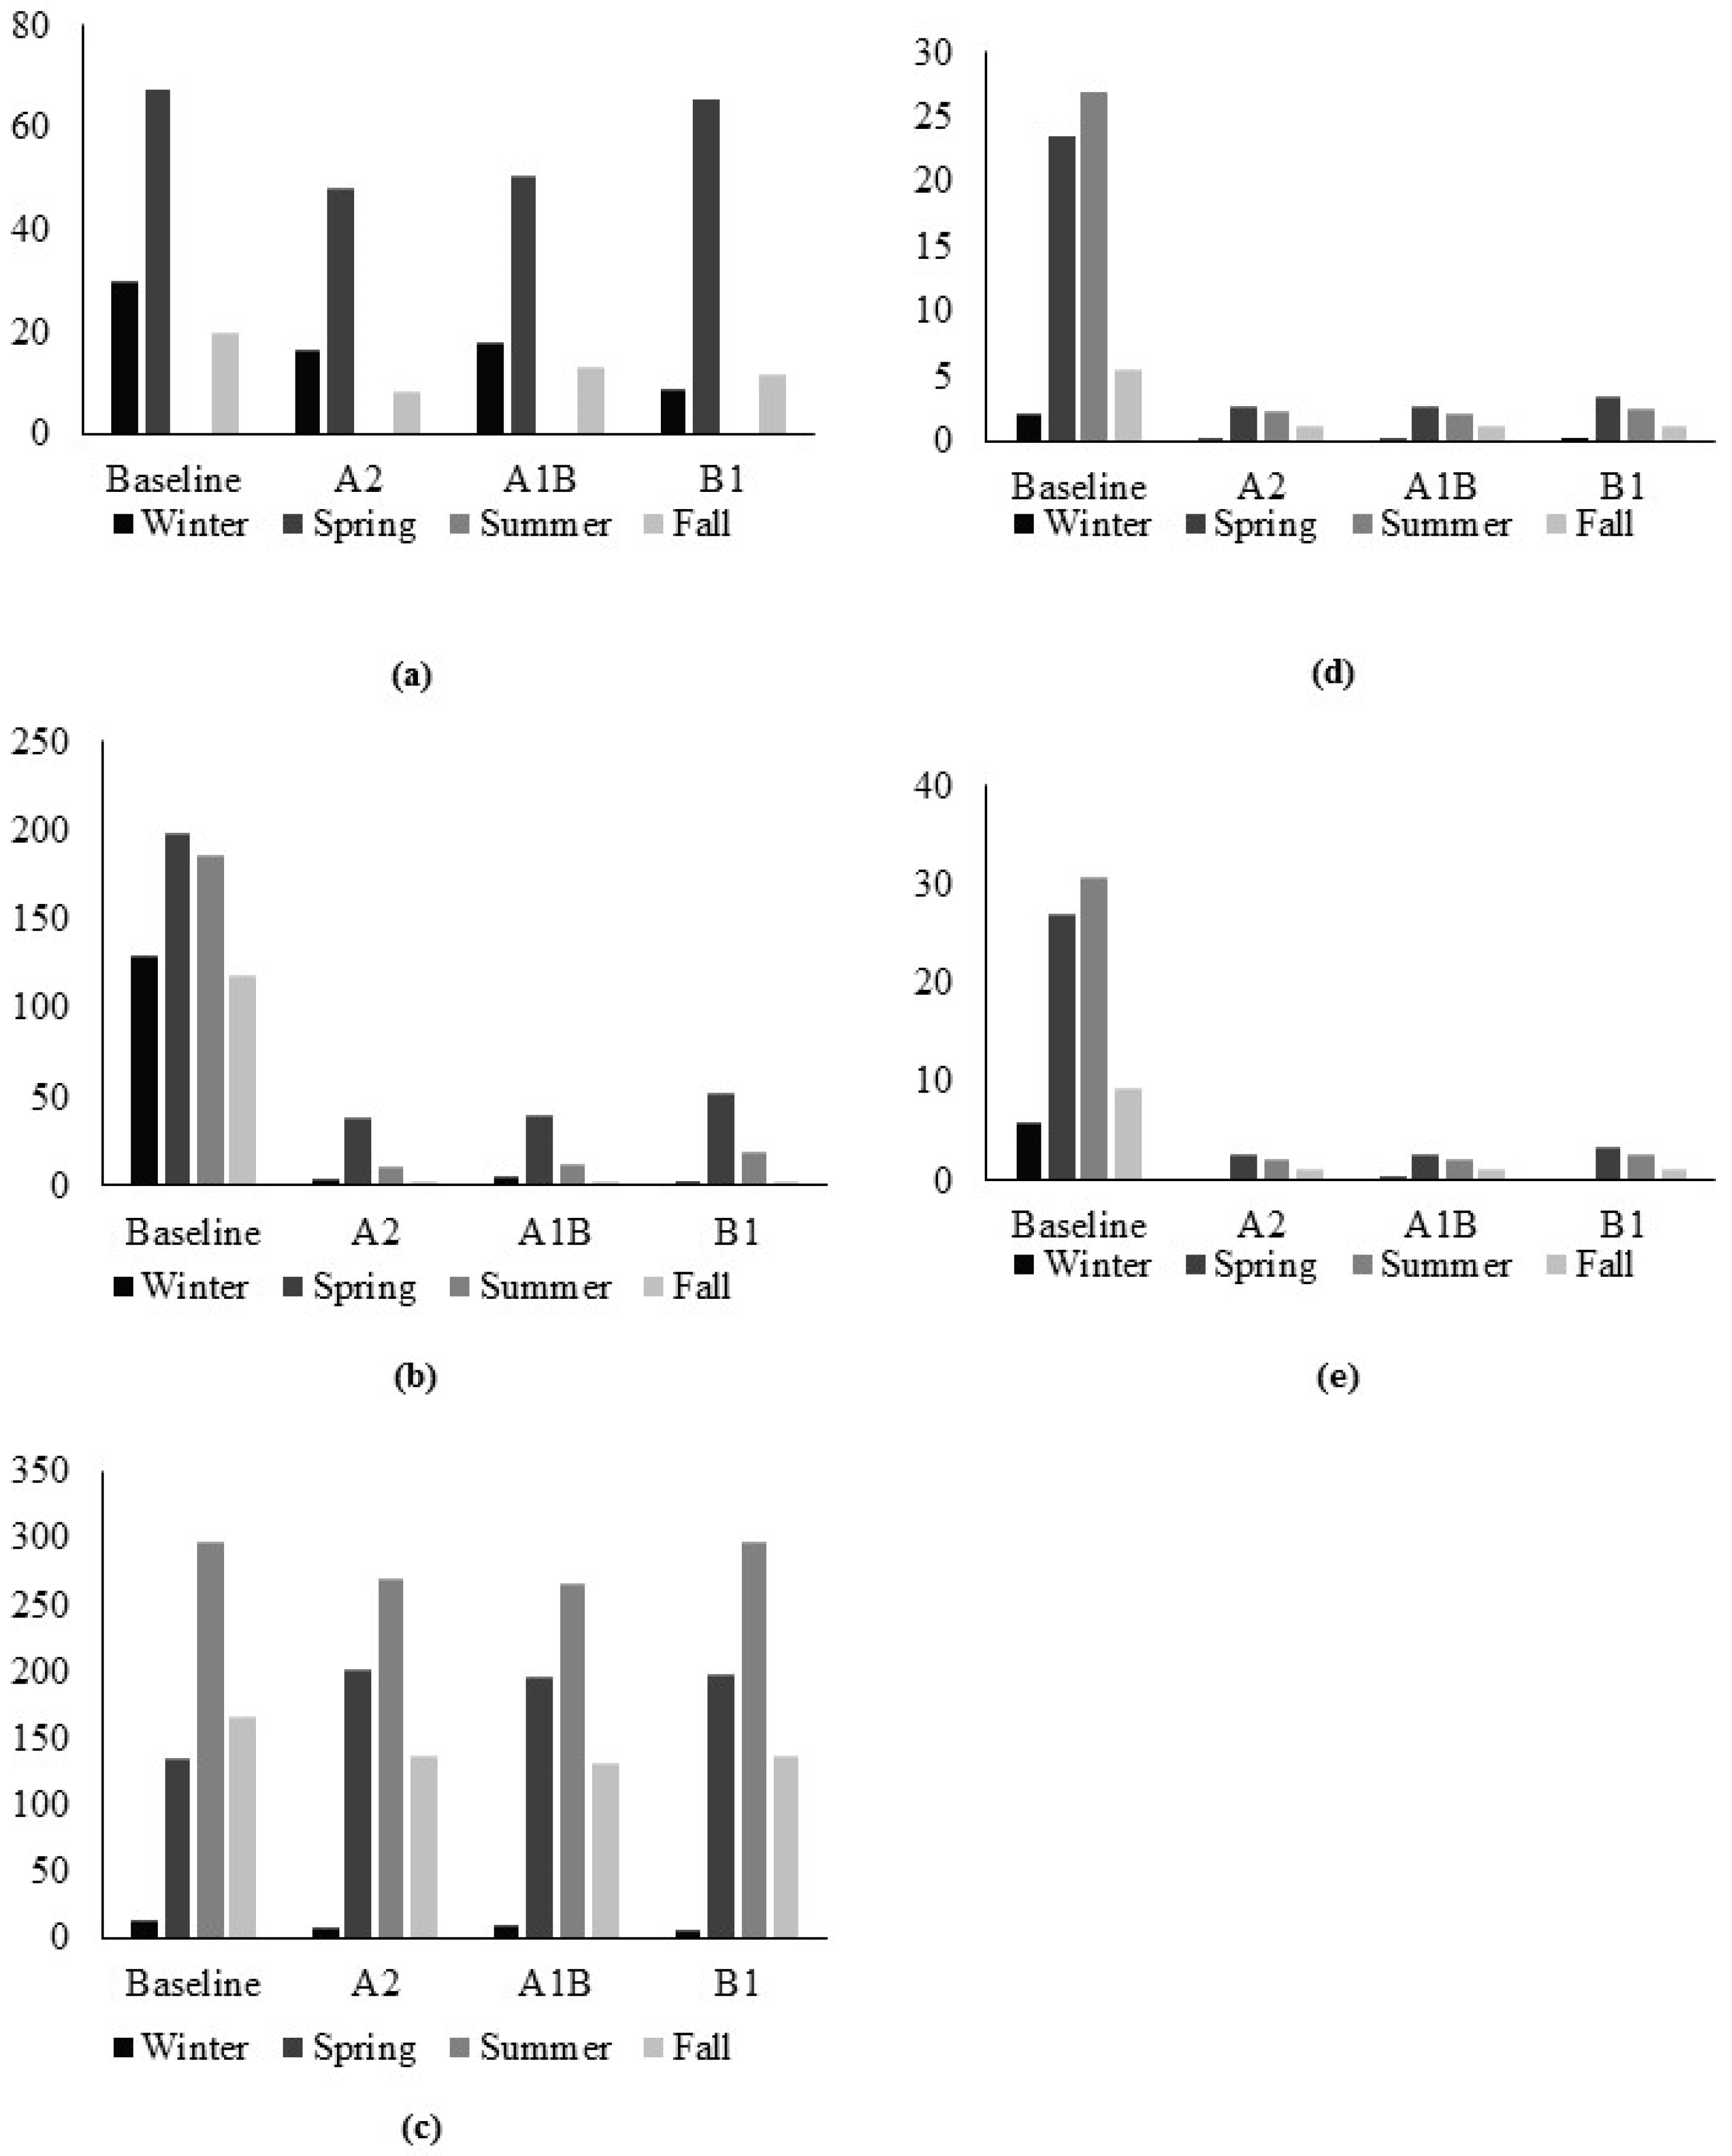
3.3. Climate Change Impact on Hydrologic Processes
3.3.1. Snow Melt
3.3.2. Soil Water (SW) Storage
3.3.3. Actual Evapotranspiration (AET)
3.3.4. Surface Run-Off (SURQ)
3.3.5. Water Yield
4. Discussion
5. Conclusions
Acknowledgments
Author Contributions
Conflicts of Interest
Appendix A

| SRES Scenarios | Month | Annual | |||||||||||
|---|---|---|---|---|---|---|---|---|---|---|---|---|---|
| (a) | |||||||||||||
| January | February | March | April | May | June | July | August | September | October | November | December | ||
| A2 | 1.7 | 1.8 | 2.5 | 3.2 | 2.5 | 3.0 | 4.0 | 4.4 | 3.3 | 3.4 | 3.5 | 2.8 | 3.0 |
| A1B | 2.1 | 2.0 | 2.9 | 3.5 | 2.5 | 3.4 | 4.5 | 4.9 | 3.9 | 3.6 | 3.4 | 2.5 | 3.3 |
| B1 | 1.5 | 1.2 | 1.2 | 2.3 | 1.9 | 2.1 | 3.1 | 3.2 | 2.7 | 2.8 | 2.4 | 1.6 | 2.2 |
| (b) | |||||||||||||
| January | February | March | April | May | June | July | August | September | October | November | December | ||
| A2 | −6.7 | 3.0 | 27.7 | −4.8 | −12.7 | −9.5 | −19.3 | −6.7 | 2.6 | 3.9 | −23.5 | 41.4 | −5.7 |
| A1B | 2.3 | 24.6 | 10.8 | −12.3 | −10.8 | −7.1 | −22.4 | −14.2 | −3.5 | −7.7 | −18.8 | 64.1 | −8.0 |
| B1 | −1.6 | 23.0 | 6.6 | −6.9 | −0.3 | −3.8 | −13.7 | −6.8 | −7.5 | 10.2 | −21.7 | 46.3 | −3.4 |
| Season | Special Report on Emission Scenarios, SRES, IPCC 2007, CMIP 3 | ||
|---|---|---|---|
| (a) | |||
| A2 | A1B | B1 | |
| Winter (DJF) | −29.5 | −30.5 | −19.9 |
| Spring (MAM) | 36.3 | 39.4 | 23.7 |
| Summer (JJA) | 18.1 | 20.2 | 13.3 |
| Fall (SON) | 41.3 | 44.2 | 32.2 |
| (b) | |||
| A2 | A1B | B1 | |
| Winter (DJF) | 11.2 | 29.0 | 22.0 |
| Spring (MAM) | −2.3 | −7.2 | −1.3 |
| Summer (JJA) | −12.1 | −14.3 | −8.0 |
| Fall (SON) | −3.4 | −8.6 | −5.4 |
| SRES Scenarios | Month | Annual | |||||||||||
|---|---|---|---|---|---|---|---|---|---|---|---|---|---|
| (e) | Snowmelt | ||||||||||||
| January | February | March | April | May | June | July | August | September | October | November | December | ||
| A2 | −100.00 | −25.2 | 9.39 | −100.00 | −100.00 | 0.00 | 0.00 | 0.00 | 0.00 | −100.00 | −42.28 | −58.64 | −43.06 |
| A1B | −73.55 | −25.97 | 13.87 | −100.00 | −100.00 | 0.00 | 0.00 | 0.00 | 0.00 | −100.00 | −8.80 | −57.29 | −37.64 |
| B1 | −62.57 | −73.60 | 44.58 | −92.55 | −100.00 | 0.00 | 0.00 | 0.00 | 0.00 | −100.00 | −17.26 | −67.90 | −39.11 |
| (b) | Soil Water (SW) | ||||||||||||
| January | February | March | April | May | June | July | August | September | October | November | December | ||
| A2 | −100.00 | −91.47 | −76.41 | −81.18 | −82.95 | −87.72 | −97.07 | −98.85 | −97.91 | −97.53 | −98.67 | −99.93 | −92.47 |
| A1B | −98.98 | −90.91 | −76.01 | −81.15 | −82.12 | −86.15 | −97.62 | −98.99 | −98.11 | −98.40 | −97.98 | −99.38 | −92.15 |
| B1 | −98.76 | −96.48 | −69.27 | −75.08 | −75.16 | −79.96 | −93.38 | −98.47 | −98.17 | −95.91 | −99.32 | −99.90 | −89.99 |
| (c) | Actual Evapotranspiration (AET) | ||||||||||||
| January | February | March | April | May | June | July | August | September | October | November | December | ||
| A2 | −96.20 | −15.92 | 140.02 | 60.75 | 14.62 | 19.83 | −13.94 | −30.35 | −33.71 | −6.60 | 34.92 | −38.86 | 2.96 |
| A1B | −69.09 | −21.67 | 140.46 | 49.89 | 14.85 | 22.11 | −13.21 | −35.56 | −35.32 | −16.11 | 36.53 | −35.14 | 3.14 |
| B1 | −62.04 | −57.37 | 74.17 | 65.00 | 25.21 | 26.83 | −0.09 | −23.57 | −37.03 | −5.05 | 41.17 | −60.20 | −1.08 |
| (d) | Surface Run Off (SURQ) | ||||||||||||
| January | February | March | April | May | June | July | August | September | October | November | December | ||
| A2 | −100.00 | −86.14 | −87.05 | −87.10 | −90.85 | −89.74 | −94.42 | −88.91 | −78.98 | −72.05 | −84.55 | −84.31 | −87.00 |
| A1B | −79.68 | −84.49 | −86.69 | −89.49 | −90.11 | −88.68 | −95.27 | −89.90 | −80.35 | −79.72 | −75.85 | −78.29 | −84.87 |
| B1 | −70.41 | −96.64 | −83.11 | −86.21 | −87.37 | −87.43 | −93.36 | −88.87 | −81.23 | −65.83 | −83.11 | −79.92 | −83.46 |
| (f) | Water Yield (WYLD) | ||||||||||||
| January | February | March | April | May | June | July | August | September | October | November | December | ||
| A2 | −99.82 | −91.18 | −88.41 | −89.40 | −91.81 | −90.75 | −94.95 | −91.27 | −85.35 | −84.17 | −93.77 | −98.26 | −91.60 |
| A1B | −97.65 | −90.15 | −88.09 | −91.35 | −91.15 | −89.79 | −95.72 | −92.04 | −86.31 | −88.49 | −90.32 | −97.66 | −91.56 |
| B1 | −96.65 | −96.55 | −84.88 | −88.68 | −88.71 | −88.68 | −94.00 | −91.23 | −86.91 | −80.67 | −93.19 | −97.82 | −90.67 |
| Season | Special Report on Emission Scenarios, SRES, IPCC 2007, CMIP 3 | ||
|---|---|---|---|
| (a) | Snowmelt | ||
| A2 | A1B | B1 | |
| Winter (DJF) | −44.94 | −40.53 | −70.53 |
| Spring (MAM) | −27.90 | −24.95 | −2.46 |
| Summer (JJA) | 0.00 | 0.00 | 0.00 |
| Fall (SON) | −57.50 | −32.85 | −39.08 |
| (b) | Soil Water (SW) | ||
| A2 | A1B | B1 | |
| Winter (DJF) | −96.83 | −96.12 | −98.26 |
| Spring (MAM) | −80.39 | −79.96 | −73.37 |
| Summer (JJA) | −93.98 | −93.60 | −89.65 |
| Fall (SON) | −98.04 | −98.16 | −97.81 |
| (c) | Actual Evapotranspiration (AET) | ||
| A2 | A1B | B1 | |
| Winter (DJF) | −36.94 | −34.05 | −59.32 |
| Spring (MAM) | 48..29 | 44.70 | 45.16 |
| Summer (JJA) | −9.80 | −10.66 | −0.35 |
| Fall (SON) | −17.57 | −21.26 | −18.31 |
| (d) | Surface Run Off (SURQ) | ||
| A2 | A1B | B1 | |
| Winter (DJF) | −87.02 | −83.77 | −92.03 |
| Spring (MAM) | −88.55 | −88.60 | −85.41 |
| Summer (JJA) | −91.60 | −91.74 | −90.25 |
| Fall (SON) | −77.64 | −79.50 | −76.72 |
| (e) | Water Yield (WYLD) | ||
| A2 | A1B | B1 | |
| Winter (DJF) | −94.97 | −93.75 | −96.87 |
| Spring (MAM) | −89.94 | −89.98 | −87.19 |
| Summer (JJA) | −92.62 | −92.73 | −91.43 |
| Fall (SON) | −86.79 | −87.88 | −86.25 |
| SRES Scenarios | Month | Annual | |||||||||||
|---|---|---|---|---|---|---|---|---|---|---|---|---|---|
| (a) | |||||||||||||
| January | February | March | April | May | June | July | August | September | October | November | December | ||
| Baseline | −9.1 | −5.4 | 0.4 | 7.4 | 14.9 | 20.2 | 22.1 | 21.2 | 16.2 | 8.9 | −0.5 | −7.0 | 7.4 |
| A2 | −7.3 | −3.6 | 2.9 | 10.6 | 17.4 | 23.2 | 26.1 | 25.6 | 19.5 | 12.3 | 2.9 | −4.2 | 10.4 |
| A1B | −7.0 | −3.5 | 3.2 | 10.9 | 17.4 | 23.6 | 26.5 | 26.1 | 20.1 | 12.5 | 2.9 | −4.5 | 10.7 |
| B1 | −7.6 | −4.2 | 1.59 | 9.7 | 16.8 | 22.3 | 25.2 | 24.4 | 18.9 | 11.7 | 1.9 | −5.5 | 9.6 |
| (b) | |||||||||||||
| January | February | March | April | May | June | July | August | September | October | November | December | ||
| Basline | 14.2 | 17.0 | 38.4 | 70.7 | 94.4 | 104.2 | 93.0 | 73.9 | 65.6 | 47.1 | 36.2 | 13.0 | 667.6 |
| A2 | 13.2 | 17.5 | 49.0 | 67.2 | 82.4 | 94.2 | 75.1 | 69.0 | 67.2 | 48.9 | 27.7 | 18.3 | 629.8 |
| A1B | 14.5 | 21.1 | 42.5 | 62.0 | 84.2 | 96.8 | 72.2 | 63.4 | 63.3 | 43.4 | 29.4 | 21.4 | 614.1 |
| B1 | 14.0 | 20.9 | 41.0 | 65.8 | 94.2 | 100.2 | 80.3 | 68.9 | 60.7 | 51.8 | 28.4 | 19.0 | 645 |
| Season | Special Report on Emission Scenarios, SRES, IPCC 2007, CMIP 3 | |||
|---|---|---|---|---|
| (a) | ||||
| Baseline | A2 | A1B | B1 | |
| Winter (DJF) | −21.5 | −15.2 | −15.0 | −17.3 |
| Spring (MAM) | 22.7 | 30.9 | 31.6 | 28.1 |
| Summer (JJA) | 63.4 | 74.9 | 76.3 | 71.9 |
| Fall (SON) | 24.6 | 34.8 | 35.5 | 32.5 |
| (b) | ||||
| Baseline | A2 | A1B | B1 | |
| Winter (DJF) | 44.1 | 49.0 | 56.9 | 53.8 |
| Spring (MAM) | 203.5 | 198.7 | 188.8 | 200.9 |
| Summer (JJA) | 271.1 | 238.2 | 232.3 | 249.4 |
| Fall (SON) | 148.8 | 143.9 | 136.1 | 140.9 |
| Absolute Magnitudes | Relative Percentage Change | |||||
|---|---|---|---|---|---|---|
| Snowmelt | B1 | BasePcpB1 | Basetmp1 | B1 | BasePcpB1 | Basetmp1 |
| Winter | 8.9 | 1.0 | 30.6 | −70.5 | −96.7 | 1.6 |
| Spring | 65.6 | 78.9 | 70.3 | −2.5 | 17.4 | 4.6 |
| Summer | 0.0 | 0.0 | 0.0 | 0.0 | 0.0 | 0.0 |
| Fall | 12.0 | 12.6 | 21.2 | −39.1 | −36.2 | 7.7 |
| AET | B1 | BasePcpB1 | Basetmp1 | B1 | BasePcpB1 | Basetmp1 |
| Winter | 5.8 | 5.1 | 13.8 | −59.3 | −63.9 | −3.0 |
| Spring | 196.9 | 144.4 | 134.1 | 45.2 | 6.4 | −1.1 |
| Summer | 296.8 | 328.6 | 299.5 | −0.4 | 10.3 | 0.5 |
| Fall | 136.1 | 168.3 | 168.2 | −18.3 | 1.0 | 1.0 |
| WYLD | B1 | BasePcpB1 | Basetmp1 | B1 | BasePcpB1 | Basetmp1 |
| Winter | 0.2 | 1.5 | 5.5 | −96.9 | −73.7 | −5.6 |
| Spring | 3.5 | 12.5 | 26.0 | −87.2 | −53.6 | −3.5 |
| Summer | 2.6 | 18.6 | 29.7 | −91.4 | −39.4 | −3.2 |
| Fall | 1.3 | 5.9 | 8.8 | −86.2 | −36.8 | −5.7 |
| SW | B1 | BasePcpB1 | Basetmp1 | B1 | BasePcpB1 | Basetmp1 |
| Winter | 6.8 | 240.5 | 407.0 | −98.3 | −38.1 | 4.7 |
| Spring | 158.2 | 525.8 | 622.3 | −73.4 | −11.5 | 4.7 |
| Summer | 57.8 | 442.0 | 573.8 | −89.7 | −20.9 | 2.8 |
| Fall | 7.8 | 228.1 | 369.8 | −97.8 | −35.7 | 4.2 |
| SURQ | B1 | BasePcpB1 | Basetmp1 | B1 | BasePcpB1 | Basetmp1 |
| Winter | 0.2 | 0.0 | 2.1 | −92.0 | −99.6 | −3.3 |
| Spring | 3.4 | 11.1 | 22.9 | −85.4 | −53.1 | −2.9 |
| Summer | 2.6 | 17.0 | 26.1 | −90.2 | −36.7 | −3.0 |
| Fall | 1.3 | 4.3 | 5.1 | −76.7 | −21.2 | −6.4 |
| Absolute Values | Relative Percentage Change | |||||
|---|---|---|---|---|---|---|
| B1 | BasePcpB1 | Basetmp1 | B1 | BasePcpB1 | Basetmp1 | |
| Snow Melt | 84.5 | 92.5 | 117.2 | −27.8 | −21.0 | 0.1 |
| AET | 634.9 | 646.0 | 614.0 | 3.4 | 5.2 | 0.0 |
| WYLD | 7.5 | 38.0 | 68.7 | −89.7 | −47.8 | −5.7 |
| Soil Water Storage | 229.0 | 1351.4 | 1835.8 | −87.9 | −28.7 | −3.2 |
| SURQ | 7.5 | 32.4 | 56.1 | −87.2 | −44.3 | −3.5 |
References
- Narsimlu, B.; Gosain, A.K.; Chahar, B.R. Assessment of future climate change impacts on water resources of upper Sind River basin, India using SWAT model. Water Resour. Manag. 2013, 27, 3647–3662. [Google Scholar] [CrossRef]
- Ashraf, V.S.; Mousavi, S.J.; Abbaspour, K.C.; Srinivasan, R.; Yang, H. Analyses of the impact of climate change on water resources components, drought and wheat yield in semiarid regions: Karkheh River basin in Iran. Hydrol. Pro. 2014, 28, 2018–2032. [Google Scholar] [CrossRef]
- Coulibaly, P.; Dibike, Y.B. Downscaling of Global Climate Model Outputs for Flood Frequency Analysis in the Saguenay River System; Canadian Climate Change Action Fund, Environment Canada: Hamilton, ON, Canada, 2004.
- Loukas, A.; Vasiliades, L.; Dalezios, N.R. Potential climate change impacts on flood producing mechanisms in southern British Columbia, Canada using the CGCMA1 simulation results. J. Hydrol. 2002, 259, 163–188. [Google Scholar] [CrossRef]
- Whitfield, P.H.; Cannon, A.J.; Reynolds, C.J. Modelling streamflow in present and future climates: Examples from the Georgia Basin, British Columbia. Can. Water Resour. J. 2002, 27, 427–456. [Google Scholar] [CrossRef]
- Cohen, S.; Kulkarni, T. Water Management and Climate Change in the Okanagan Basin; Environment Canada & University of British Columbia: Ottawa, ON, Canada, 2001.
- Cai, X.; Zeng, R.; Kang, W.H.; Song, J.; Valocchi, A.J. Strategic planning for drought mitigation under climate change. J. Water Resour. Plan. Manag. 2015. [Google Scholar] [CrossRef]
- Chattopadhyay, S.; Jha, M.K. Hydrological response due to projected climate variability in Haw River watershed, North Carolina. Hydrol. Sci. J. 2014. [Google Scholar] [CrossRef]
- MONDAL, A.; Mujumdar, P. Regional hydrological impacts of climate change: Implications for water management in India. In Proceedings of the International Association of Hydrological Sciences, Paris, France, 16–17 June 2014.
- Mango, L.M.; Melesse, A.M.; McClain, M.E.; Gann, D.; Setegen, S.G. Land use and climate change impacts on the hydrology of the upper Mara River Basin, Kenya: Results of a modeling study to support better resource management. Hydrol. Earth Syst. Sci. 2010, 15, 2245–2258. [Google Scholar] [CrossRef]
- Adem, A.A.; Tilahun, S.A.; Ayana, E.K.; Worqlul, A.W.; Assefa, T.T.; Dessu, S.B.; Melesse, A.M. Climate change impact on stream flow in the upper Gilgel Abay Catchment, Blue Nile Basin, Ethiopia. In Landscape Dynamics, Soils and Hydrological Processes in Varied Climates; Springer: Berlin/Heidelberg, Germany, 2016; pp. 645–673. [Google Scholar]
- Gosain, A.; Rao, S.; Basuray, D. Climate change impact assessment on hydrology of Indian river basins. Curr. Sci. 2006, 90, 346–353. [Google Scholar]
- Thomson, A.M.; Brown, R.A.; Rosenberg, N.J.; Izaurralde, R.C.; Legler, D.M.; Srinivasan, R. Simulated impacts of El Nino/southern oscillation on United States water resources. J. Am. Water Resour. Assoc. 2003. [Google Scholar] [CrossRef]
- Felzer, B.; Heard, P. Precipitation differences amongst GCMs used for the us national assessment. J. Am. Water Resour. Assoc. 1999. [Google Scholar] [CrossRef]
- Nijssen, B.; O’Donnell, G.M.; Hamlet, A.F.; Lettenmaier, D.P. Hydrologic sensitivity of global rivers to climate change. Clim. Chang. 2001, 50, 143–175. [Google Scholar] [CrossRef]
- Jin, G.; Shimizu, Y.; Onodera, S.; Saito, M.; Matsumori, K. Evaluation of drought impact on groundwater recharge rate using SWAT and Hydrus models on an agricultural island in western Japan. Proc. IAHS 2015, 371, 143–148. [Google Scholar] [CrossRef]
- Arnold, J.G.; Srinivasan, R.; Muttiah, R.S.; Williams, J.R. Large area hydrologic modeling and assessment Part I: Model development. J. Am. Water Resour. Assoc. 1998. [Google Scholar] [CrossRef]
- Arnold, J.G.; Srinivasan, R.; Neitsch, S.L.; Chris, G.; Abbaspour, C.; Gassman, P.W.; Fang, H.H.; van Griensven, A.; Debels, P.; Kim, N.W. Soil and Water Assessment Tool (Swat): Global Applications; Funny Publishing: Bangkok, Thailand, 2009; Volume 4, p. 415. [Google Scholar]
- CoLab. Colab: Project Integration—Change Control-Life Cycle Management; USDA Coolaborative Software Development Laboratory: Washinton, DC, USA, 2006.
- Fontaine, T.; Klassen, J.; Cruickshank, T.; Hotchkiss, R. Hydrological response to climate change in the Black Hills of South Dakota, USA. Hydrol. Sci. J. 2001, 46, 27–40. [Google Scholar] [CrossRef]
- Pervez, M.S.; Henebry, G.M. Assessing the impacts of climate and land use and land cover change on the freshwater availability in the Brahmaputra River basin. J. Hydrol. Reg. Stud. 2015, 3, 285–311. [Google Scholar] [CrossRef]
- Mosbahi, M.; Benabdallah, S.; Boussema, M.R. Assessment of soil erosion risk using SWAT model. Arab. J. Geosci. 2013, 6, 4011–4019. [Google Scholar] [CrossRef]
- Phomcha, P.; Wirojanagud, P.; Vangpaisal, T.; Thaveevouthti, T. Predicting sediment discharge in an agricultural watershed: A case study of the Lam Sonthi watershed, Thailand. Sci. Asia 2011, 37, 43–50. [Google Scholar] [CrossRef]
- Neupane, R.P.; Kumar, S. Estimating the effects of potential climate and land use changes on hydrologic processes of a large agriculture dominated watershed. J. Hydrol. 2015. [Google Scholar] [CrossRef]
- Neitsch, S.L.; Arnold, J.G.; Kiniry, J.R.; Williams, J.R. Soil and Water Assessment Tool Theoretical Documentation, version 2009; Texas Water Resources Institute: College Station, TX, USA, 2011. [Google Scholar]
- Mockus, V. National Engineering Handbook Section 4: Hydrology; United States Department of Agriculture: Washington, DC, USA, 1972.
- Shahidian, S.; Serralheiro, R.; Serrano, J.; Teixeira, J.; Haie, N.; Santos, F. Hargreaves and Other Reduced-Set Methods for Calculating Evapotranspiration; InTech: Princeton, NJ, USA, 2012. [Google Scholar]
- Jensen, M.E.; Haise, H.R. Estimating evapotranspiration from solar radiation. J. Irrig. Drain. Div. 1963, 89, 15–41. [Google Scholar]
- Wang, X.; Melesse, A.; Yang, W. Influences of potential evapotranspiration estimation methods on SWAT’s hydrologic simulation in a northwestern Minnesota watershed. Trans. ASAE 2006, 49, 1755–1771. [Google Scholar] [CrossRef]
- Thornton, P.E.; Running, S.W.; White, M.A. Generating surfaces of daily meteorological variables over large regions of complex terrain. J. Hydrol. 1997, 190, 214–251. [Google Scholar] [CrossRef]
- Daymet: Daily Surface Weather on a 1 km Grid for North America, 1980–2008. Avaliable online: http://www.osti.gov/scitech/biblio/1149782 (accessed on 14 October 2016).
- Oubeidillah, A.A.; Kao, S.C.; Ashfaq, M.; Naz, B.S.; Tootle, G. A large-scale, high-resolution hydrological model parameter data set for climate change impact assessment for the conterminous us. Hydrol. Earth Syst. Sci. 2014, 18, 67–84. [Google Scholar] [CrossRef]
- Neupane, R.P.; White, J.D.; Alexander, S.E. Projected hydrologic changes in monsoon-dominated Himalaya Mountain basins with changing climate and deforestation. J. Hydrol. 2015, 525, 216–230. [Google Scholar] [CrossRef]
- Keane, R.E.; Holsinger, L.M.; Parsons, R.A.; Gray, K. Climate change effects on historical range and variability of two large landscapes in western Montana, USA. For. Ecol. Manag. 2008, 254, 375–389. [Google Scholar] [CrossRef]
- Nakicenovic, N.; Alcamo, J.; Davis, G.; De Vries, B.; Fenhann, J.; Gaffin, S.; Gregory, K.; Grübler, A.; Jung, T.Y.; Kram, T. Special Report on Emissions Scenarios, Working Group III, Intergovernmental Panel on Climate Change (IPCC); Cambridge University Press: Cambridge, KY, USA, 2000. [Google Scholar]
- Van Vuuren, D.P.; O’Neill, B.C. The consistency of IPCC’s SRES scenarios to 1990–2000 trends and recent projections. Clim. Chang. 2006, 75, 9–46. [Google Scholar] [CrossRef]
- Maurer, E.P.; Hidalgo, H.G.; Das, T.; Dettinger, M.; Cayan, D. The utility of daily large-scale climate data in the assessment of climate change impacts on daily streamflow in California. Hydrol. Earth Syst. Sci. 2010, 14, 1125–1138. [Google Scholar] [CrossRef]
- Brekke, L.; Thrasher, B.; Maurer, E.; Pruitt, T. Downscaled CMIP3 and CMIP5 Climate Projections: Release of Downscaled CMIP5 Climate Projections, Comparison with Preceding Information, and Summary of User Needs; US Department of the Interior, Bureau of Reclamation: Denver, CO, USA, 2013.
- Abbaspour, K. SWAT-CUP 2012: Swat Calibration and Uncertainty Programs—A User Manual; Eawag: Dübendorf, Switzerland, 2013. [Google Scholar]
- Hamlet, A.F.; Lettenmaier, D.P. Effects of climate change on hydrology and water resources in the Columbia River Basin. J. Am. Water Resour. Assoc. 1999. [Google Scholar] [CrossRef]
- Zhang, X.; Zhang, L.; Zhao, J.; Rustomji, P.; Hairsine, P. Responses of streamflow to changes in climate and land use/cover in the Loess Plateau, China. Water Resources Res. 2008. [Google Scholar] [CrossRef]
- Chou, C.; Neelin, J.D.; Chen, C.A.; Tu, J.Y. Evaluating the “rich-get-richer” mechanism in tropical precipitation change under global warming. J. Clim. 2009, 22, 1982–2005. [Google Scholar] [CrossRef]
- Chou, C.; Chiang, J.C.; Lan, C.W.; Chung, C.H.; Liao, Y.C.; Lee, C.J. Increase in the range between wet and dry season precipitation. Nat. Geosci. 2013, 6, 263–267. [Google Scholar] [CrossRef]
- Held, I.M.; Soden, B.J. Robust responses of the hydrological cycle to global warming. J. Clim. 2006, 19, 5686–5699. [Google Scholar] [CrossRef]
- Seager, R.; Naik, N.; Vecchi, G.A. Thermodynamic and dynamic mechanisms for large-scale changes in the hydrological cycle in response to global warming. J. Clim. 2010, 23, 4651–4668. [Google Scholar] [CrossRef]
- Acton, Q.A. Advances in Climate Change and Global Warming Research and Application, 2012 ed.; ScholarlyEditions: Atlanta, GA, USA, 2012. [Google Scholar]
- Scheff, J.; Frierson, D.M. Scaling potential evapotranspiration with greenhouse warming. J. Clim. 2014, 27, 1539–1558. [Google Scholar] [CrossRef]
- Anderson, D.B. Relative humidity or vapor pressure deficit. Ecology 1936, 17, 277–282. [Google Scholar] [CrossRef]
- Allen, R.G.; Pereira, L.S.; Raes, D.; Smith, M. Crop Evapotranspiration—Guidelines for Computing Crop Water Requirements—FAO Irrigation and Drainage Paper 56; FAO: Rome, Italy, 1998. [Google Scholar]
- Cook, B.I.; Smerdon, J.E.; Seager, R.; Coats, S. Global warming and 21st century drying. Clim. Dyn. 2014, 43, 2607–2627. [Google Scholar] [CrossRef]
- Keim, B.D.; Fontenot, R.; Tebaldi, C.; Shankman, D. Hydroclimatology of the US Gulf Coast under global climate change scenarios. Phys. Geogr. 2011, 32, 561–582. [Google Scholar] [CrossRef]
- Wilby, R.L.; Wigley, T. Future changes in the distribution of daily precipitation totals across North America. Geoph. Res. Lett. 2002, 29, 31–39. [Google Scholar] [CrossRef]
- Wehner, M.F. Predicted twenty-first-century changes in seasonal extreme precipitation events in the parallel climate model. J. Clim. 2004, 17, 4281–4290. [Google Scholar] [CrossRef]
- Kharin, V.V.; Zwiers, F.W. Changes in the extremes in an ensemble of transient climate simulations with a coupled atmosphere-ocean GCM. J. Clim. 2000, 13, 3760–3788. [Google Scholar] [CrossRef]
- Kharin, V.V.; Zwiers, F.W. Estimating extremes in transient climate change simulations. J. Clim. 2005, 18, 1156–1173. [Google Scholar] [CrossRef]
- Kharin, V.V.; Zwiers, F.W.; Zhang, X. Intercomparison of near-surface temperature and precipitation extremes in AMIP-2 simulations, reanalyses, and observations. J. Clim. 2005, 18, 5201–5223. [Google Scholar] [CrossRef]
- Semenov, V.; Bengtsson, L. Secular trends in daily precipitation characteristics: Greenhouse gas simulation with a coupled AOGCM. Clim. Dyn. 2002, 19, 123–140. [Google Scholar]
- Voss, R.; May, W.; Roeckner, E. Enhanced resolution modelling study on anthropogenic climate change: Changes in extremes of the hydrological cycle. Int. J. Climatol. 2002, 22, 755–777. [Google Scholar] [CrossRef]
- Eslamian, S. Handbook of Engineering Hydrology: Fundamentals and Applications; CRC Press: Boca Raton, FL, USA, 2014. [Google Scholar]

| Rank | Parameter † | t-Stat | p-Value | Best Fitted Value | Minimum Value | Maximum Value |
|---|---|---|---|---|---|---|
| 1 | R_SOL_AWC.sol | 9.95 | 0.00 | −0.05 | −1.00 | 1.00 |
| 2 | V_SMTMP.bsn | 3.06 | 0.00 | 3.77 | −5.00 | 5.00 |
| 3 | R_CN2.mgt | 2.34 | 0.01 | −0.05 | −0.20 | 0.20 |
| 4 | V_EPCO.bsn | 2.10 | 0.04 | 0.40 | 0.01 | 1.00 |
| 5 | R_SOL_BD.sol | 1.87 | 0.06 | 0.86 | −1.00 | 1.00 |
| 6 | V_SURLAG.bsn | 1.85 | 0.07 | 11.66 | 0.00 | 20.00 |
| 7 | V_SMFMX.bsn | 1.65 | 0.10 | 6.85 | 1.40 | 7.50 |
| 8 | V_SHALLST.gw | 1.43 | 0.15 | 4.26 | 0.00 | 5.00 |
| 9 | V_CH_N2.rte | 1.26 | 0.21 | 0.15 | 0.01 | 0.15 |
| 10 | R_SOL_K.sol | 1.20 | 0.23 | −0.12 | −1.00 | 1.00 |
| 11 | V_REVAPMN.gw | 1.05 | 0.29 | 29.90 | 0.00 | 100.00 |
| 12 | V_SMFMN.bsn | 0.98 | 0.33 | 2.11 | 1.40 | 7.50 |
| 13 | V_SFTMP.bsn | 0.97 | 0.33 | 3.11 | −5.00 | 5.00 |
| 14 | R_OV_N.hru | 0.85 | 0.40 | 0.83 | −1.00 | 1.00 |
| 15 | V_GW_DELAY.gw | 0.82 | 0.41 | 449.58 | 30.00 | 450.00 |
| 16 | V_CH_K2.rte | 0.80 | 0.42 | 80.55 | 0.00 | 150.00 |
| 17 | V_GW_REVAP.gw | 0.47 | 0.64 | 0.18 | 0.02 | 0.20 |
| 18 | V_GWQMN.gw | 0.45 | 0.65 | 1.04 | 0.00 | 2.00 |
| 19 | V_RCHRG_DP.gw | 0.38 | 0.70 | 0.33 | 0.00 | 1.00 |
| 20 | R_HEAT_UNITS.mgt | 0.28 | 0.78 | −0.75 | −1.00 | 1.00 |
| 21 | V_ALPHA_BF.gw | 0.18 | 0.86 | 0.16 | 0.00 | 1.00 |
| 22 | V_ESCO.bsn | 0.12 | 0.90 | 0.95 | 0.00 | 1.00 |
| 23 | V_FFCB.bsn | 0.10 | 0.92 | 0.89 | 0.00 | 1.00 |
| 24 | R_SLSUBBSN.hru | 0.00 | 0.99 | −0.63 | −1.00 | 1.00 |
| Statistics | Calibration | Validation | ||
|---|---|---|---|---|
| (1987–1994) | (1995–2000) | |||
| Daily | Monthly | Daily | Monthly | |
| NSE † | 0.66 | 0.87 | 0.50 | 0.76 |
| PBIAS | −21.45 | −21.68 | −2.87 | −2.8 |
| RMSE | 7.045 | 3.56 | 5.93 | 3.25 |
| R2 | 0.69 | 0.88 | 0.55 | 0.78 |
| Precipitation | Actual ET | Water Yield (WYLD) | Soil Water (SW) Storage † | |
|---|---|---|---|---|
| Baseline | 665.80 | 614.30 | 72.80 | −161.30 |
| A2 | −8.20 | 0.29 | −91.07 | −100.00 |
| A1B | −10.00 | −1.93 | −91.21 | −96.21 |
| B1 | −5.00 | 3.35 | −86.69 | −99.80 |
© 2016 by the authors; licensee MDPI, Basel, Switzerland. This article is an open access article distributed under the terms and conditions of the Creative Commons Attribution (CC-BY) license (http://creativecommons.org/licenses/by/4.0/).
Share and Cite
Mehan, S.; Kannan, N.; Neupane, R.P.; McDaniel, R.; Kumar, S. Climate Change Impacts on the Hydrological Processes of a Small Agricultural Watershed. Climate 2016, 4, 56. https://doi.org/10.3390/cli4040056
Mehan S, Kannan N, Neupane RP, McDaniel R, Kumar S. Climate Change Impacts on the Hydrological Processes of a Small Agricultural Watershed. Climate. 2016; 4(4):56. https://doi.org/10.3390/cli4040056
Chicago/Turabian StyleMehan, Sushant, Narayanan Kannan, Ram P. Neupane, Rachel McDaniel, and Sandeep Kumar. 2016. "Climate Change Impacts on the Hydrological Processes of a Small Agricultural Watershed" Climate 4, no. 4: 56. https://doi.org/10.3390/cli4040056
APA StyleMehan, S., Kannan, N., Neupane, R. P., McDaniel, R., & Kumar, S. (2016). Climate Change Impacts on the Hydrological Processes of a Small Agricultural Watershed. Climate, 4(4), 56. https://doi.org/10.3390/cli4040056