
Cloud Fraction of Liquid Water Clouds above Switzerland over the Last 12 Years


Abstract
:1. Introduction
2. Instrument, Measurement Technique and Data Analysis
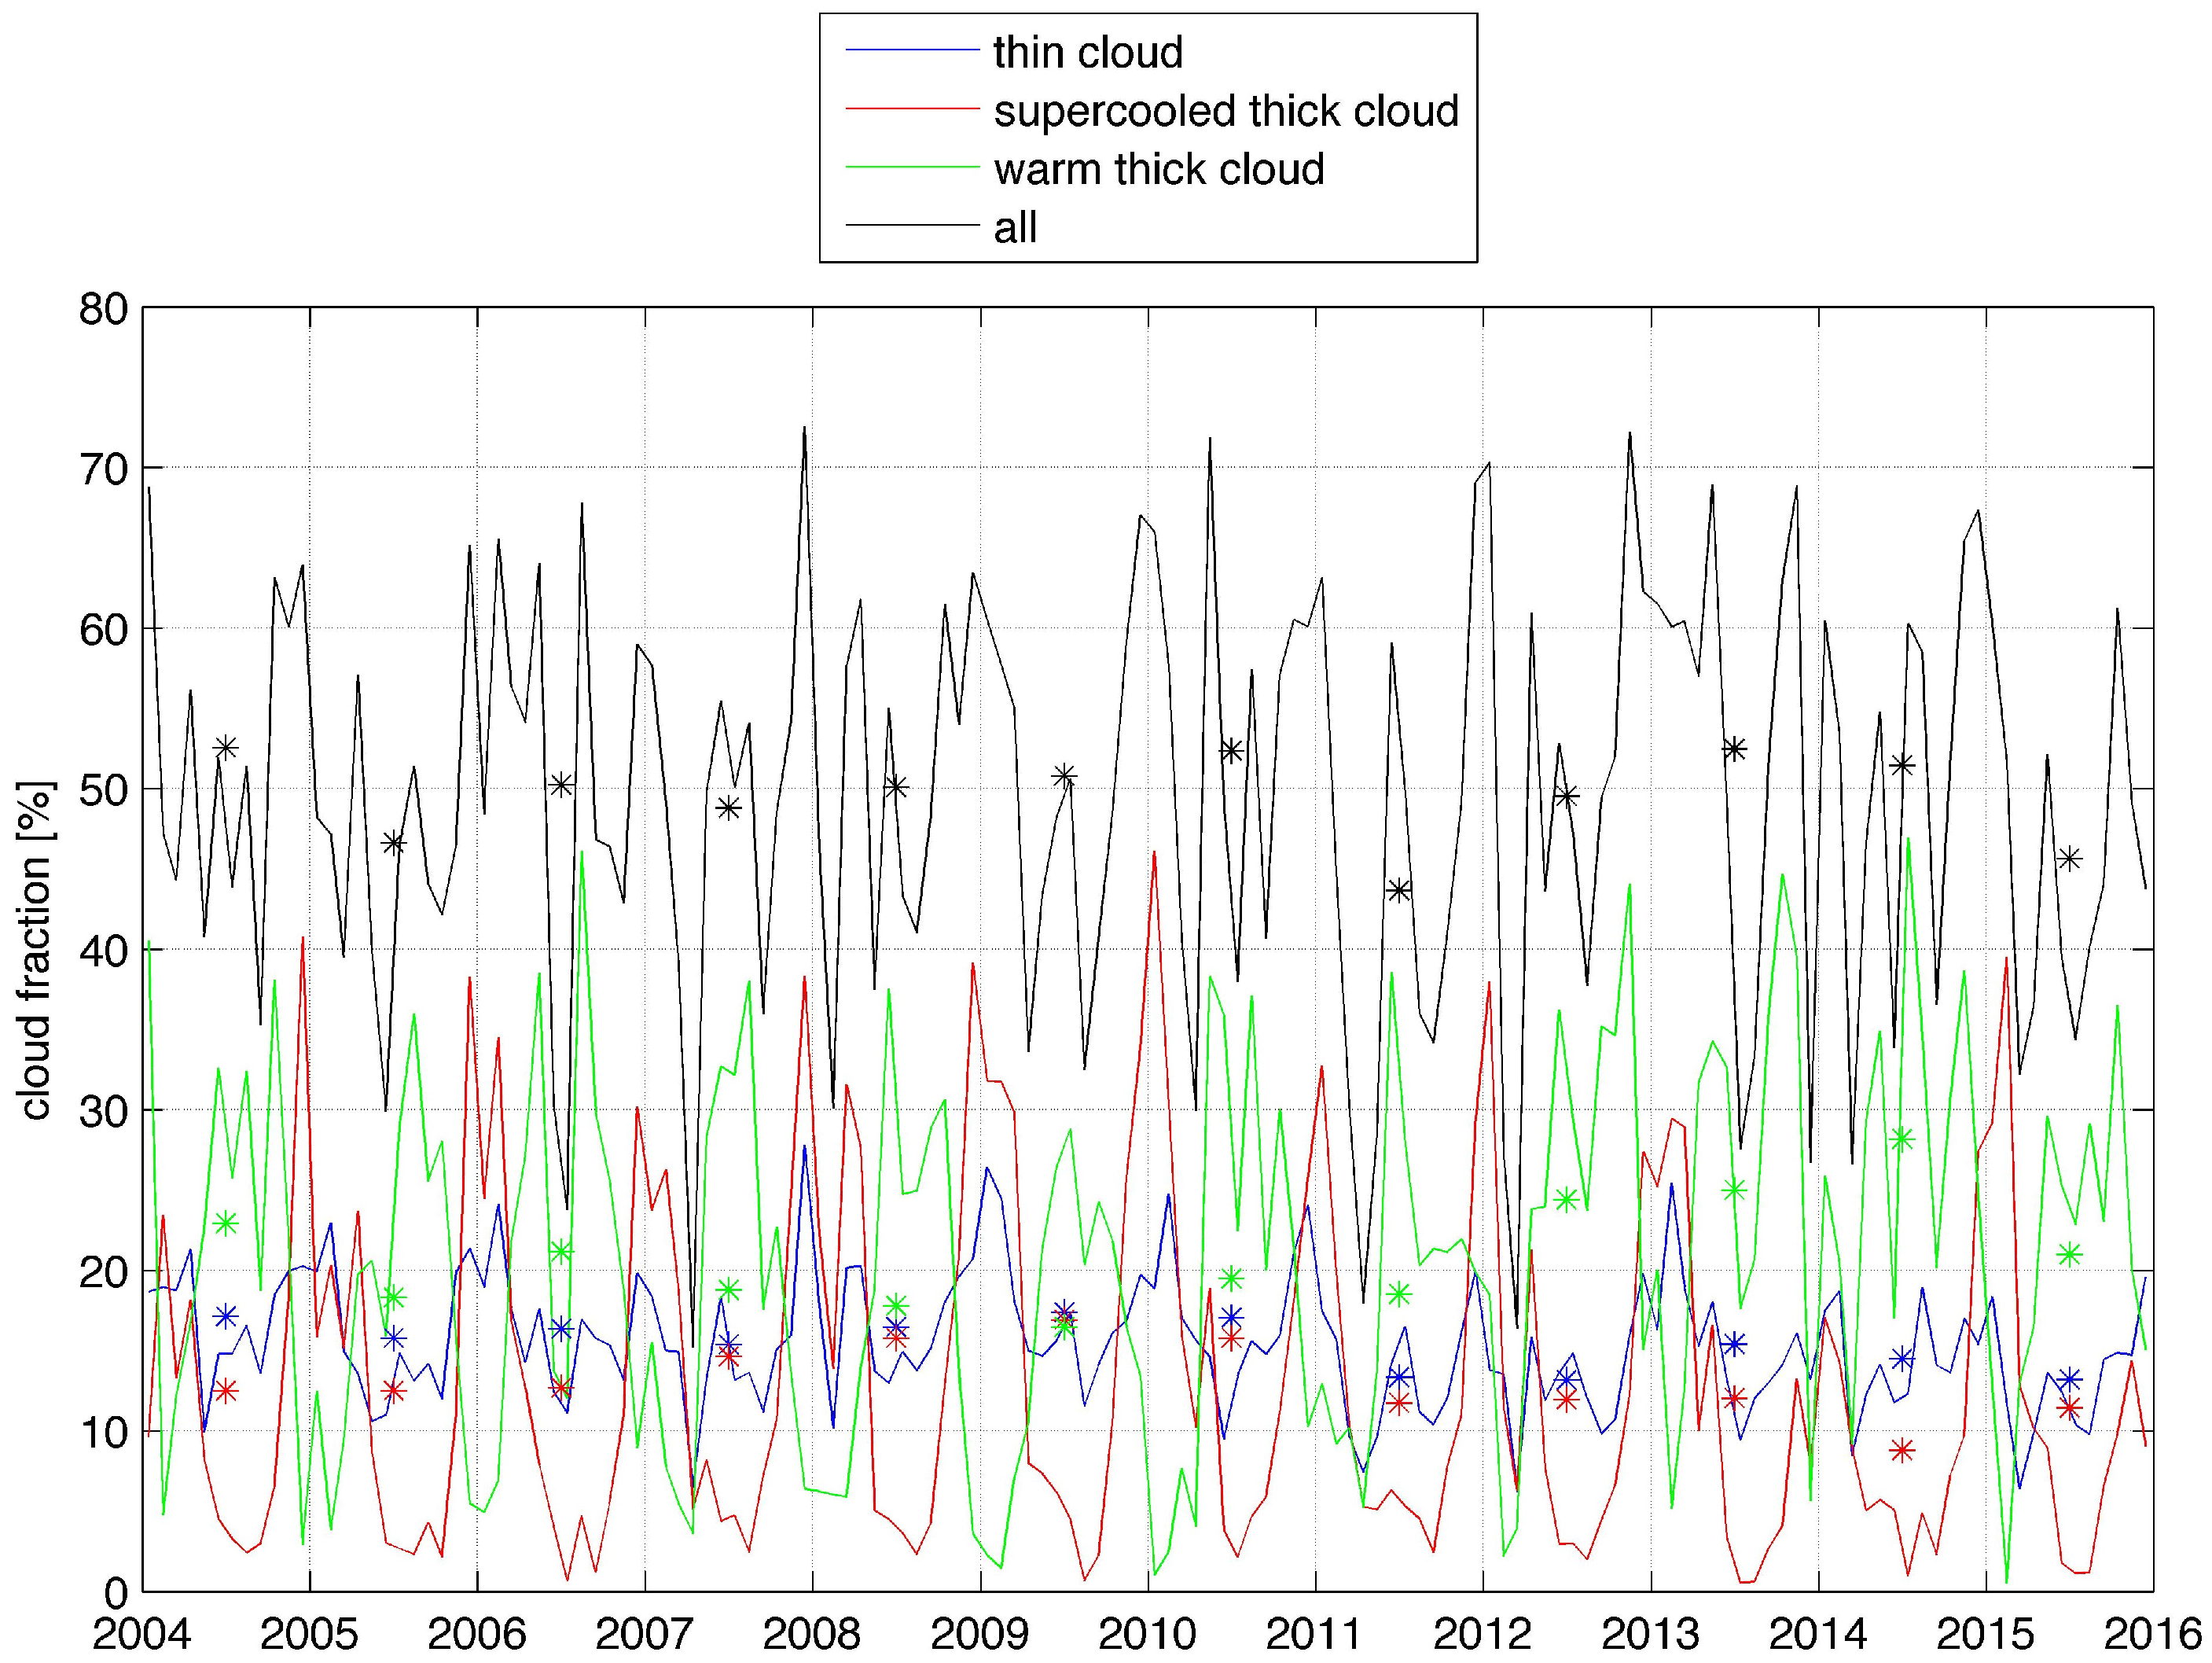
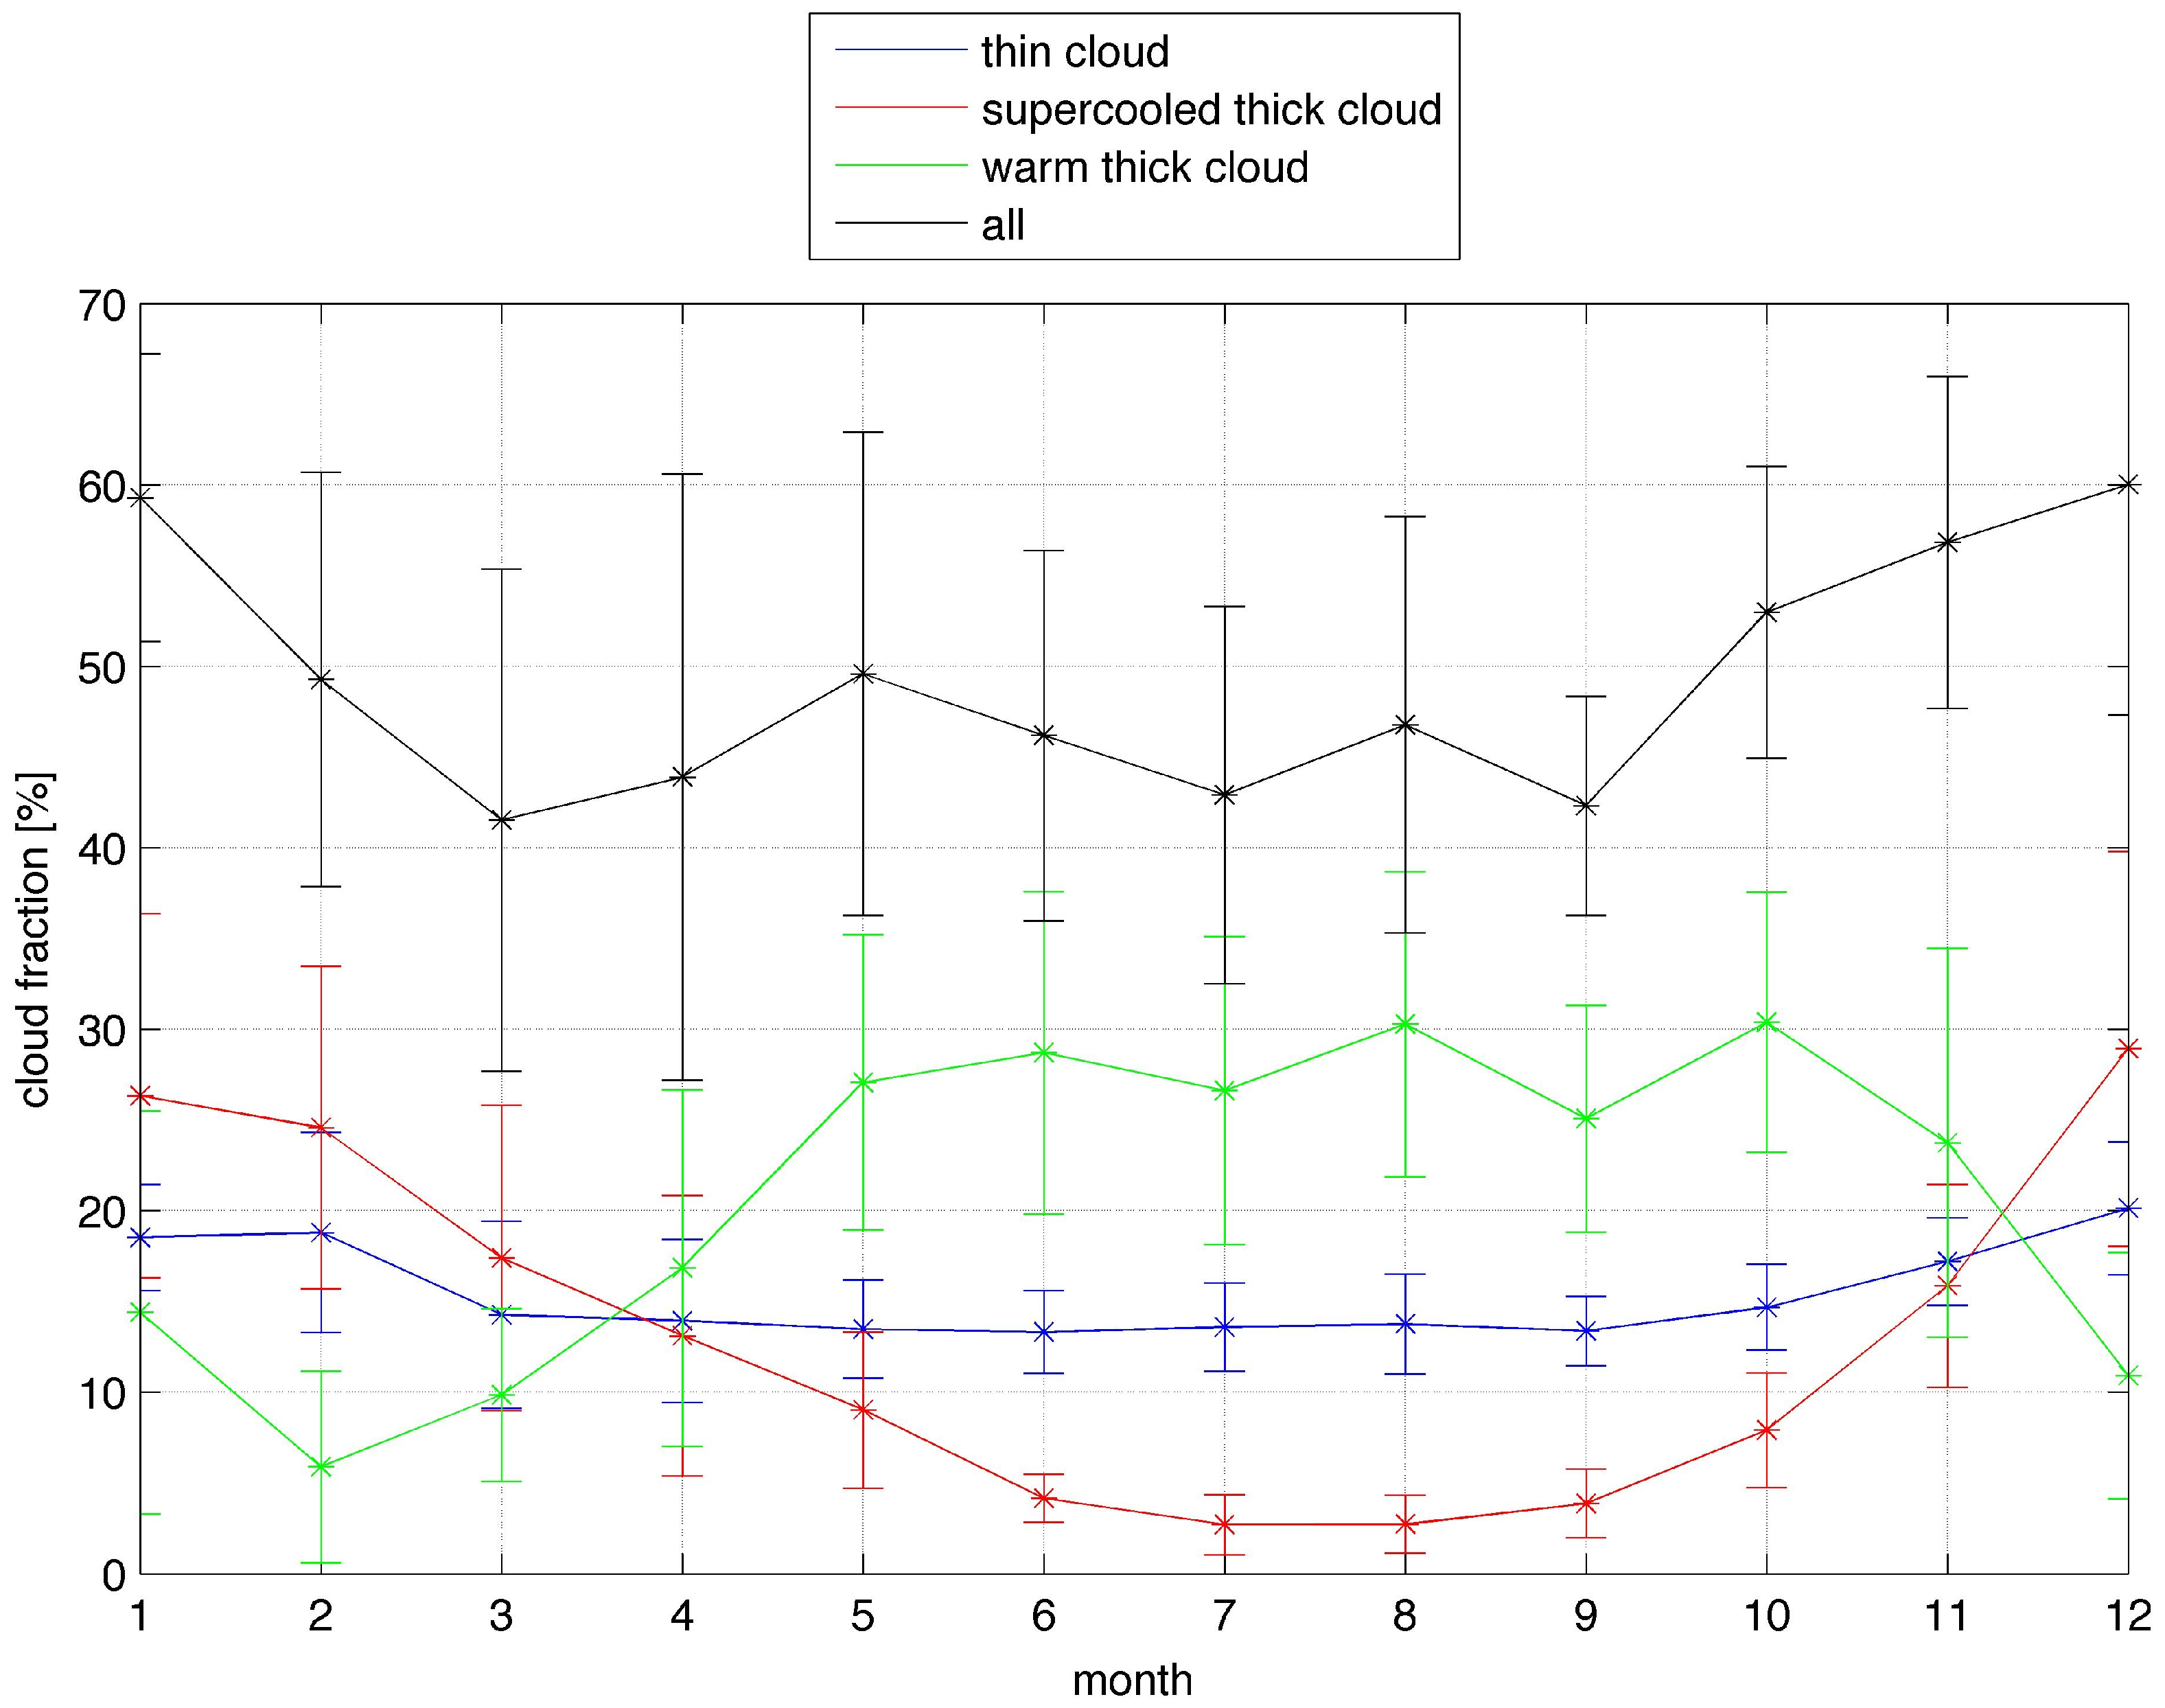
- thin liquid water clouds ( mm < ILW < 0.03 mm),
- thick supercooled liquid water clouds (ILW > 0.03 mm and K),
- thick warm liquid water clouds (ILW > 0.03 mm and K),
- all liquid water clouds (ILW > 0.0023 mm).
3. Results and Discussion
3.1. Time Series and Trends of Cloud Fraction
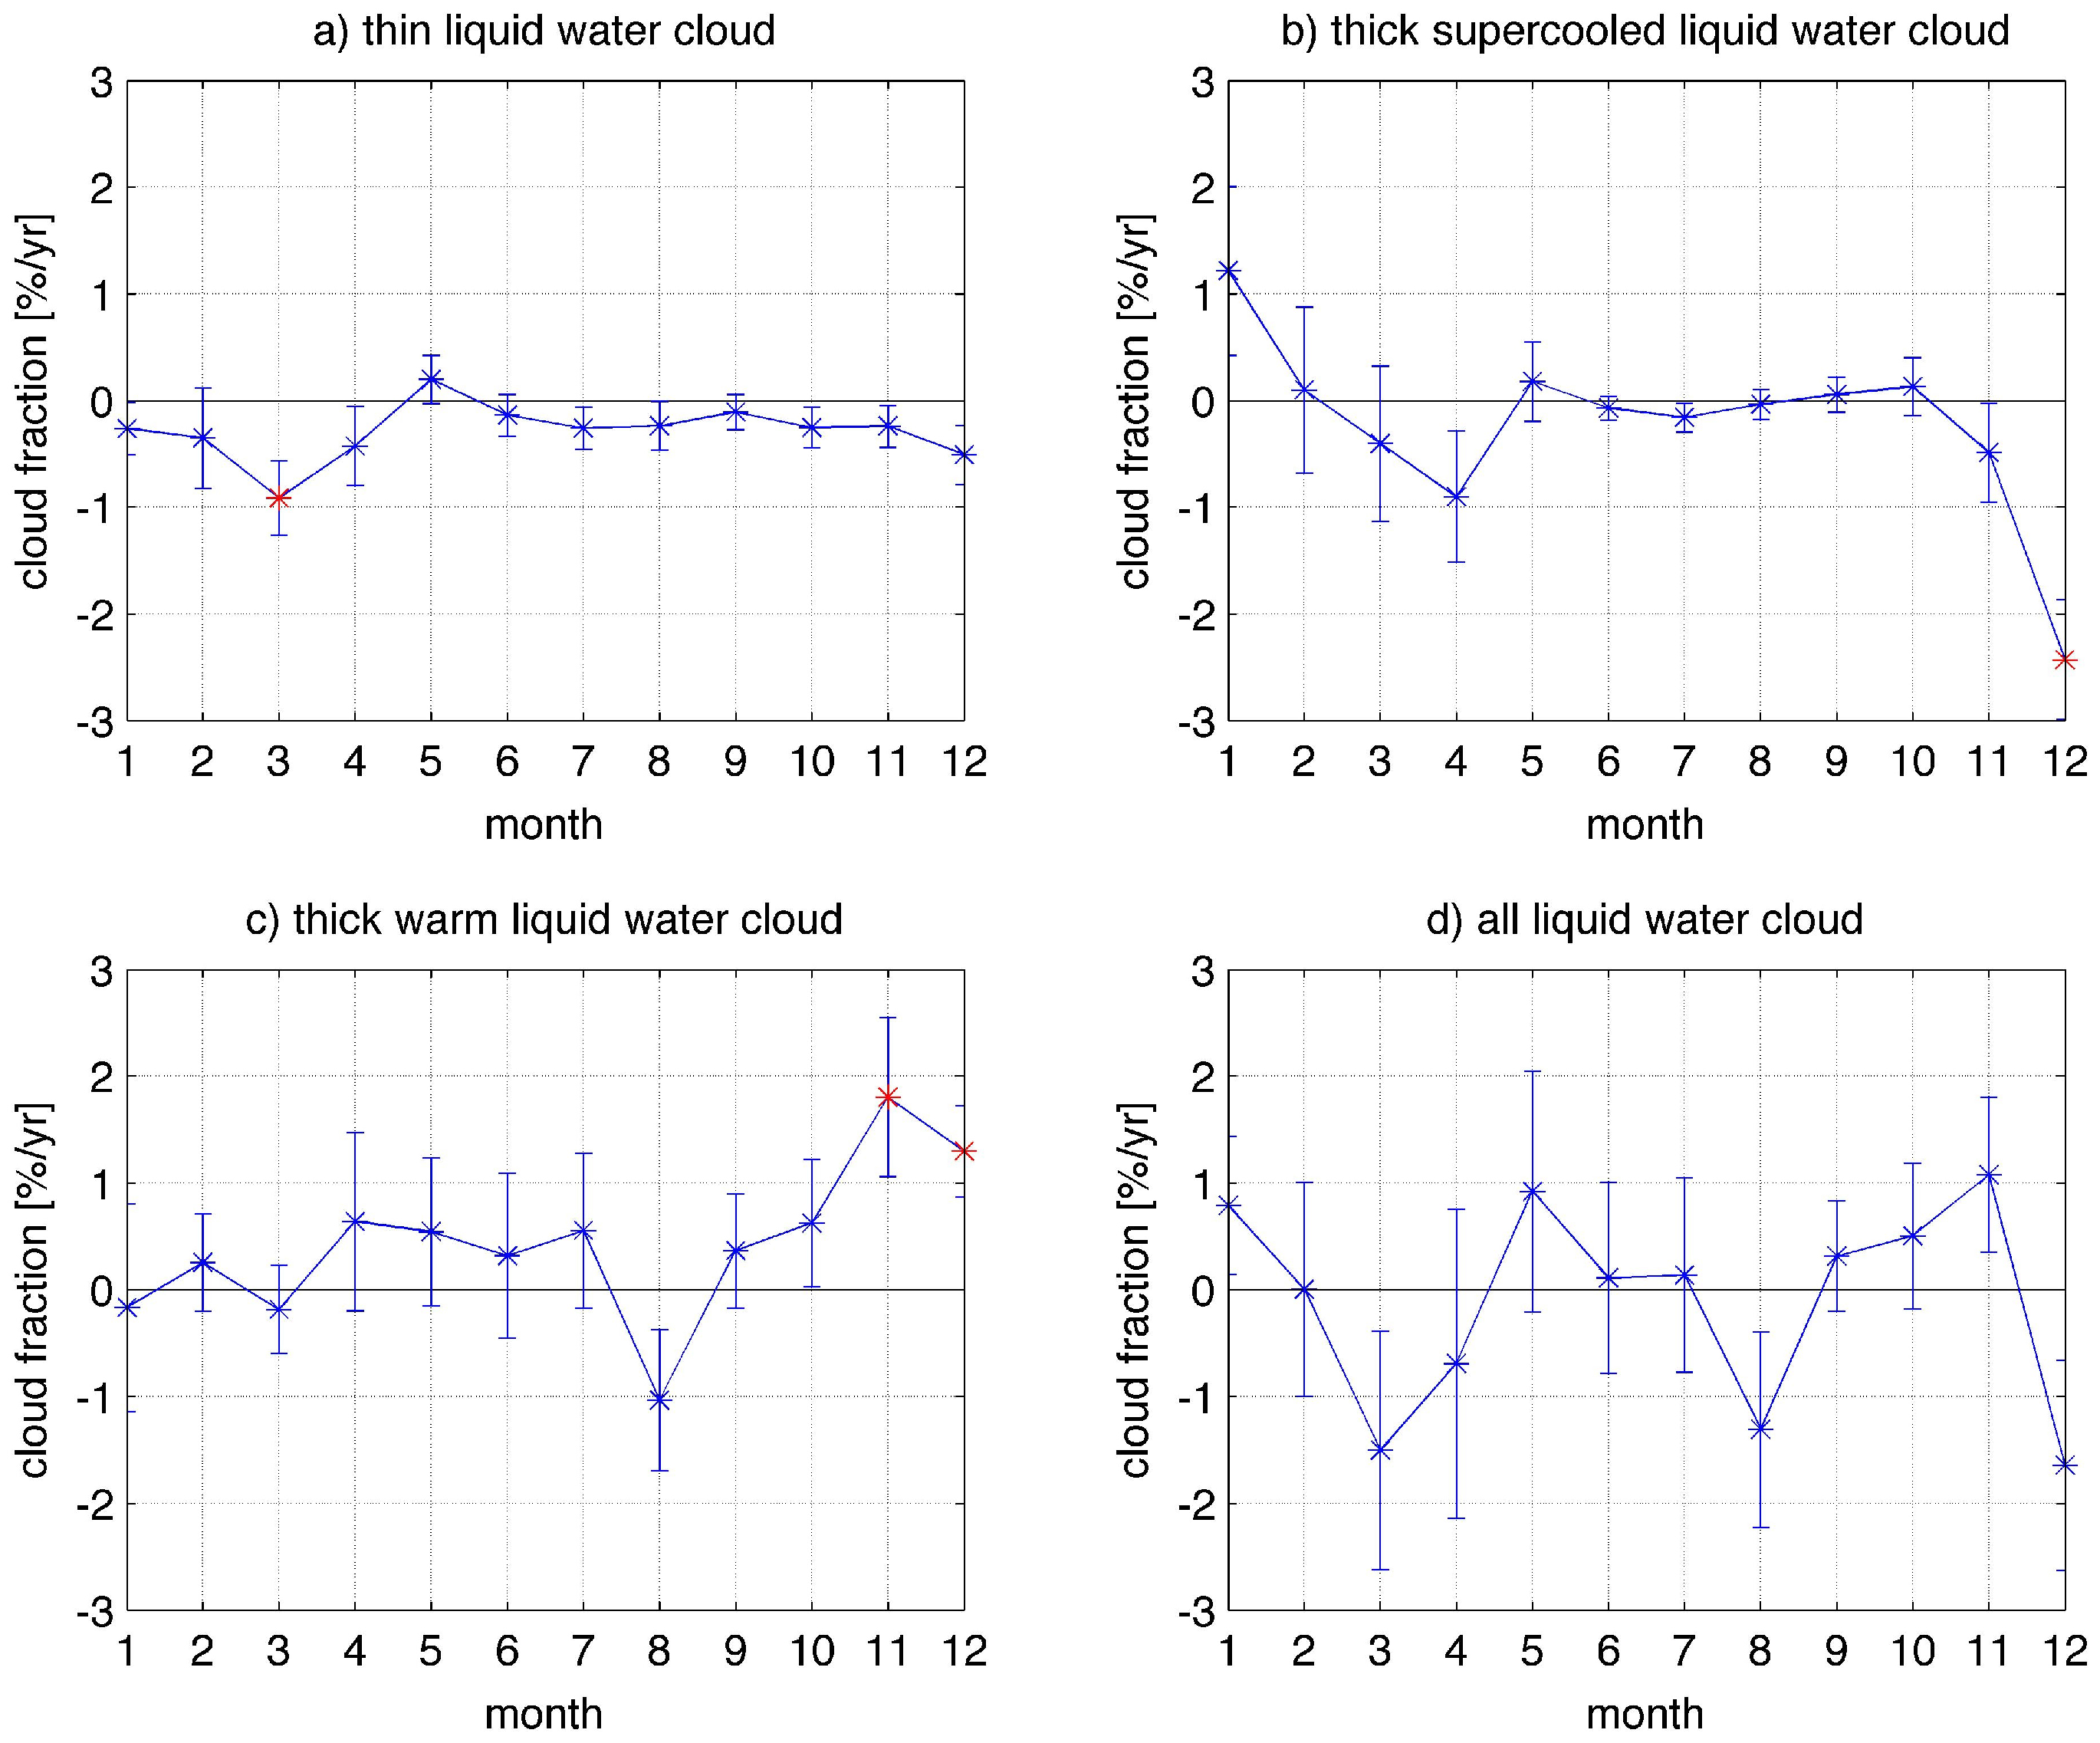
3.2. Climatologies of Cloud Fraction and Seasonal Trends
4. Conclusions
Acknowledgments
Author Contributions
Conflicts of Interest
References
- Randall, D.A.; Coakley, J.A.; Lenschow, D.H.; Fairall, C.W.; Kropfli, R.A. Outlook for research on subtropical marine stratification clouds. Bull. Am. Meteorol. Soc. 1984, 65, 1290–1301. [Google Scholar] [CrossRef]
- Ackerman, T.P.; Stokes, G.M. The atmospheric radiation measurement program. Phys. Today 2003, 56, 38–44. [Google Scholar] [CrossRef]
- Lentz, A.; Renné, D.; Batlles, F.J.; Alonso, J.; López, G. Cloud cover forecasting from METEOSAT data. Energy Procedia 2014, 57, 1317–1326. [Google Scholar]
- Köhler, F.; Görsdorf, U. Towards 3D prediction of supercooled liquid water for aircraft icing: Modifications of the microphysics in COSMO-EU. Meteorol. Z. 2014, 23, 253–262. [Google Scholar]
- Turner, D.D.; Vogelmann, A.M.; Austin, R.T.; Barnard, J.C.; Cady-Pereira, K.; Chiu, J.C.; Clough, S.A.; Flynn, C.; Khaiyer, M.M.; Liljegren, J.; et al. Thin liquid water clouds: Their importance and our challenge. Bull. Am. Meteorol. Soc. 2007, 88, 177–190. [Google Scholar] [CrossRef]
- Cossu, F.; Hocke, K.; Martynov, A.; Martius, O.; Matzler, C. Atmospheric water parameters measured by a ground-based microwave radiometer and compared with the WRF model. Atmos. Sci. Lett. 2015, 16, 465–472. [Google Scholar] [CrossRef]
- Cossu, F.; Hocke, K.; Matzler, C. A 10-year cloud fraction climatology of liquid water clouds over bern observed by a ground-based microwave radiometer. Remote Sens. 2015, 7, 7768–7784. [Google Scholar] [CrossRef]
- Wylie, D.; Jackson, D.L.; Menzel, W.P.; Bates, J.J. Trends in global cloud cover in two decades of HIRS observations. J. Clim. 2005, 18, 3021–3031. [Google Scholar] [CrossRef]
- Fontana, F.; Lugrin, D.; Seiz, G.; Meier, M.; Foppa, N. Intercomparison of satellite- and ground-based cloud fraction over Switzerland (2000–2012). Atmos. Res. 2013, 128, 1–12. [Google Scholar] [CrossRef]
- Butt, N.; New, M.; Lizcano, G.; Malhi, Y. Spatial patterns and recent trends in cloud fraction and cloud-related diffuse radiation in Amazonia. J. Geophys. Res. Atmos. 2009. [Google Scholar] [CrossRef]
- Norris, J.R. Trends in upper-level cloud cover and surface divergence over the tropical Indo-Pacific Ocean between 1952 and 1997. J. Geophys. Res. Atmos. 2005. [Google Scholar] [CrossRef]
- Stubenrauch, C.J.; Rossow, W.B.; Kinne, S.; Ackerman, S.; Cesana, G.; Chepfer, H.; Di Girolamo, L.; Getzewich, B.; Guignard, A.; Heidinger, A.; et al. Assessment of global cloud datasets from satellites: Project and database initiated by the GEWEX radiation panel. Bull. Am. Meteorol. Soc. 2013, 94, 1031–1049. [Google Scholar] [CrossRef]
- IPCC. Climate Change 2013: The Physical Science Basis; Cambridge University Press: Cambridge, UK, 2013. [Google Scholar]
- Peter, R.; Kämpfer, N. Radiometric determination of water-vapor and liquid water and its validation with other techniques. J. Geophys. Res. Atmos. 1992, 97, 18173–18183. [Google Scholar] [CrossRef]
- Ingold, T.; Peter, R.; Kämpfer, N. Weighted mean tropospheric temperature and transmittance determination at millimeter-wave frequencies for ground-based applications. Radio Sci. 1998, 33, 905–918. [Google Scholar] [CrossRef]
- Mätzler, C.; Morland, J. Refined physical retrieval of integrated water vapor and cloud liquid for microwave radiometer data. IEEE Trans. Geosci. Remote Sens. 2009, 47, 1585–1594. [Google Scholar] [CrossRef]
- Morland, J.; Collaud Coen, M.; Hocke, K.; Jeannet, P.; Mätzler, C. Tropospheric water vapour above Switzerland over the last 12 years. Atmos. Chem. Phys. 2009, 9, 5975–5988. [Google Scholar] [CrossRef] [Green Version]
- Hocke, K.; Kampfer, N.; Gerber, C.; Matzler, C. A complete long-term series of integrated water vapour from ground-based microwave radiometers. Int. J. Remote Sens. 2011, 32, 751–765. [Google Scholar] [CrossRef]
- Brocard, E.; Schneebeli, M.; Morland, J.; Mätzler, C. Detection of Supercooled Cloud Layers with Microwave and Infrared Radiometry and Additional Tools; Universität Bern: Bern, Switzerland, 2006. [Google Scholar]
- Mätzler, C.; Rosenkranz, P.W.; Cermak, J. Microwave absorption of supercooled clouds and implications for the dielectric properties of water. J. Geophys. Res. Atmos. 2010. [Google Scholar] [CrossRef]
- Hirsch, E.; Agassi, E.; Koren, I. Determination of optical and microphysical properties of thin warm clouds using ground based hyper-spectral analysis. Atmos. Meas. Tech. 2012, 5, 851–871. [Google Scholar] [CrossRef]
- Bernet, L. Cloud Effect on Temperature Profiles from Microwave Radiometry. Master’s Thesis, Universität Bern, Bern, Switzerland, 2016. [Google Scholar]
- Hamed, K.H. Trend detection in hydrologic data: The Mann–Kendall trend test under the scaling hypothesis. J. Hydrol. 2008, 349, 350–363. [Google Scholar] [CrossRef]


| Class | Inclination (%/yr) | Uncertainty (%/yr) | Trend? |
|---|---|---|---|
| 1 | −0.29 | 0.10 | yes |
| 2 | −0.28 | 0.27 | no |
| 3 | +0.51 | 0.27 | no |
| 4 | −0.07 | 0.30 | no |
© 2016 by the authors; licensee MDPI, Basel, Switzerland. This article is an open access article distributed under the terms and conditions of the Creative Commons Attribution (CC-BY) license (http://creativecommons.org/licenses/by/4.0/).
Share and Cite
Hocke, K.; Navas Guzmán, F.; Cossu, F.; Mätzler, C. Cloud Fraction of Liquid Water Clouds above Switzerland over the Last 12 Years. Climate 2016, 4, 48. https://doi.org/10.3390/cli4040048
Hocke K, Navas Guzmán F, Cossu F, Mätzler C. Cloud Fraction of Liquid Water Clouds above Switzerland over the Last 12 Years. Climate. 2016; 4(4):48. https://doi.org/10.3390/cli4040048
Chicago/Turabian StyleHocke, Klemens, Francisco Navas Guzmán, Federico Cossu, and Christian Mätzler. 2016. "Cloud Fraction of Liquid Water Clouds above Switzerland over the Last 12 Years" Climate 4, no. 4: 48. https://doi.org/10.3390/cli4040048
APA StyleHocke, K., Navas Guzmán, F., Cossu, F., & Mätzler, C. (2016). Cloud Fraction of Liquid Water Clouds above Switzerland over the Last 12 Years. Climate, 4(4), 48. https://doi.org/10.3390/cli4040048