Article

Life Cycle Characteristics of Warm-Season Severe Thunderstorms in Central United States from 2010 to 2014

1
Department of Geosciences, Florida Atlantic University, Boca Raton, FL 33431, USA
2
Department of Geography and Atmospheric Science, University of Kansas, Lawrence, KS 66045, USA
*
Author to whom correspondence should be addressed.
Climate 2016, 4(3), 45; https://doi.org/10.3390/cli4030045
Submission received: 17 July 2016 / Revised: 2 September 2016 / Accepted: 6 September 2016 / Published: 8 September 2016
(This article belongs to the Special Issue Climate Extremes, the Past and the Future)

Abstract

:
Weather monitoring systems, such as Doppler radars, collect a high volume of measurements with fine spatial and temporal resolutions that provide opportunities to study many convective weather events. This study examines the spatial and temporal characteristics of severe thunderstorm life cycles in central United States mainly covering Kansas, Oklahoma, and northern Texas during the warm seasons from 2010 to 2014. Thunderstorms are identified using radar reflectivity and cloud-to-ground lightning data and are tracked using a directed graph model that can represent the whole life cycle of a thunderstorm. Thunderstorms were stored in a GIS database with a number of additional thunderstorm attributes. Spatial and temporal characteristics of the thunderstorms were analyzed, including the yearly total number of thunderstorms, their monthly distribution, durations, initiation time, termination time, movement speed and direction, and the spatial distributions of thunderstorm tracks, initiations, and terminations. Results revealed that thunderstorms were most frequent across the eastern part of the study area, especially at the borders between Kansas, Missouri, Oklahoma, and Arkansas. Finally, thunderstorm occurrence is linked to land cover, including a comparison of thunderstorms between urban and surrounding rural areas. Results demonstrated that thunderstorms would favor forests and urban areas. This study demonstrates that advanced GIS representations and analyses for spatiotemporal events provide effective research tools to meteorological studies.

1. Introduction

Meteorologists have great interest in the climatology of thunderstorms across the world because severe thunderstorms could cause heavy rain, large hail, lightning strikes, and strong winds, which can potentially damage lives and property [1,2]. Weather monitoring systems, such as the Doppler radar, collect data with increasing spatial and temporal resolutions and provide great opportunities for researchers to study convective weather events [3,4]. For example, a number of researchers have studied the life cycle characteristics of mesoscale convective systems (MCS) using meteorological satellite products. Machado et al. [5] used GOES-7 ISCCP-B3 satellite data to track the life cycle of deep convective systems (CS) across the United States at both tropical and middle latitudes during 1987–1988. They mainly used areal overlap to extract the evolution of CS using images of 3-h temporal resolution. Mathon and Laurent [6] provided an eight-year (June–September, 1989–1998) climatology of Sahelian MCS using the METEOSAT infrared images with 0.5-h temporal resolution and 5-km spatial resolution. They used both forward and backward areal overlap on consecutive images to construct whole life cycles of MCS. Moreover, they illustrated dynamic changes and interactions among the life cycles including generation, development, dissipation, merger, split, and combinatorial (merger and split occurring simultaneously). Morel and Senesi [7,8] studied the climatology of MCS life cycles in western European using an automatic cloud-tracking algorithm considering three factors: temperature, area, and size of areal overlap. In the tracking algorithm, they estimated the velocity of cloud systems in order to efficiently detect clouds with the size of 1000 km2. Their algorithm has some advantages over previous tracking algorithms, which only use areal overlap on consecutive images and are difficult to capture small or fast moving clouds because of low temporal sampling frequency without velocity prediction.
The above climatology studies are all based on meteorological satellite images where the systems are on the scale of more than 5000 km2. To track the mesoscale (down to ~20 km2) life cycle of storm scale, the data must have a much higher spatial and temporal resolution than the above studies, as well as an improved tracking algorithm. As a consequence, a number of researchers have utilized radar-based algorithms to extract, represent, analyze, and predict the life cycles of storm events.
The critical component of a storm tracking algorithm is how to associate the storm cells that are identified over consecutive radar images [9]. There are two major categories of storm tracking algorithms: centroid-based tracking algorithms [10,11,12,13,14] and cross-correlation tracking algorithms [15,16]. Both tracking algorithms have advantages and disadvantages. While centroid-based tracking algorithms delineate and track single storm cells and provide attributes of storm cells, cross-correlation tracking algorithms can provide more accurate movement speed and direction [11,17,18].
Among the existing centroid-based tracking algorithms, the Thunderstorm Identification, Tracking, Analysis, and Nowcasting (TITAN) [10] system developed at the National Center for Atmospheric Research (NCAR) is widely used throughout the world. The TITAN algorithm firstly delineates a single storm cell as a contiguous region where the reflectivity and volume both exceed certain thresholds. Areal overlap and the Hungarian optimization algorithm are combined to determine whether the storm cells on consecutive images belong to the same storm. However, the previous studies only allowed one trajectory when they dealt with merger and split situations. In the TITAN algorithm [10], when two or more storm cells merge into a single storm cell, only one trajectory is kept and the remainder are terminated. When a single storm cell splits into two or more small storm cells, only one trajectory is kept and the rest would be new storms. While the above treatment of merger and split is relatively easy, it does not represent the complete life cycle and interactions among storm cells [14] since it does not include split or merger.
A number of studies have been performed on the spatiotemporal characteristics of thunderstorms across the central United States [19,20,21]. However, very few have focused on the whole life cycle of storm events. The analyses of spatial and temporal characteristics of storm events through the United States are mainly from the National Weather Service (NWS) storm reports contained in the storm data of the National Oceanic and Atmospheric Administration (NOAA). However, the data are point features, which do not fully represent storm initiation, development, termination, and geographic coverage.
Recognizing the need for an automated methodology to extract thunderstorms from large spatiotemporal datasets and analyze their spatiotemporal characteristics, the goals of this work are to identify thunderstorm life cycles over central United States, reveal seasonal, diurnal, and spatial patterns of thunderstorms, and test the association between land cover properties and thunderstorm features especially in urban and rural areas. Geographic Information Systems (GISs) have been widely applied to meteorological research [14,22,23]. Because of the spatial focus of this study, GIS is used to identify, represent, query, and analyze thunderstorm life cycles. The first task is to develop a thunderstorm GIS database storing their whole life cycles where directed graph representation and algorithms are explored to characterize the thunderstorms. The second task is to quantify the spatiotemporal patterns of the thunderstorms using GIS query, spatial analyses, and spatial statistics.
This study intends to illustrate how innovative GIS representations and analyses can be used to characterize the spatial and temporal patterns of thunderstorm life cycles. The three major datasets, methodologies, and GIS representations are described in Section 2. A number of spatial and temporal analyses on thunderstorm life cycles are presented in Section 3. A summary of the research and possible future work are provided in Section 4.

2. Data and Methodology

2.1. Radar Reflectivity Data

The United States NWS maintains the Next Generation Radar (NEXRAD) program covering almost the whole country to monitor precipitation and other meteorological and hydrological phenomena [21]. This is a network of S-band (10 cm) Weather Surveillance 1988 Doppler radars [24], which has been recently upgraded to dual-polarization radar. The radar data used in this study are the final reflectivity product (N0R) from Iowa Environmental Mesonet (IEM). The IEM interpolates the base reflectivity to a 1 km grid every 5 min, and the archived datasets can be accessed via the IEM Geographic Information System (GIS) data service in PNG or GeoTIFF format. Precipitation can be estimated from radar returns based on a Z-R relationship, and the radar reflectivity data have been applied to a number of different applications including storm identification and nowcasting [25], climatology [26,27], and urbanization impacts on precipitation [28,29].

2.2. Lightning Data

The second dataset used in this study is cloud-to-ground lightning data from the United States National Lightning Detection Network (NLDN) [30], which is produced by the Vaisala Corporation (http://www.vaisala.com). Cloud-to-ground lightning point data are used to determine whether the precipitation is associated with a thunderstorm. The reflectivity cluster is considered a thunderstorm if at least one lightning strike occurs during its life cycle.
The radar reflectivity data and cloud-to-ground lightning data used in this research cover 32.5°N–40.5°N and 93.5°W–103.5°W (the red dashed boundary in Figure 1). The study domain mainly covers the states of Kansas, Oklahoma, and northern Texas. The data span a period of five years from 1 April 2010 to 30 September 2014, and only include warm seasons (April–September) each year. Severe thunderstorms are common features in the study area, so understanding their life cycle characteristics is significant for weather forecasting, disaster management, and hydrological management [31].

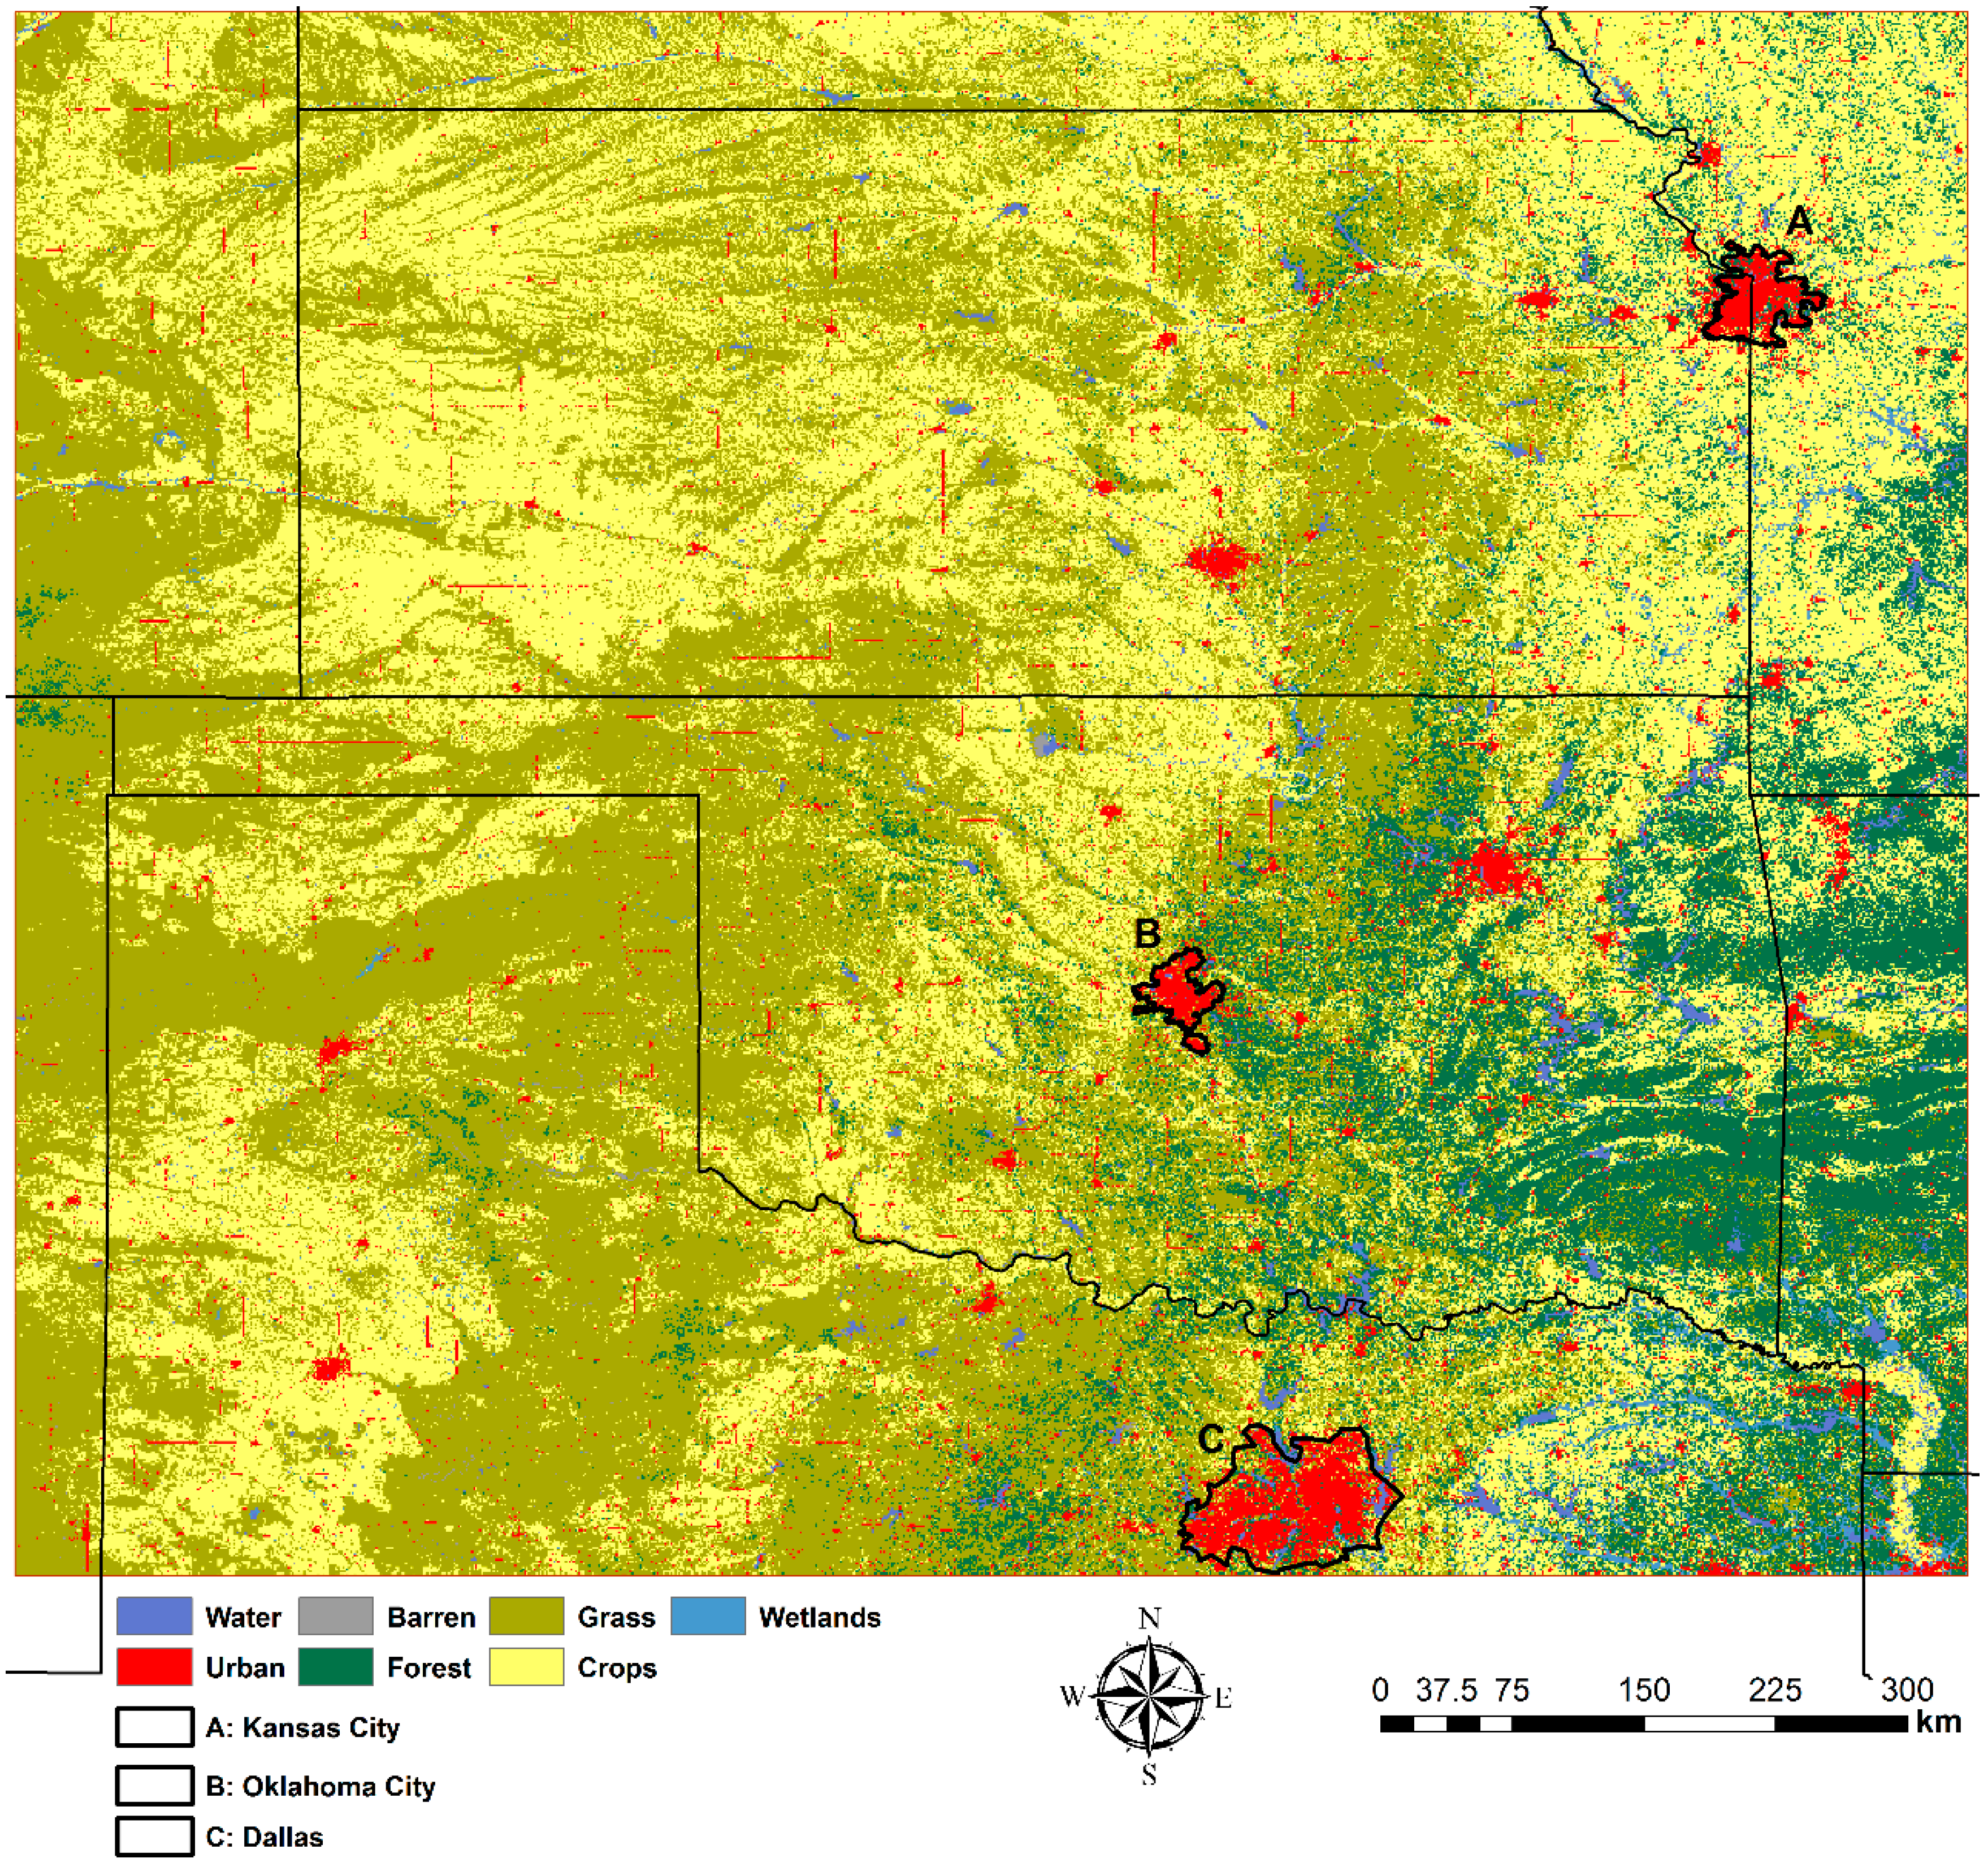
2.3. Land Cover Data

The latest 2011 version of the National Land Cover Dataset (NLCD) is used to study the relationship between land cover types and thunderstorm occurrence. NLCD 2011 is primarily based on the unsupervised classification of 2011 Landsat satellite data, which provide information on water bodies, vegetation, and developed lands at a spatial resolution of 30 meters. To link thunderstorm occurrence to the main land cover types in the study area, the original NLCD land cover classes are generalized and reclassified into seven major types including water (1.2%), barren (0.2%), grasses (42.4%), wetlands (1.0%), urban areas (3.2%), forests (11.5%), and crops (40.4%) (Figure 2). The study area is mainly covered by grasses, crops, and forests. The NLCD data are reprojected to the same coordinate system (GCS_North_American_1983 spatial reference system) as the radar reflectivity data, and are resampled to 1 km spatial resolution using a majority resampling method to match the radar data.

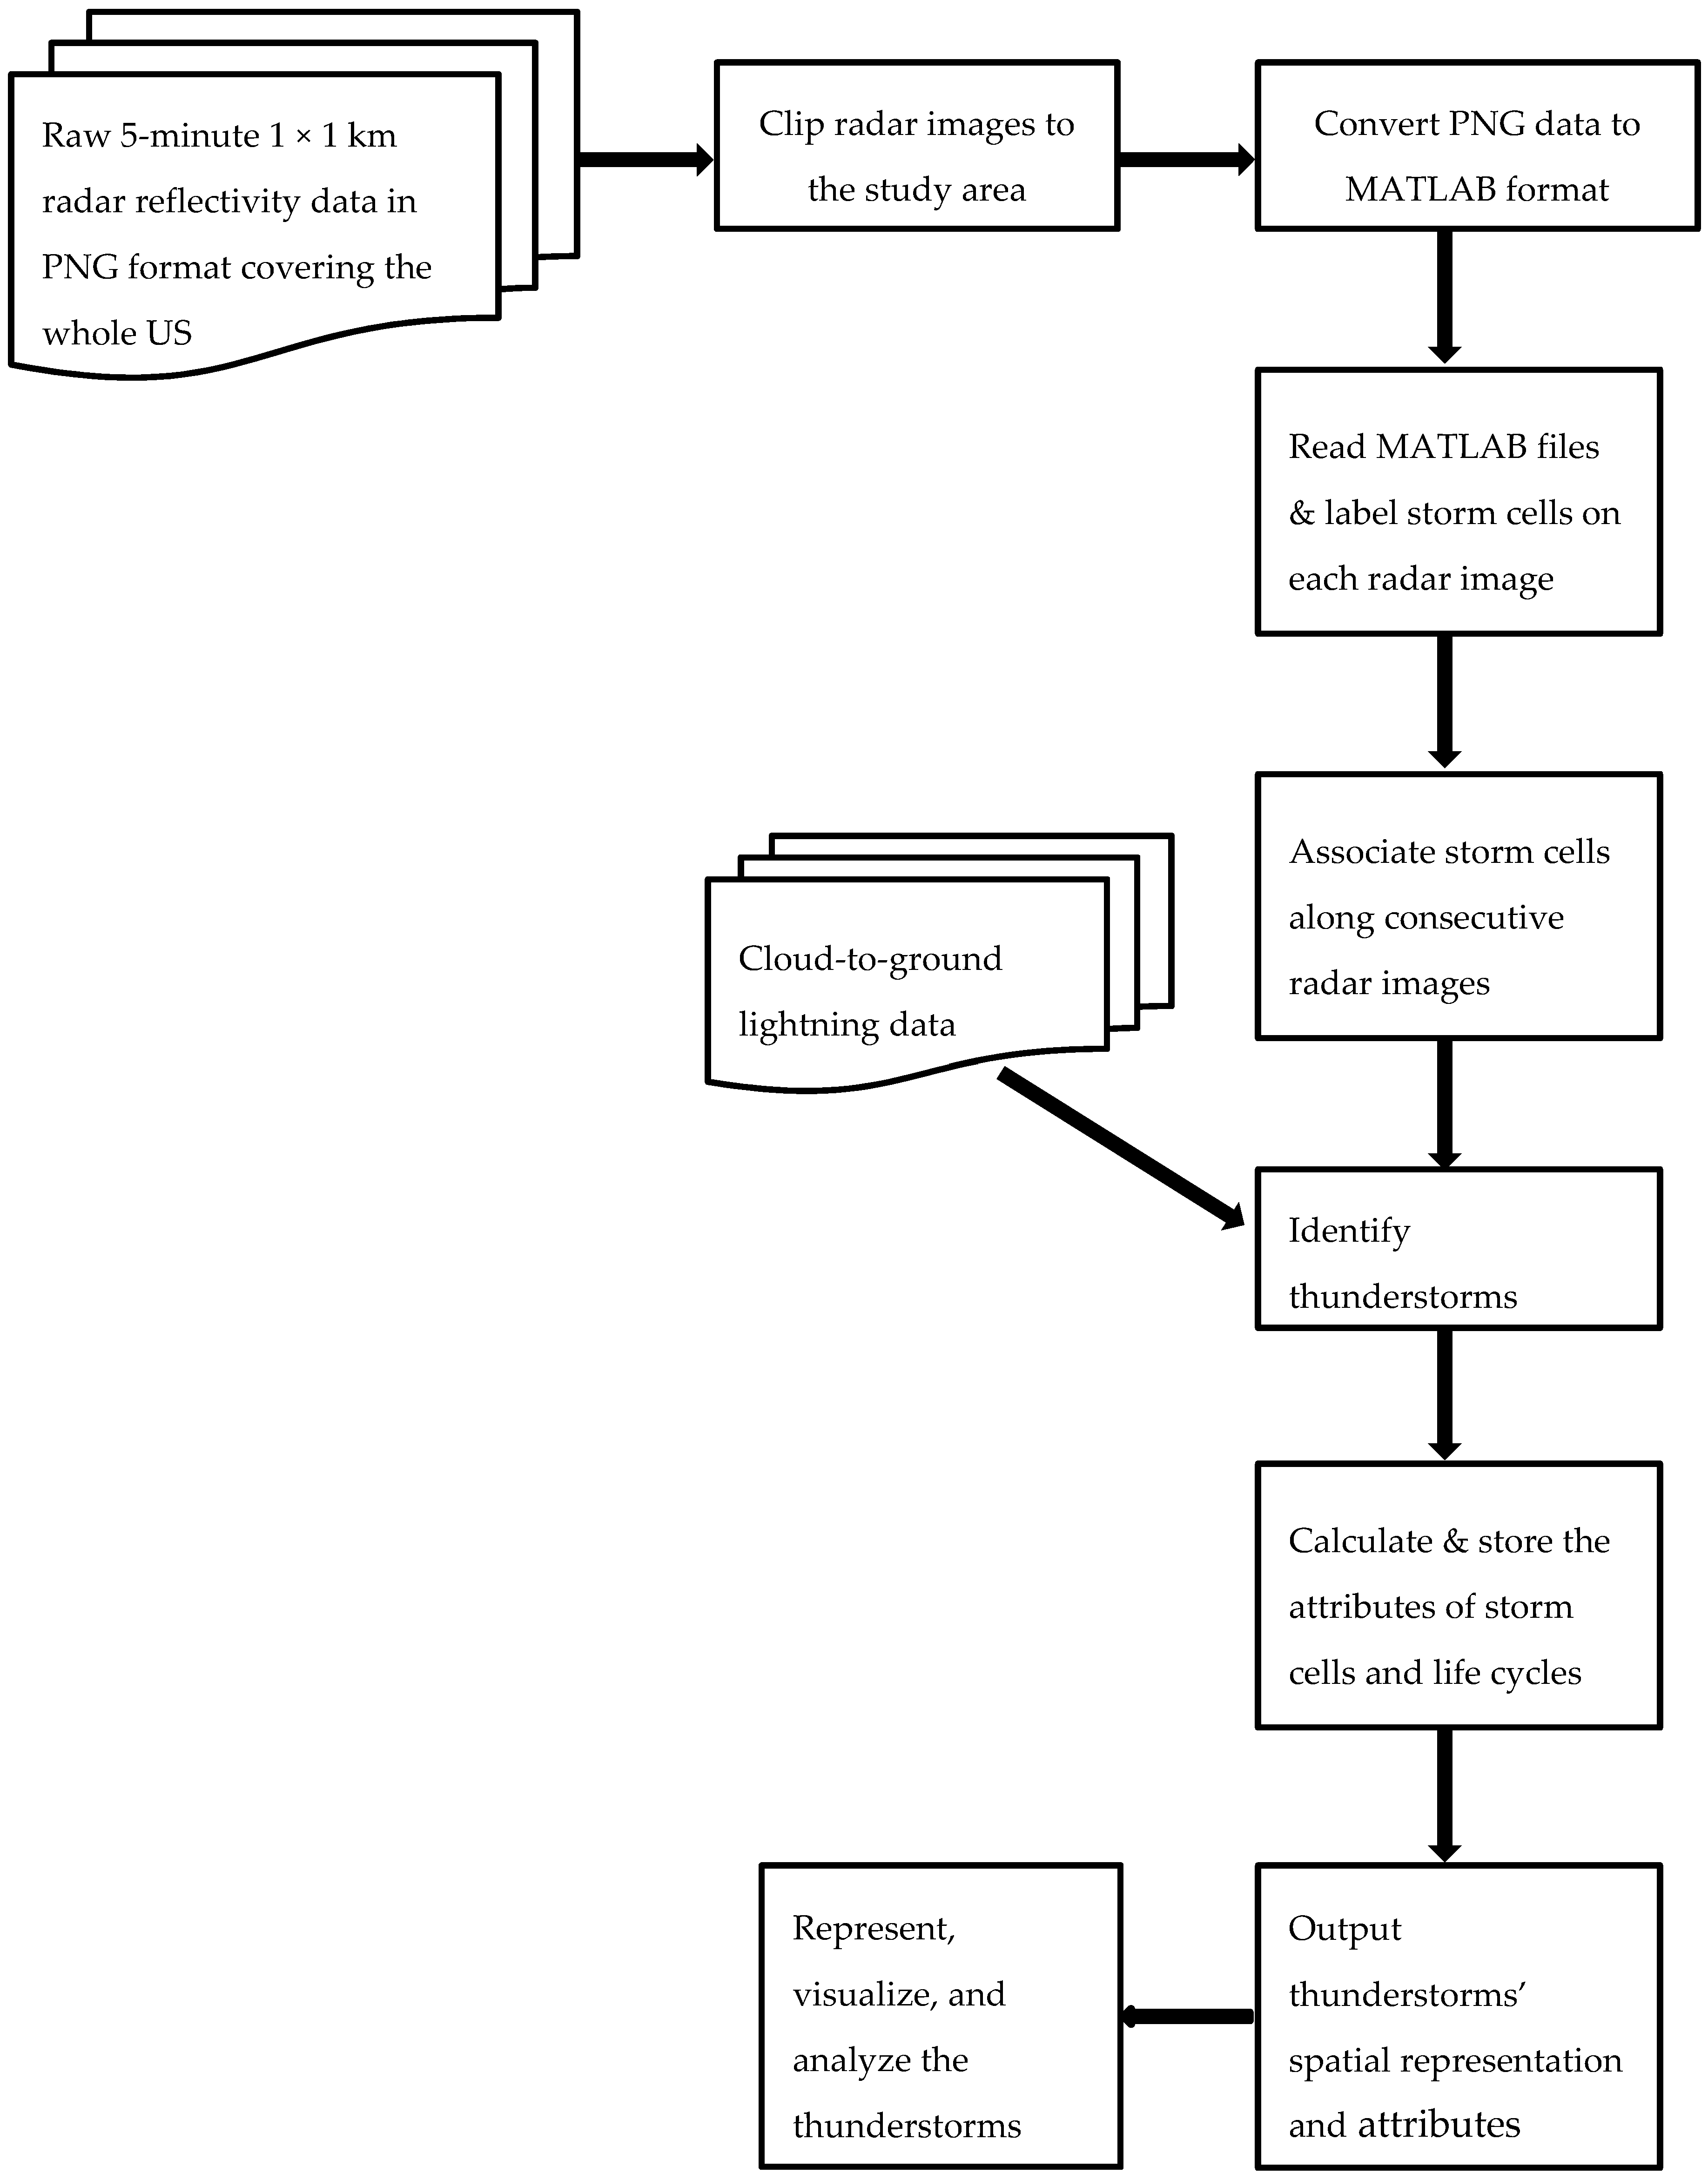
2.4. Extraction of Thunderstorm Life Cycles

First, a storm cell in a radar image is delineated as a contiguous region where both the reflectivity and area are greater than or equal to certain thresholds. Based on the sensitivity analysis in Liu et al. [14], the reflectivity range should be between 30 and 40 dBZ, and the area range should be between 20 and 30 km2 for convective storms. Because the focus is on substantial thunderstorms, the reflectivity and area thresholds were chosen as 35 dBZ and 20 km2, respectively. A component-labeling algorithm [32] was used to extract storm cells from individual radar images.
After extracting storm cells in each radar image, the critical and challenging step is to associate the storm cells on consecutive radar images to extract the whole life cycle of a storm. In this study, storm life cycle extraction used an improved centroid-based storm tracking algorithm developed by Liu et al. [14], which considers spatial overlap, centroid distance, and movement direction of storm cells simultaneously. A storm centroid is the reflectivity-weighted mean position of the radar pixels in the storm cell. If a storm cell on the current image and a storm cell on the next image have sufficient spatial overlap and are within a reasonable distance and movement direction, the two storm cells are considered in the same storm trajectory. The sensitivity analysis [14] on spatial overlap indicates a reasonable range of spatial overlap is between 0.4 and 0.8. In this study, we set 0.6 as the threshold of spatial overlap. Based on the average storm movement speed and sampling frequency of the radar images, the threshold for centroid distance was set to 10 km. Finally, the angle between the predicted movement direction of a storm cell and the direction from the centroid of the storm cell on the current radar image to the centroid of a possible matching storm cell on the next radar image should be less than 90° in order to keep only realistic storm movement [14].
Cloud-to-ground lightning data determine whether extracted storms are thunderstorms. The lightning point data were overlaid with storm cell polygons. If lightning occurs in any storm cells of a storm, the storm is counted as a thunderstorm. This method, however, may omit some thunderstorms because not all thunderstorms generate cloud-to-ground lightning [27].
An application developed via MATLAB was utilized to process, extract, represent, and analyze the thunderstorms. A flow chart illustrating the key steps is shown in Figure 3. The radar reflectivity images are preprocessed by creating a subset of radar data over the study area and converting the data format. Afterwards, the three most important tasks are carried out, including storm cell delineation, storm life cycle extraction, and thunderstorm identification. A number of properties are calculated for the thunderstorms at both the cell level and life cycle level. At the cell level, we calculated the total reflectivity and area. Thunderstorm cells are approximated by ellipses, so we also calculated the orientation, major and minor axis of the ellipses. At the life cycle level, we calculated the duration, mean movement speed and direction during the life span of a thunderstorm. For the thunderstorm climatology, we also calculated the statistics of these properties.

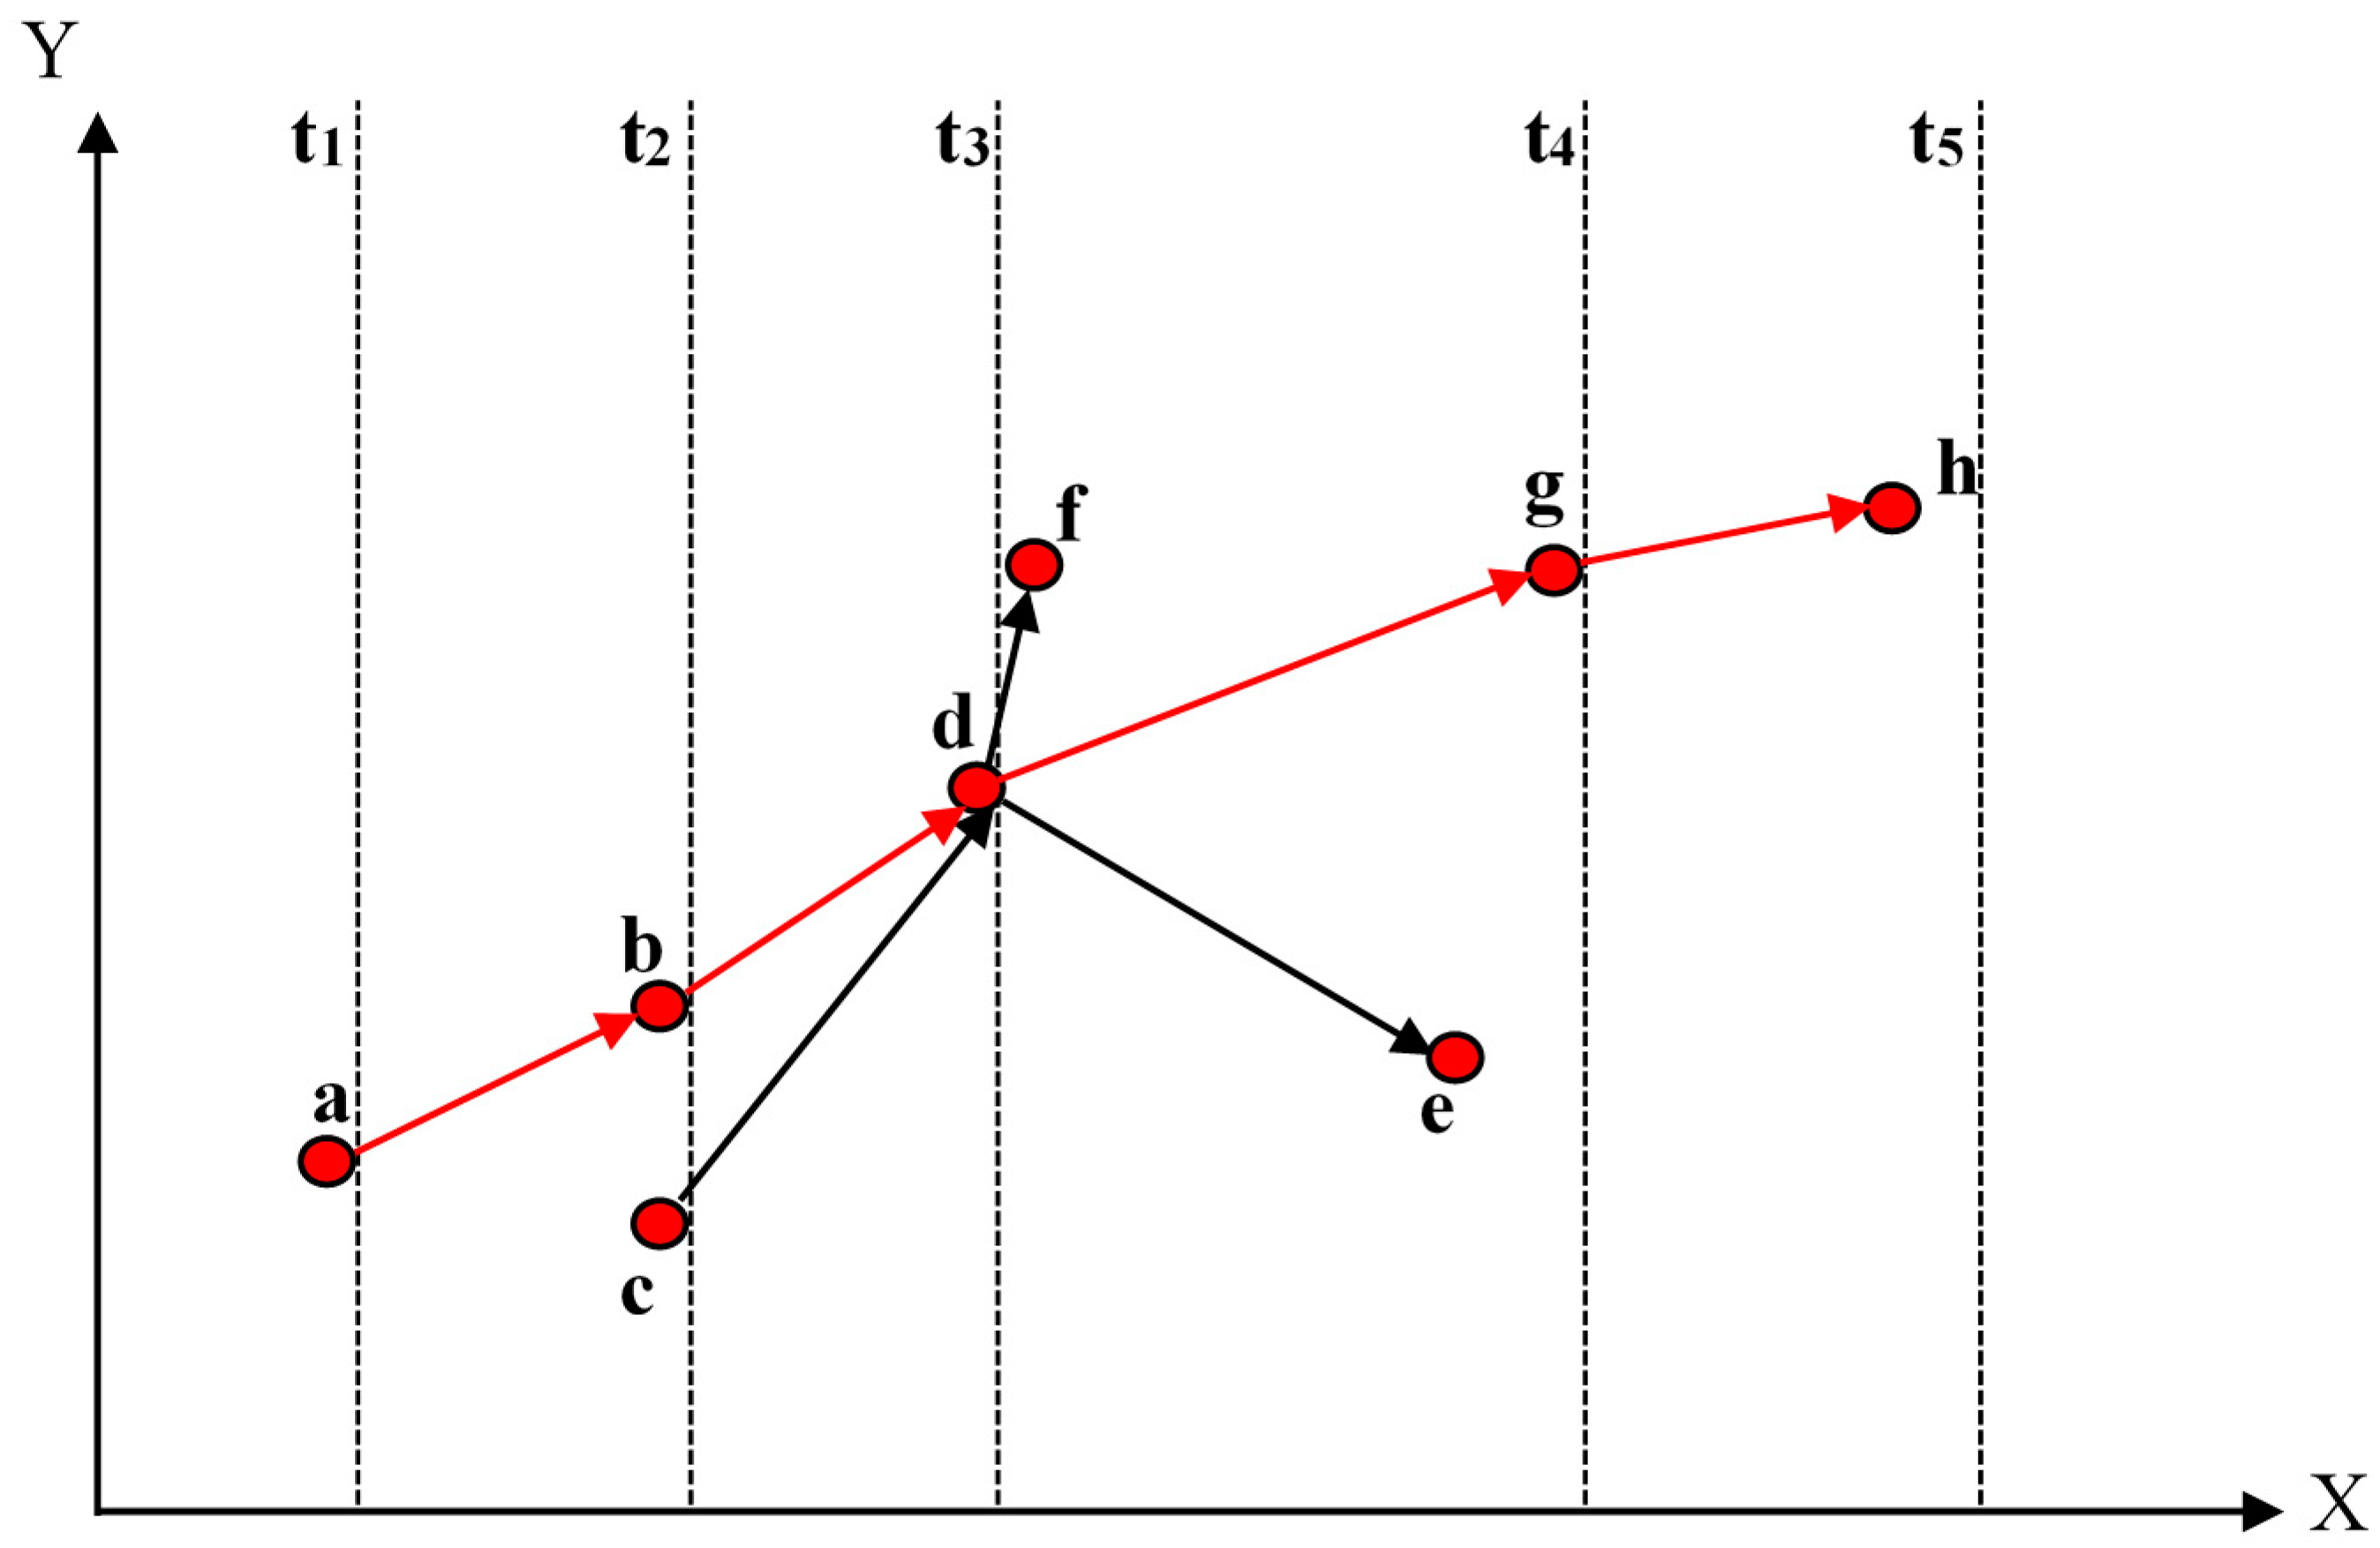
2.5. Directed Graph Representation of Thunderstorms in GIS

A directed spatiotemporal graph model (Figure 4) is used to represent the life cycle of a thunderstorm including its initiation, development, interactions among storm cells, and termination. Nodes and directed edges are the two basic components of our directed graph model. Reflectivity-weighted centroid, which captures the most intense precipitation in a storm cell, is used as a node to represent the cell. Edges in the graph model represent the linkages among thunderstorm cells at two consecutive radar images and direction denotes the time sequence.
Figure 4 shows an example of a thunderstorm extracted from five radar images from time t1 to t5 with a duration of 20 min. We could see there are a total of eight thunderstorm cells in its life cycle. There are five interactions (initiation, continuity, split, merger, and termination) in the figure. The thunderstorm initiates from thunderstorm cell a at time t1, then develops into cell b at time t2. Cell b and c merge into cell d at time t3. At time t4, cell d splits into three cells e, f, and g, and finally this thunderstorm terminates at time t5 as cell h. Using the directed spatiotemporal graph model, the initiation, termination, split, and mergers can be quantified, which will be discussed in Section 3.
Many details are contained in the directed graph representation. To begin with are the simple storm statistics such as storm duration and the mean speed and direction of storm movement; the maximum reflectivity path [14], which is based on the classic Dijkstra graph shortest path algorithm, is applied to the database to produce a polyline (the red line in Figure 4). When the density of thunderstorm tracks is calculated, the maximum reflectivity path is extracted to calculate the density using the polylines. Compared to previous studies [9,10,11], our approach studies both the interactions among thunderstorm cells within its life cycle (the directed graph representation) and generalized trajectory from a simplified life cycle (the polyline representation).

3. Results and Discussion

The results of the thunderstorm climatology highlight a number of different spatial and temporal characteristics found during the warm seasons from 2010 to 2014. An important emphasis is to illustrate how GIS representations and analyses can be used for climatological research in meteorological communities.

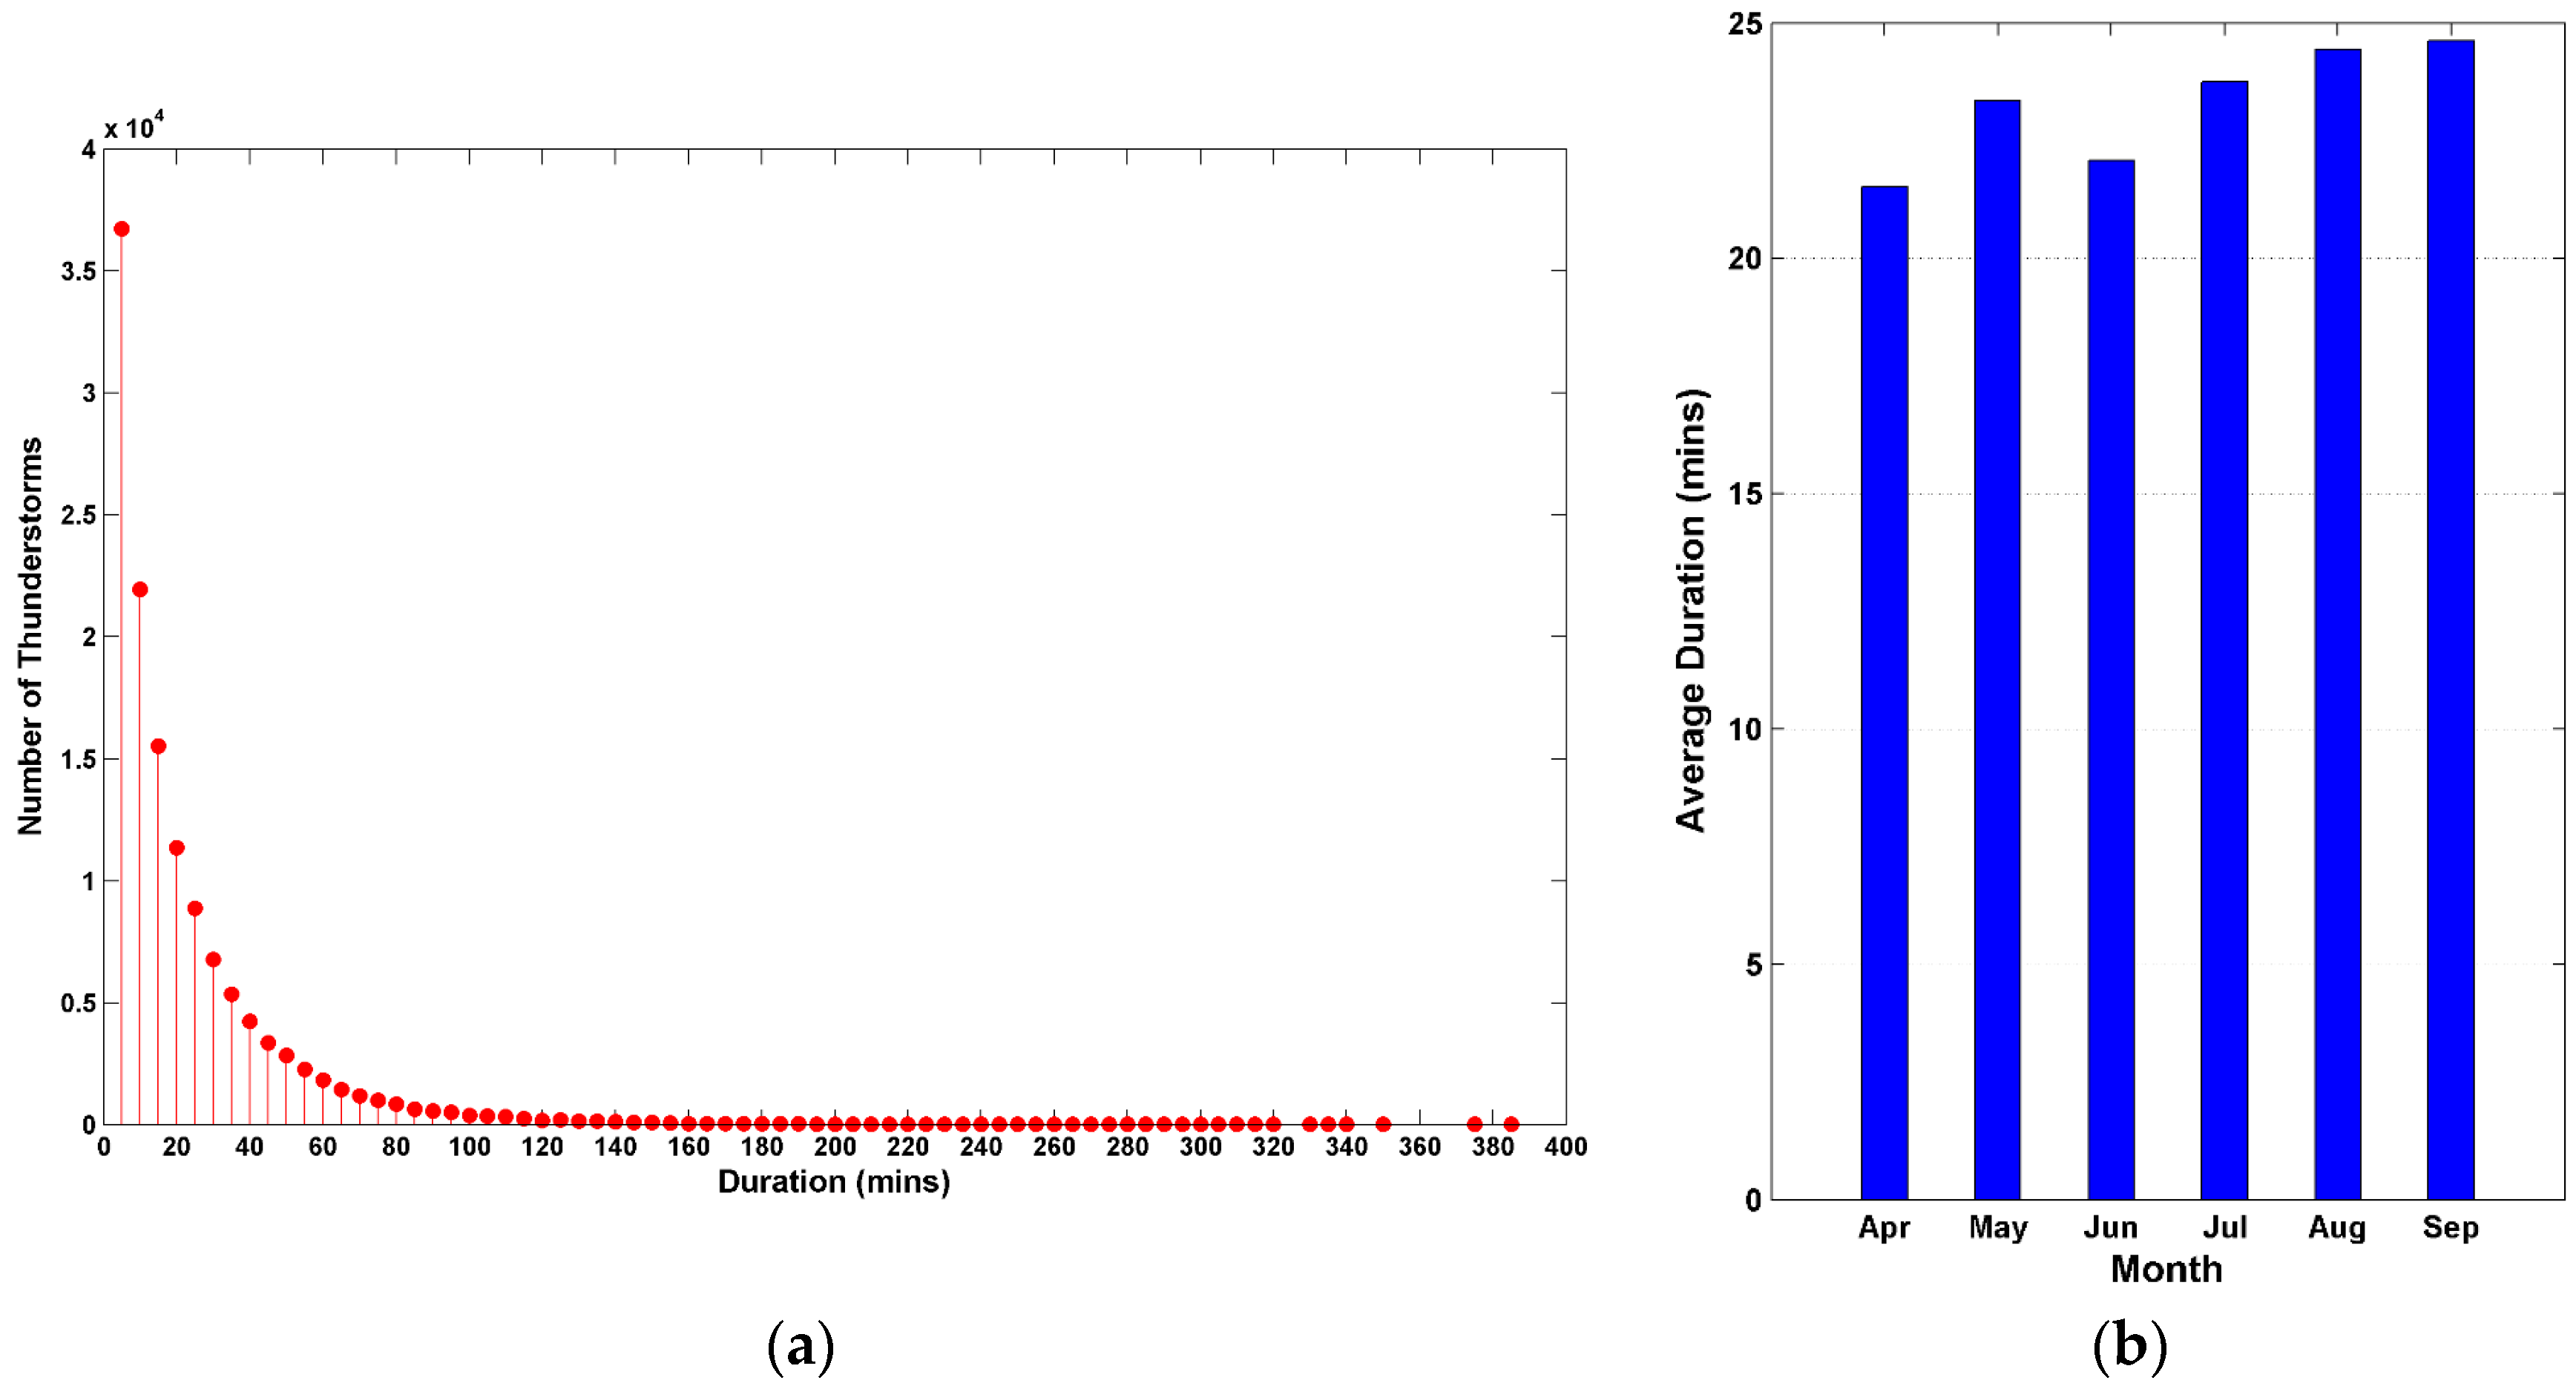
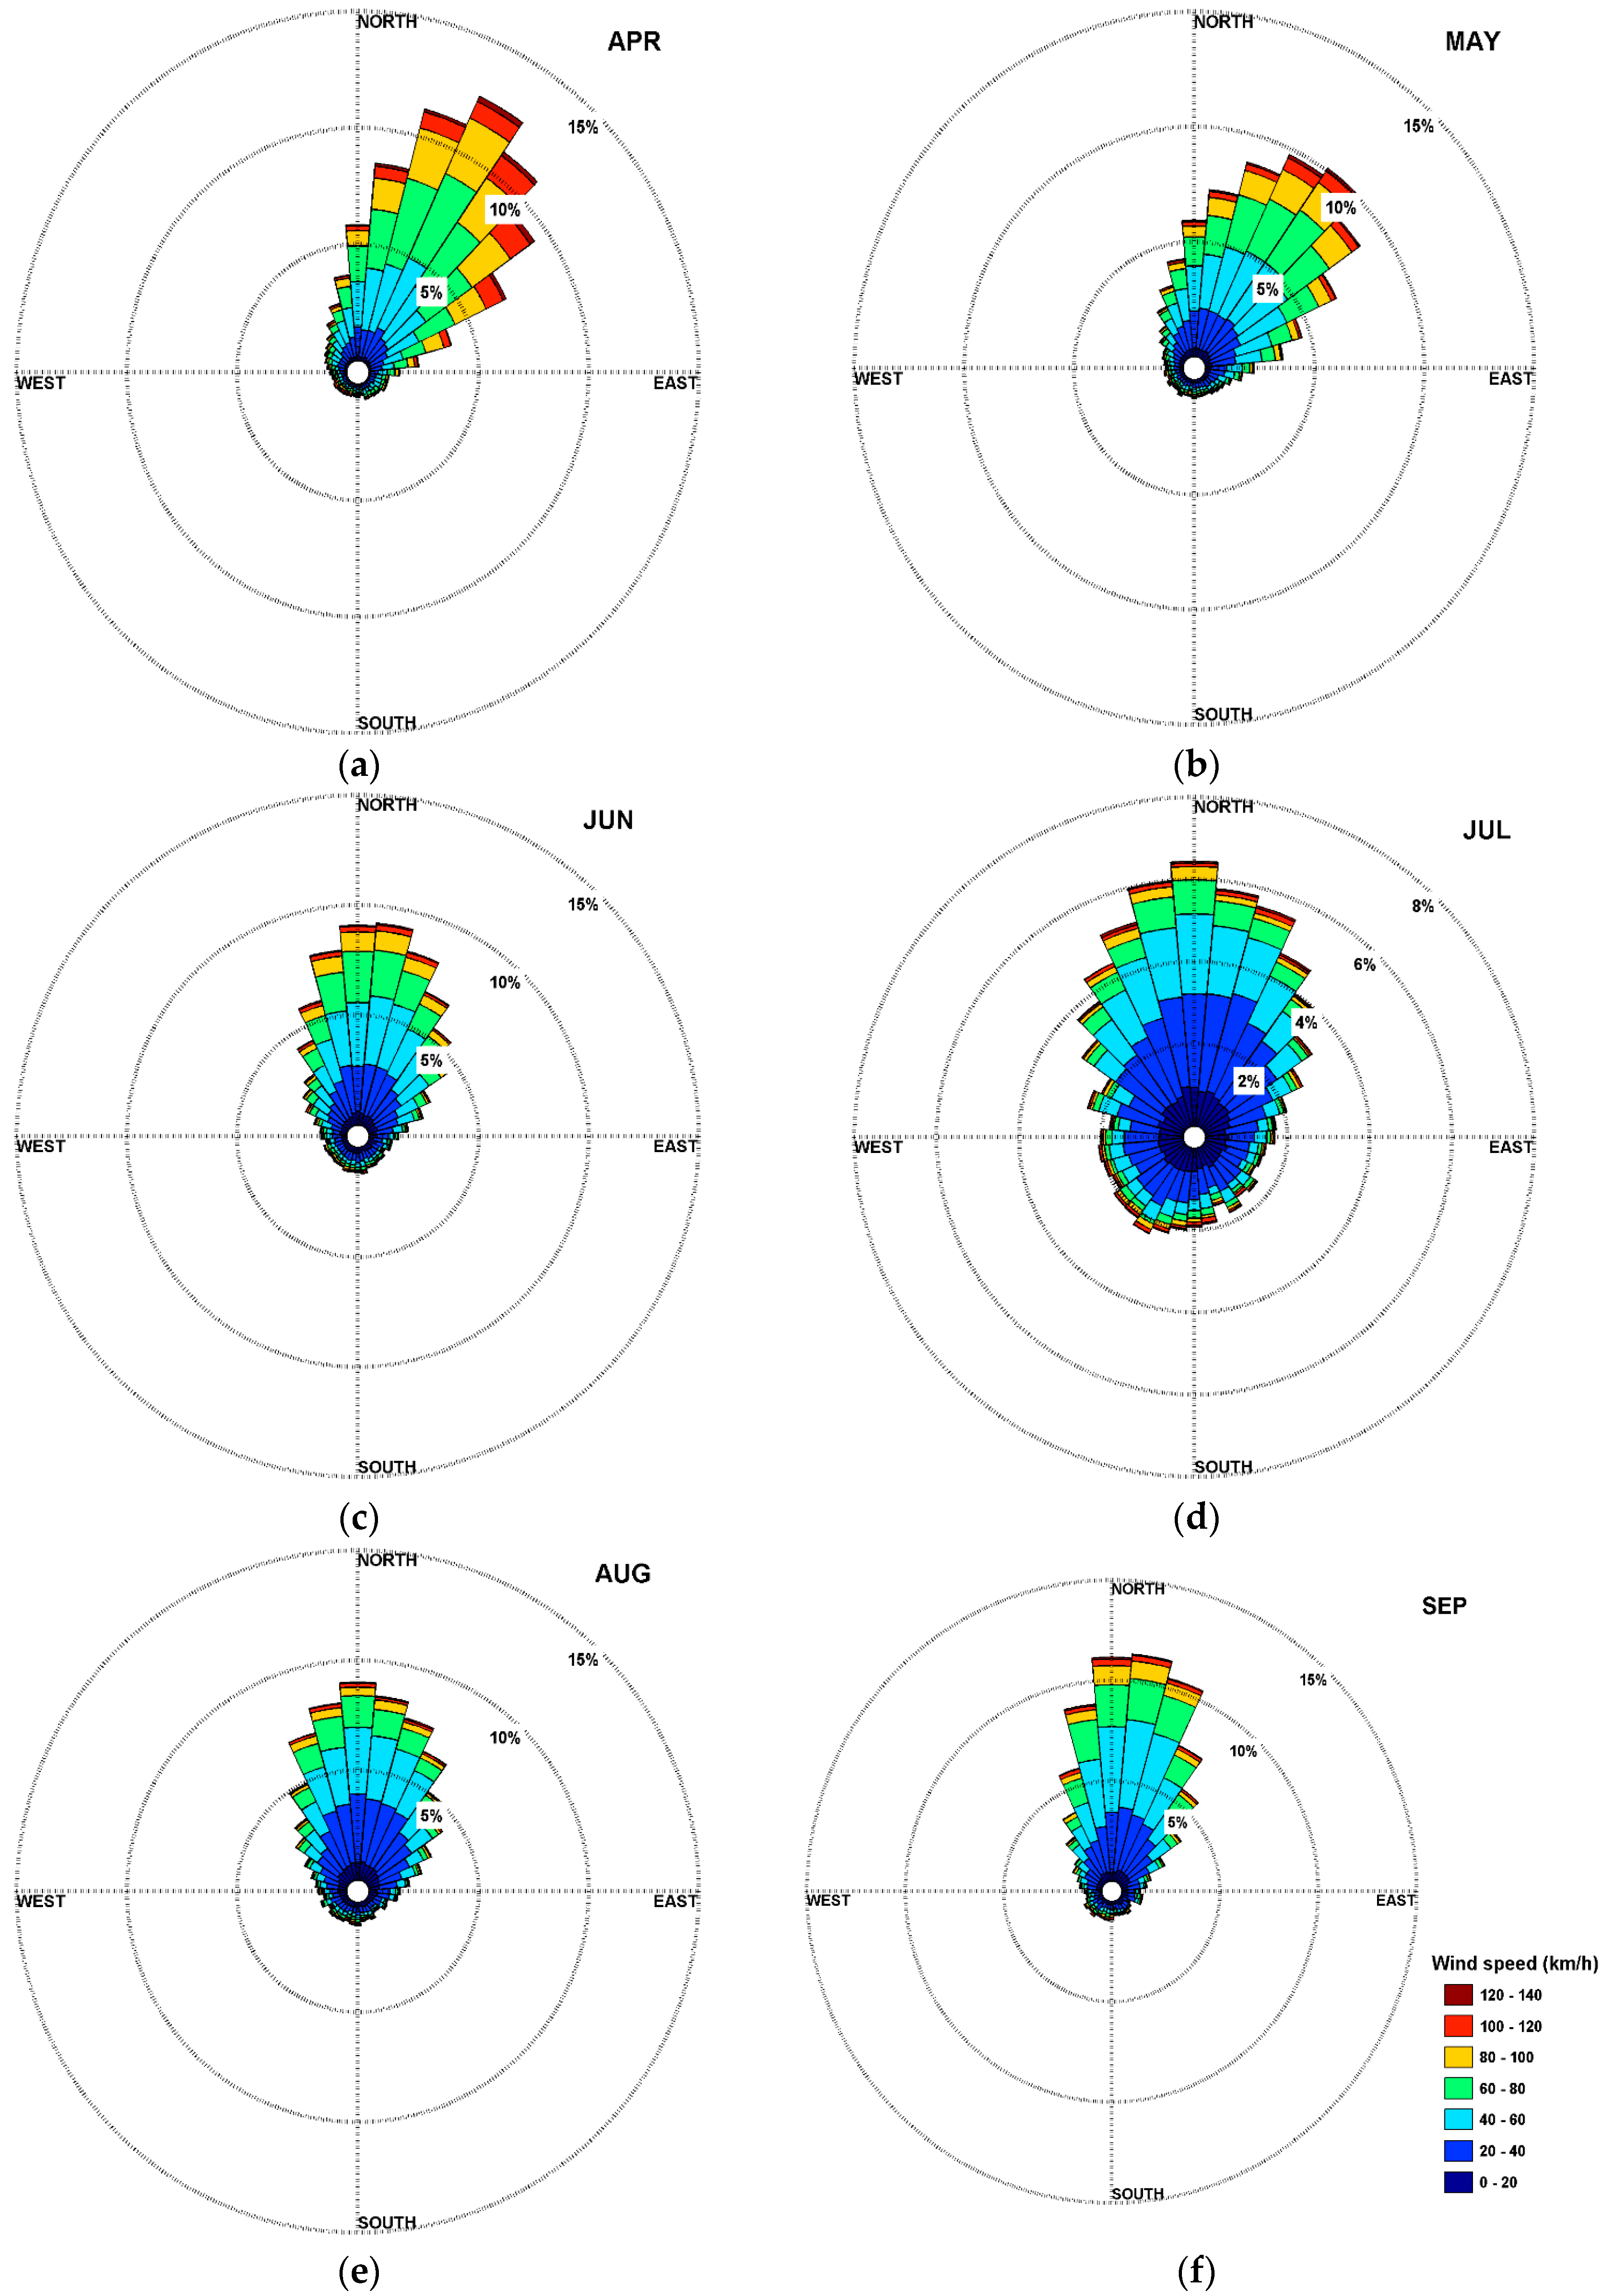
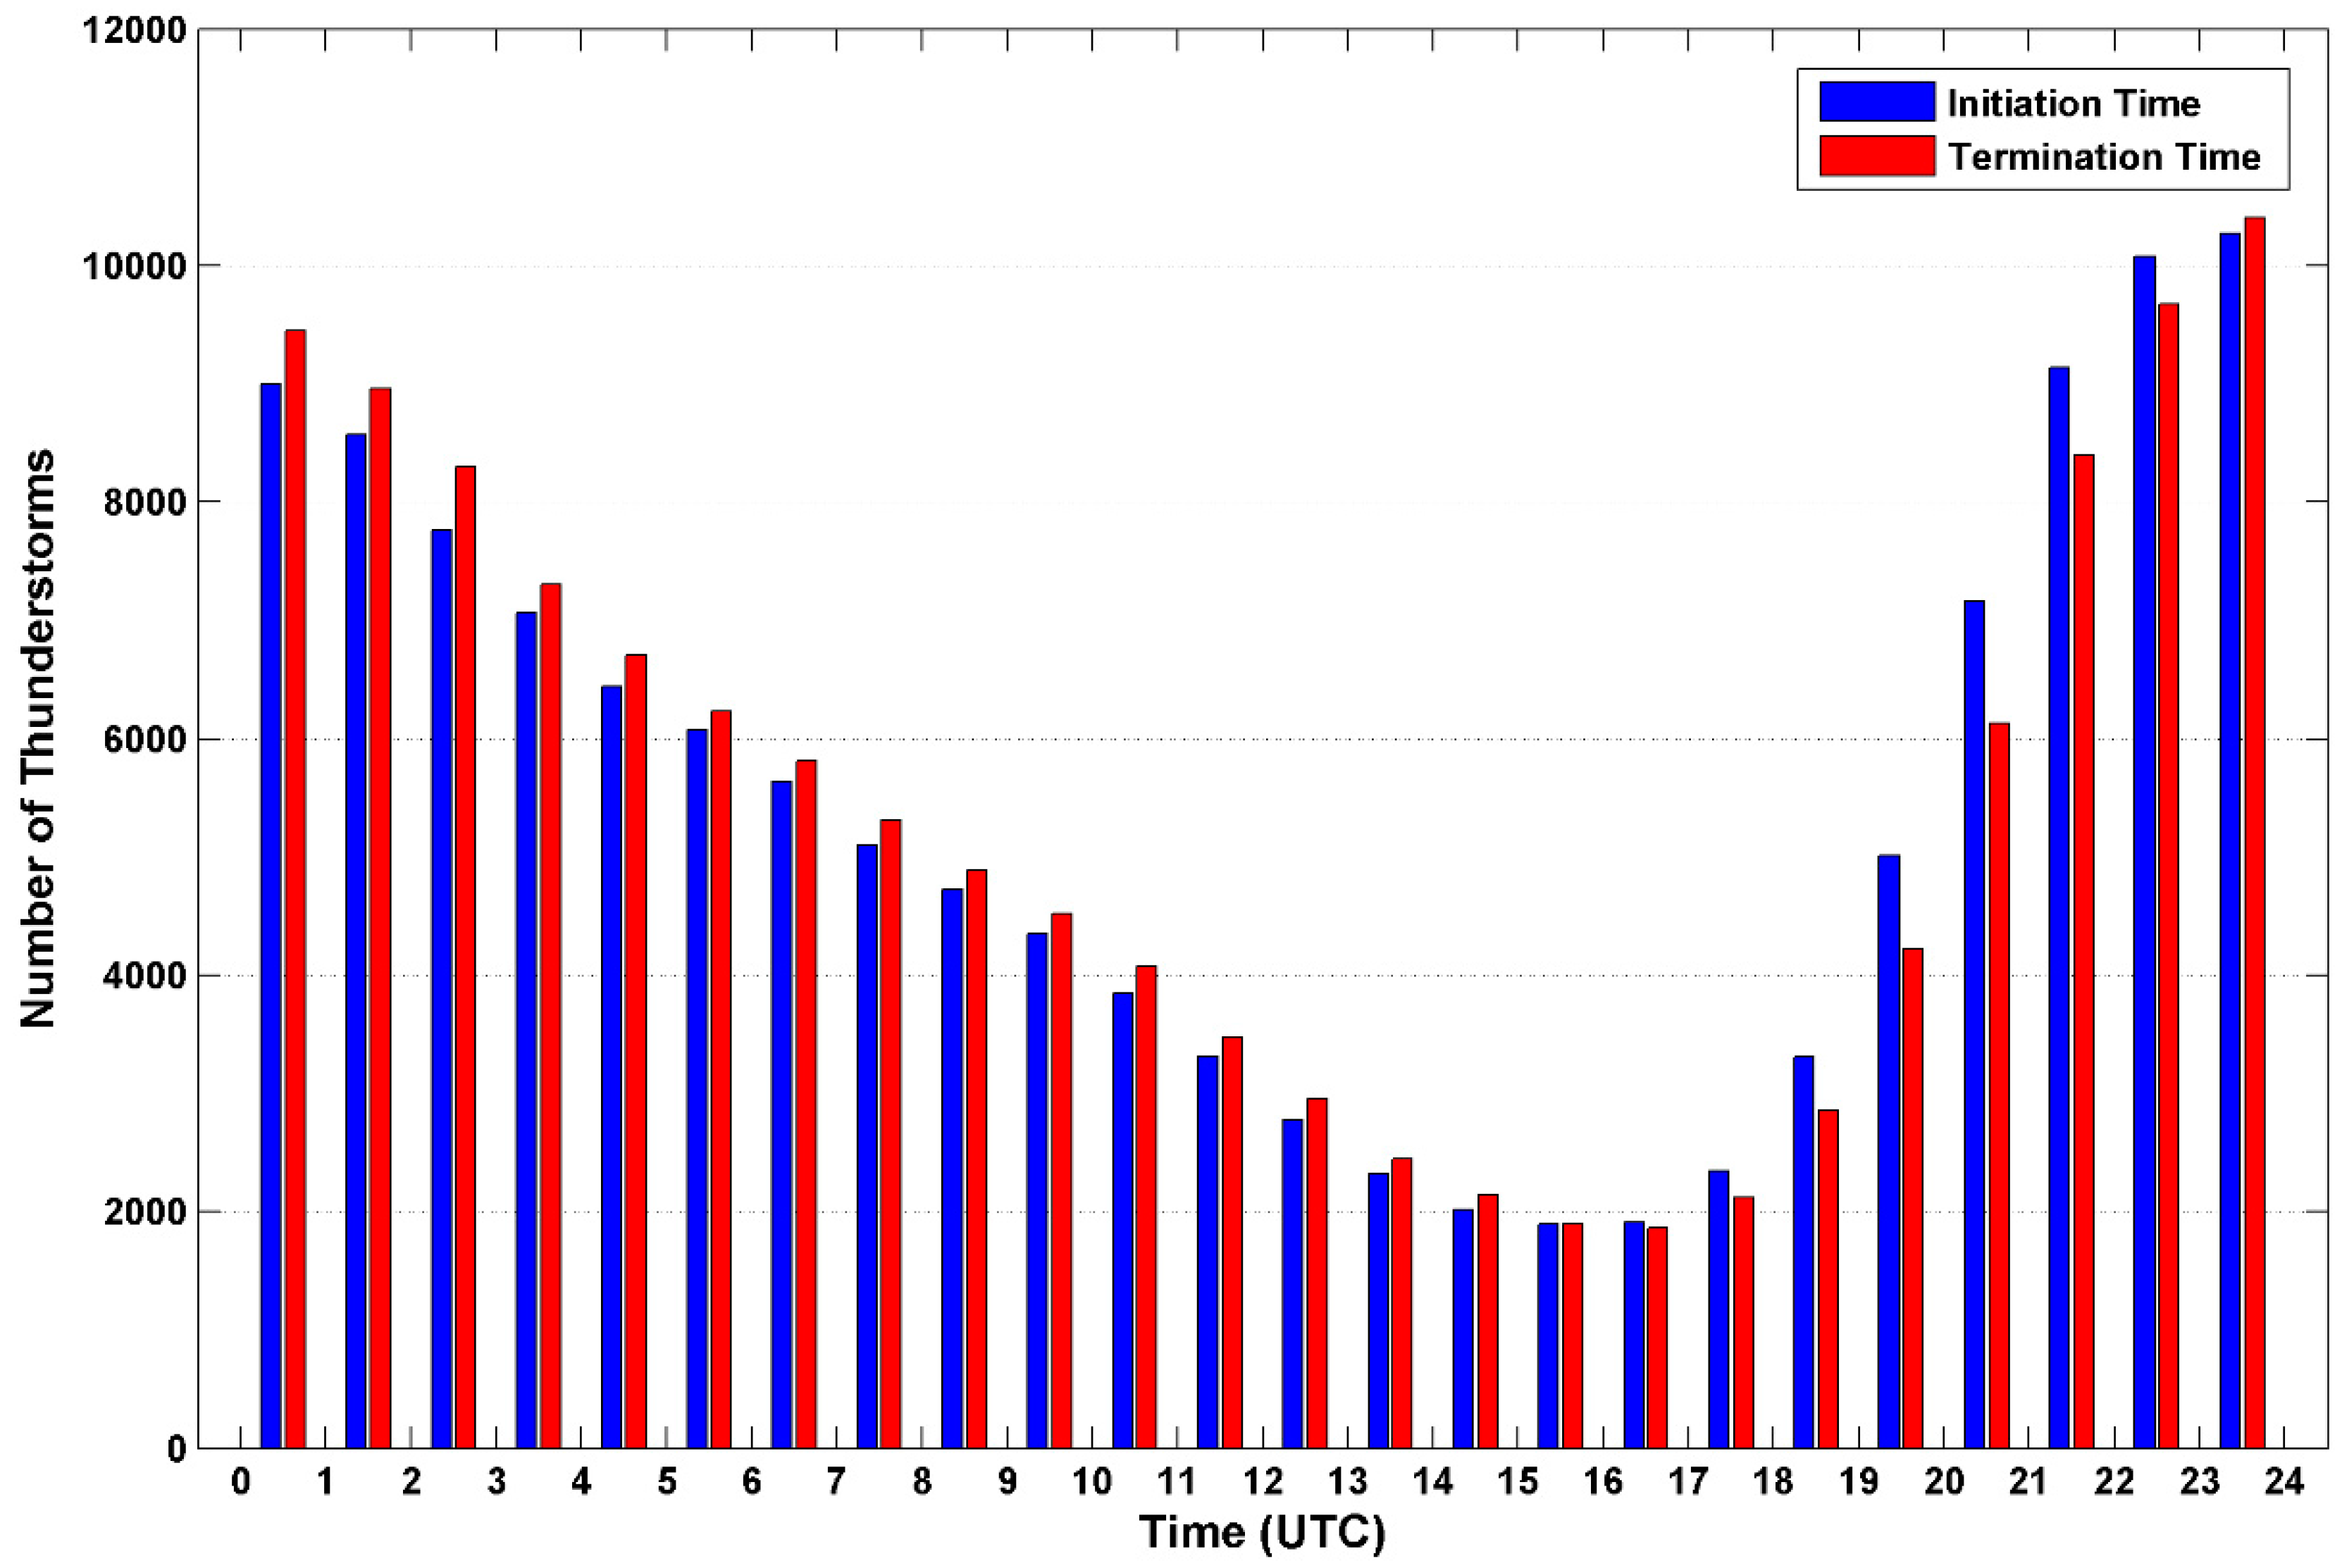
3.1. Temporal Characteristics

A total of 130,097 thunderstorms were identified across the study area during the five-year time period. Annual and monthly numbers of thunderstorms are shown in Figure 5a,b. On average there are 26,019 per year and the annual number of thunderstorms does not vary much with a coefficient of variation of 5.4% (Figure 5a). While 2010 has the most number of thunderstorms (27,824) during the study period, 2011 is the most inactive year (23,942). 2010 is 16% higher than the number in 2011. The number of thunderstorms in 2012 (26,164), 2013 (26,518), 2014 (25,649) does not differ greatly, which is around the mean number of thunderstorms (26,019).
Figure 5b shows dramatic variation in monthly numbers of thunderstorms. The number of thunderstorms increases dramatically from April (22,209) to the peak in May (27,528), a 23% increase. Then, thunderstorms decrease quickly from June to September. May to July accounts for approximately 59.2% of the total thunderstorms during the warm seasons, and they are the three most active thunderstorm months.
The histogram of thunderstorm durations (Figure 6a) shows an exponential decay distribution consistent with Hocker and Basara [4]. The average duration of the thunderstorms is 23.1 min, and 65.8% of the thunderstorms have a duration between 5 and 20 min. A total of 8914 out of 130,097 thunderstorms (6.9%) last more than one hour. If a thunderstorm extends outside of the study area, its duration time would be shortened. As a result, thunderstorm durations are underestimated for those that end outside of the domain. Figure 6b shows the average thunderstorm durations by month (April: 21.5 min, May: 23.4 min, June: 22.1 min, July: 23.7 min, August: 24.4 min, September: 24.6 min). Moreover, very long lived thunderstorms, which last over 3 hours, are more frequent between July and September than in other months. Tucker and Li [21] pointed out that thunderstorms had a longer lifespan in summer than in spring in central United States. In our study area, the average duration in summer (June to August) is 23.2 min, while the average duration in spring months (April and May) is 22.7 min, which verifies that long lived thunderstorms do favor summer months though long lived thunderstorms account for only a small portion of total thunderstorms (Figure 6a).
Figure 7 demonstrates the histograms of thunderstorm initiation and termination time. The most frequent time for thunderstorm initiation occurs from 2100 to 0000 UTC, which is in the early evening at local time and favors single cell and multicellular thunderstorms [21]. Thunderstorm termination is most common from 2100 to 0300 UTC.
Figure 8 shows the monthly rose diagrams of thunderstorm movement speed and direction. The monthly average movement speeds are 63.2 km/h (April), 53.8 km/h (May), 48.1 km/h (June), 38.1 km/h (July), 42.5 km/h (August), and 47 km/h (September), which are similar to the climatological analysis in North Dakota in Mohee and Miller [33]. For movement direction, thunderstorms are most common between 0 and 90 degrees, with an average thunderstorm vector from the southwest to northeast during the warm seasons from 2010 to 2014.

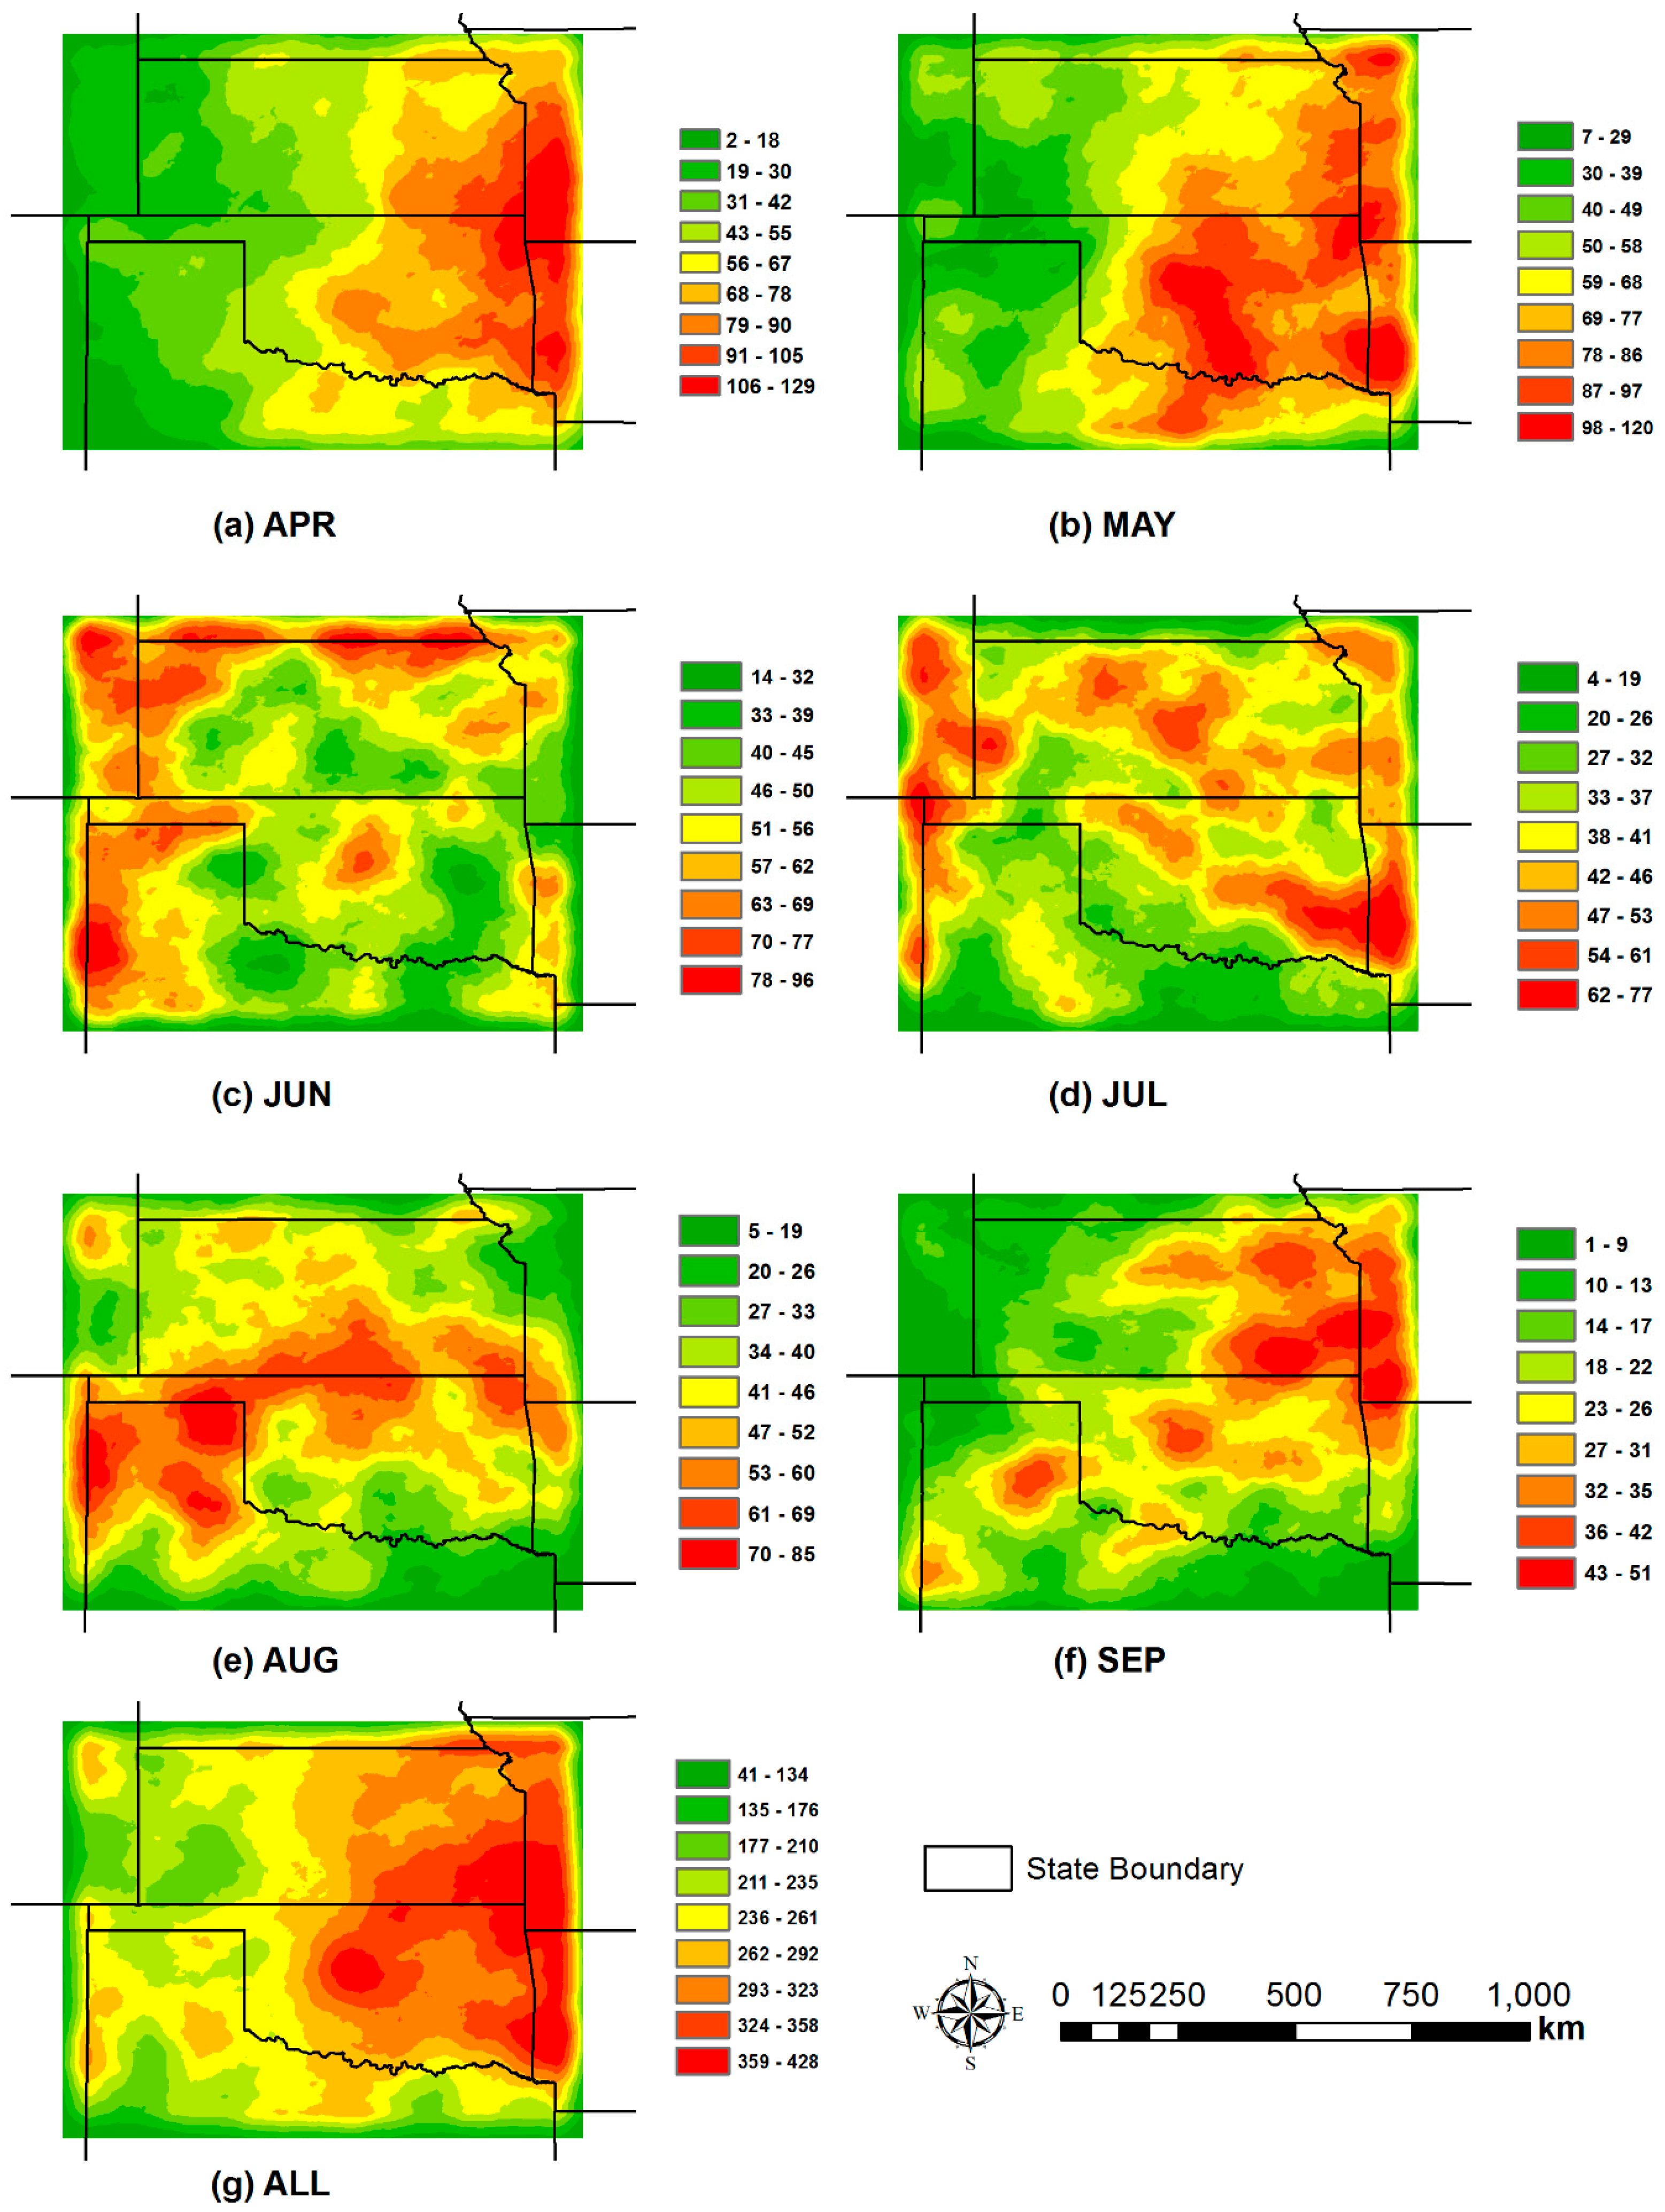
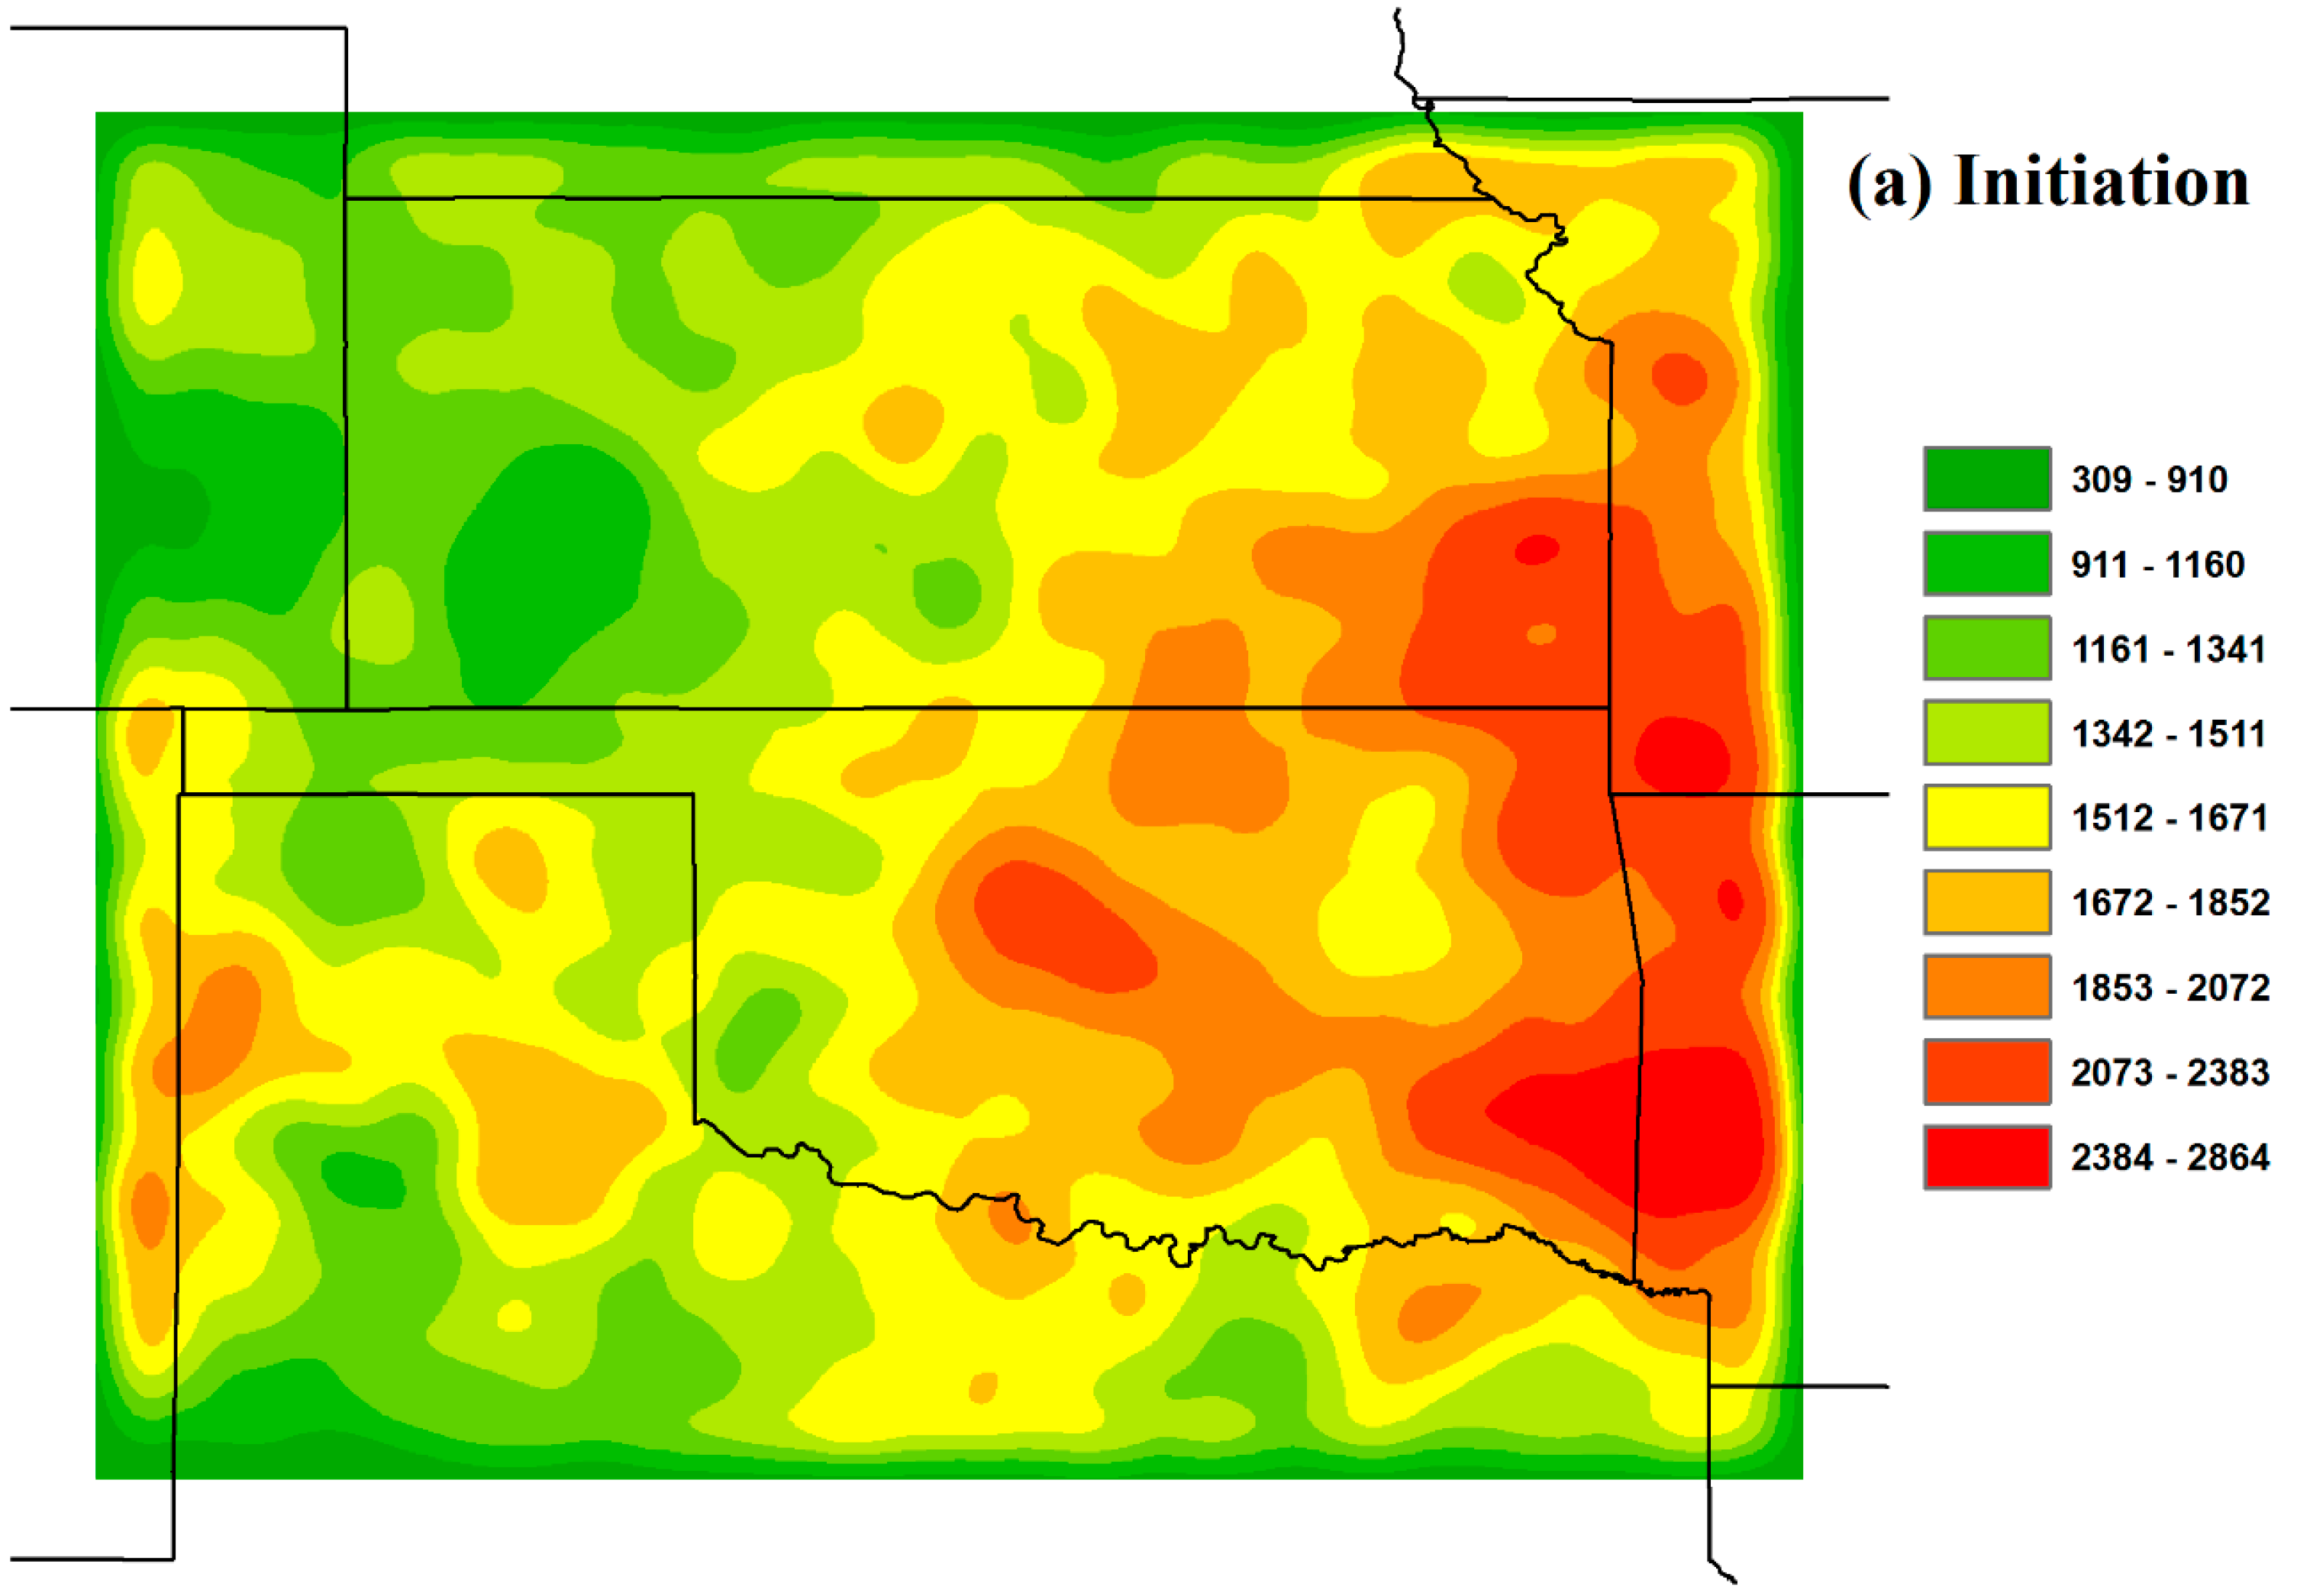
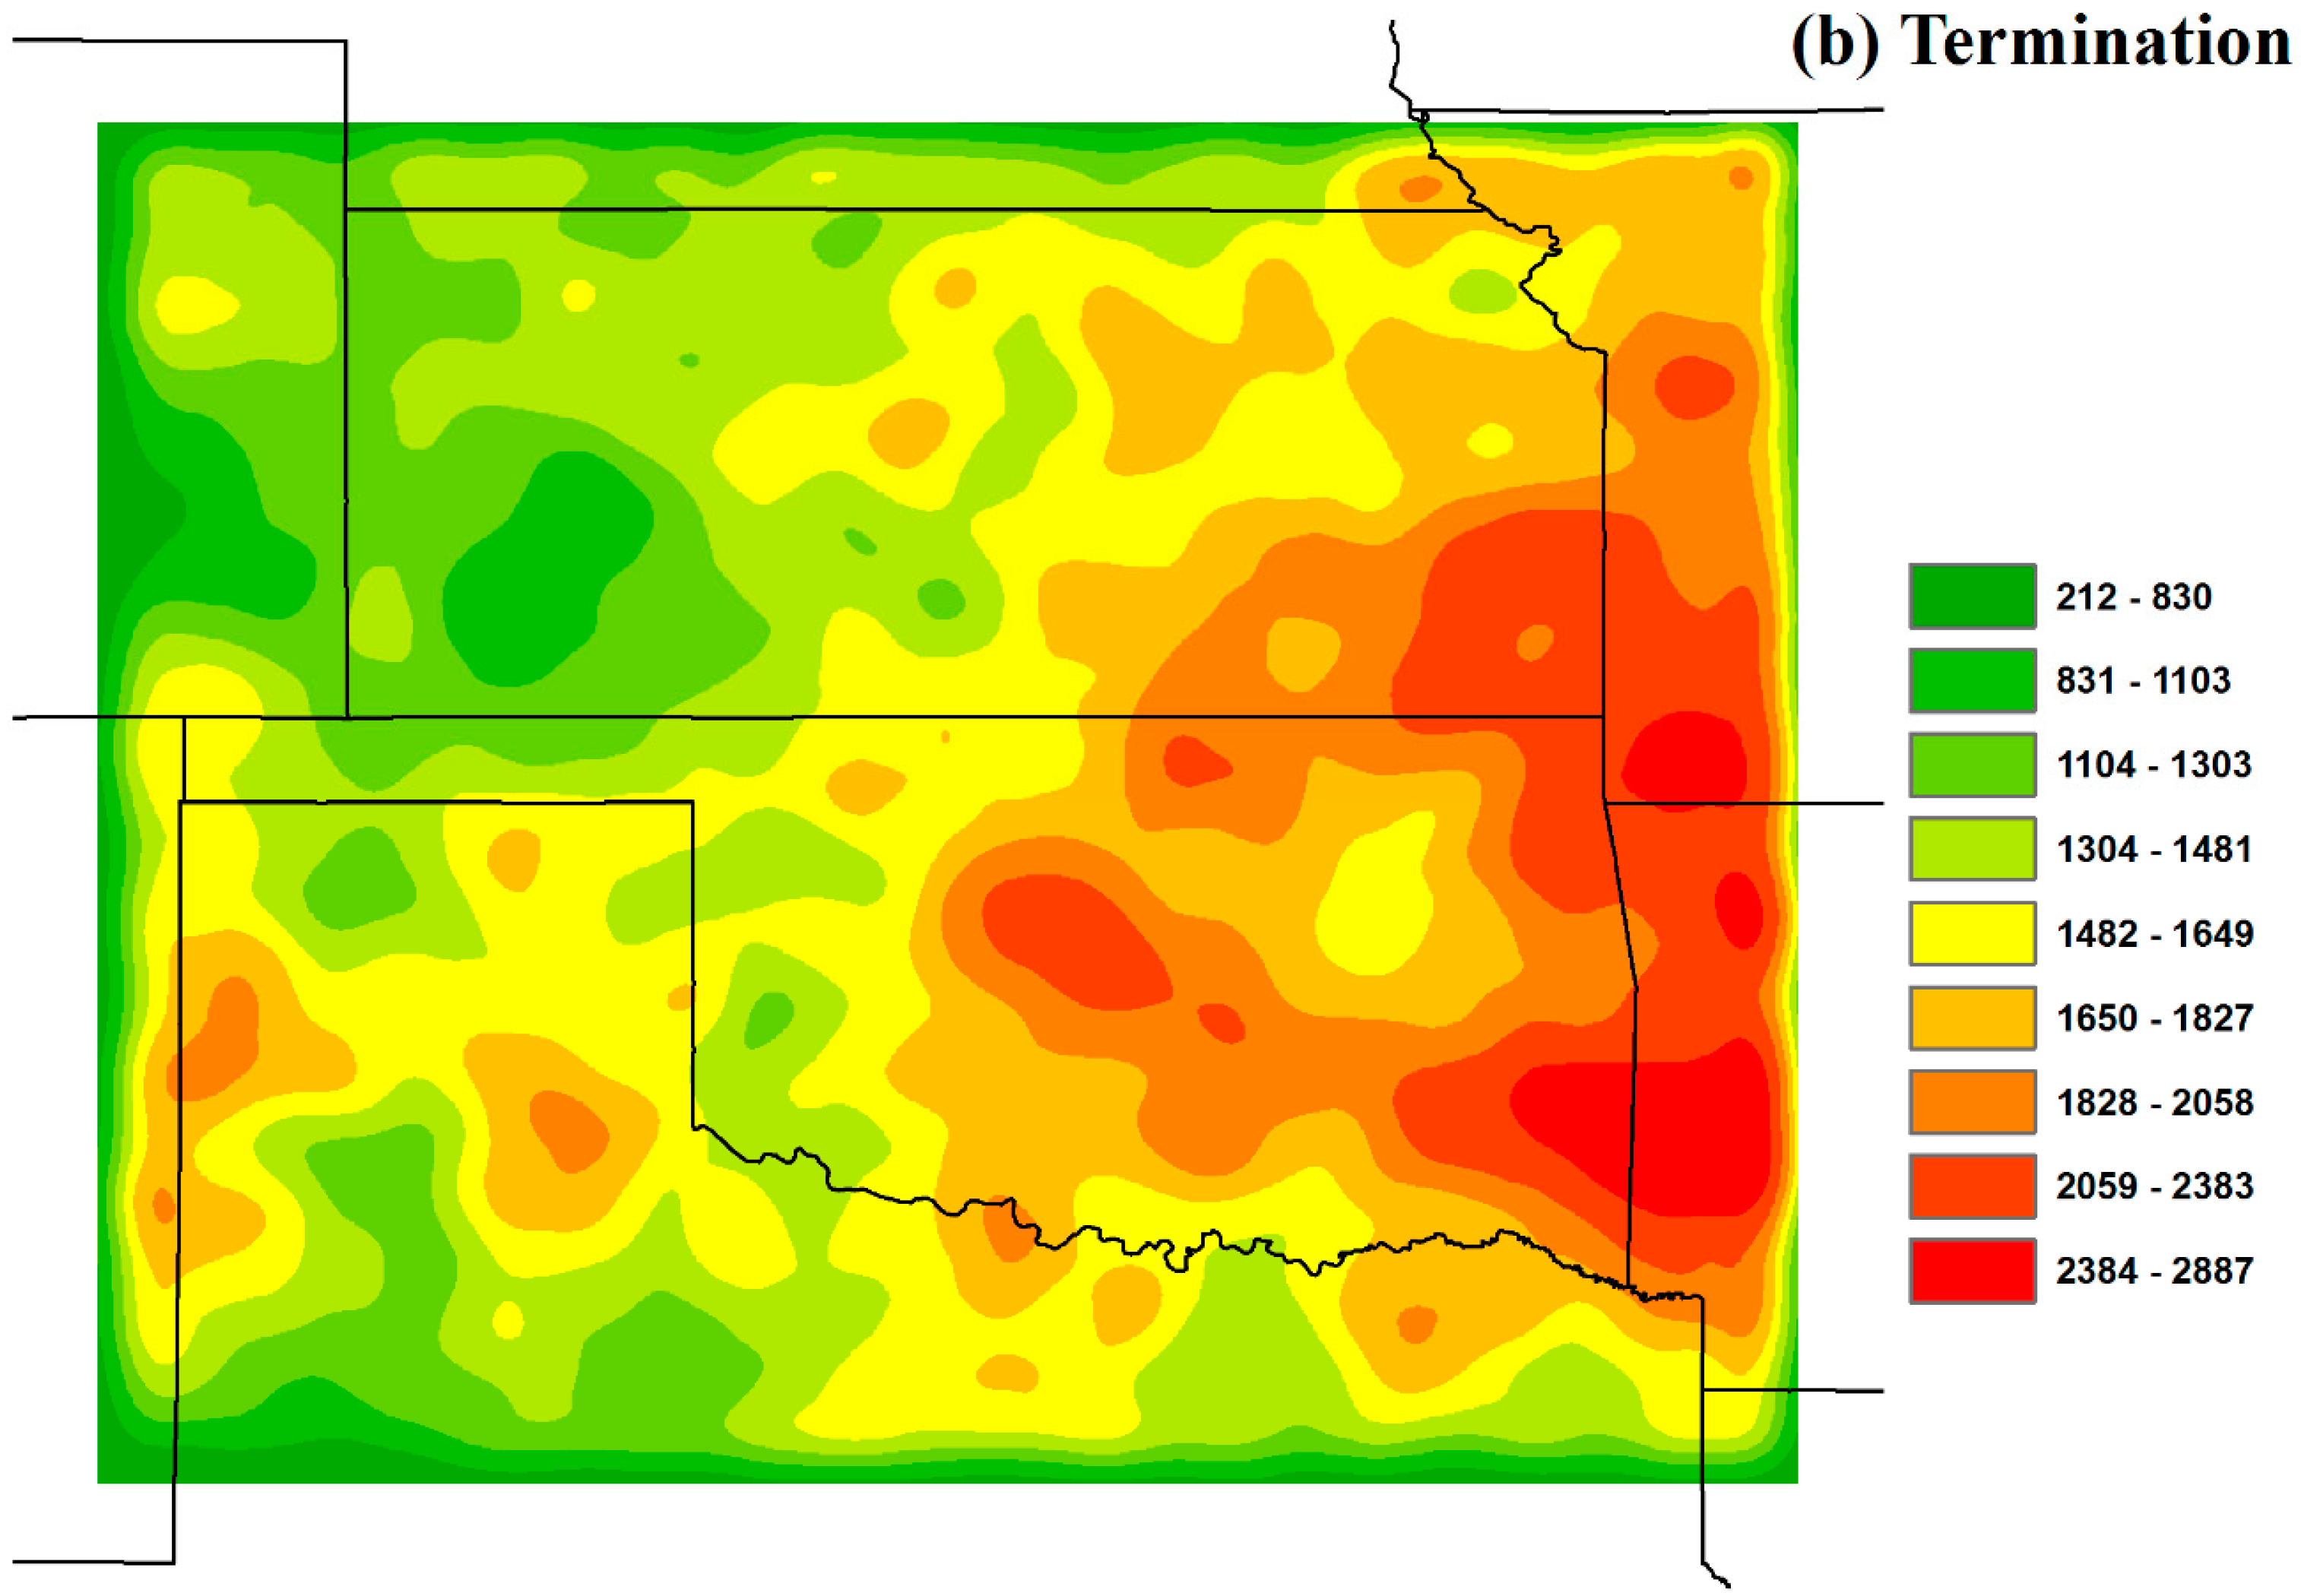
3.2. Spatial Characteristics

Using maximum reflectivity path, a density raster grid of thunderstorm trajectories with a cell size of 0.01 degrees (~1 km) was generated with a search radius of 0.5 degrees. The thunderstorms were divided into cumulative month periods to quantify the spatial and temporal variability of thunderstorm tracks from 2010 to 2014 (Figure 9). The spatial frequency analyses highlighted a number of hot spots across the study area during the limited 5-year period. Figure 9 shows thunderstorm density in each month from April to September, and all the months during the five-year period.
In April (Figure 9a), thunderstorm hot spots are mainly located in the east 1/3 of the study area, from central Kansas and Oklahoma to the eastern boundary. May has the peak of thunderstorm occurrences, and the thunderstorms are mainly concentrated in the eastern half of the study area, in southeastern Kansas, north-central Oklahoma and northeast Texas (Figure 9b). In June, there is a pronounced density decrease in thunderstorm occurrence (Figure 9c). Thunderstorms mainly occur in the western and northern quarters of the study area, which is different from those in April and May.
Thunderstorms further decrease gradually through July, August, and September (Figure 9d–f). In July, thunderstorm hot spots are scattered throughout the study area with some concentration in the state of Kansas and Oklahoma. In August, thunderstorms concentrate in the middle 1/3 of the study area covering southern Kansas, northern Oklahoma, and the most northern part of Texas. Thunderstorms concentrate along the border region between Kansas and Missouri and central Oklahoma in September.
Cumulative density in the six months (Figure 9g) shows that major thunderstorm activity occurs in the eastern half of the study area, especially centered at the border between Kansas, Missouri, Oklahoma, and Arkansas. For the three major states (Kansas, Oklahoma, and northern Texas) in the study area, the thunderstorm activities are mainly in Kansas (central to the most eastern region) and Oklahoma (north-central, northeastern and southeastern). Based on the land cover types in Figure 2, the land cover type of highest thunderstorm density is forest covering from central Oklahoma to the state of Arkansas in the study area. The second land cover type with active thunderstorms is crops, which are the main land cover stretching from central Kansas to the eastern boundary of the study area. The area in and around Oklahoma City is a hot spot for thunderstorm activity. The relationship between thunderstorm track and land cover types is discussed in Section 3.4, and a comparison between thunderstorm track in urban and rural areas is provided in Section 3.5.
For the locations of thunderstorm initiation and termination, we used the starting and ending points of a thunderstorm’s trajectory, i.e., the maximum reflectivity path. The initiation and termination point density maps are shown in Figure 10 for the 5-year thunderstorm study to quantify active areas of thunderstorm occurrences. Figure 10 demonstrates the kernel point density analyses determining the concentration of points within a search radius of 0.5 degrees of each initiation and termination point. The spatial distributions of initiation (Figure 10a) and termination density (Figure 10b) are quite similar with the greatest density on both maps found along the border between Oklahoma and Arkansas, and on the southern part of the border between Kansas and Missouri. In Kansas, initiation and termination hot spots are mainly located in the southeastern corner of Kansas. In Oklahoma, thunderstorm initiations and terminations are most concentrated in the eastern half of Oklahoma. In Texas, initiations and terminations are concentrated mainly in northern Texas and at the border between northern Texas and New Mexico. By overlaying the initiation and termination density maps with the land cover map (Figure 2), we find that forest and crop land cover types contain most initiation and termination hot spots located in the border between Kansas, Missouri, Oklahoma, and Arkansas. Urban areas also have higher initiation and termination density.

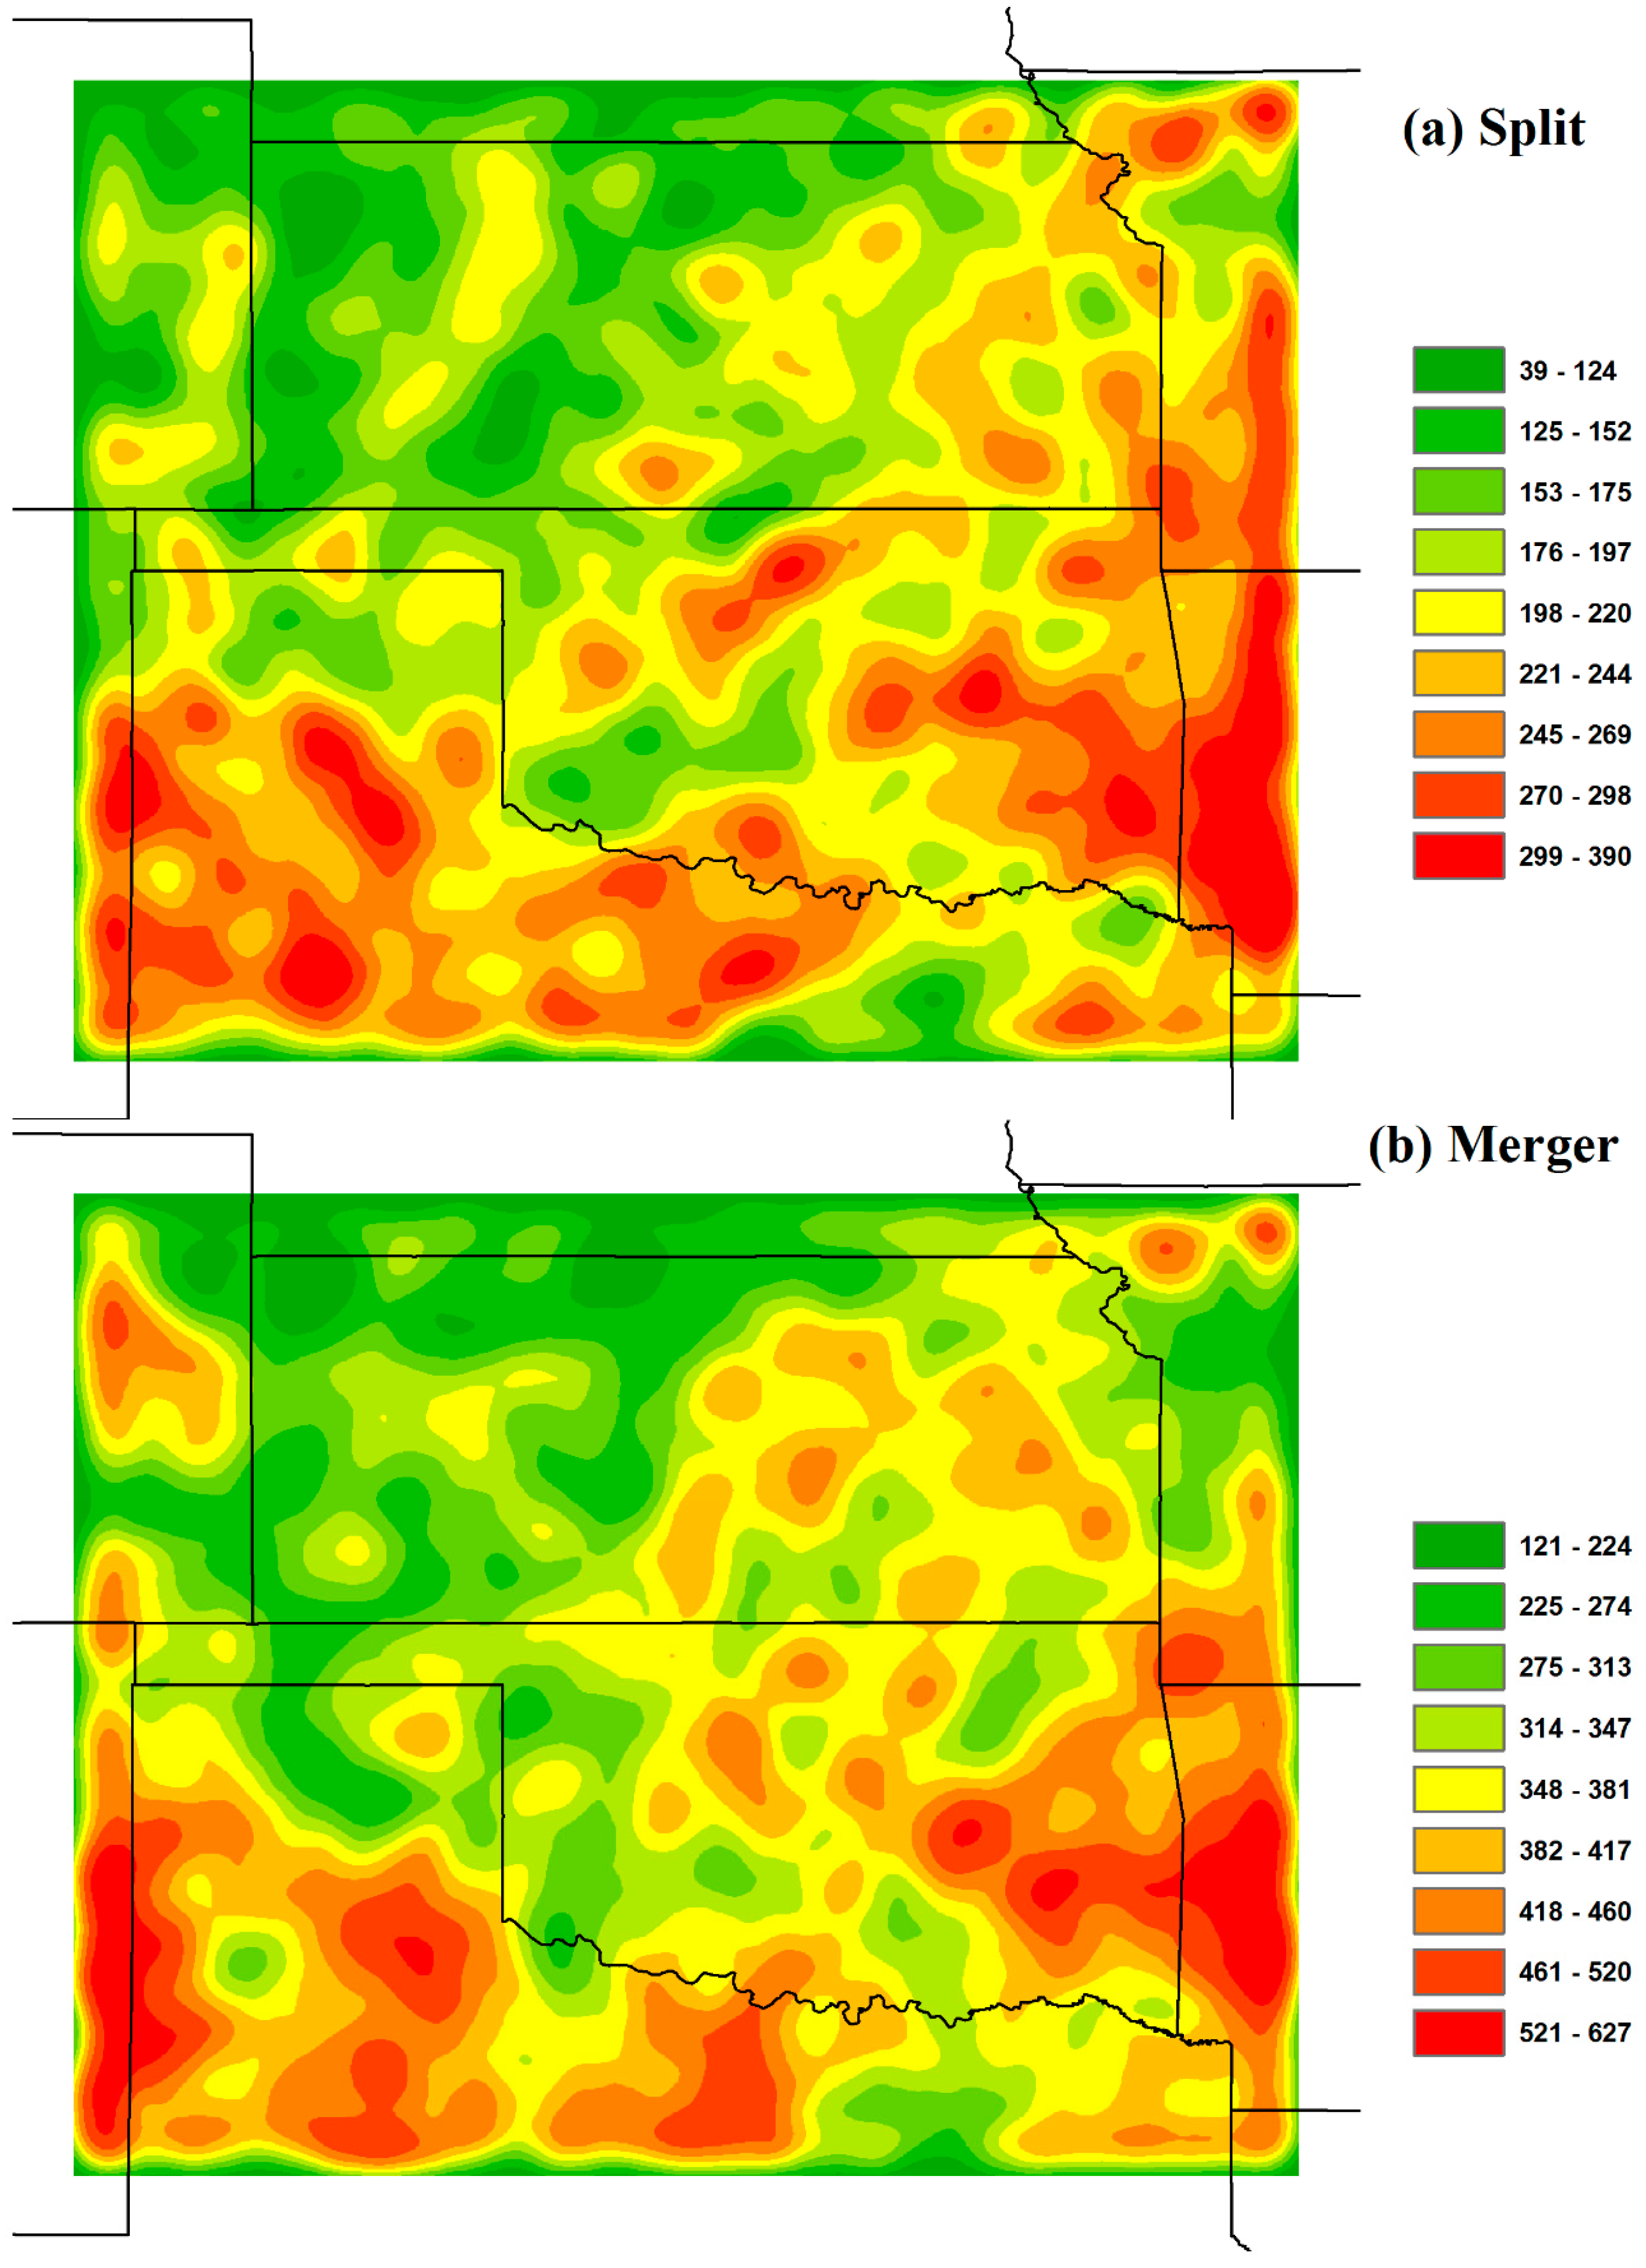
3.3. Thunderstorm Cell Split and Merger

Thunderstorm cells interact with each other in the process of storm development, and the interaction is a significant factor influencing storm evolution [34,35]. For example, two or more small thunderstorm cells may merge into a large thunderstorm cell, and a large thunderstorm cell may split into a number of small thunderstorm cells. The directed graph representation of thunderstorm life cycles provides an opportunity to study their split and merger characteristics. In a directed graph, if the in-degree number of a node (a thunderstorm cell) is greater than 1, a merger occurs with the thunderstorm cell. For example, the in-degree of thunderstorm cell d is 2, because cell b and c merge into cell d (Figure 4). If the out-degree number of a node is greater than 1, then a split occurs from the thunderstorm cell. For example, the out-degree of thunderstorm cell d is 3, because it splits into cells f, g, and e (Figure 4). Based on the in-degree and out-degree calculated for each thunderstorm cell, the split and merger density maps (a raster grid of cell size of 0.01 degrees) with a search distance of 0.5 degrees are shown in Figure 11.
Among all the thunderstorms (130,097), about 13% (17,295) of the thunderstorms have splits, and 22% (29,837) of the thunderstorms have mergers in their life cycles. Compared to splits, there are more mergers existing in the life spans of thunderstorm events. For splits, most of thunderstorm cells only split into two or three smaller thunderstorm cells. The largest split density is around 400 count/km2, but the greatest merger density reaches around 600 count/km2. Most thunderstorm cells have only two or three thunderstorm cells merge into a large thunderstorm cell. The average size of thunderstorm cells with splits is 226 km2, and the average size of thunderstorm cells after mergers is 247 km2.
As for the spatial distribution of splits and mergers (Figure 11), their hot spots have some similarities. They are mainly located along the border between Oklahoma and Arkansas and the border between Kansas and Missouri, in central Oklahoma, and northern Texas. When comparing Figure 10 and Figure 11, the biggest difference is in the panhandle area of northern Texas. There are not many initiation and termination hot spots in the area. However, splits and mergers occur frequently in the region. This means that the thunderstorms do not initiate or terminate often in northern Texas compared to other states in the study area. However, there are also a lot of splits and mergers occurring in Texas during the thunderstorm life cycles. In Kansas and Oklahoma, split and merger hot spots have similar spatial patterns seen in initiation and termination in the eastern part of the study area.
For land cover types (Figure 2), we see that splits and mergers mainly occur in forest areas where they have the highest density. This is the case in the states of Oklahoma, Arkansas, and Missouri. For Texas and Kansas, splits and mergers mainly occur in crop and grass areas. Overall, thunderstorm initiation, termination, split, and merger favor the forest and crop land cover types in the study area. In the next section, we present a statistical analysis of the relationship between thunderstorm tracks and land cover types.

3.4. Relationship between Thunderstorm Occurrences and Land Cover Types

Many factors can affect the locations of thunderstorms’ initiation, termination, split, and merger, such as the dry line from western Oklahoma northward through western Kansas over the Great Plains in this study area [36] and topographic effects [26,37]. In this study, the relationships between thunderstorm track, initiation, termination, split, merger density and seven major land cover types are examined quantitatively (Table 1). The densities were obtained by dividing the results in Figure 9g, Figure 10, and Figure 11 by the area of each land cover type. From Table 1, thunderstorm track, initiation, and termination have the same rankings over the seven major land cover types in the study area. Forests, urban areas, and crops are the top three land cover types favoring thunderstorm events, and grasses have the lowest ranking. The highest thunderstorm tracks in forest land cover may be because dense forests have greater ability to store and release moisture, which is likely to increase aerodynamic roughness values [37,38]. Most of the dense forests are in the mountainous areas of the Ozark National Forest and Ouachita National Forest in the study area. Meanwhile, there are also thunderstorm hot spots in Wichita Mountains and Ouachita Mountains located in Oklahoma. Tucker and Li [21] also found that mountainous areas had more storms than flatter areas. For urban areas, a strong urban heat island (UHI) can affect vertical mixing, raise the planetary boundary layer height, and weaken the capped inversion intensity, which are conductive to the development of convection [39,40]. Niyogi et al., [41] also used radar data to verify that urban areas alter the initiation and intensity of thunderstorms due to land surface heterogeneity, which favors convective initiation or preconvection [42].
The split and merger densities have different rankings over the seven major land cover types. Forests, crops, and grasses are the favorite land cover types triggering splits and mergers during thunderstorm life cycles. The split and merger densities in urban areas are not very high.

3.5. Comparison of Thunderstorm Occurrences between Urban and Rural Areas

A number of studies indicated that urban areas could change local climate because of higher heat content, increased surface roughness, and boundary layer instability associated with urbans [43,44]. In this section, our research examines whether urban areas augment warm-season thunderstorm activities by comparing thunderstorm tracks between urban and rural areas. Three large cities, Kansas City, Oklahoma City, and Dallas (Figure 2), in the study area were chosen. We identified urban areas that contain four NLCD land cover classifications including Developed, Open Space (21), Developed, Low Intensity (22), Developed, Medium Intensity (23), and Developed, High Intensity (24). This produces large urban polygons for each of the metropolitan areas. Those urban polygons also include some non-urban land cover types such as grasses and water due to their containment in the larger urban polygon. After delineating the three urban polygons, rural areas were delineated as the buffers of 10 km (Kansas City), 10 km (Oklahoma City), and 20 km (Dallas) surrounding the urban polygons. Table 2 shows the statistical significance for the mean differences of thunderstorm tracks (Figure 9g) and initiations (Figure 10a) between the urban and rural areas around the three cities using the t-test at a 5% significance level.
From Table 2, we see that Kansas City and Oklahoma City have statistically significant increases in warm-season thunderstorm occurrences and initiations in comparison to their rural counterparts because the p value is less than 0.05 and the t value is positive. However, Dallas urban and rural areas have no significant differences (p value is greater than 0.05) in both thunderstorm tracks and initiations indicating that the Dallas urban area may not favor thunderstorms or it is masked by other circulations and convergence mechanisms induced by non-urban LULC.

4. Conclusions

This research studies spatial and temporal characteristics of thunderstorm life cycles in central United States, mainly covering Kansas, Oklahoma, and northern Texas during the warm seasons from 2010 to 2014. An improved centroid-based thunderstorm tracking algorithm was utilized to identify thunderstorm life cycles from radar reflectivity data and cloud-to-ground lightning data. The recorded life cycle of a thunderstorm includes initiation, development, termination, merger, and split. A directed graph model was used to represent the life cycles and to study the interactions of thunderstorm cells (split and merger), and the maximum reflectivity path as a polyline was used to generalize the life cycle of a thunderstorm. Thunderstorm life cycles and their attributes were stored in a GIS database and GIS was used to visualize, query, and analyze thunderstorm life cycles.
Our climatological analyses indicate a strong peak of thunderstorm occurrences in May. Most thunderstorms (65.8%) have a duration from 5 to 20 min. Thunderstorm initiation is most frequent from 2100 to 0000 UTC, and the thunderstorm termination is most common from 2100 to 0300 UTC.
Major thunderstorm activities are in the eastern part of the study area, especially at the border between Kansas, Missouri, Oklahoma, and Arkansas. We found initiation and termination hot spots along the border between Oklahoma and Arkansas and the southern end at the border between Missouri and Kansas. Based on the directed graph representation, we found that splits and mergers are mainly located along the border between Oklahoma and Arkansas and the border between Kansas and Missouri, in central Oklahoma, and in the central and northern part of Texas.
We also linked thunderstorms to land cover types, and found that thunderstorms favor forests and urban areas. Forests, crops, and grasses may trigger splits and mergers during the life cycle of a thunderstorm. Statistical analyses demonstrated that the urban areas in Kansas City and Oklahoma City had significantly higher thunderstorm occurrences than the surrounding rural areas, though the Dallas urban area did not show this feature.
The methods and analyses presented in this work demonstrate how to apply GIS representations and spatial analyses to meteorological studies. Atmospheric science has many potentials to incorporate GIS due to the spatiotemporal nature of atmospheric systems. For example, it is also interesting to represent and analyze other meteorological phenomena such as hurricanes and heat waves. We would also like to enlarge the spatiotemporal coverage of the radar and lightning data to study thunderstorm characteristics for the entire United States, and explore the relationships between thunderstorms and other factors such as terrain in the future.

Acknowledgments

We thank Vaisala Corporation for providing cloud-to-ground lightning data and David Rahn at the Department of Geography & Atmospheric Science, University of Kansas for comments and improving the English. We would also like to thank the two anonymous reviewers for providing valuable comments and suggestions which have helped improve the manuscript greatly.

Author Contributions

Both authors contributed to this paper extensively. Weibo Liu and Xingong Li designed the research. Weibo Liu implemented the experiments and wrote the manuscript. Xingong Li discussed the results and edited the manuscript.

Conflicts of Interest

The authors declare no conflict of interest.

References

  1. Han, L.; Fu, S.; Yang, G.; Wang, H.; Zheng, Y.; Lin, Y. A stochastic method for convective storm identification, tracking and nowcasting. Prog. Nat. Sci. 2008, 18, 1557–1563. [Google Scholar] [CrossRef]
  2. Hocker, J.E.; Basara, J.B. A geographic information systems-based analysis of supercells across Oklahoma from 1994 to 2003. J. Appl. Meteorol. Climatol. 2008, 47, 1518–1538. [Google Scholar] [CrossRef]
  3. Feidas, H.; Cartalis, C. Application of an automated cloud-tracking algorithm on satellite imagery for tracking and monitoring small mesoscale convective cloud systems. Int. J. Remote Sens. 2005, 26, 1677–1698. [Google Scholar] [CrossRef]
  4. Hocker, J.E.; Basara, J.B. A 10-year spatial climatology of squall line storms across Oklahoma. Int. J. Climatol. 2008, 28, 765–775. [Google Scholar] [CrossRef]
  5. Machado, L.A.T.; Rossow, W.B.; Guedes, R.L.; Walker, A.W. Life cycle variations of mesoscale convective systems over the Americas. Mon. Weather. Rev. 1998, 126, 1630–1654. [Google Scholar] [CrossRef]
  6. Mathon, V.; Laurent, H. Life cycle of Sahelian mesoscale convective cloud systems. Q. J. R. Meteorol. Soc. 2001, 127, 377–406. [Google Scholar] [CrossRef]
  7. Morel, C.; Senesi, S. A climatology of mesoscale convective systems over Europe using satellite infrared imagery. I: Methodology. Q. J. R. Meteorol. Soc. 2002, 128, 1953–1971. [Google Scholar] [CrossRef]
  8. Morel, C.; Senesi, S. A climatology of mesoscale convective systems over Europe using satellite infrared imagery. II: Characteristics of European mesoscale convective systems. Q. J. R. Meteorol. Soc. 2002, 128, 1973–1995. [Google Scholar] [CrossRef]
  9. Lakshmanan, V.; Smith, T. An objective method of evaluating and devising storm-tracking algorithms. Weather Forecast. 2010, 25, 701–709. [Google Scholar] [CrossRef]
  10. Dixon, M.; Wiener, G. TITAN: Thunderstorm identification, tracking, analysis, and nowcasting-A radar-based methodology. J. Atmos. Ocean. Technol. 1993, 10, 785–797. [Google Scholar] [CrossRef]
  11. Johnson, J.; MacKeen, P.L.; Witt, A.; Mitchell, E.D.; Stumpf, G.J.; Eilts, M.D.; Thomas, K.W. The storm cell identification and tracking algorithm: An enhanced WSR-88D algorithm. Weather Forecast. 1998, 13, 263–276. [Google Scholar] [CrossRef]
  12. Meyer, V.K.; Höller, H.; Betz, H.D. Automated thunderstorm tracking: Utilization of three-dimensional lightning and radar data. Atmos. Chem. Phys. 2013, 13, 5137–5150. [Google Scholar] [CrossRef]
  13. Zahraei, A.; Hsu, K.; Sorooshian, S.; Gourley, J.J.; Hong, Y.; Behrangi, A. Short-term quantitative precipitation forecasting using an object-based approach. J. Hydrol. 2013, 483, 1–15. [Google Scholar] [CrossRef]
  14. Liu, W.; Li, X.; Rahn, D.A. Storm event representation and analysis based on a directed spatiotemporal graph model. Int. J. Geogr. Inf. Sci. 2016, 30, 948–969. [Google Scholar] [CrossRef]
  15. Tuttle, J.D.; Foote, G.B. Determination of the boundary layer airflow from a single Doppler radar. J. Atmos. Ocean. Technol. 1990, 7, 218–232. [Google Scholar] [CrossRef]
  16. Li, L.; Schmid, W.; Joss, J. Nowcasting of motion and growth of precipitation with radar over a complex orography. J. Appl. Meteorol. 1995, 34, 1286–1300. [Google Scholar] [CrossRef]
  17. Wilson, J.W.; Crook, N.A.; Mueller, C.K.; Sun, J.; Dixon, M. Nowcasting thunderstorms: A status report. Bull. Am. Meteorol. Soc. 1998, 79, 2079–2099. [Google Scholar] [CrossRef]
  18. Wilson, J.W.; Ebert, E.E.; Saxen, T.R.; Roberts, R.D.; Mueller, C.K.; Sleigh, M.; Pierce, C.E.; Seed, A. Sydney 2000 forecast demonstration project: Convective storm nowcasting. Weather Forecast. 2004, 19, 131–150. [Google Scholar] [CrossRef]
  19. Changnon, S.A. Climatography of thunder events in the conterminous United States. Part I: Temporal aspects. J. Clim. 1988, 1, 389–398. [Google Scholar] [CrossRef]
  20. Changnon, S.A. Climatography of thunder events in the conterminous United States. Part II: Spatial aspects. J. Clim. 1988, 1, 399–405. [Google Scholar] [CrossRef]
  21. Tucker, D.F.; Li, X. Characteristics of warm season precipitating storms in the Arkansas–Red River basin. J. Geophys. Res. 2009, 114. [Google Scholar] [CrossRef]
  22. Yuan, M. Representing complex geographic phenomena in GIS. Cartogr. Geogr. Inf. Sci. 2001, 28, 83–96. [Google Scholar] [CrossRef]
  23. McIntosh, J.; Yuan, M. A framework to enhance semantic flexibility for analysis of distributed phenomena. Int. J. Geogr. Inf. Sci. 2005, 19, 999–1018. [Google Scholar] [CrossRef]
  24. Choi, J.; Olivera, F.; Socolofsky, S.A. Storm identification and tracking algorithm for modeling of rainfall fields using 1-h NEXRAD rainfall data in Texas. J. Hydrol. Eng. 2009, 14, 721–730. [Google Scholar] [CrossRef]
  25. Han, L.; Fu, S.; Zhao, L.; Zheng, Y.; Wang, H.; Lin, Y. 3D convective storm identification, tracking, and forecasting-An enhanced TITAN algorithm. J. Atmos. Ocean. Technol. 2009, 26, 719–732. [Google Scholar] [CrossRef]
  26. Chen, M.; Wang, Y.; Gao, F.; Xiao, X. Diurnal variations in convective storm activity over contiguous North China during the warm season based on radar mosaic climatology. J. Geophys. Res. Atmos. 2012. [Google Scholar] [CrossRef]
  27. Lock, N.A.; Houston, A.L. Spatiotemporal distribution of thunderstorm initiation in the US Great Plains from 2005 to 2007. Int. J. Climatol. 2015, 35, 4047–4056. [Google Scholar] [CrossRef]
  28. Ashley, W.S.; Bentley, M.L.; Stallins, J.A. Urban-induced thunderstorm modification in the Southeast United States. Clim. Chang. 2012, 113, 481–498. [Google Scholar] [CrossRef]
  29. Perryman, N.; Dixon, P.G. A radar analysis of urban snowfall modification in Minneapolis–St. Paul. J. Appl. Meteorol. Climatol. 2013, 52, 1632–1644. [Google Scholar] [CrossRef]
  30. Cummins, K.L.; Murphy, M.J. An overview of lightning locating systems: History, techniques, and data uses, with an in-depth look at the US NLDN. Electromagn. Compat. IEEE Trans. 2009, 51, 499–518. [Google Scholar] [CrossRef]
  31. Whitehall, K.; Mattmann, C.A.; Jenkins, G.; Rwebangira, M.; Demoz, B.; Waliser, D.; Kim, J.; Goodale, C.; Hart, A.; Ramirez, P.; et al. Exploring a graph theory based algorithm for automated identification and characterization of large mesoscale convective systems in satellite datasets. Earth Sci. Inf. 2015, 8, 663–675. [Google Scholar] [CrossRef]
  32. Haralock, R.M.; Shapiro, L.G. Computer and Robot Vision; Addison-Wesley: London, UK, 1991. [Google Scholar]
  33. Mohee, F.M.; Miller, C. Climatology of thunderstorms for North Dakota, 2002–06. J. Appl. Meteorol. Climatol. 1991, 49, 1881–1890. [Google Scholar] [CrossRef]
  34. Lee, B.D.; Jewett, B.F.; Wilhelmson, R.B. The 19 April 1996 Illinois tornado outbreak. Part I: Cell evolution and supercell isolation. Weather Forecast. 2006, 21, 433–448. [Google Scholar] [CrossRef]
  35. Lee, B.D.; Jewett, B.F.; Wilhelmson, R.B. The 19 April 1996 Illinois tornado outbreak. Part II: Cell mergers and associated tornado incidence. Weather Forecast. 1996, 21, 449–464. [Google Scholar] [CrossRef]
  36. Owen, J. A study of thunderstorm formation along dry lines. J. Appl. Meteorol. 1966, 5, 58–63. [Google Scholar] [CrossRef]
  37. Wang, Y.; Han, L.; Wang, H. Statistical characteristics of convective initiation in the Beijing-Tianjin region revealed by six-year radar data. J. Meteorol. Res. 2014, 28, 1127–1136. [Google Scholar] [CrossRef]
  38. Gambill, L.D.; Mecikalski, J.R. A satellite-based summer convective cloud frequency analysis over the southeastern United States. J. Appl. Meteorol. Climatol. 2011, 50, 1756–1769. [Google Scholar] [CrossRef]
  39. Shepherd, J.M.; Pierce, H.; Negri, A.J. Rainfall modification by major urban areas: Observations from spaceborne rain radar on the TRMM satellite. J. Appl. Meteorol. 2002, 41, 689–701. [Google Scholar] [CrossRef]
  40. Shepherd, J.M. A review of current investigations of urban-induced rainfall and recommendations for the future. Earth Interact. 2005, 9, 1–27. [Google Scholar] [CrossRef]
  41. Niyogi, D.; Pyle, P.; Lei, M.; Arya, S.P.; Kishtawal, C.M.; Shepherd, M.; Chen, F.; Wolfe, B. Urban modification of thunderstorms: An observational storm climatology and model case study for the Indianapolis urban region. J. Appl. Meteorol. Climatol. 2011, 50, 1129–1144. [Google Scholar] [CrossRef]
  42. Holt, T.R.; Niyogi, D.; Chen, F.; Manning, K.; LeMone, M.A.; Qureshi, A. Effect of land-atmosphere interactions on the IHOP 24–25 May 2002 convection case. Mon. Weather. Rev. 2006, 134, 113–133. [Google Scholar] [CrossRef]
  43. Chase, T.N.; Pielke, R.A., Sr.; Kittel, T.G.F.; Nemani, R.R.; Running, S.W. Simulated impacts of historical land cover changes on global climate in northern winter. Clim. Dyn. 2000, 16, 93–105. [Google Scholar] [CrossRef]
  44. Feddema, J.J.; Oleson, K.W.; Bonan, G.B.; Mearns, L.O.; Buja, L.E.; Meehl, G.A.; Washington, W.M. The importance of land-cover change in simulating future climates. Science 2005, 310, 1674–1678. [Google Scholar] [CrossRef] [PubMed]
Figure 1. The study area (highlighted in red dashed rectangle) mainly covers the states of Kansas, Oklahoma, and northern Texas. A radar reflectivity image at 8:00, 24 April 2011 UTC is shown as an example.
Climate 04 00045 g001
Figure 2. The land cover types in the study area after reclassifying 2011 NLCD into seven main types.
Climate 04 00045 g002
Figure 3. The workflow of identifying, representing, and analyzing thunderstorms.
Climate 04 00045 g003
Figure 4. A graph representation showing the life cycle of a thunderstorm. The red polyline is the simplification of the graph representation using the maximum reflectivity path.
Climate 04 00045 g004
Figure 5. (a) Annual; (b) monthly thunderstorm occurrences in the study area during warm seasons (April to September) from 2010 to 2014.
Climate 04 00045 g005
Figure 6. (a) Histogram of thunderstorm durations; (b) average duration of thunderstorms by month.
Climate 04 00045 g006
Figure 7. Histogram of thunderstorm initiation (blue) and termination (red) time during a day.
Climate 04 00045 g007
Figure 8. Rose diagrams of thunderstorm movement distributions for (a)–(f): April through September.
Climate 04 00045 g008
Figure 9. Thunderstorm track density (km/km2) from April to September (a)–(f), and all months (g).
Climate 04 00045 g009
Figure 10. Thunderstorm initiation (a) and termination (b) density (count/km2) maps.
Climate 04 00045 g010aClimate 04 00045 g010b
Figure 11. Thunderstorm cell split (a) and merger (b) density (count/km2) maps.
Climate 04 00045 g011
Table 1. The densities of thunderstorm track (km/km2), initiation (count/km2), termination (count/km2), split (count/km2), and merger (count/km2) over seven major land cover types.
Land CoverTrackInitiationTerminationSplitMerger
Forests30318671904242404
Urban28216791689208350
Crops27116341629228390
Water26616241622215358
Barren26416031610201342
Wetlands25915491553202356
Grass25015041478220368
Table 2. T-test to examine differences in the means of thunderstorm tracks (km) and initiation (count) between urban and rural areas of three cities. Not significant is shaded gray.
Track
t
Track
p
Initiation
t
Initiation
p
Kansas City11.790.00026.470.000
Oklahoma City17.210.00032.510.000
Dallas−6.51.000−0.510.547

