3.1. Mean
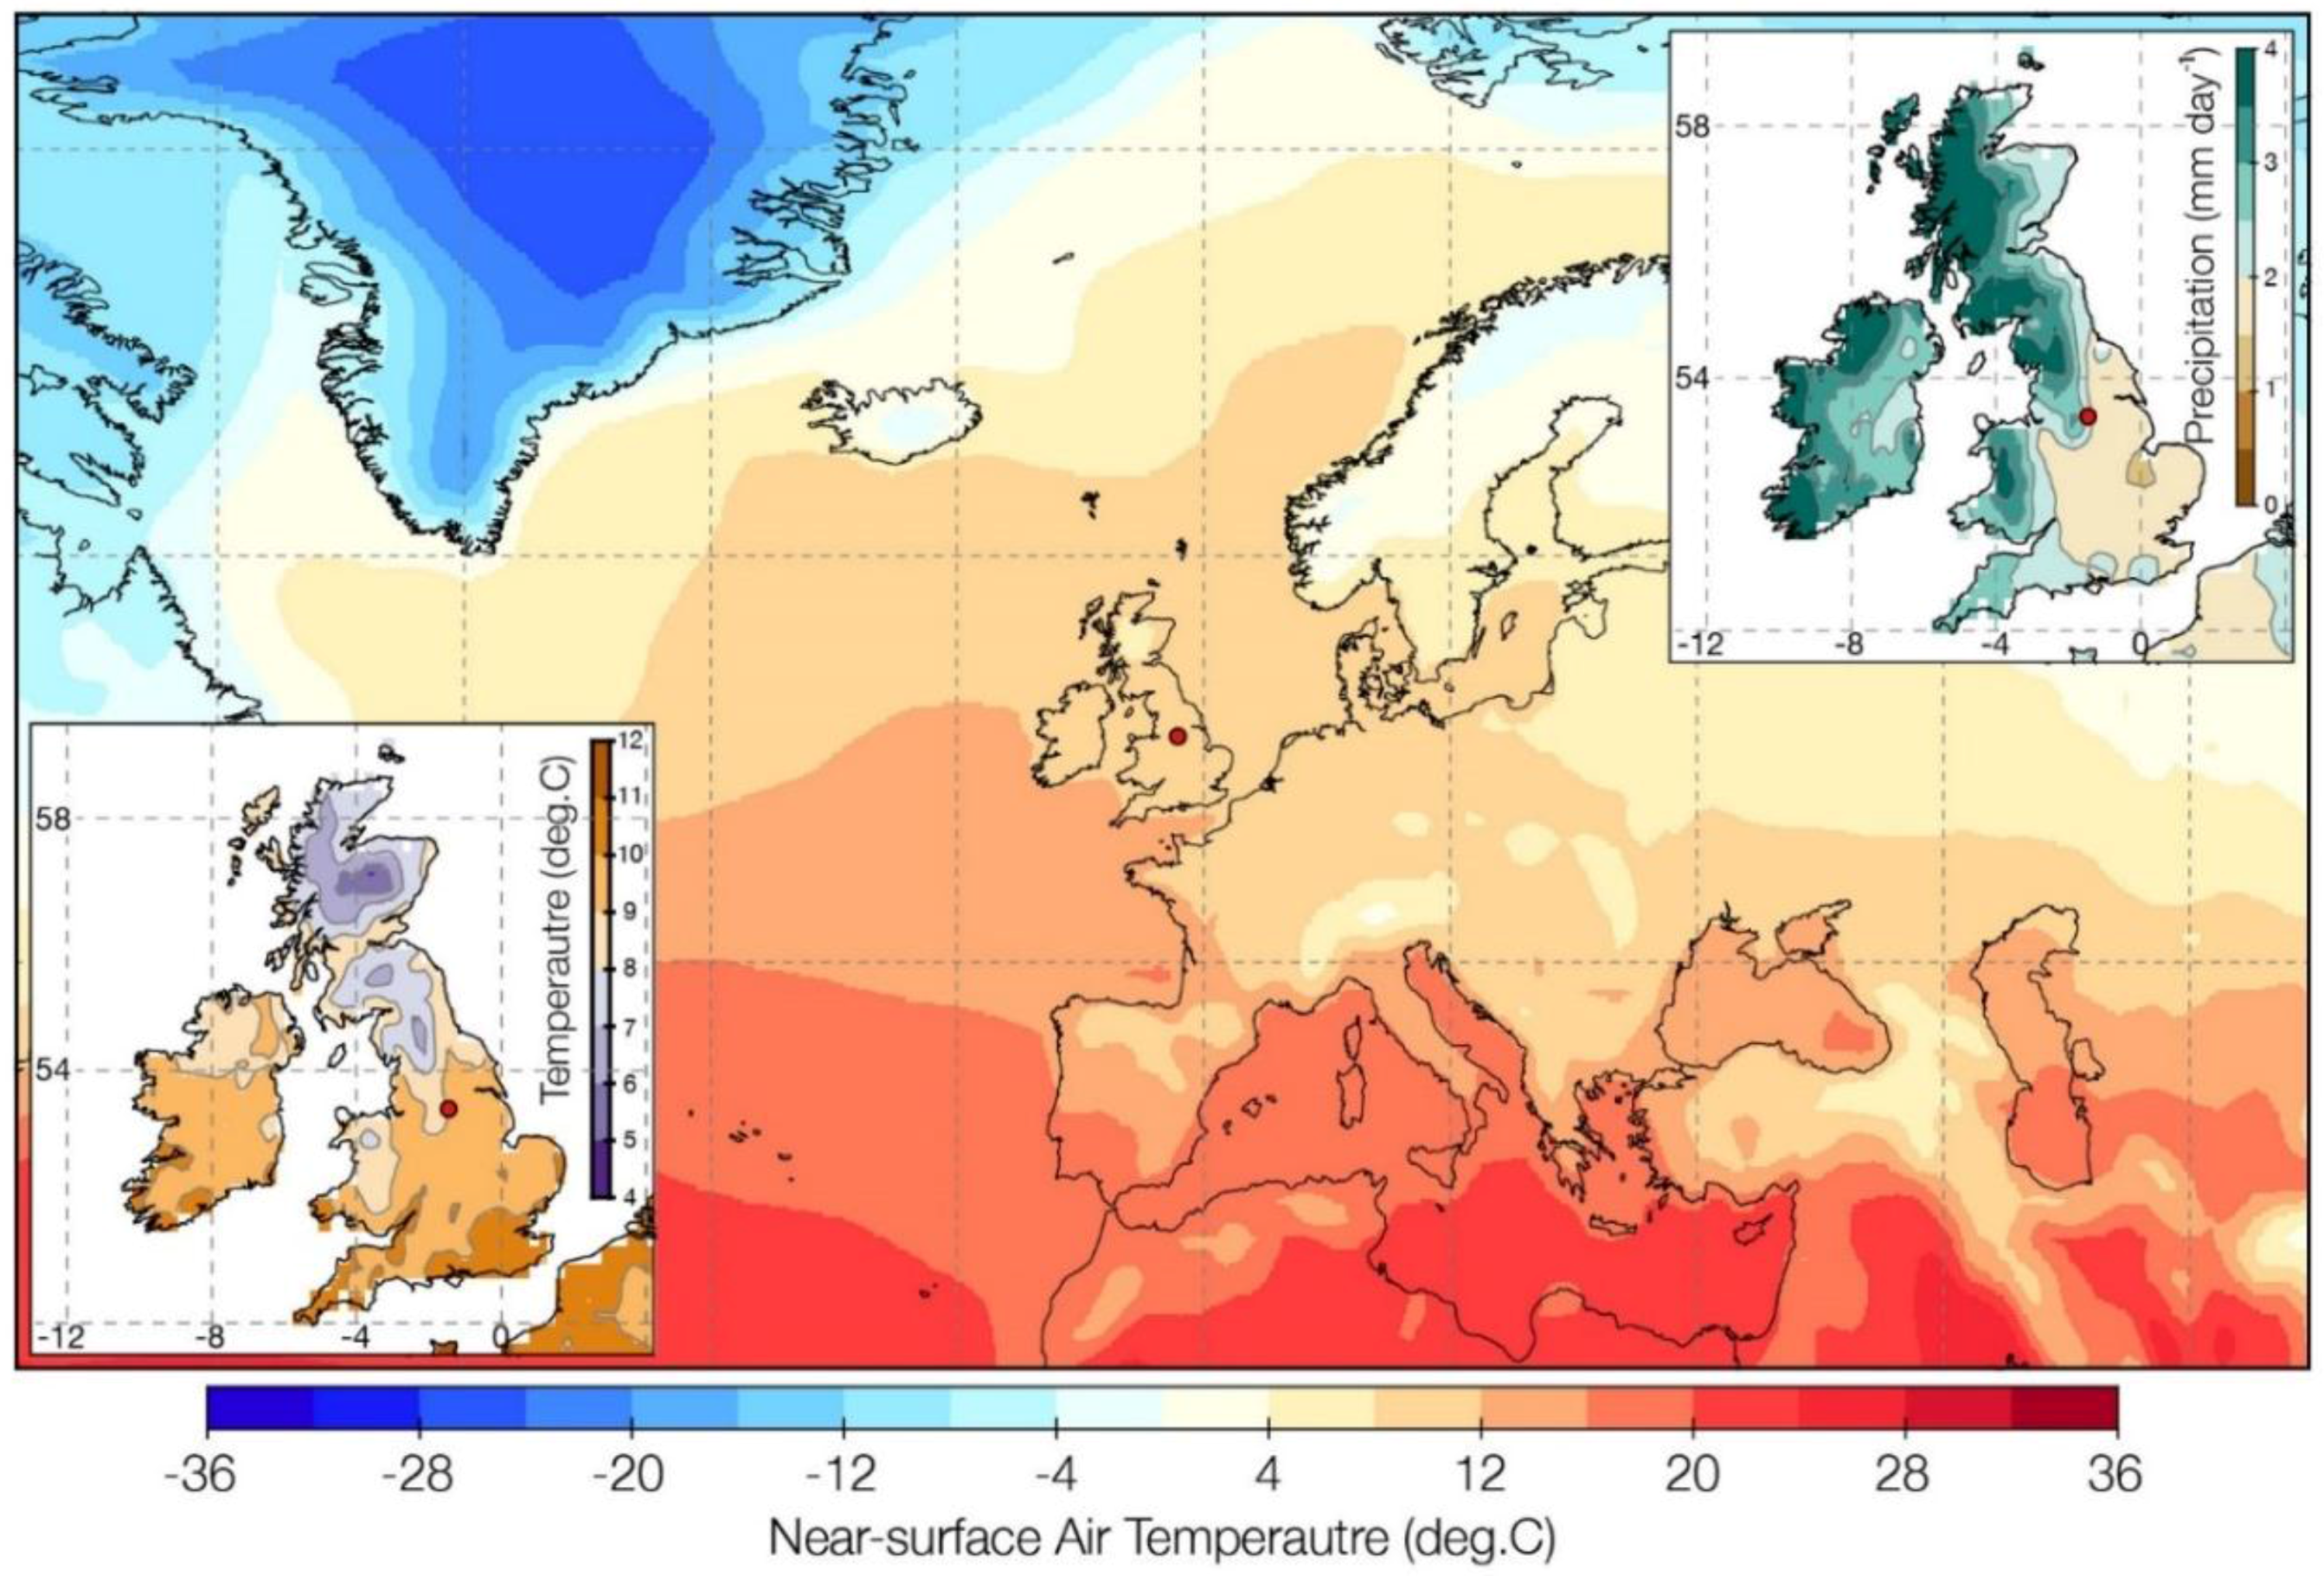
Figure 1 displays the location of WP and illustrates that in terms of the annual climatology, WP is situated in the boundary between the warmer, drier, southeast and colder, wetter, northwest of England.
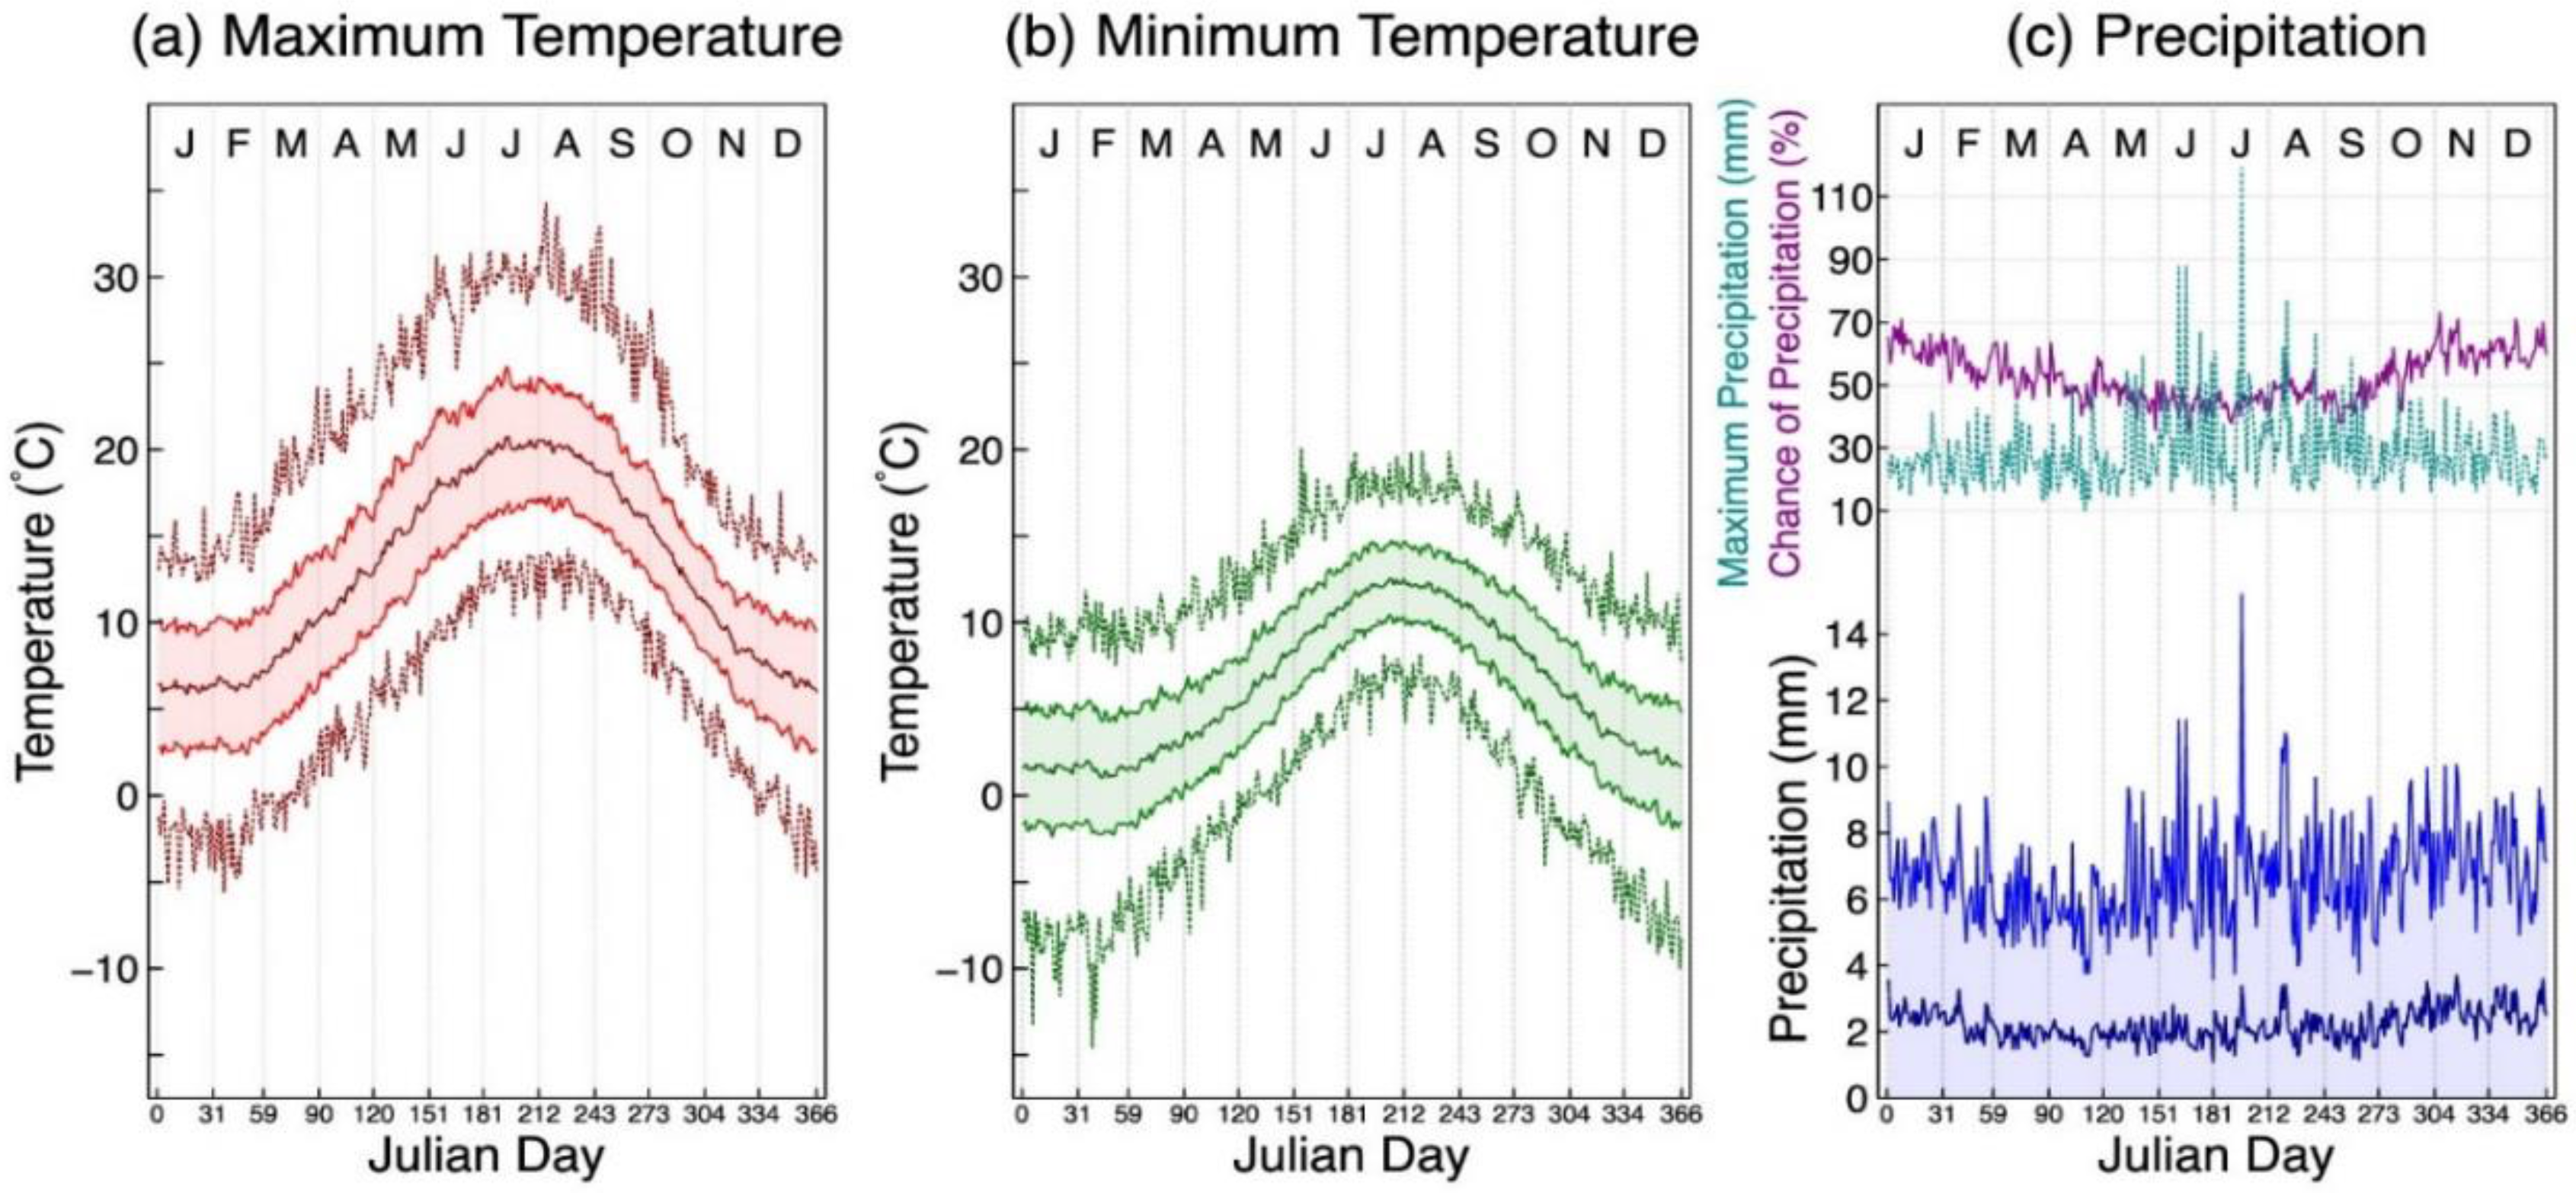
Figure 2 shows the annual cycle from WP for TX, TN and precipitation. Monthly mean data and climate records are given in
Table 2,
Table 3 and
Table 4, time series for mean temperature and precipitation are shown in
Figure 3 and trend rates for various periods for mean temperature, TX, TN and precipitation are given in
Table 5. January is the coldest month and July the warmest month (
Figure 2;
Table 3), but eight out of ten extreme hot records were found during August or September, rather than July (
Table 2). December (monthly) and winter (seasonally) have the greatest precipitation amounts. The standout feature in
Figure 2c is the impact of individual large summer precipitation events on the daily standard deviation and maximum daily precipitation amounts (
Figure 2;
Table 2). The mean value for the daily maximum precipitation amount across the nine non-summer months is 26.8 mm, whereas for the three summer months this is 35.1 mm. The chance of precipitation (i.e., a day with >=0.1 mm) on a given calendar day averages 52.5% across the entire record; there is a seasonal cycle with higher probabilities of precipitation in autumn and winter, and the lowest and highest daily values range from 35.6% (29 May) to 73.5% (3 November).
Since the turn of the 21st century, four out of the top ten daily precipitation records have been set but only one extreme warm or cold temperature record has occurred: the sixth warmest day on record, on 1 July 2015 (
Table 2). The year 2011 is the warmest year in the WP record (
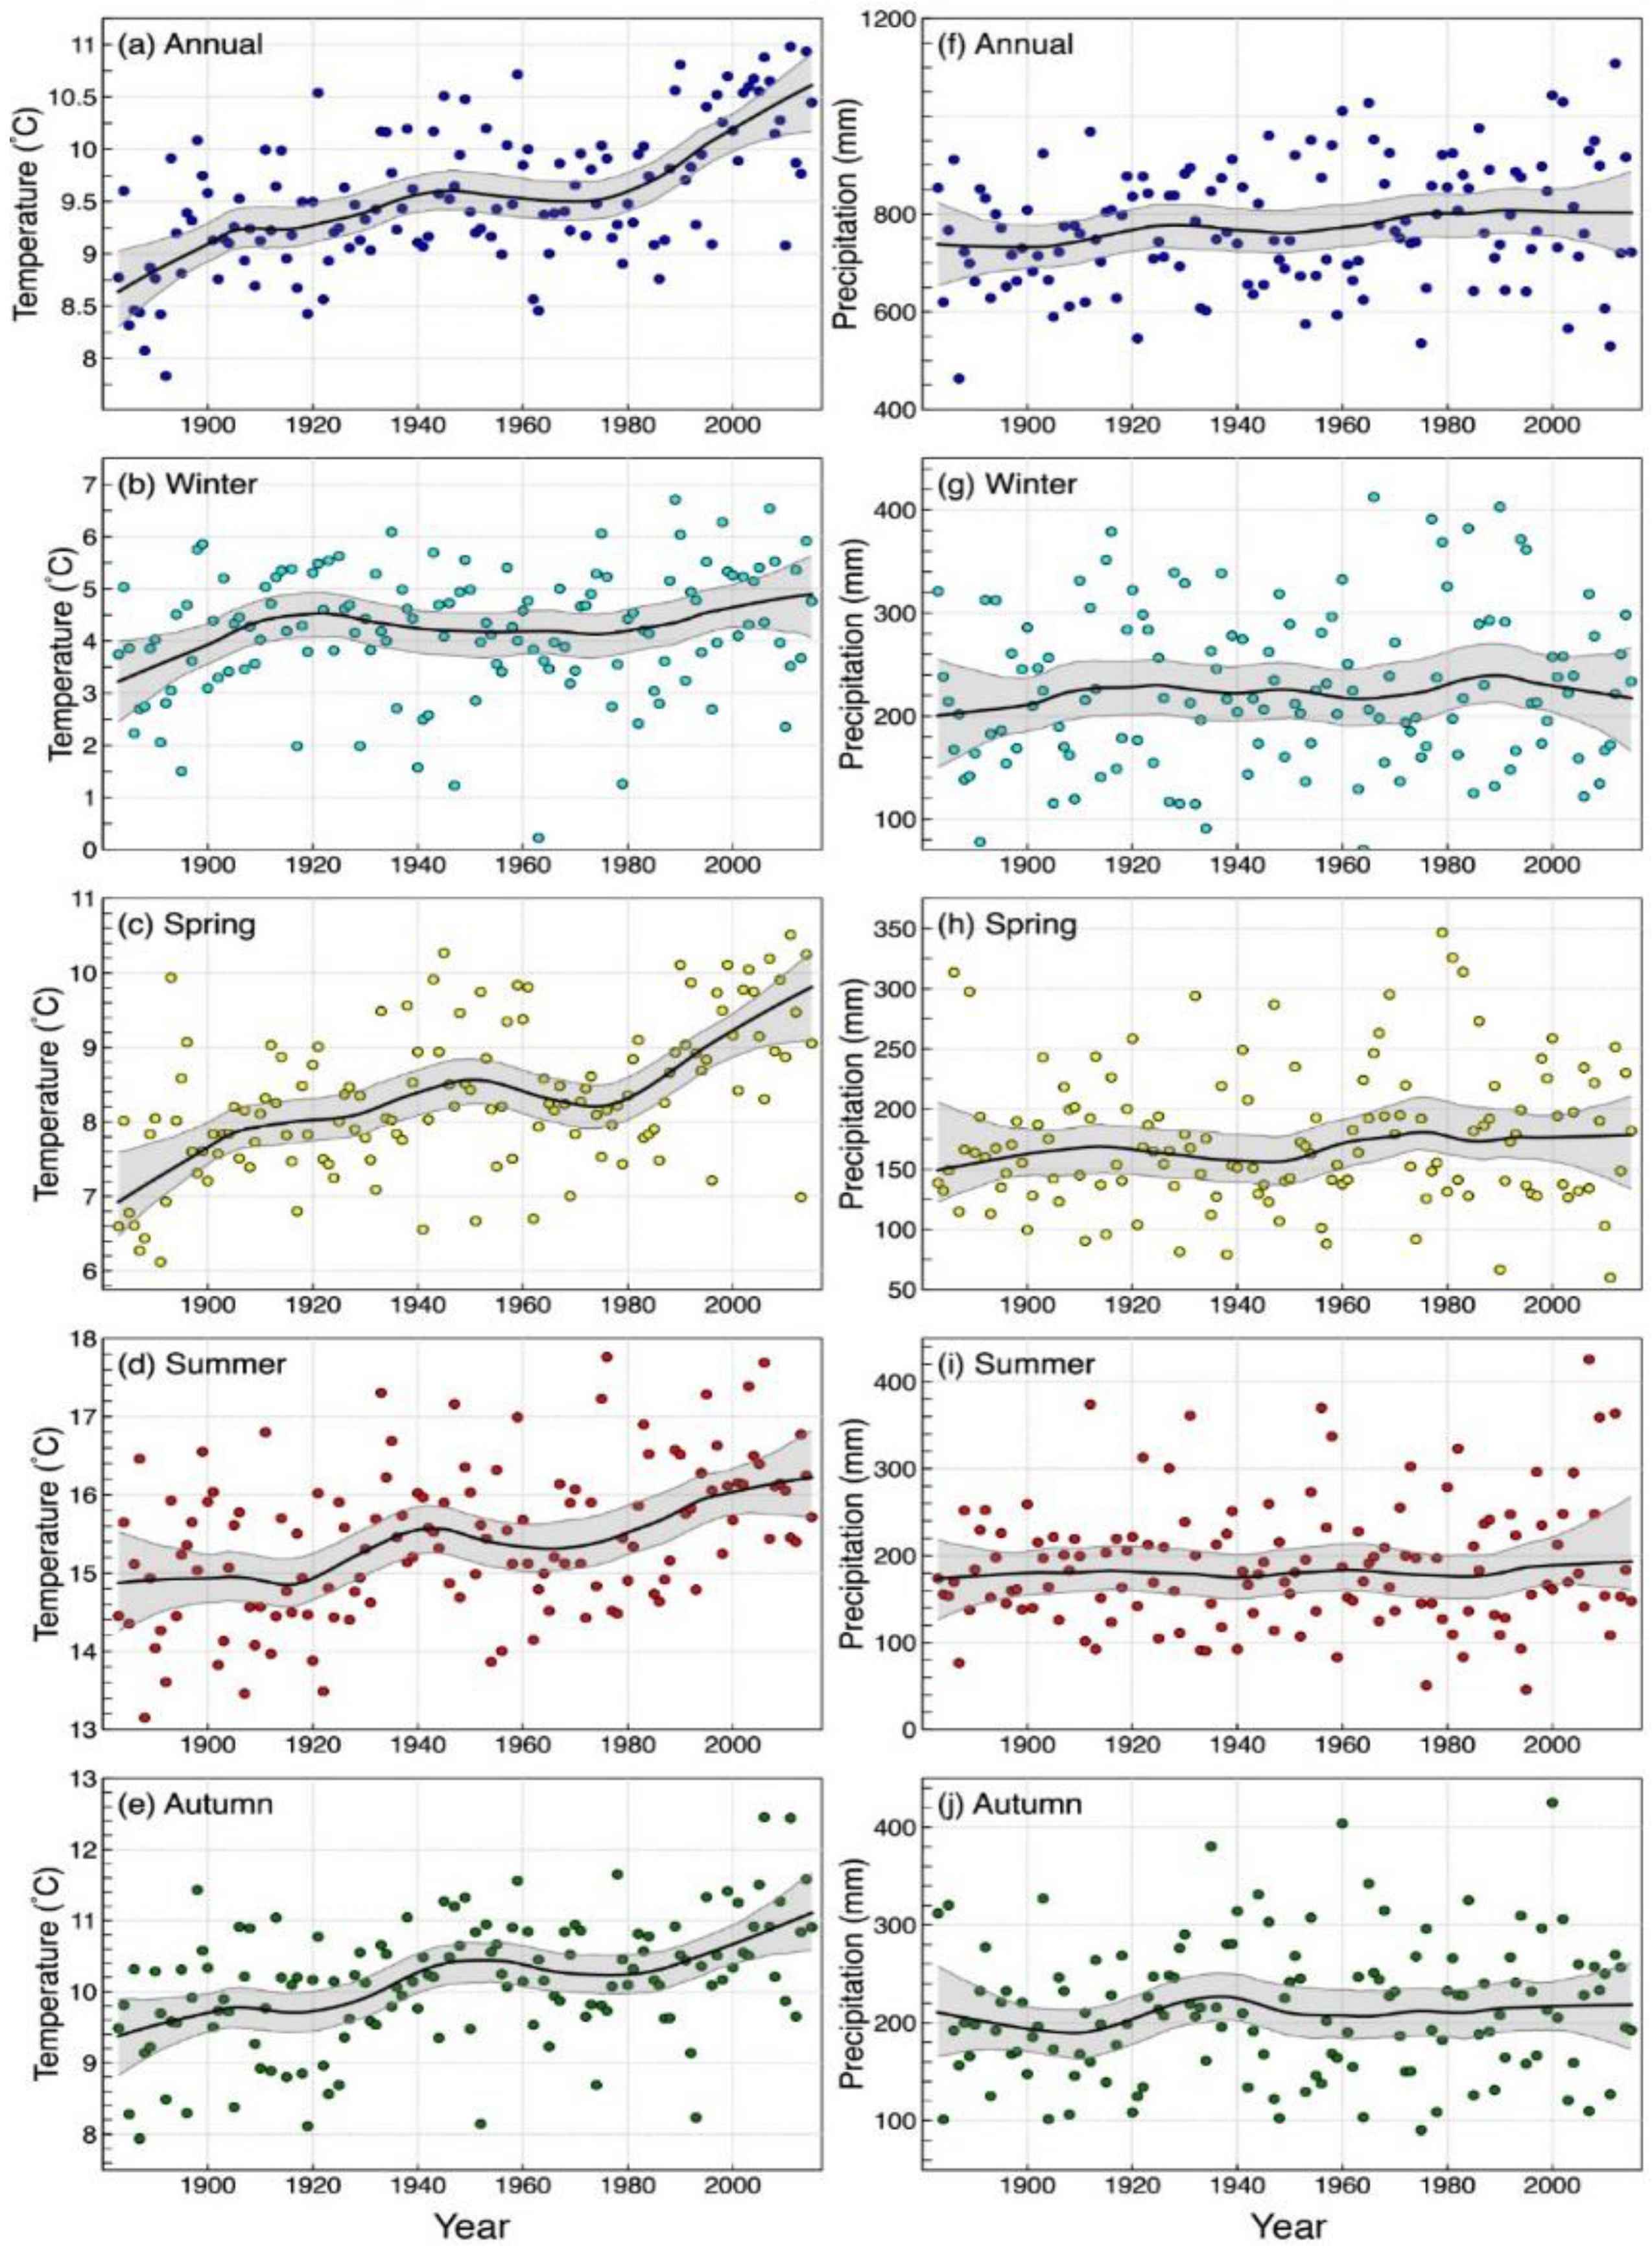
Table 4) and a clear generalised warming trend is evident in the annual mean temperature time series (
Figure 3). Trend analysis (
Table 5) indicates that for the long term 1883–2015 record, all annual and seasonal trends in mean temperature, TX and TN are statistically significant, ranging from 0.47 to 1.35 °C·century
−1. Spring is the season with the strongest mean warming signal (1.28 °C·century
−1) and the annual, summer and autumn rates are all close to 1 °C·century
−1 but the winter season has experienced a warming rate only about half that of the other seasons at 0.58 °C·century
−1. For other periods, trend direction and significance are not as ubiquitous. Examples include winter during 1901–2000 where the trend direction is negative, but only very marginally and not significantly so, and throughout the 1941–1970 period across all seasons. For the periods towards the end of the record (1961–1990, 1971–2000, 1981–2010, and 1991–2014), all seasonal and annual mean temperature, TX, and TN trends are positive, but trend significance is not widespread. Annual precipitation throughout the entire record is significantly increasing at a rate of 68.6 mm·century
−1 (
Table 5;
Figure 3), which with the exception of autumn precipitation during 1941–1970, is the only significant precipitation increase in the WP record.
Out of the five driest/wettest, and coldest/warmest months, seasons and years (
Table 4), December 2010 and March 2013 are the only months since the turn of the 21st century which display a cold record. Record warm months/seasons/years since the turn of the 21st century appear more common, although February, May and August have not had a post-2001 record warm month, but all other months and seasons have at least one out of five record months/seasons. Only four months (January 2006, March 2011, April 2007 and December 2010) and one season (spring 2011) have experienced a record dry month, however 2003 and 2011 feature as the fifth and third driest years on record, respectively. Conversely, 2012 and 2002 are the first and third wettest years on record, respectively and June (summer) has seen three out of five (two out of five) record wettest months (seasons) since the turn of the century.
3.2. Extremes
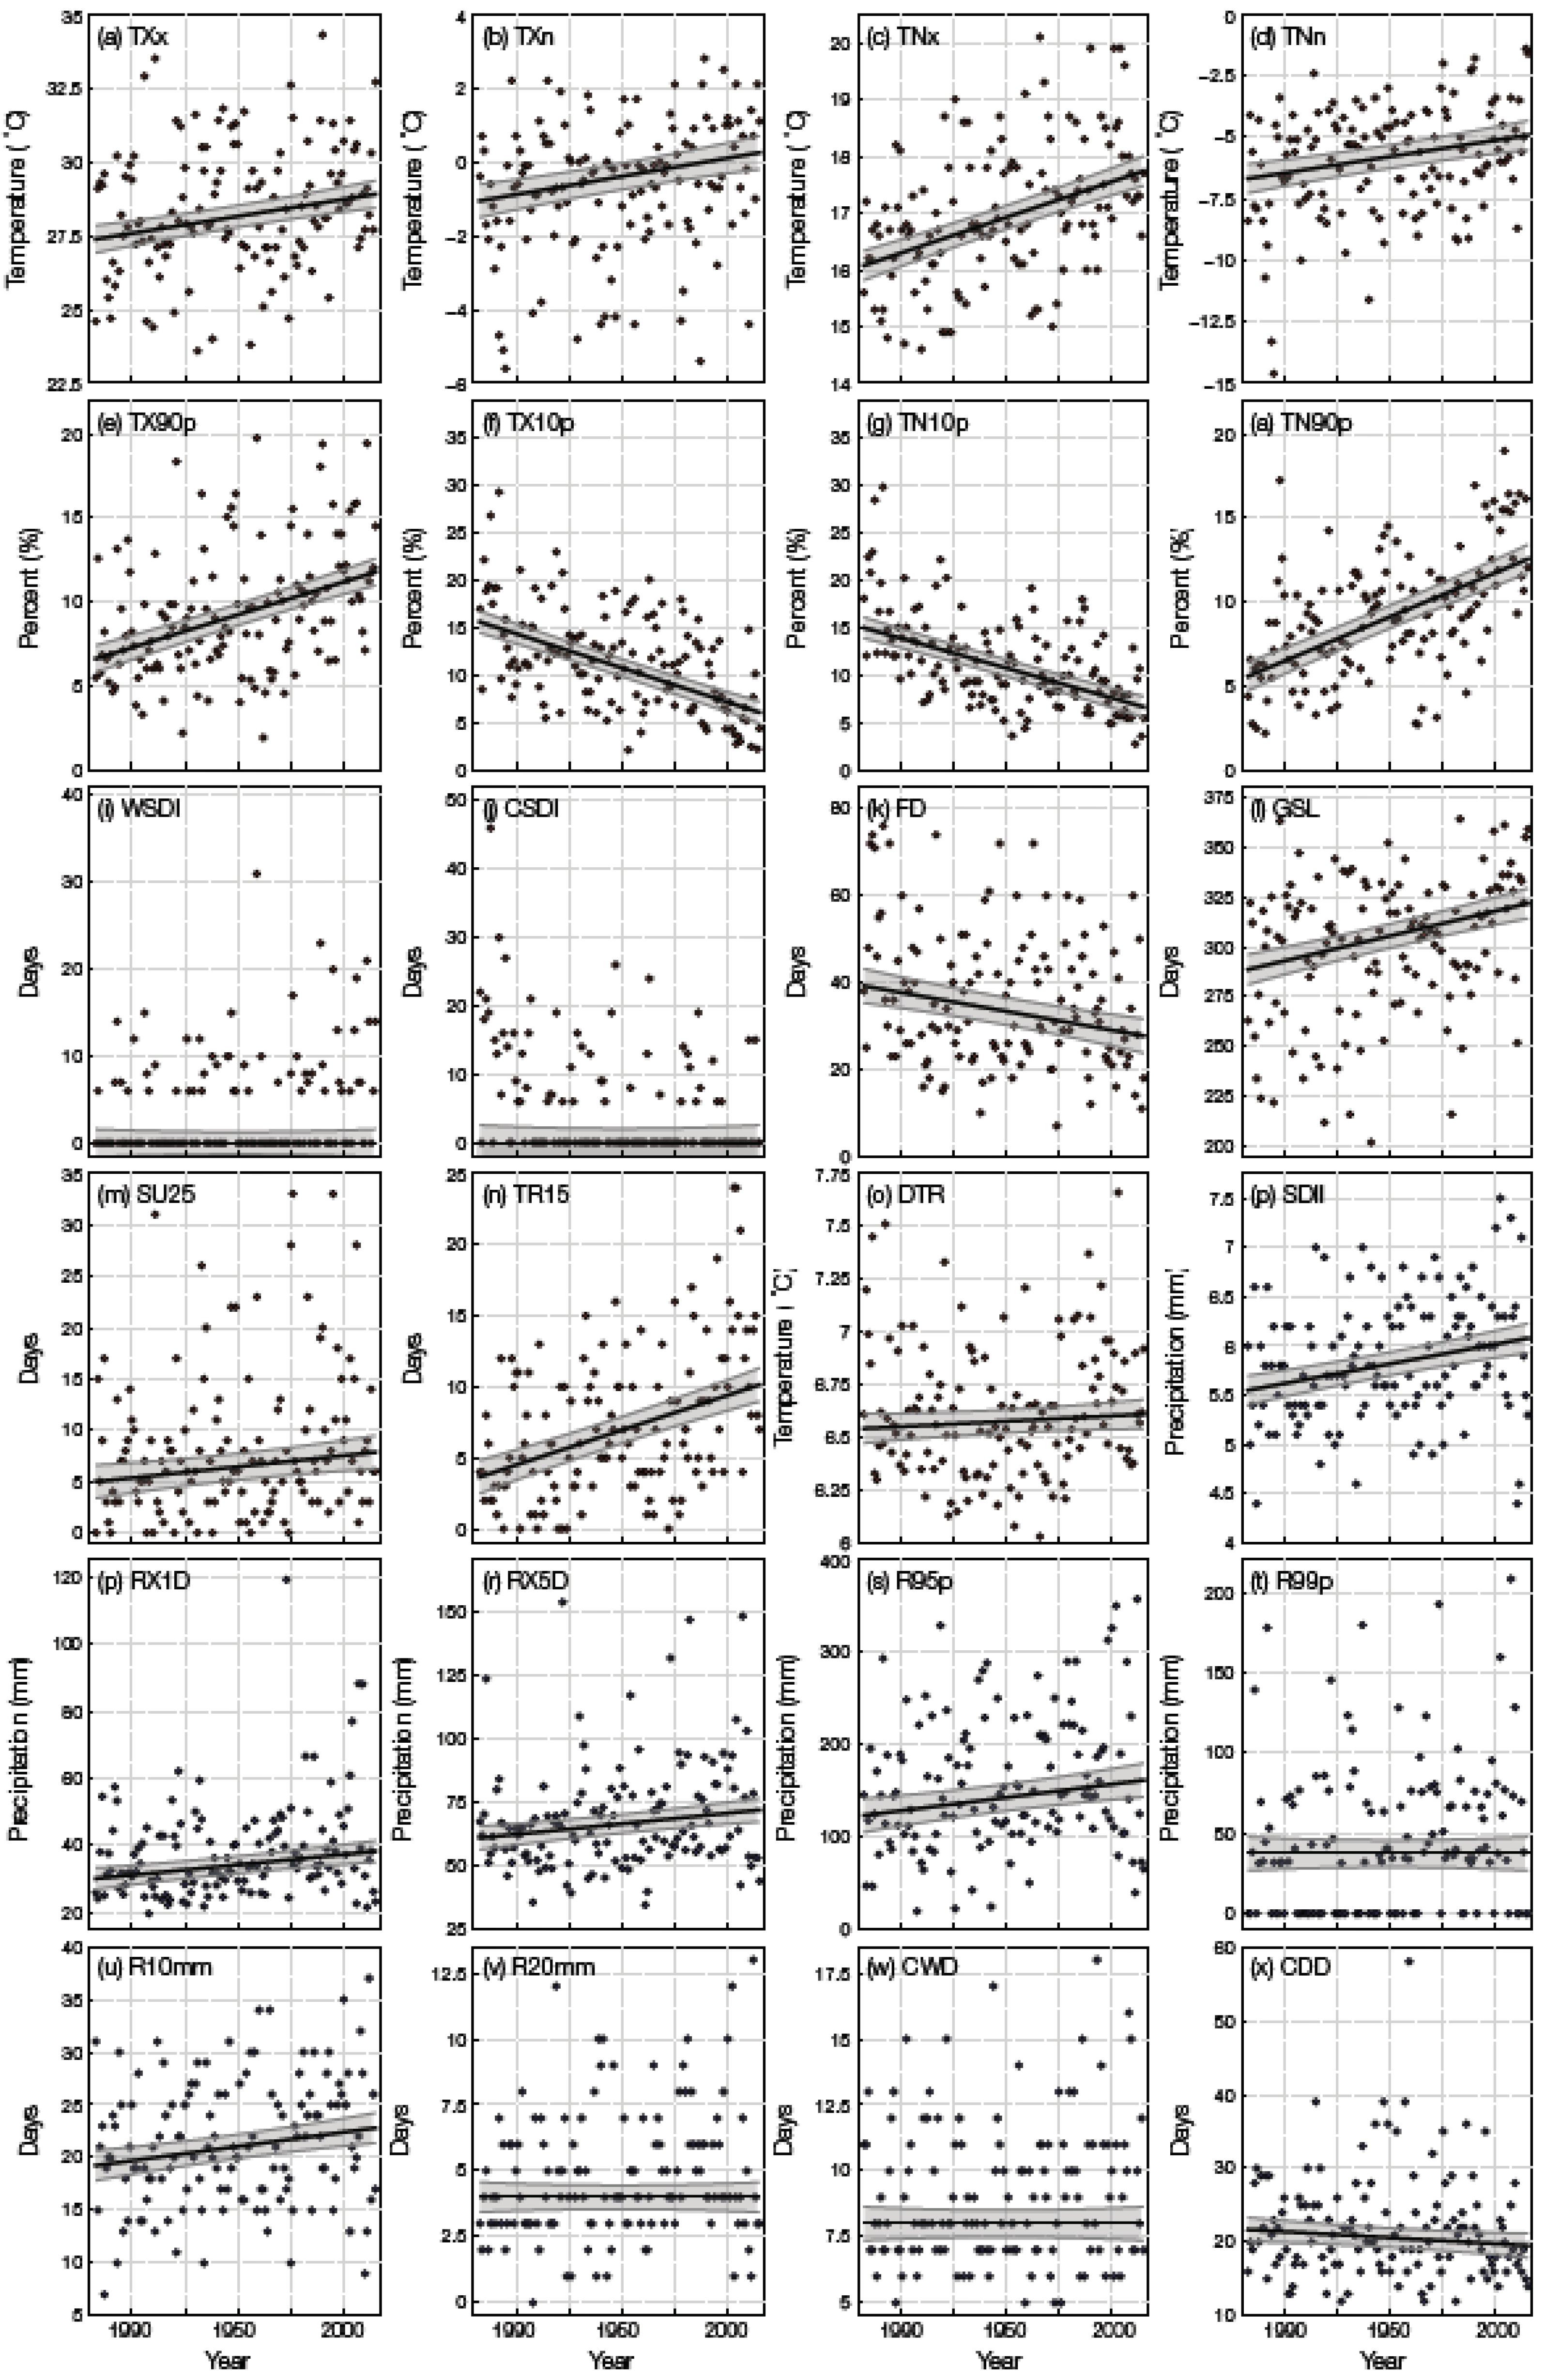
Table 6 and
Figure 4 show the results from application of the ETCCDI analysis on the WP data. As with the analysis on the “base” data (i.e., mean temperature and precipitation, TX, and TN) centennial trends across the entire period and the 20th century are significant across many indices, including positive trends towards warmer or wetter conditions in the “absolute” temperature and precipitation indices (TXx, TXn, TNn, TNx, RX1Day, RX5Day and R10mm). Significant long-term increases in TX90p and TN90p and decreases in TX10p and TN10p are also indicative of warming conditions and positive trends in SDII (significant) and R95p indicate an increase in intense/heavier precipitation events (but not necessarily the frequency). The R95p, R99p and R20mm trends are positive and significant for the 20th century, but not the long-term record (1883–2015). Whilst a long term increase in all three of these series is visually inferable (
Figure 4) the long-term R99p and R20mm trends are given as zero with the Theil-Sen method. With this method, if more than half of the data points in a series have a value which is the same as the preceding/following value, then the resultant trendline will be zero (as the Theil-Sen method is the median value of all possible ranked slopes). The thresholds for the 95th and 99th daily precipitation percentiles are 18.2 and 31 mm·day
−1, respectively. This presents a somewhat curious difference between the long-term R20mm trend and the R95p trend (29 mm·century
−1,
Table 6), which is mainly due to the different units—R20mm requires an increase in frequency of “very heavy” precipitation days, whereas R95p does not (just the precipitation amount)—but we also find a non-trivial number of days (183) where precipitation was between the 18.2 and 20 mm threshold (relative to a count of 635 R20mm days), highlighting how careful selections must be made when determining thresholds for analysing “moderate” extreme events (i.e., ~one year return period)
To eliminate any ambiguity with regards to the trend in extreme precipitation, we supplement the analysis of the ETCCDI indices with trends in the quantiles of precipitation using quantile regression [
19], which shows a clear divide between negative trends in the <80th percentiles and positive trends in the >80th percentiles (
Figure S1). There is no long term change in CWD and a slight, but non-significant decrease in CDD. A significant change in these indices would require a very strong signal, given that the annual average of a daily chance of precipitation is 52.5%. With no significant change in precipitation frequency, and a strong indication of an increase in extreme precipitation (
Figure 4,
Figure S1), most of the increase in annual precipitation (
Table 5,
Figure 3) must therefore be coming from extreme precipitation events, which during the last ~35 years appears to be dominated by extreme summer precipitation events (
Table 2,
Table 5).
The long-term trends in the extreme indices support the findings derived from mean annual data of a generalised warming and precipitation increase. As with seasonal and annual temperature data, trend significance for shorter periods and rates for the periods at the end of the record (1961–1990, 1971–2000, 1981–2010, and 1991–2014) are rarely ubiquitously significant but generally agree on direction. Trends in SU25 and TR15 both show a long-term increase (
Table 6), with 1974 and 1972, respectively, being the last years where a count of zero for both these indices was recorded (
Figure 4). An increase (decrease) in the number of days in the WSDI (CSDI) is perhaps visually inferable (
Figure 4) but as mentioned before, the Theil-Sen trend gives a value of zero with many consecutively equal values.
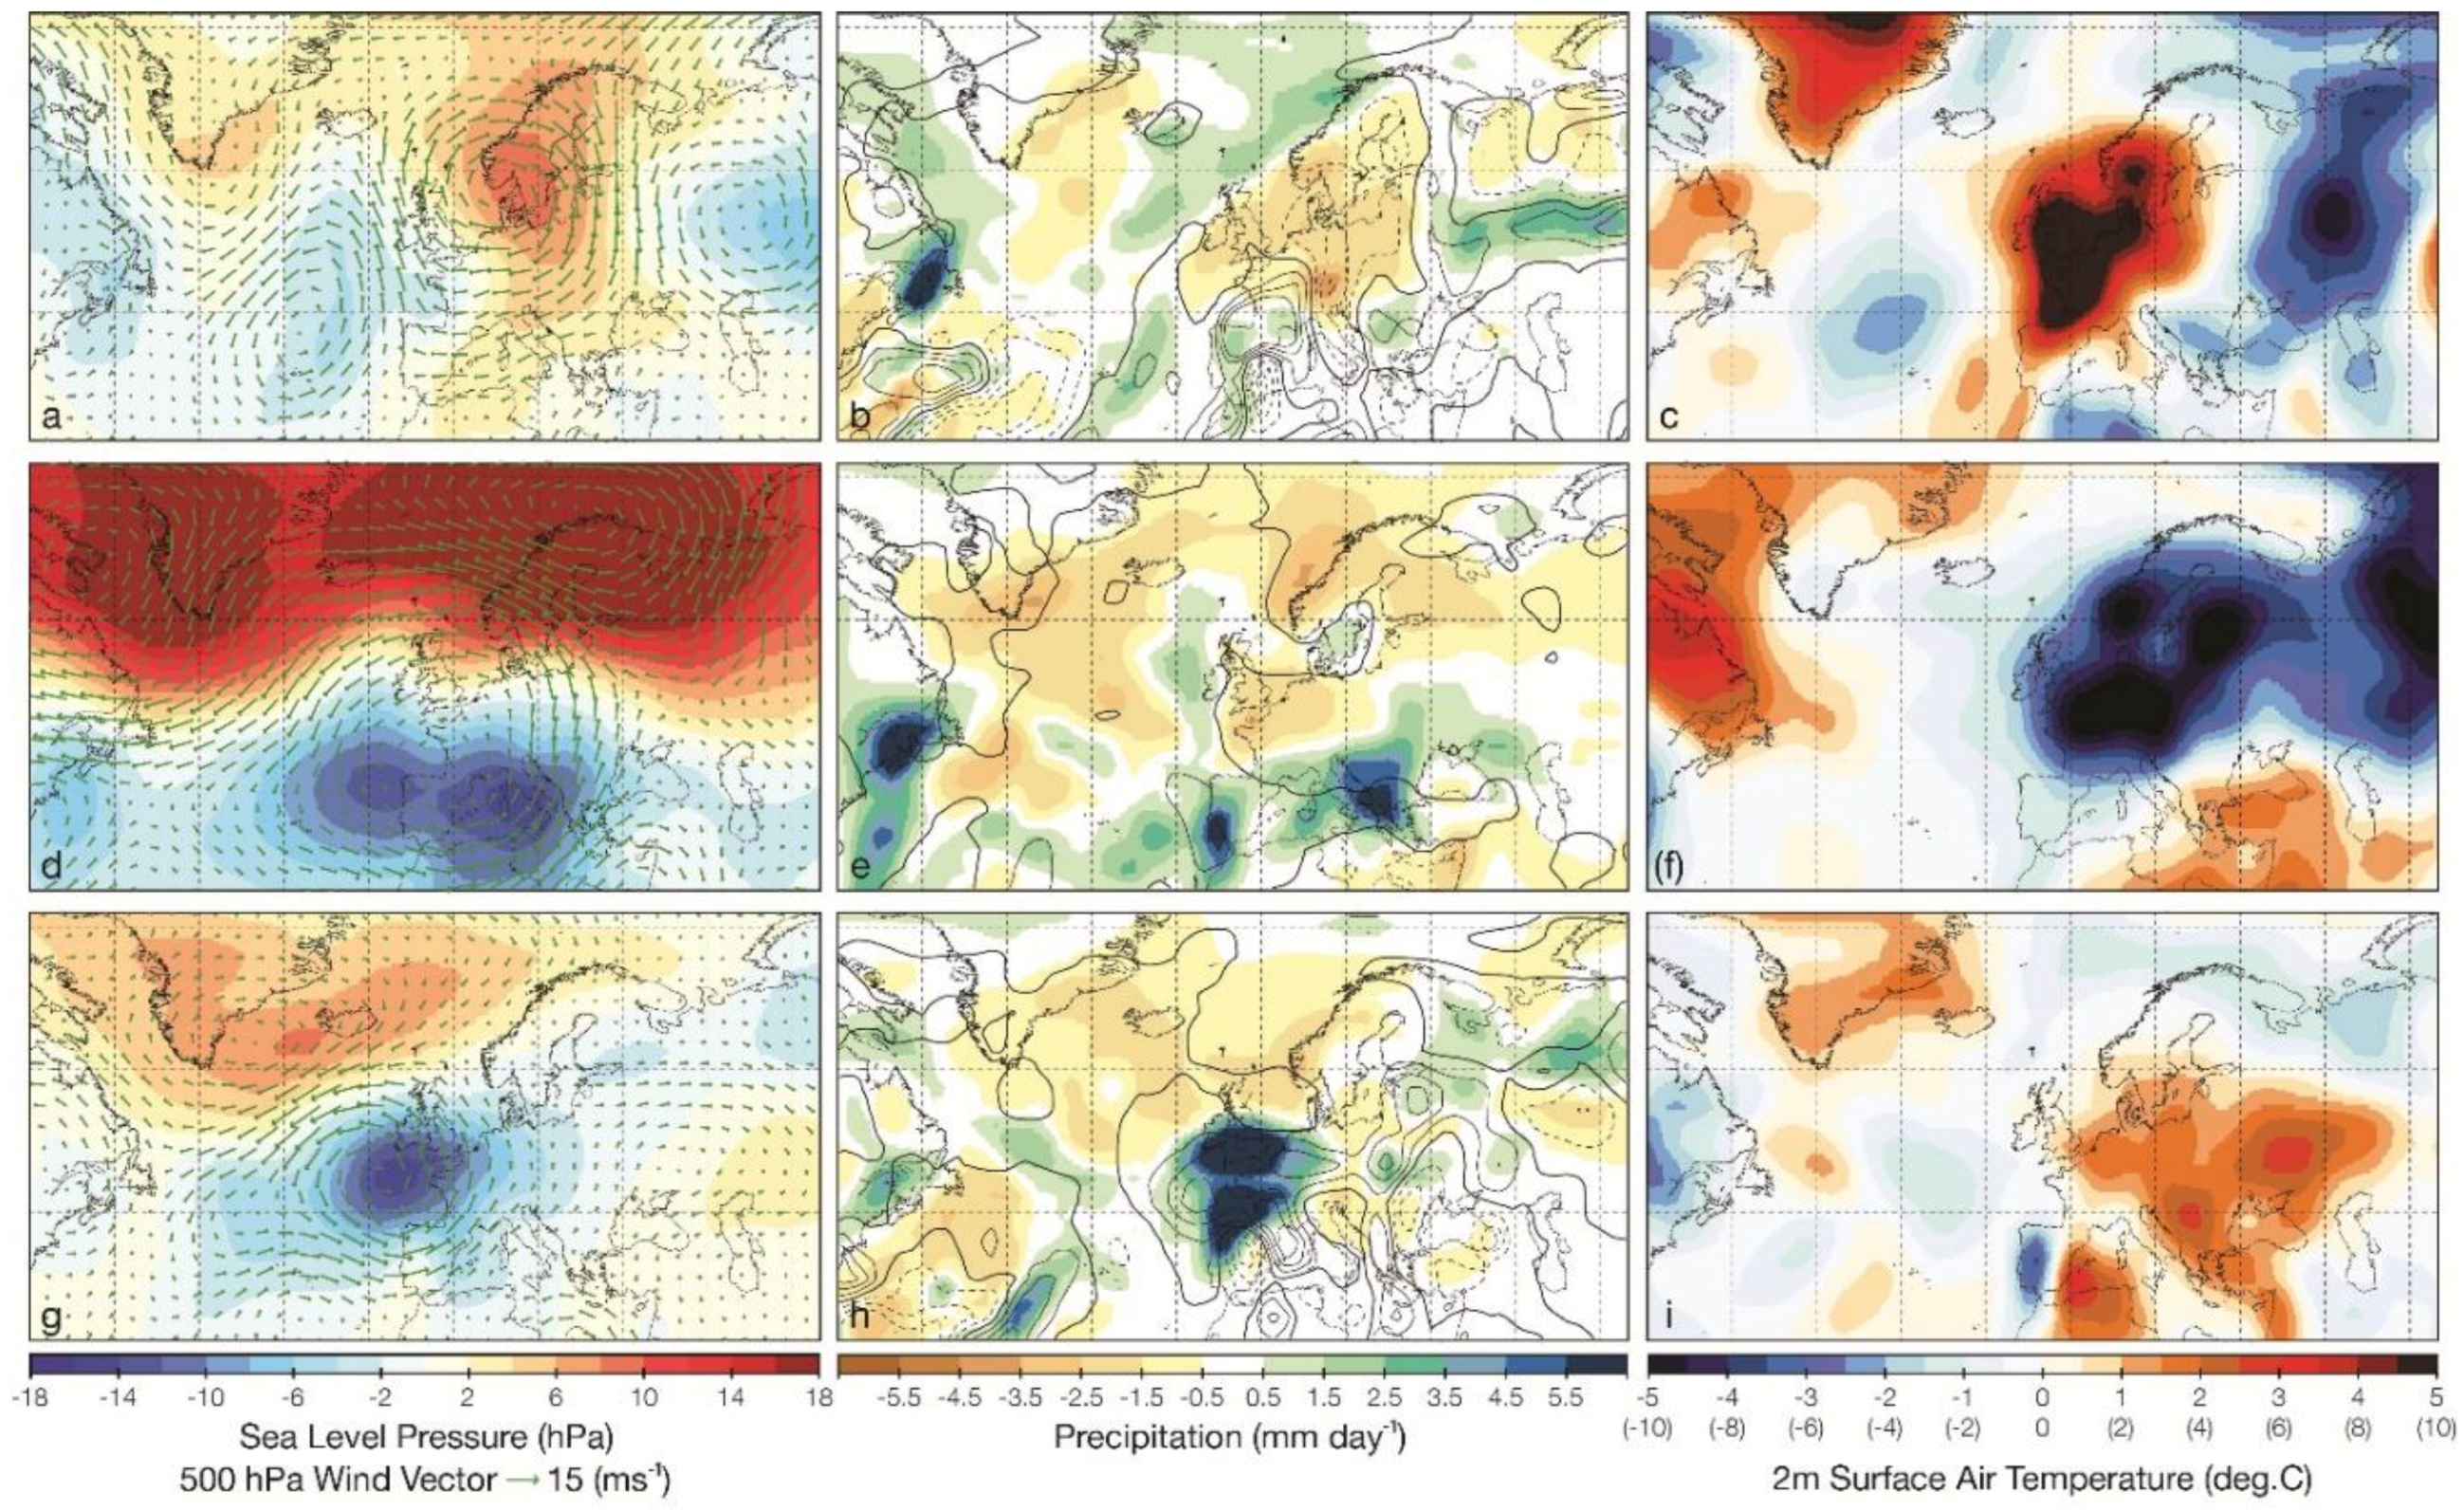
The typical weather pattern associated with extreme high and low temperatures and precipitation (using the dates from
Table 2) are shown as a composite anomaly plot in
Figure 5. Record hot days at WP are associated with summer anticyclone conditions centred over southern Scandinavia, which allows advection of warm continental air toward the UK. Record cold days occur under a large-scale reversal of the winter climatological pressure gradients, driving an anomalous easterly jet stream bringing cold Arctic air across most of northern Europe. Record precipitation days, which all occur during the summer months (
Table 2) are driven by cyclonic conditions centred over/around the southwest of the UK. Positive Convective Available Potential Energy anomalies imply a contribution to rainfall intensity from convection enhancement (i.e., why the record precipitation values are all during summer as opposed to other seasons), but unfortunately sub-daily precipitation data were not available for analysis, which could have provided further insight. Some hot and cold extreme records were part of the same meteorological “event”, i.e., consecutive days (
Table 2), so we replicated the composite analysis using subsequently ranked record days that were from unique events (not consecutive days) to remove the weighting in the composite plot from two/three specific events, but this did not markedly alter the composition of the plots (not shown).
Whilst four out of the ten daily precipitation records have been set since the turn of the 21st century (
Table 2), the record event on 15 July 1973 is over 30 mm higher than any other daily value. The warm (3 August 1990) and cold (8 February 1895) records are also stand-out values, exceeding the second warmest (coldest) day by 0.8 °C (1.3 °C). Seen as these events represent the extreme statistics of the WP record, each by some distance, they mark the absolute range of extremities possible in the historical WP climate. This raises two questions. Firstly, what is/was the probability of these extreme events occurring in the climate at the time and at present (2015) and is there a detectable anthropogenic component? Secondly, what their evolution might be in the future under a warming climate. Were these events exceptional and unlikely to be passed, or will future climate warming turn these records into “normal” conditions? To answer this, we take two approaches. In
Section 3.4, we analyse the potential future evolution of two extreme indices, TXx and RX1day, from global climate models. Here, we analyse the three WP climate records discussed above by fitting the time series of TNn, TXx and RX1day to the Generalised Extreme Value distribution (details given in
Supplementary A) with smoothed global average temperatures as a covariate [
21,
22,
23,
24].
Table 7 provides results for this analysis for return periods calculated for the climate at the time of the record and again in 2015 and the respective ratio between these for the WP record statistics and A posteriori determined “moderate” extreme values (a threshold of 75 mm, 32 °C and −8 °C for precipitation, TXx and TNn, respectively) that have an approximate return period of a decade.
Considering the “moderate” extreme values first, A TXx of 32 °C would have a return period of 11 years (range around these estimates are in
Table 7) at the time the actual TXx record was set in 1990 and an equivalent return period of seven years in 2015. A −8 °C TNn event could have been expected once every five years in 1895 but now only once in 11 years in 2015. A 75 mm precipitation event in 1973 would have had a 53-year return period but, once again, could now be expected once every 11 years in the climate of 2015. The global warming influence has altered the ratio between the return times (decreased for TNn) of these records by 1.6 times for TXx, 2.2 times for TNn and 4.7 times for precipitation compared to the year when the actual records were set.
In terms of the actual WP record values, TXx had a return value of 82 years, TNn 192 and precipitation 2508. The return values for TXx and precipitation, under the influence of a warming climate, have been reduced to 38 (TXx) and 252 (precipitation) years and increased to 529 years for TNn which represent ratios in return periods of 2.2 (TXx), 2.8 (TNn) and 10 (precipitation). We wish to clarify that there are large uncertainties associated with extreme value analysis and the results presented for the WP record values must be interpreted with caution. There are the large intervals around precipitation return periods, which in general should not be estimated for periods longer than four times the length of the time series [
25]. However, the values given in
Table 7 reflect the fact that the 1973 precipitation record was indeed exceptional in the WP record and any extreme value fit will struggle to accurately constrain this (when a single large outlier is so far from the centre of the distribution). To answer our initial question (concerning the probability of event occurrence and a global warming influence), regardless of how much faith is placed in the exact quantitative estimate of the return time of the WP records, the observed pattern is that the global warming influence (as a covariate in determining the location and/or scale parameter of the extreme value distribution) serves to reduce (increase) the return period associated with extreme warm (extreme cold) temperatures and precipitation.
3.3. Climate Model Analysis
Two extreme indices, TXx and RX1Day were chosen for analysis alongside mean TX and precipitation from Coupled Model Intercomparison Phase 5 (CMIP5) output. These two societally-relevant indices were chosen as best representing high impact temperature and precipitation events. We obtained monthly mean TX and precipitation data from the CORDEX ensemble [
26] held on the Climate Explorer website (
https://climexp.knmi.nl/start.cgi) for 41 European-domain regional climate model runs at 0.5° resolution (forced by CMIP5 model runs). In addition, we obtained daily TX and precipitation data from the 0.25° resolution, statistically-downscaled dataset from NASA Earth Exchange (NEX, [
27]). From these two archives (
Supplementary B), we extract the grid box closest to WP from each model and use this to assess future climate changes in mean annual (CORDEX and NEX) and extreme (NEX) temperature and precipitation. We compare the historical base period of 1951–2005 with three future periods; a 1.5 °C and 2 °C above pre-industrial world and the 2080–2099 end of 21st century conditions. Our selection of these periods is based on the 2015 Paris agreement to limit global warming to 2 °C above pre-industrial temperatures and to attempt to limit the warming to 1.5 °C [
28]. We define 1.5 and 2 degree worlds as the years from future climate projections where the 15-year global average near-surface air temperature is between 1.4–1.6 °C (for a 1.5 °C world) and 1.9–2.1 °C (for a 2 °C world) above the average temperature of the historical 1861–1890 period for each model. Under Representative Concentration Pathway 8.5 (RCP8.5)—the most severe of four warming scenarios used in the CMIP5 projections and the forcing scenario used in the 21 NEX model outputs that we analyse—a 1.5 °C world with our definition can appear as early as 2006 (late as 2048) with a mean year of 2024 and a 2 °C world as soon as 2021 (late as 2061) with a mean year of 2039.
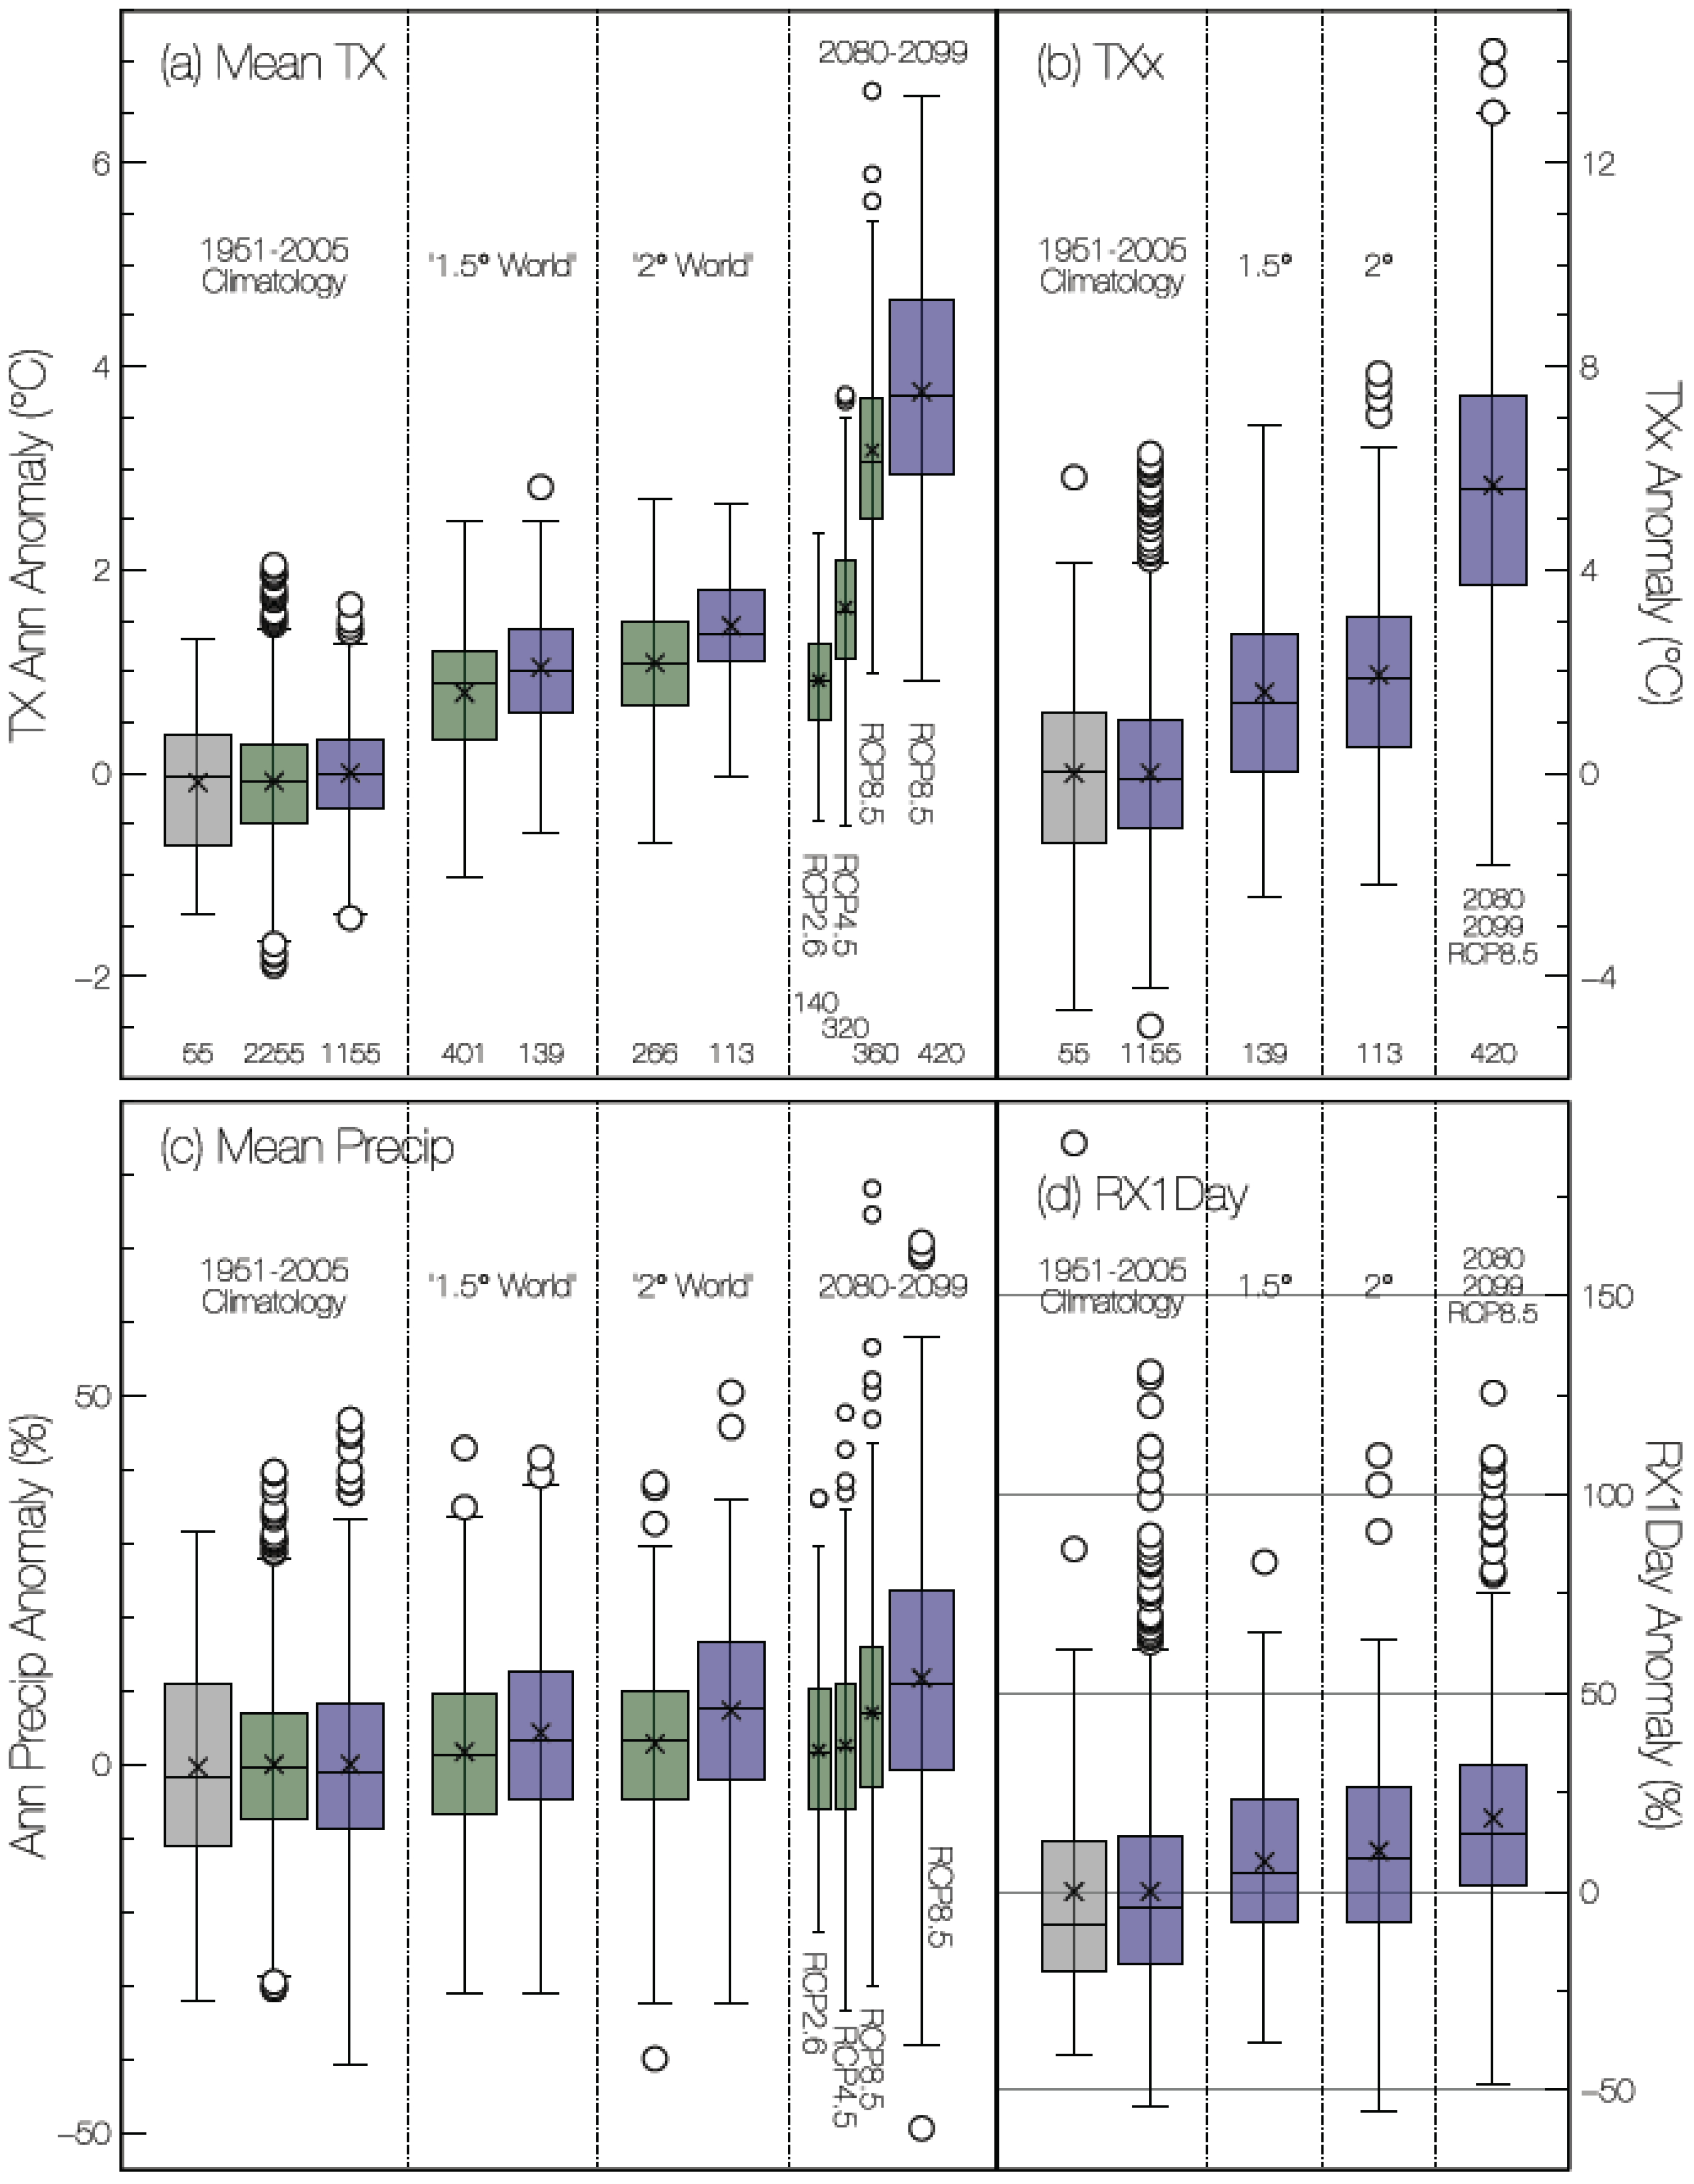
Figure 6 presents histograms of the 1951–2005 mean for Weston Park and the CORDEX/NEX model ensembles for: (a) mean TX; (b) TXx; (c) mean Precipitation; and (d) RX1Day. Histograms for the 1.5/2 °C worlds are presented as well as the end of 21st century period. Data are presented as anomalies relative to the 1951–2005 period (and as per cent anomalies for precipitation), with the figure replicated using absolute values in the
supplementary material (Figures S2 and S3). Beginning with mean TX (
Figure 6a) we show that the range of values in the base period is comparable between WP and the CORDEX/NEX ensembles, with the whiskers (1.5 times the inter-quartile range) of all three box plots all ~±1.5 °C. A 1.5/2 °C warmer world shifts the TX distribution upward by ~1 °C with NEX slightly warmer than CORDEX in both cases. A t-test between the 1.5/2 °C values identifies a significant difference in means of 0.3/0.4 °C for CORDEX and NEX respectively, i.e., a statistical difference between these idealised-worlds. With respect to the 1951–2005 model mean period, CORDEX TX warms 0.9 ± 0.1 °C/1.1 ± 0.1 °C in a 1.5/2 °C world and NEX TX warms 1.0 ± 0.1 °C/1.4 ± 0.1 °C in a 1.5/2 °C world respectively. However, the range of the distributions illustrates that the 1.5 °C and 2 °C worlds are broadly comparable, especially when compared with the end of century RCP8.5 forcing scenario which has a mean TX warming double that of both the 1.5/2 °C world. The pattern is replicated for TXx (
Figure 6b). Here, we see that the exceptional TXx record set in 1990 in the WP record appears as an obvious outlier in the historical base period and the NEX ensemble is in good agreement with the WP distribution. Out of the 21 NEX models, 13/1155 years (1951–2005) have a TXx standardised anomaly (we use this metric to account for the differences in variance between the WP record and individual model series) greater than or equal to the standardised TXx anomaly of the 1990 WP record, which gives an approximate return period of 89 years—comparable to the 82-year return period for TXx for the climate of 1990 in the observational record (
Table 7). For model years in the 1.5/2 °C world, the previously unlikely TXx record becomes reachable within the confines of the range of the model distribution and such an anomaly (5.8 °C) is almost the median value in model years by the end of the century under RCP8.5. The model mean TXx response in the 1.5 °C world (1.6 ± 0.3 °C) is not statistically distinguishable from that of the 2 °C world (1.9 ± 0.6 °C) but the 2080–2099 period is significantly warmer (5.7 ± 0.3 °C).
For mean annual precipitation (
Figure 6c), the WP values deviate around the mean by ~±30%, with the models achieving a similar range but with outliers up to ~±50%. There is a small increase (<10%) in precipitation across all scenarios but robust projections are difficult as variability in precipitation estimates are large and increase for some scenarios. For RX1Day, the record 1973 event (
Table 2) is not exceeded under any scenario even by outlier events, indicating the exceptional nature of the 1973 event (or a model deficiency in simulating extreme precipitation which is discussed in
Section 4.2). The shifts in mean for each scenario here are more pronounced than for mean precipitation. The shift in model mean for RX1Day associated with a 1.5/2 °C world is 7.5% ± 3.5%/10.2% ± 5.1% respectively, with a t-test indicating the 1.5/2 °C worlds do not have statistically different means. The expected RX1Day increase by 2080–2099 is 18.5% ± 15.8%. We discuss the implications and validity of these predictions in
Section 4.2.
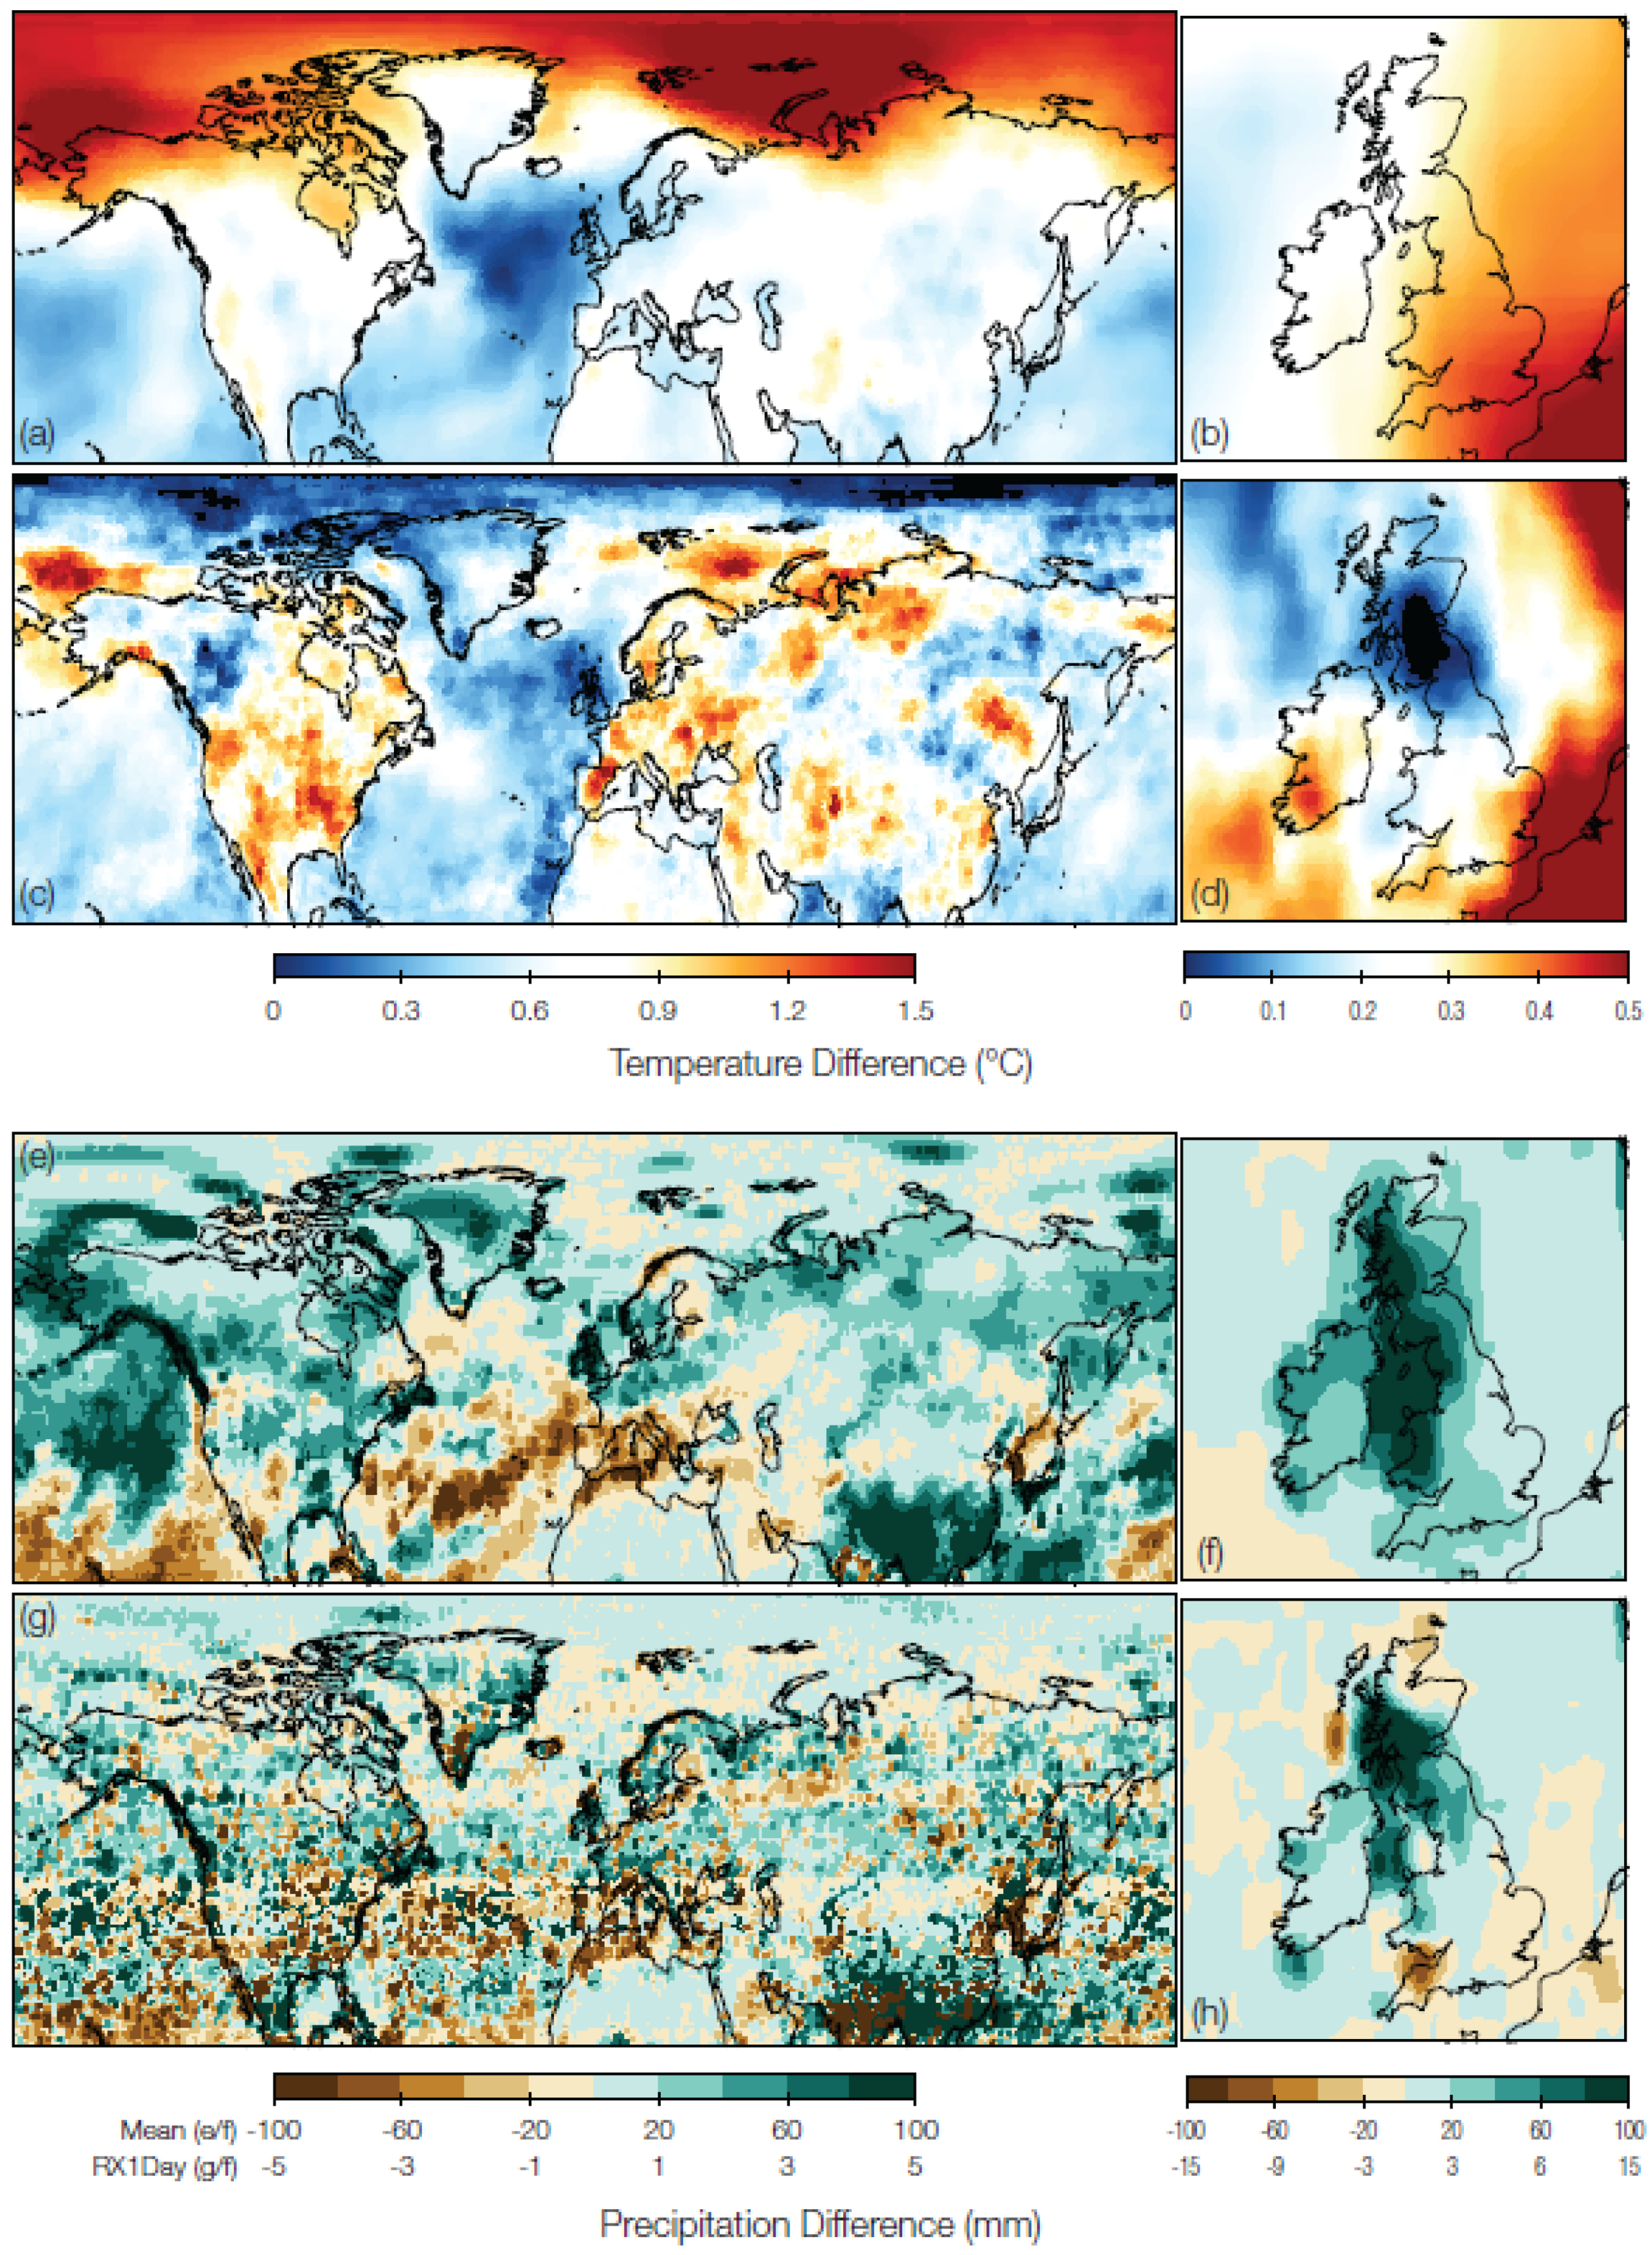
To place the changes at WP into a wider context, we average all available 1.5/2 °C world model years and plot the ensemble difference in
Figure 7. The patterns in mean TX and precipitation follow expected climate warming patterns—Arctic Amplification, continents warmer than oceans, less warming in the central North Atlantic Ocean (
Figure 7a) and enhancement of existing precipitation/evaporation patterns (
Figure 7e). There are some marked contrasts between the 2 °C and 1.5 °C world in TXx (
Figure 7c). In the ensemble analysed here, the difference between 1.5/2 °C shows up very strongly in Arctic Sea Ice regions and suggests a pronounced land-ocean contrast in TXx differences. Changes in RX1day are noisy but broadly reflect the mean precipitation pattern. In a similar way to
Figure 1, the location of WP in the centre of the UK located in a somewhat transitional zone when considering the 1.5/2 °C world differences. The central UK mean TX is warmer but TXx does not change much for the north of the UK (
Figure 7b,d), and the main precipitation intensification is across the west coast (
Figure 7f,h).
To return to the second of our two questions, will current climate records become “normal”? Whilst we have not analysed model minimum temperatures, the general shift in the temperature distribution makes it extremely unlike the TNn record will be surpassed (
Table 7). The TXx record is within the range of the model distribution in a 1.5/2 °C world and what constitutes the record value in the climate of 2015 would be about the median expected TXx value at the end of the 21st century under RCP8.5 forcing. The record RX1Day value is not exceeded at all in any simulation and its exceptional nature within the existing WP record suggests it is unlikely such a record will be easily surpassed.


