Trend and Homogeneity Analysis of Precipitation in Iran
Abstract
:1. Introduction
2. Study Area and Data
3. Methodology
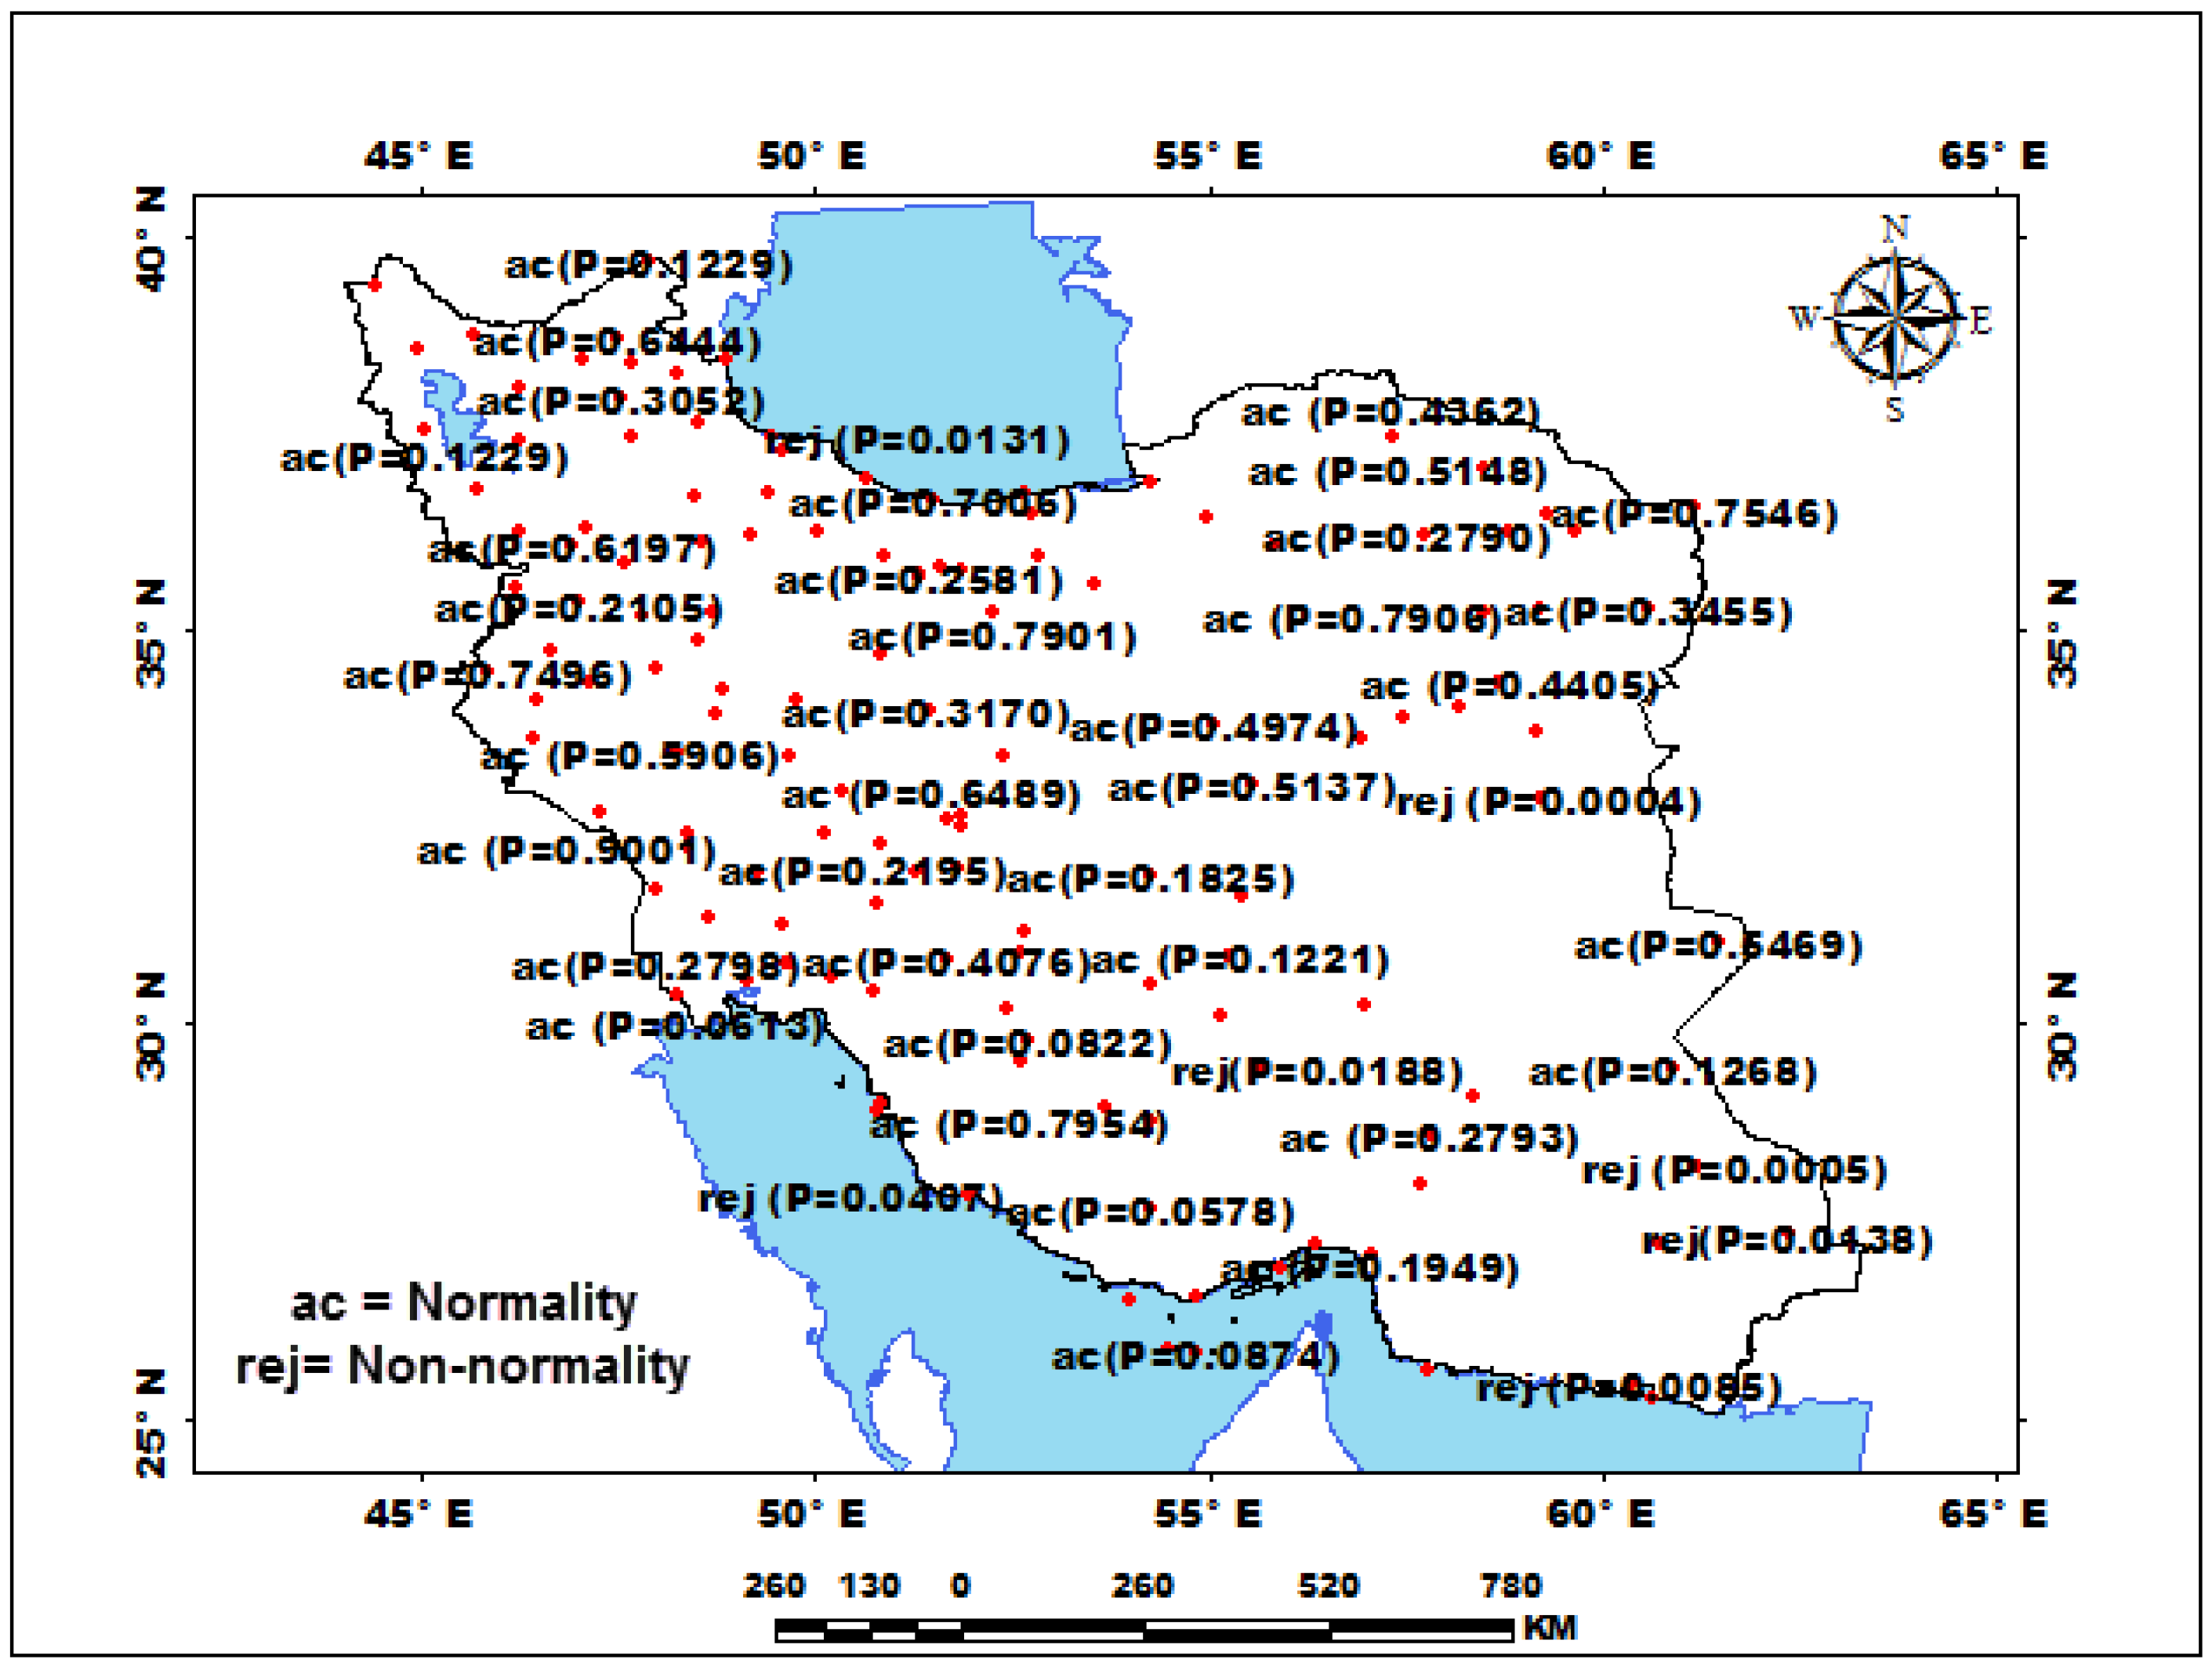
3.1. Checking the Normality and Homogeneity of Rainfalls Series
3.2. The Decision to Use Seasonal Models
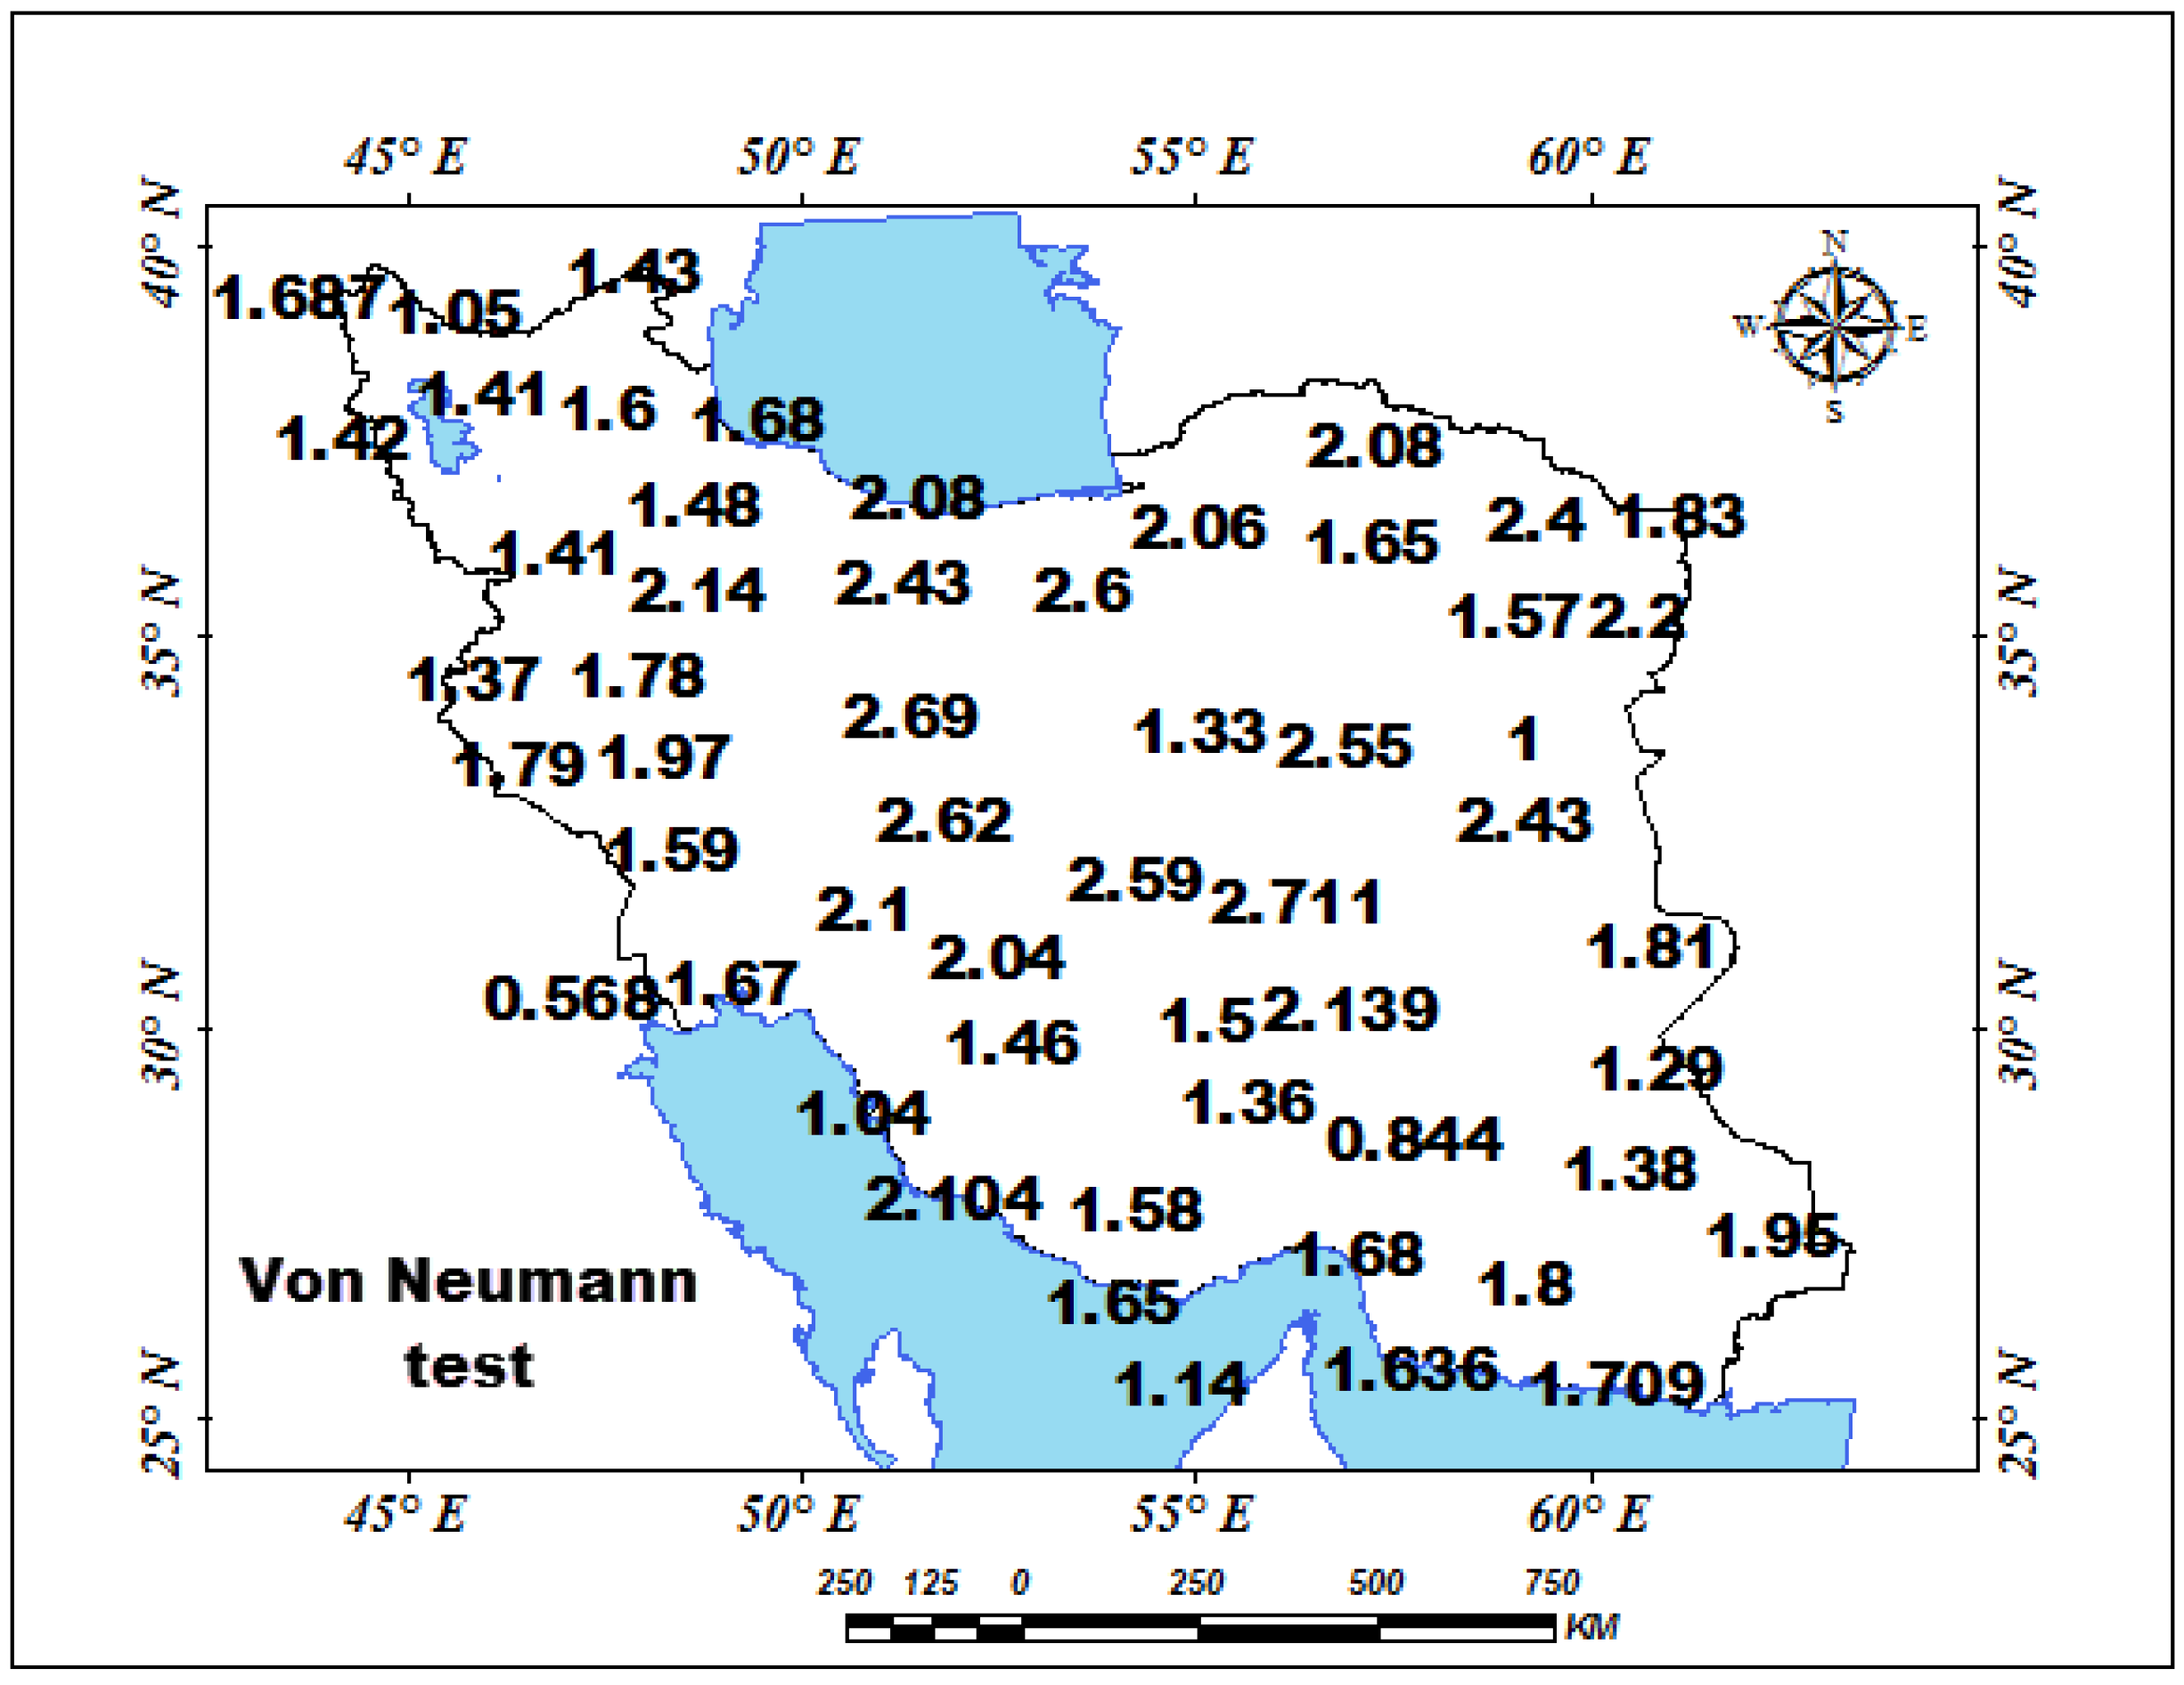
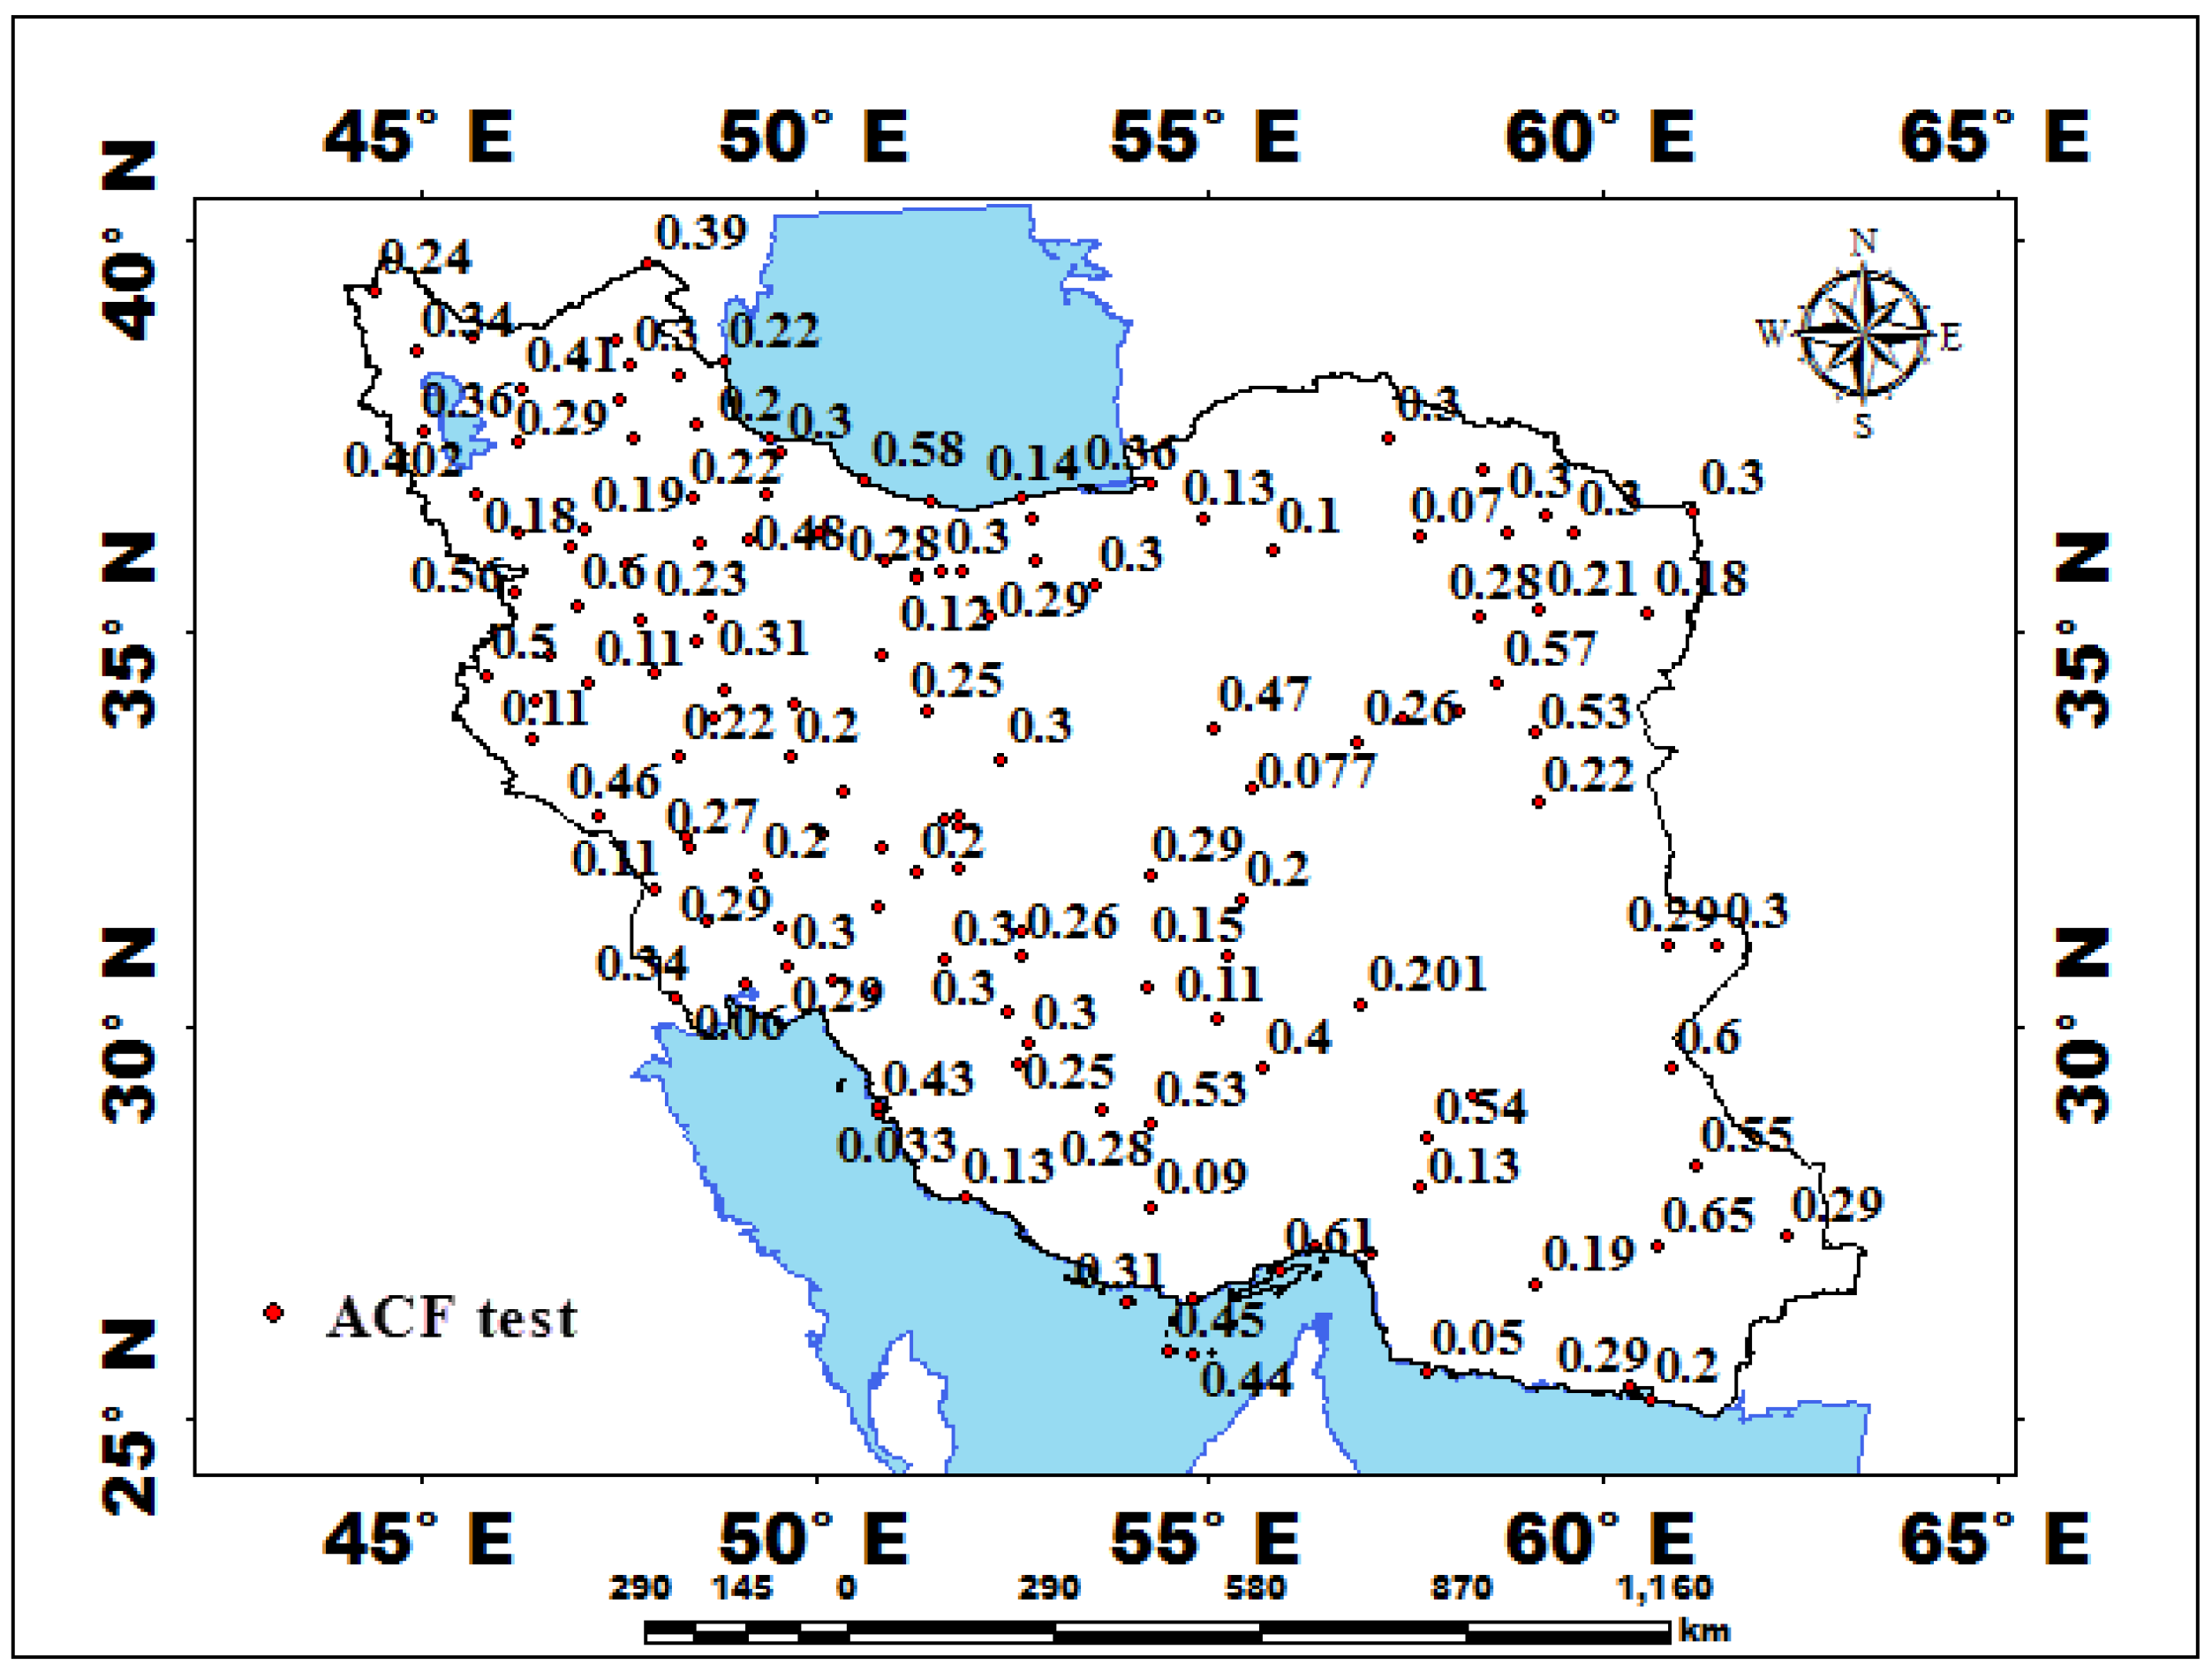
3.2.1. Application of Time Series Tests
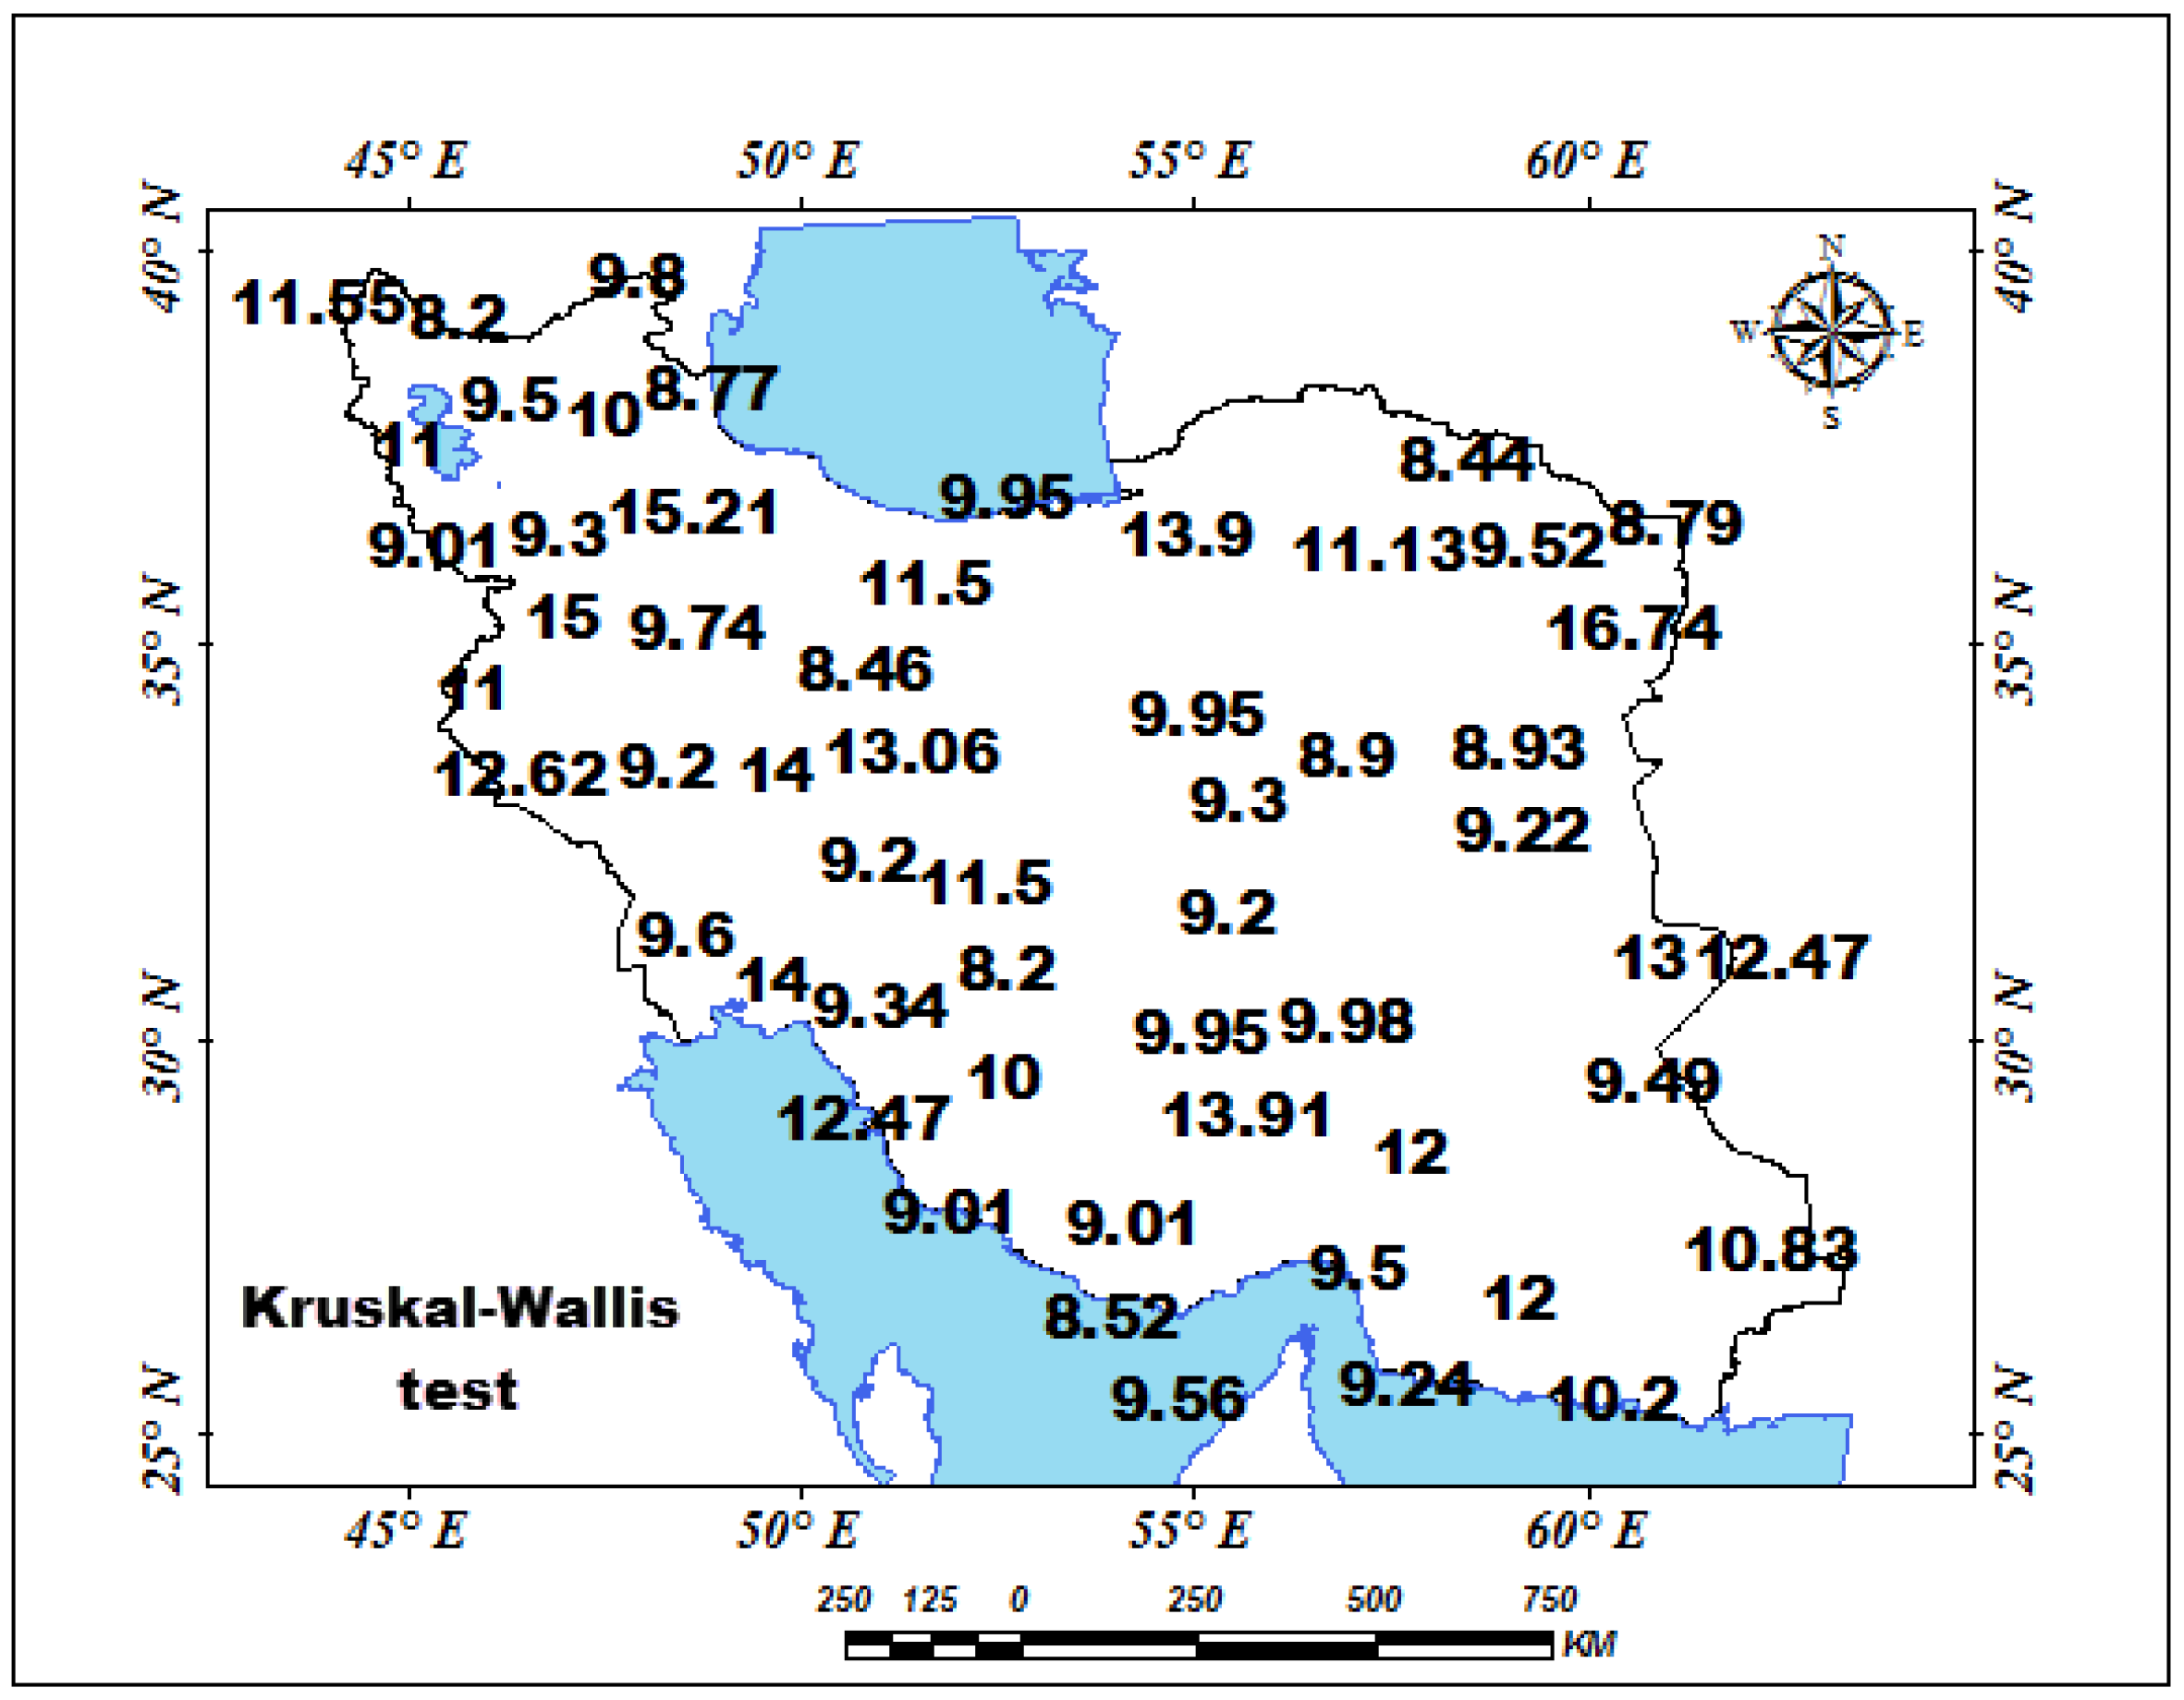
3.2.2. Application of Tests
3.2.3. Forecast Models for Rainfalls Series
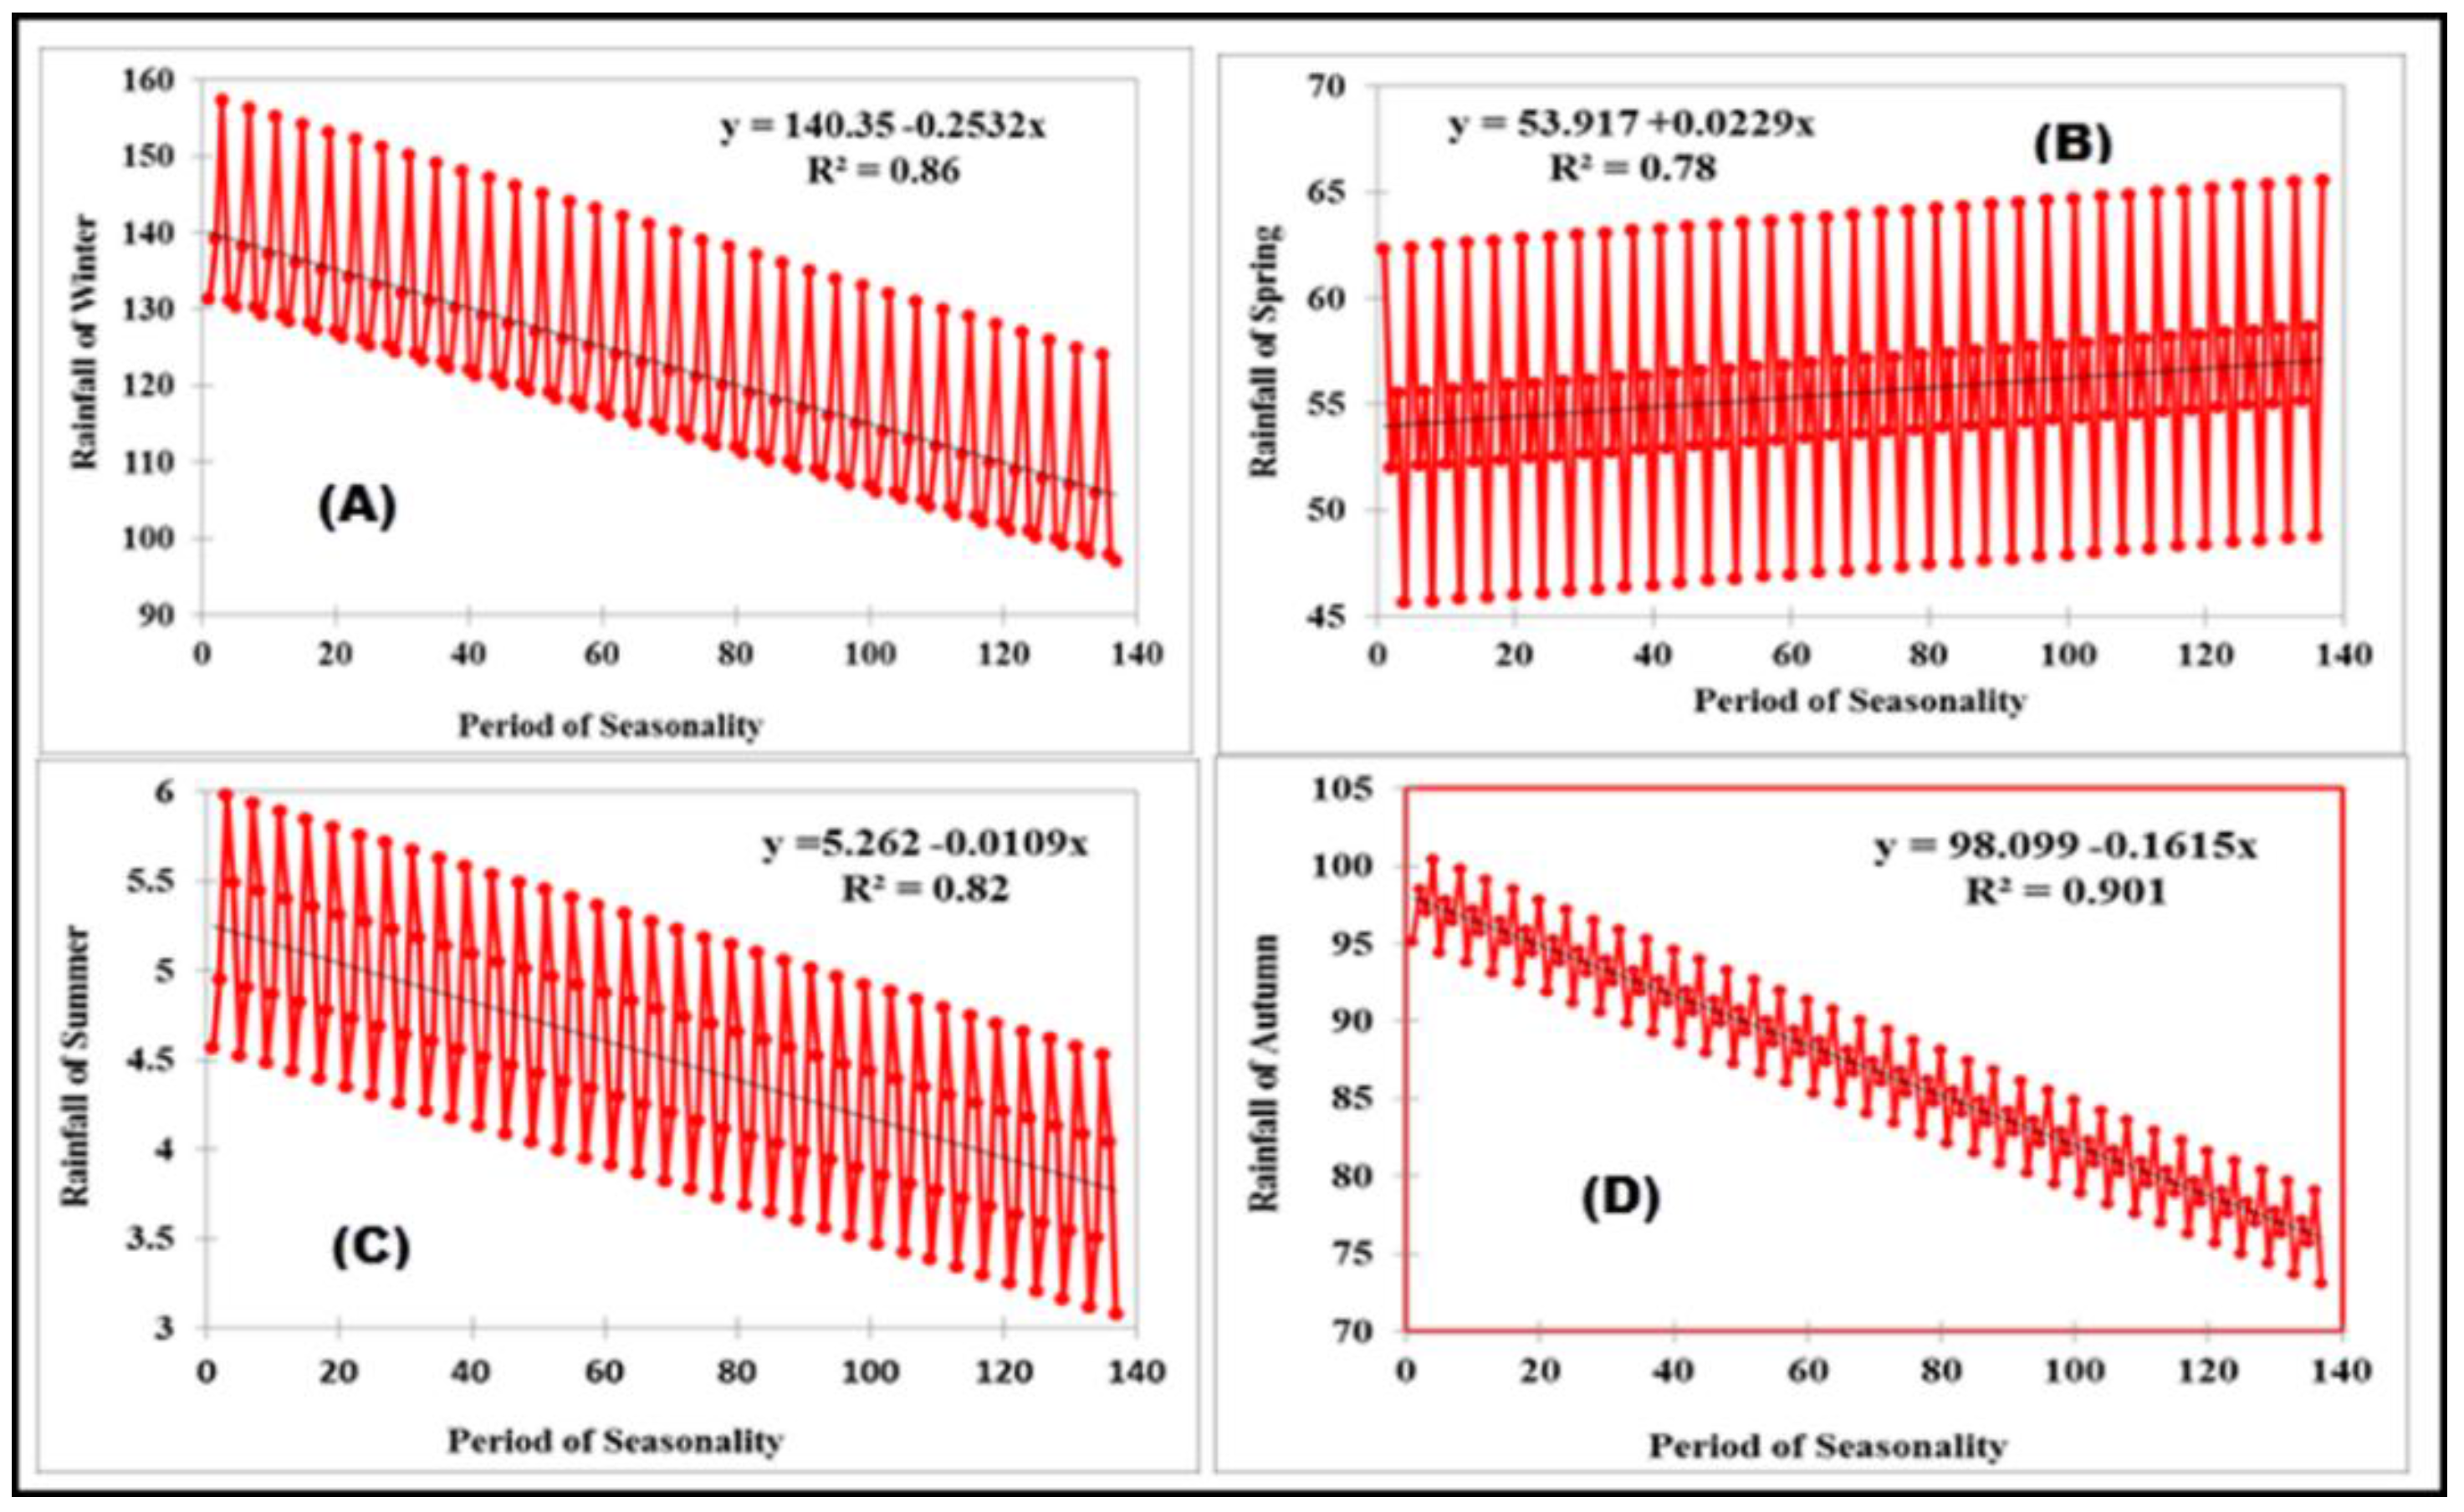
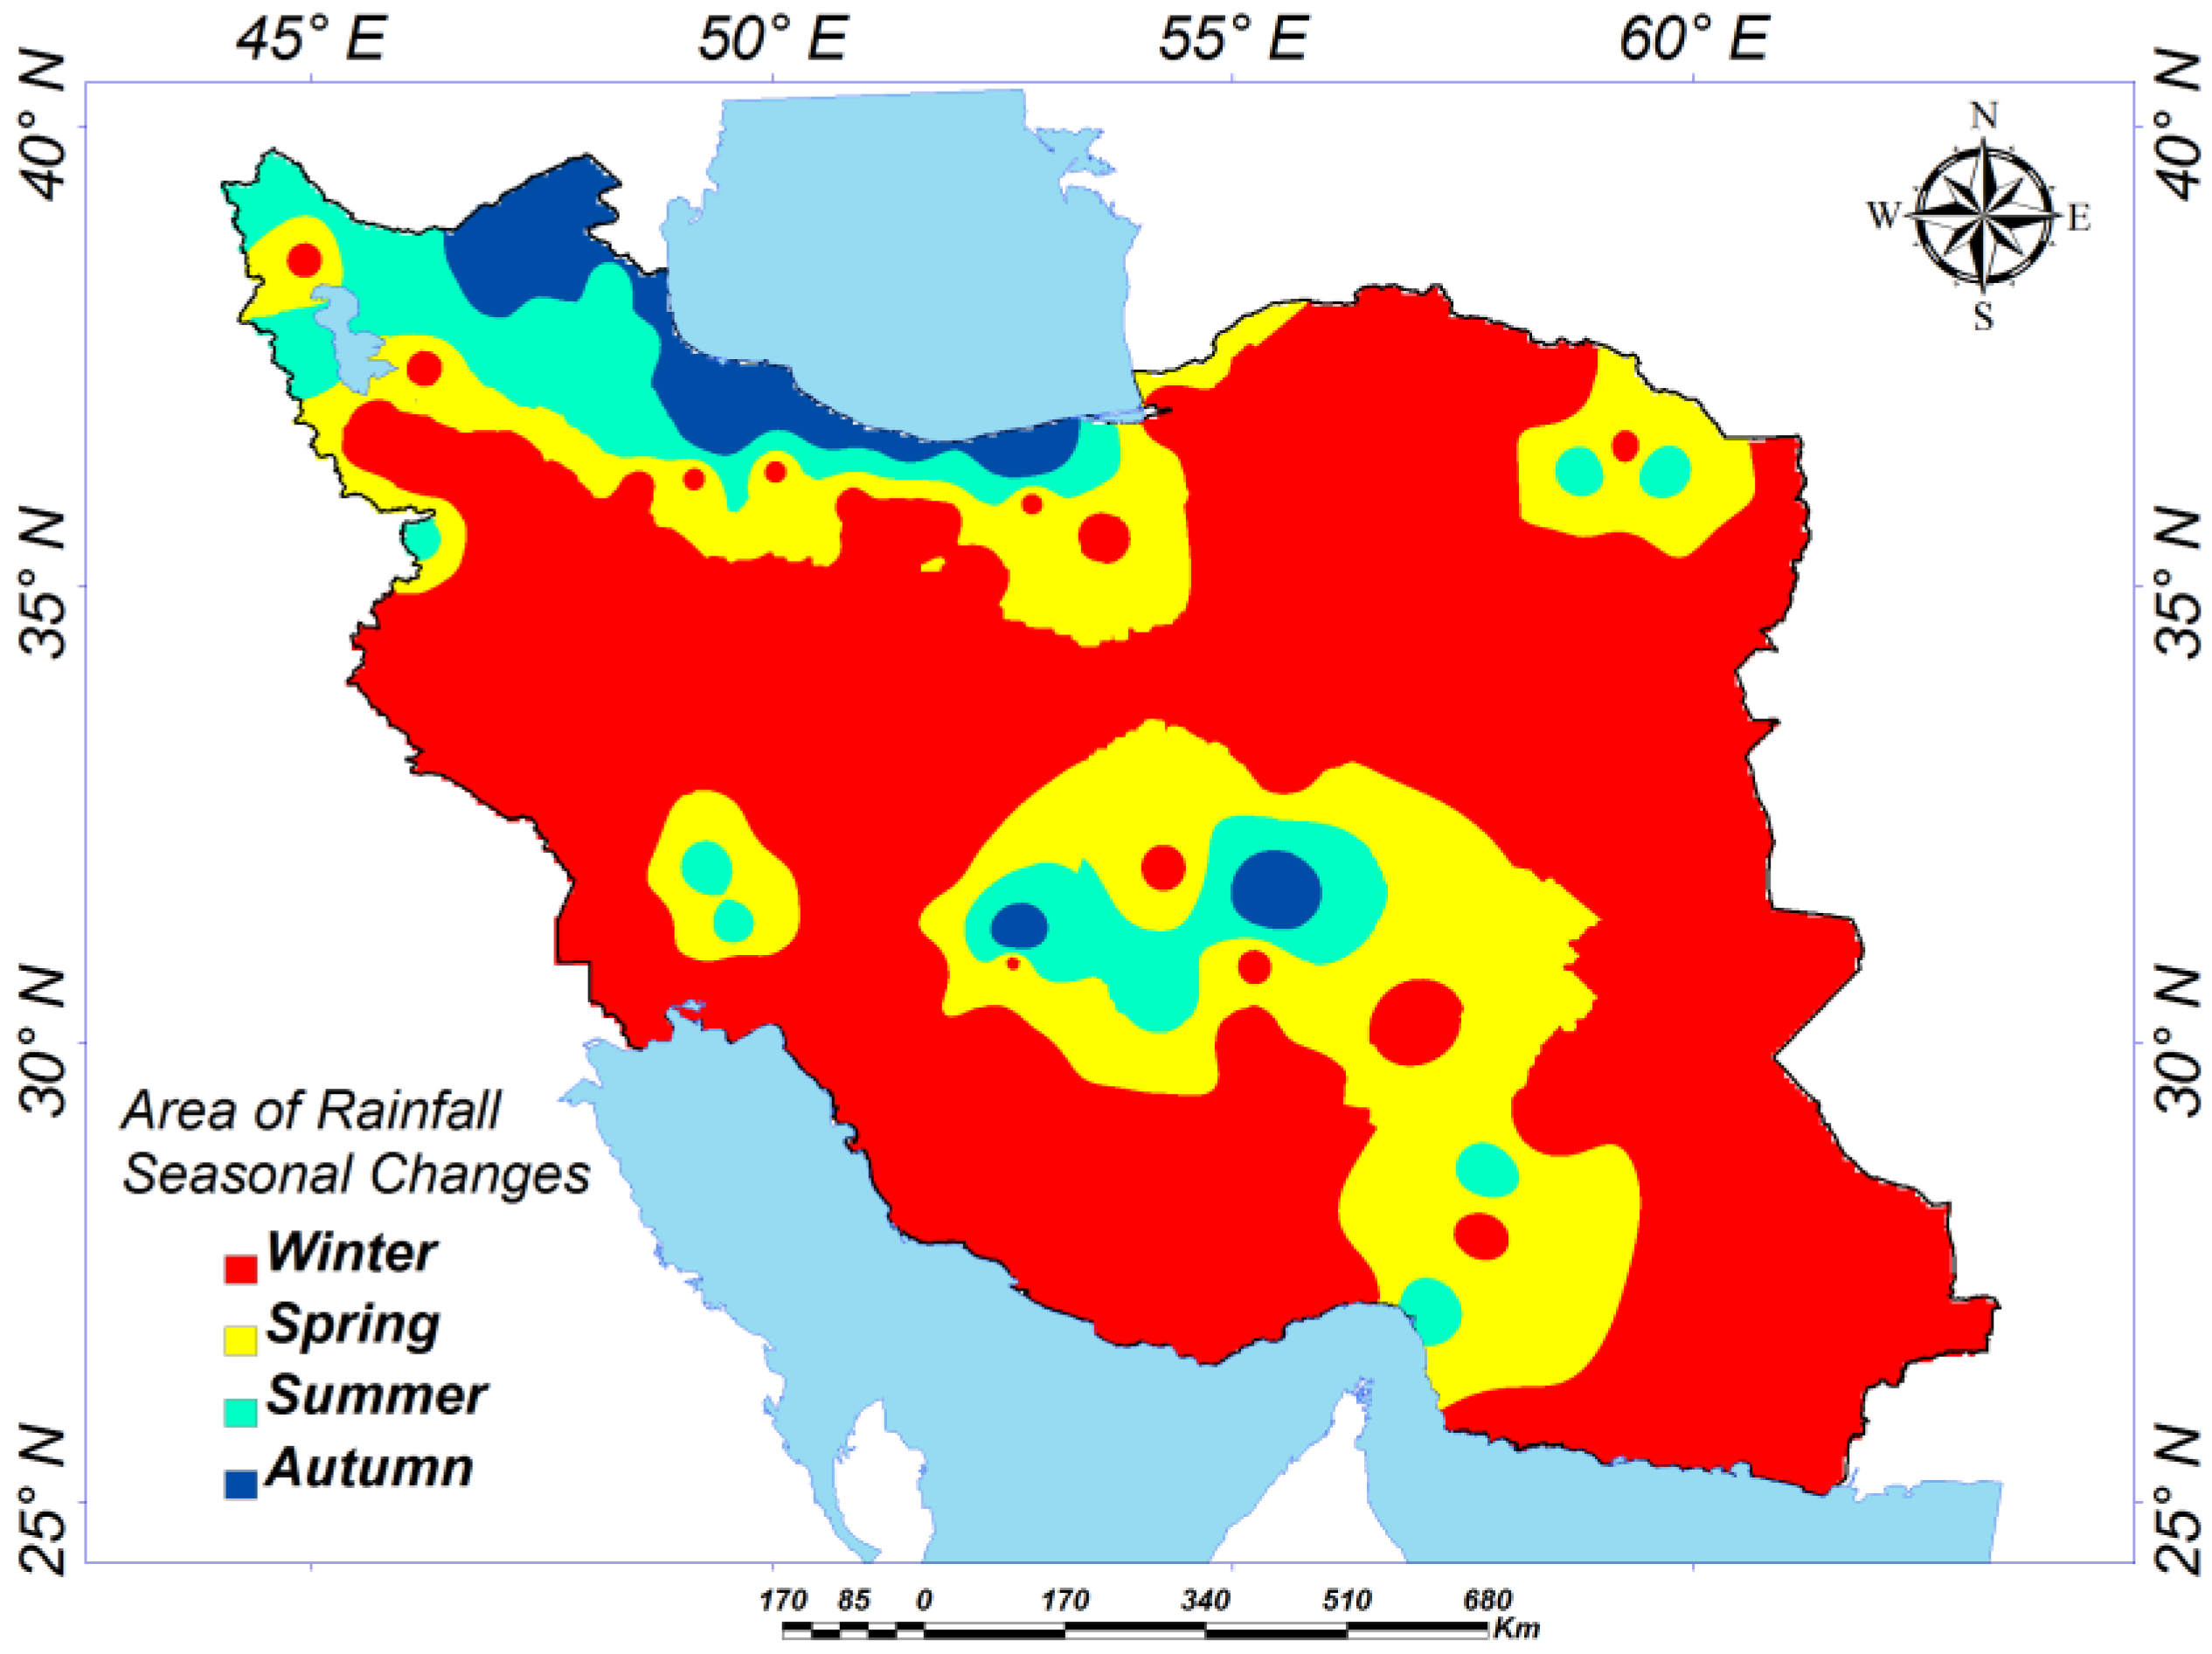
4. Results and Discussion
5. Conclusions
Acknowledgments
Author Contributions
Conflicts of Interest
References
- Talaee, P.H.; Kouchakzadeh, M.; Shifteh Some’e, B.S. Homogeneity analysis of precipitation series in Iran. Theor. Appl. Climatol. 2014, 118, 297–305. [Google Scholar] [CrossRef]
- Talaee, P.H. Iranian rainfall series analysis by means of nonparametric tests. Theor. Appl. Climatol. 2014, 116, 597–607. [Google Scholar] [CrossRef]
- Maussion, F.; Scherer, D.; Mölg, T.; Collier, E.; Curio, J.; Finkelnburg, R. Precipitation seasonality and variability over the Tibetan Plateau as resolved by the high Asia reanalysis. J. Clim. 2013, 27, 1910–1927. [Google Scholar] [CrossRef]
- Dhakal, N.; Jain, S.; Gray, A.; Dandy, M.; Stancioff, E. Nonstationarity in seasonality of extreme precipitation: A nonparametric circular statistical approach and its application. Water Resour. Res. 2015, 51, 4499–4515. [Google Scholar] [CrossRef]
- Pascale, S.; Lucarini, V.; Feng, X.; Porporato, A.; Hasson, S. Analysis of rainfall seasonality from observations and climate models. Clim. Dyn. 2015, 44, 3281–3301. [Google Scholar] [CrossRef]
- Keggenhoff, I.; Elizbarashvili, M.; Amiri-Farahani, A.; King, L. Trends in daily temperature and precipitation extremes over Georgia, 1971–2010. Weather Clim. Extremes 2014, 4, 75–85. [Google Scholar] [CrossRef]
- Powell, E.J.; Keim, B.D. Trends in daily temperature and precipitation extremes for the Southeastern United States: 1948–2012. J. Clim. 2014, 28, 1592–1612. [Google Scholar] [CrossRef]
- Hirsch, R.M.; Slack, J.R. A Nonparametric trend test for seasonal data With serial dependence. Water Resour. Res. 1984, 20, 727–732. [Google Scholar] [CrossRef]
- Buishand, T.A. Some methods for testing the homogeneity of rainfall records. J. Hydrol. 1982, 58, 11–27. [Google Scholar] [CrossRef]
- Sen, P.K. Estimates of the regression coefficient based on Kendall’s tau. J. Am. Stat. Assoc. 1968, 63, 1379–1389. [Google Scholar] [CrossRef]
- Santos, E.B.; Lucio, P.S.; Silva, C.M.S.E. Precipitation regionalization of the Brazilian Amazon. Atmos. Sci. Lett. 2015, 16, 185–192. [Google Scholar] [CrossRef]
- Wijngaard, J.; Klein Tank, A.; Können, G. Homogeneity of 20th century European daily temperature and precipitation series. Int. J. Climatol. 2003, 23, 679–692. [Google Scholar] [CrossRef]
- Alexandersson, H. A homogeneity test applied to precipitation data. J. Climatol. 1986, 6, 661–675. [Google Scholar] [CrossRef]
- Noureldin, D.; Shephard, N.; Sheppard, K. Multivariate rotated ARCH models. J. Econ. 2014, 179, 16–30. [Google Scholar] [CrossRef]
- Santos, M.; Fragoso, M. Precipitation variability in Northern Portugal: Data homogeneity assessment and trends in extreme precipitation indices. Atmos. Res. 2013, 131, 34–45. [Google Scholar] [CrossRef]
- Some’e, B.S.; Ezani, A.; Tabari, H. Spatiotemporal trends and change point of precipitation in Iran. Atmos. Res. 2012, 113, 1–12. [Google Scholar]
- Taxak, A.K.; Murumkar, A.R.; Arya, D.S. Long term spatial and temporal rainfall trends and homogeneity analysis in Wainganga basin, Central India. Weather Clim. Extremes 2014, 4, 50–61. [Google Scholar] [CrossRef]
- Singh, P.; Gupta, A.; Singh, M. Hydrological inferences from watershed analysis for water resource management using remote sensing and GIS techniques. Egypt. J. Remote Sens. Space Sci. 2014, 17, 111–121. [Google Scholar] [CrossRef]
- De Luis, M.; Čufar, K.; Saz, M.; Longares, L.; Ceglar, A.; Kajfež-Bogataj, L. Trends in seasonal precipitation and temperature in Slovenia during 1951–2007. Reg. Environ. Chang. 2014, 14, 1801–1810. [Google Scholar] [CrossRef]
- Montgomery, D.C.; Jennings, C.L.; Kulahci, M. Introduction to Time Series Analysis and Forecasting, 2nd ed.; John Wiley & Sons: Hoboken, NJ, USA, 2015. [Google Scholar]
- Kanji, G.K. 100 Statistical Tests, 3rd ed.; SAGE Publications Ltd.: Londan, UK, 2006. [Google Scholar]
- Machiwal, D.; Jha, M.K. Hydrologic Time Series Analysis: Theory and Practice; Springer: New York, NY, USA, 2012. [Google Scholar]
- Javari, M. Quantitative Methods in Climatology (Trend Models); Payam Resan Press: Tehran, Iran, 2010. [Google Scholar]
- Shapiro, S.S.; Wilk, M.B.; Chen, H.J. A comparative study of various tests for normality. J. Am. Stat. Assoc. 1968, 63, 1343–1372. [Google Scholar] [CrossRef]
- Kourentzes, N.; Petropoulos, F.; Trapero, J.R. Improving forecasting by estimating time series structural components across multiple frequencies. Int. J. Forecast. 2014, 30, 291–302. [Google Scholar] [CrossRef]
- Deepesh, M.; Jha, M.K. Hydrologic Time Series Analysis:Theory and Practice; Springer: New York, NY, USA, 2012. [Google Scholar]
- Zahradníček, P.; Rasol, D.; Cindrić, K.; Štěpánek, P. Homogenization of monthly precipitation time series in Croatia. Int. J. Climatol. 2014, 34, 3671–3682. [Google Scholar] [CrossRef]
- Brockwell, P.J.; Davis, R.A. Time Series: Theory and Methods; Springer Science & Business Media: Berlin, Germany, 2013. [Google Scholar]
- Moran, P.A.P. Notes on continuous stochastic phenomena. Biometrika 1950, 37, 17–23. [Google Scholar] [CrossRef]
- Johnston, K.; Ver Hoef, J.M.; Krivoruchko, K.; Lucas, N. Using ArcGIS Geostatistical Analyst; Esri Redlands, 2001. [Google Scholar]
- IRIMO. Islamic Republic of Iran Meteorological Office. Available online: http://www.irimo.ir (accessed on 6 September 2016).
- Xu, G.; Jiao, L.; Zhao, S.; Cheng, J. Spatial and temporal variability of PM2.5 concentration in China. Wuhan Univ. J. Nat. Sci. 2016, 21, 358–368. [Google Scholar] [CrossRef]
- Javari, M. Spatial neighborhood analysis of the monthly rainfall in Iran. Geoinfor. Geostat. Overv. 2015, 18, 1975–2014. [Google Scholar]
- Chambers, J.M.; Cleveland, W.S.; Kleiner, B.; Tukey, P.A. Graphical Methods for Data Analysis, 1st ed.; Wadsworth International Group: Belmont, CA, USA, 1983. [Google Scholar]
- Neteler, M.; Bowman, M.H.; Landa, M.; Metz, M. GRASS GIS: A multi-purpose open source GIS. Environ Model Softw. 2012, 31, 124–130. [Google Scholar] [CrossRef]
- Shumway, R.H.; Stoffer, D.S. Time Series Analysis and its Applications, 3rd ed.; Springer Science & Business Media: Berlin, Germany, 2013. [Google Scholar]
- Yue, S.; Pilon, P.; Cavadias, G. Power of the Mann-Kendall and Spearman’s rho tests for detecting monotonic trends in hydrological series. J. Hydrol. 2002, 259, 254–271. [Google Scholar] [CrossRef]
- Farnum, R.N.; Staton, L.W. Quantitative Forecasting Methods; Pws Pub Co.: Boston, MA, USA, 1989. [Google Scholar]
- Mann, H.B. Nonparametric tests against trend. Econ. J. Econ. Soc. 1945, 13, 245–259. [Google Scholar] [CrossRef]
- Goswami, B.; Venugopal, V.; Sengupta, D.; Madhusoodanan, M.; Xavier, P.K. Increasing trend of extreme rain events over India in a warming environment. Science 2006, 314, 1442–1445. [Google Scholar] [CrossRef] [PubMed]
- Pettitt, A.N. A Non-Parametric Approach to the Change-Point Problem. J. R. Stat. Soc. Ser. C (Appl. Stat.) 1979, 28, 126–135. [Google Scholar] [CrossRef]
- McCuen, R.H. Modeling Hydrologic Change: Statistical Methods; CRC Press Company: Boca Raton, London, UK, 2003. [Google Scholar]
- Pohlmann, H. Geostatistical modelling of environmental data. CATENA 1993, 20, 191–198. [Google Scholar] [CrossRef]
- Lillesand, T.; Kiefer, R.W.; Chipman, J. Remote Sensing and Image Interpretation; John Wiley & Sons: Hoboken, NJ, USA, 2014. [Google Scholar]
- Javari, M. Geostatistical and spatial statistical modelling of precipitation variations in Iran. J. Civ. Environ. Eng. 2016, 6, 1–30. [Google Scholar] [CrossRef]
- Kumar, V.; Jain, S.K.; Singh, Y. Analysis of long-term rainfall trends in India. Hydrol. Sci. J. 2010, 55, 484–496. [Google Scholar] [CrossRef]
- Stoffer, D.S.; Shumway, R.H. Time Series Analysis and Its Application: With R Examples; Springer Science & Business Media: Berlin, Germany, 2000. [Google Scholar]
- North, G.R. Statistical methods|data analysis: Time series analysis. In Encyclopedia of Atmospheric Sciences, 2nd ed.; Zhang, G.R.N.P., Ed.; Academic Press: Deditor Oxford, UK, 2015; pp. 205–210. [Google Scholar]
- Woody, J. Time series regression with persistent level shifts. Stat. Probab. Lett. 2015, 102, 22–29. [Google Scholar] [CrossRef]
- Zeng, X.; Wang, D.; Wu, J. Comparisons of Methods of Goodness of Fit Tests in Hydrologic Analysis; CRC Press: Boca Raton, FL, USA, 2015. [Google Scholar]
- Ifeka, A.; Akinbobola, A. Trend analysis of precipitation in some selected stations in Anambra State. Atmos. Clim. Sci. 2015, 5, 1–12. [Google Scholar] [CrossRef] [Green Version]
- Khashei, M.; Rafiei, F.M.; Mirahmadi, A. Seasonal interval time series models in comparative study of industrial forecasting. Int. J. Curr. Trends Eng. Technol. 2015, I, 51–58. [Google Scholar]
- Becketti, S. Introduction to Time Series Using Stata; Stata Press Books: College Station, TX, USA, 2013. [Google Scholar]
- Grimaldi, S.; Kao, S.C.; Castellarin, A.; Papalexiou, S.M.; Viglione, A.; Laio, F.; Aksoy, H.; Gedikli, A. 2.18-statistical hydrology. In Treatise on Water Science; Wilderer, P., Ed.; Elsevier: Oxford, UK, 2011; pp. 479–517. [Google Scholar]
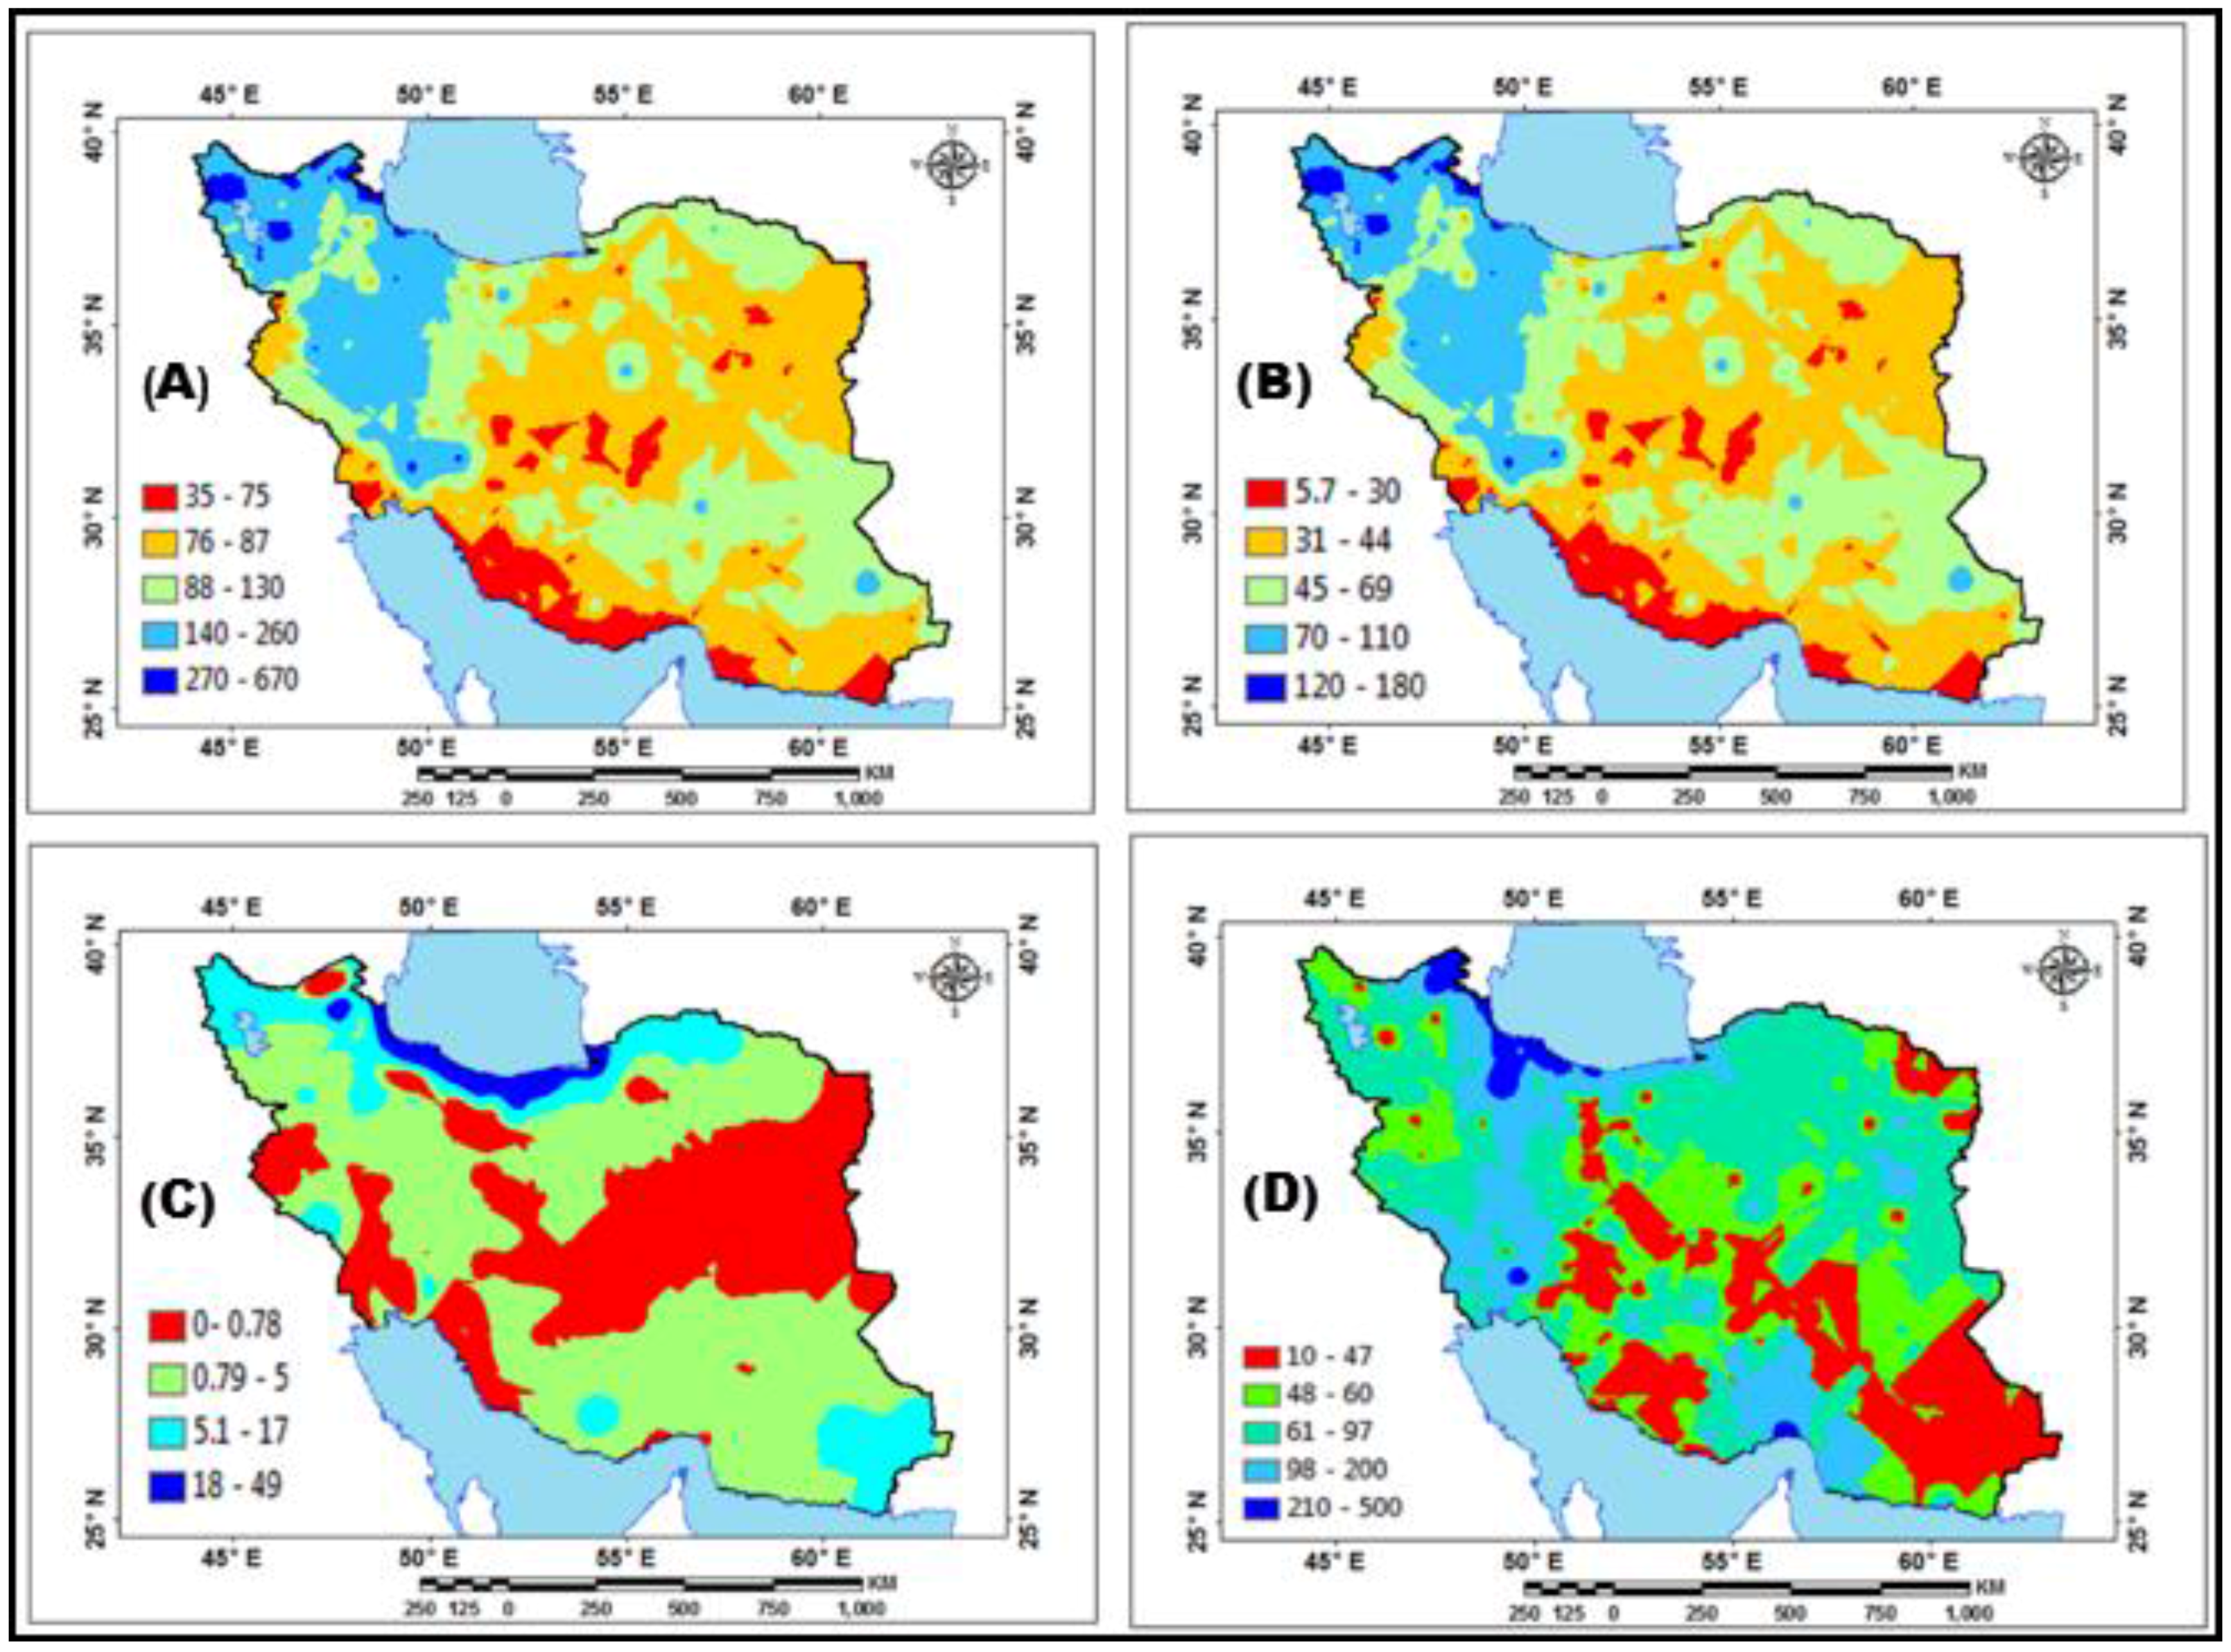
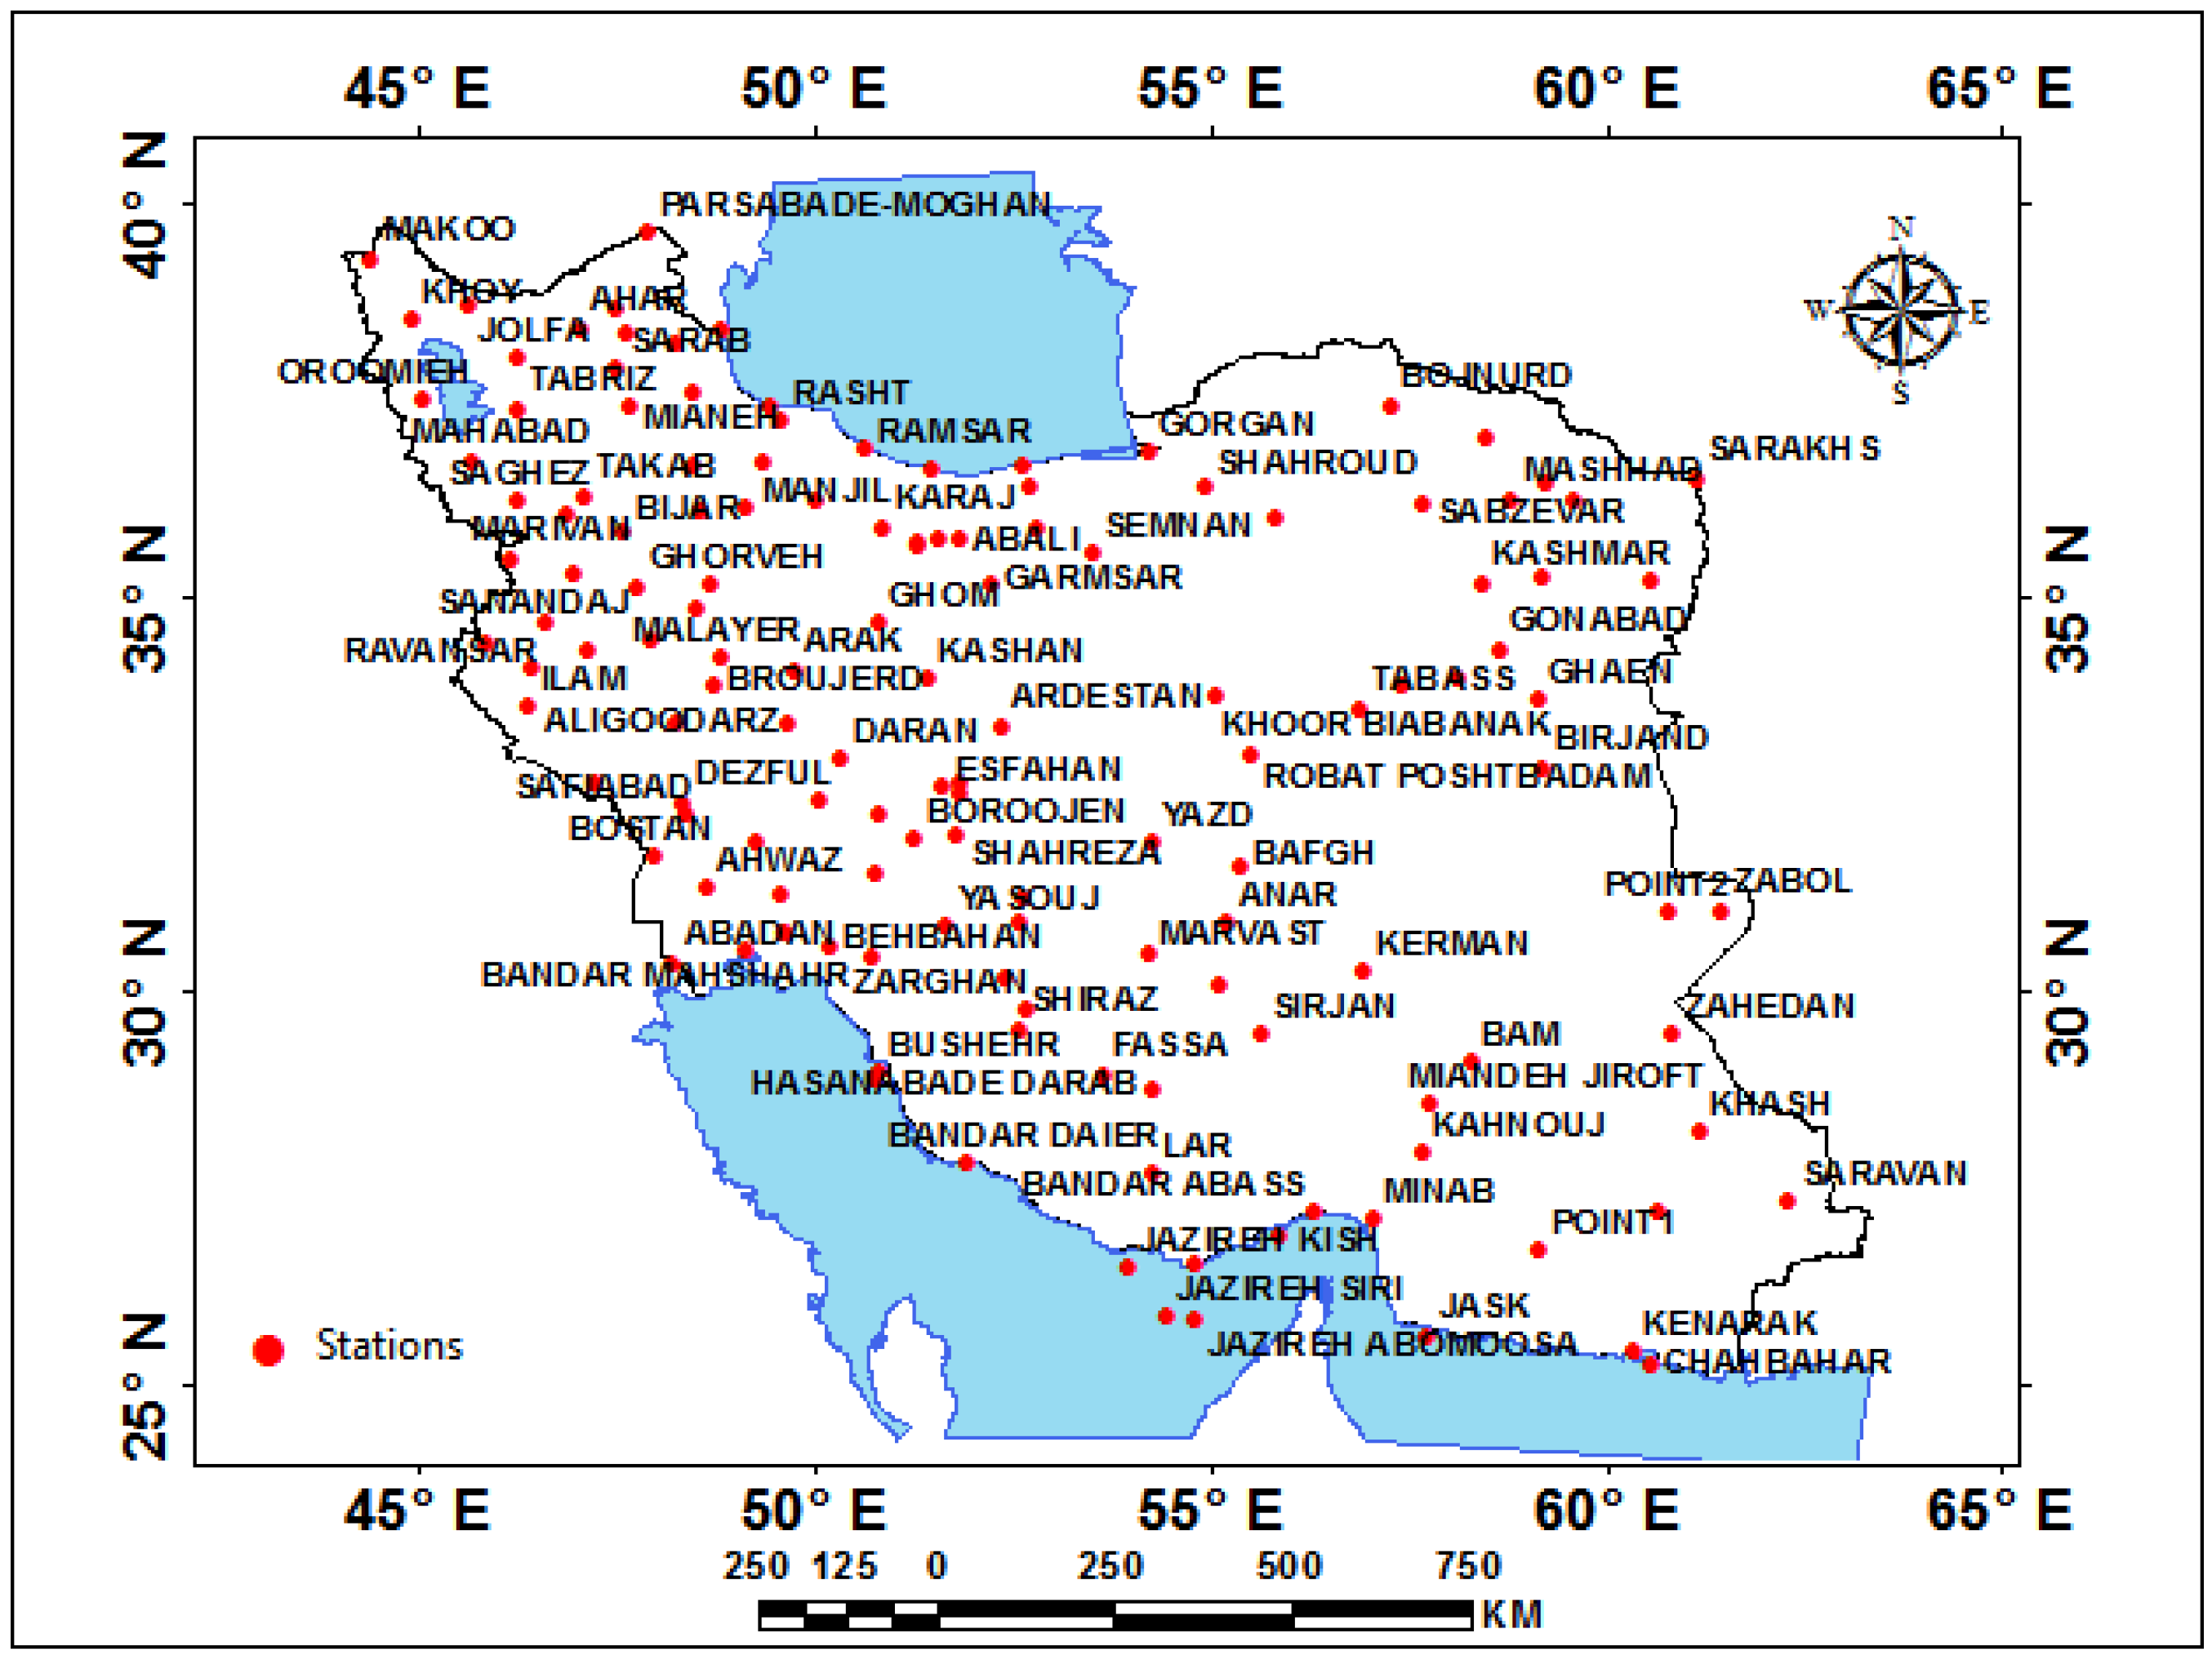
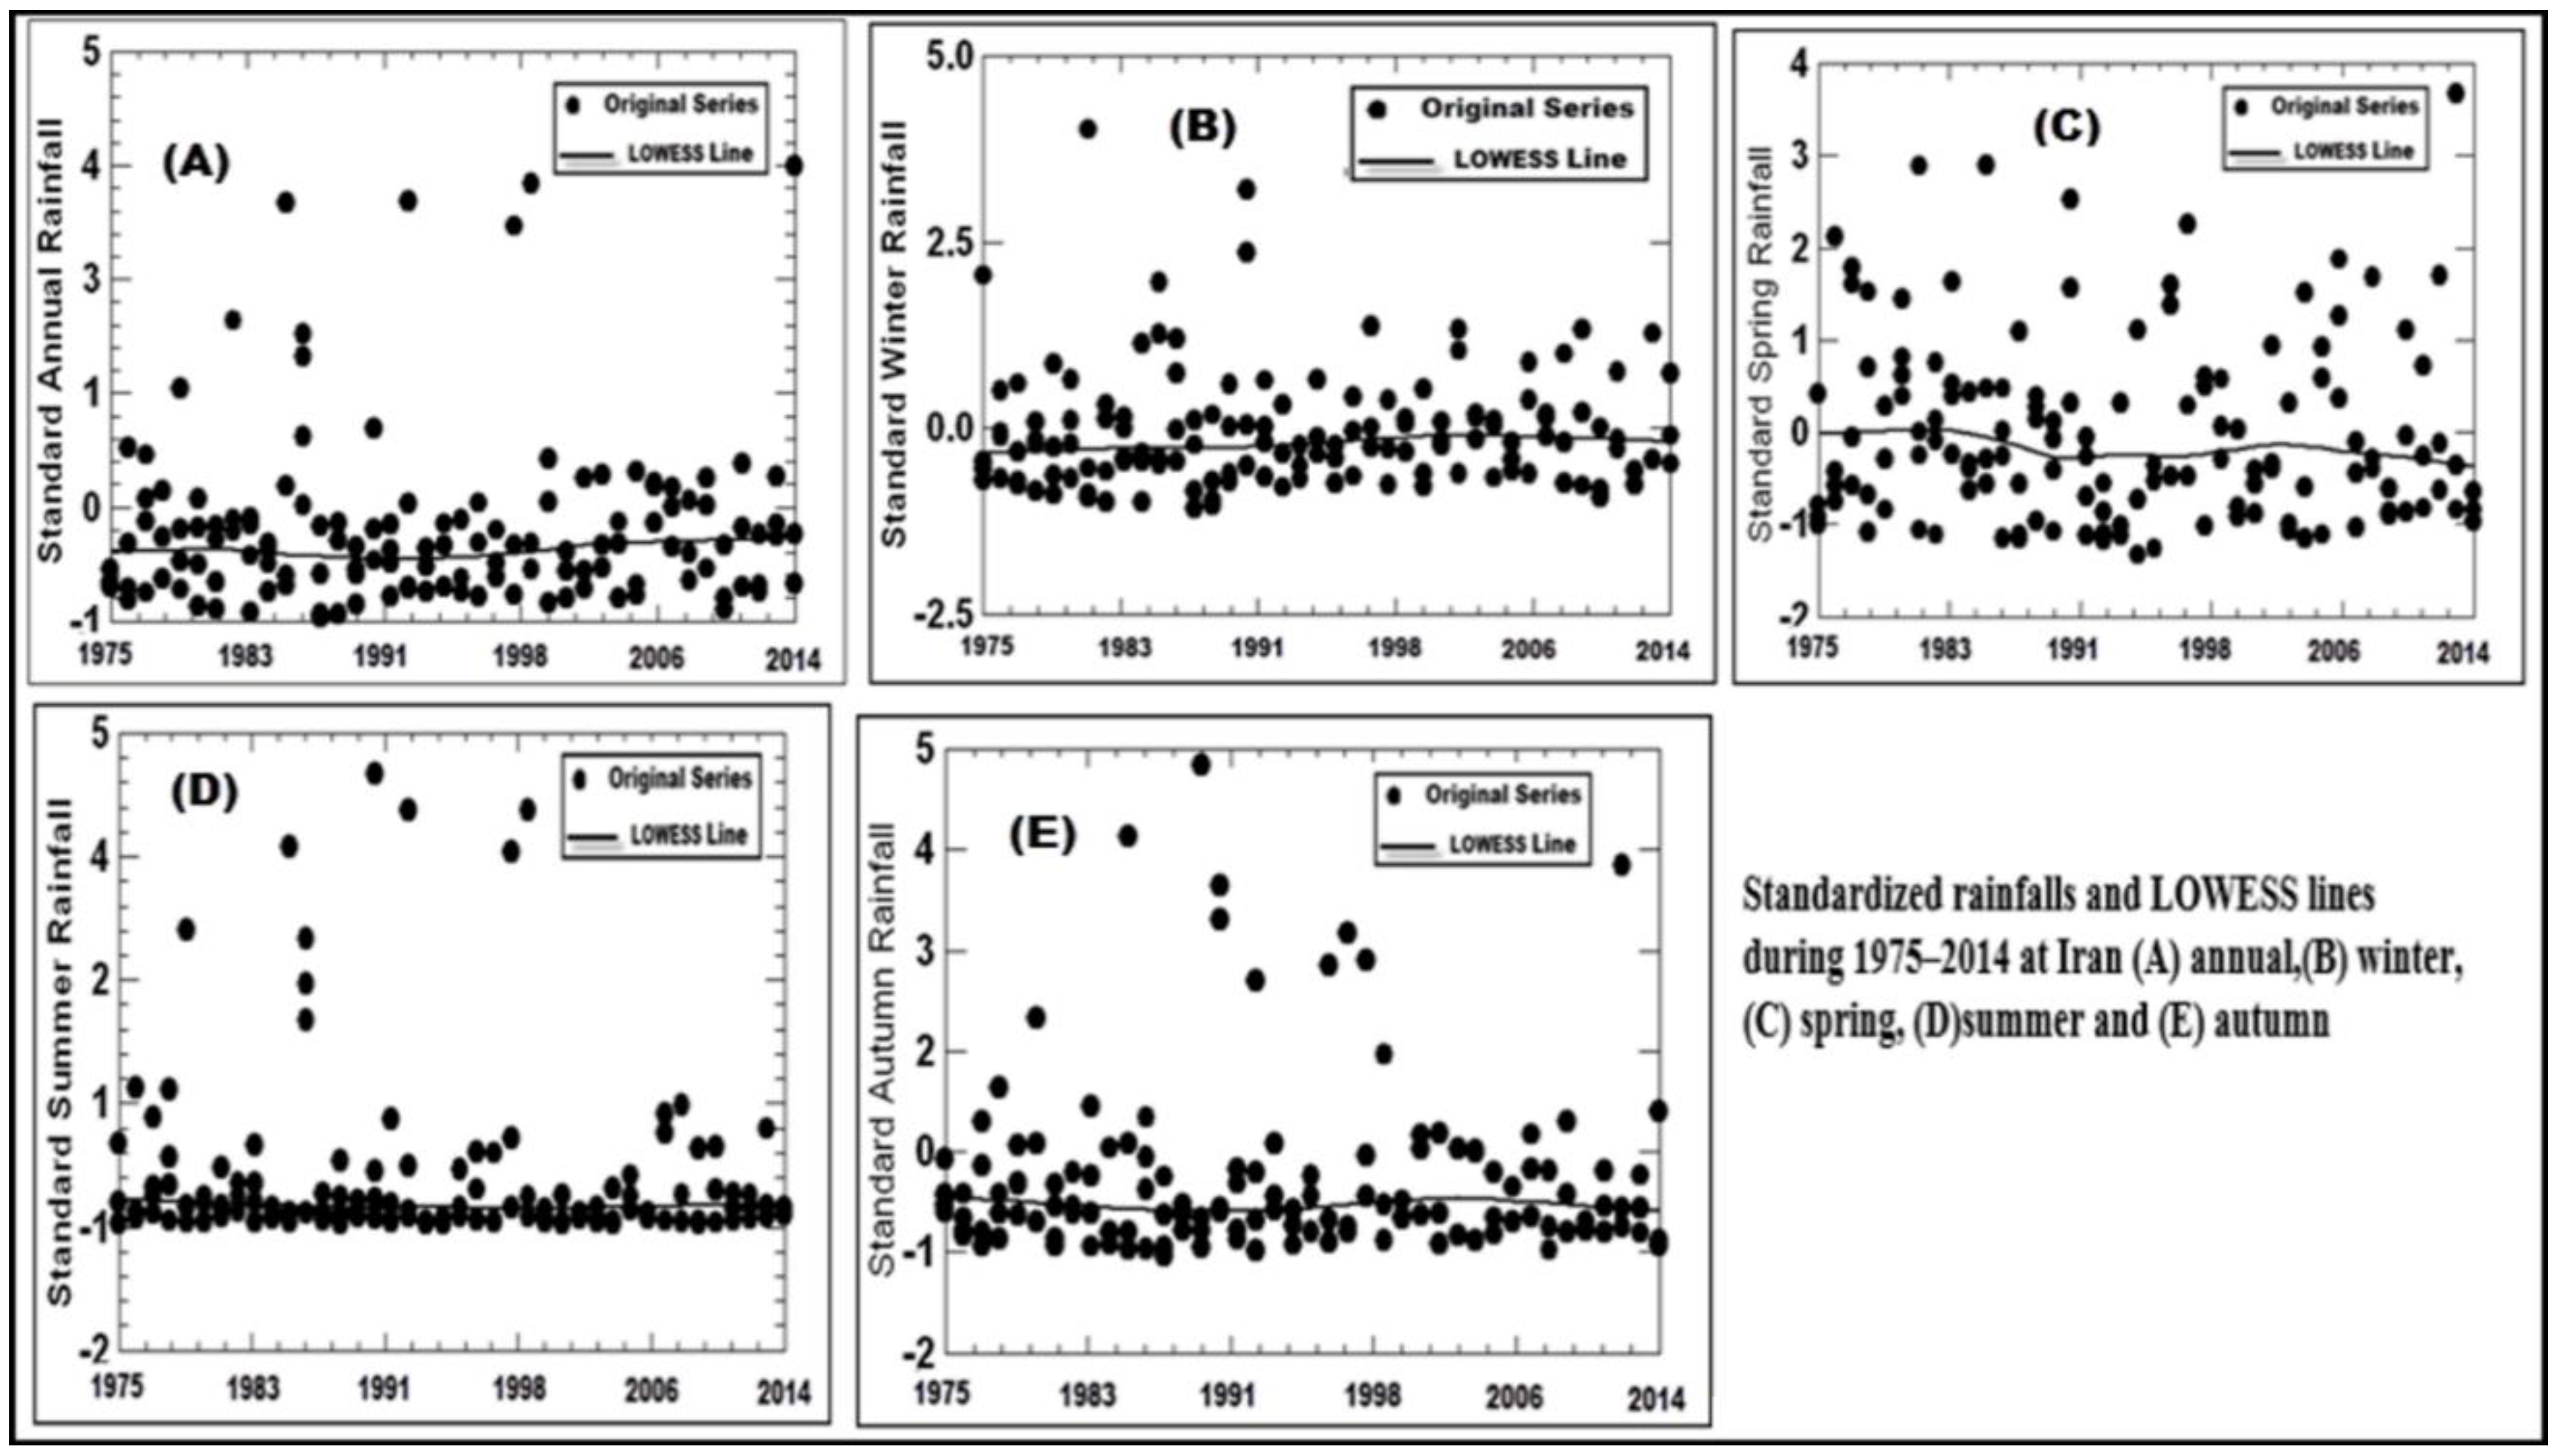
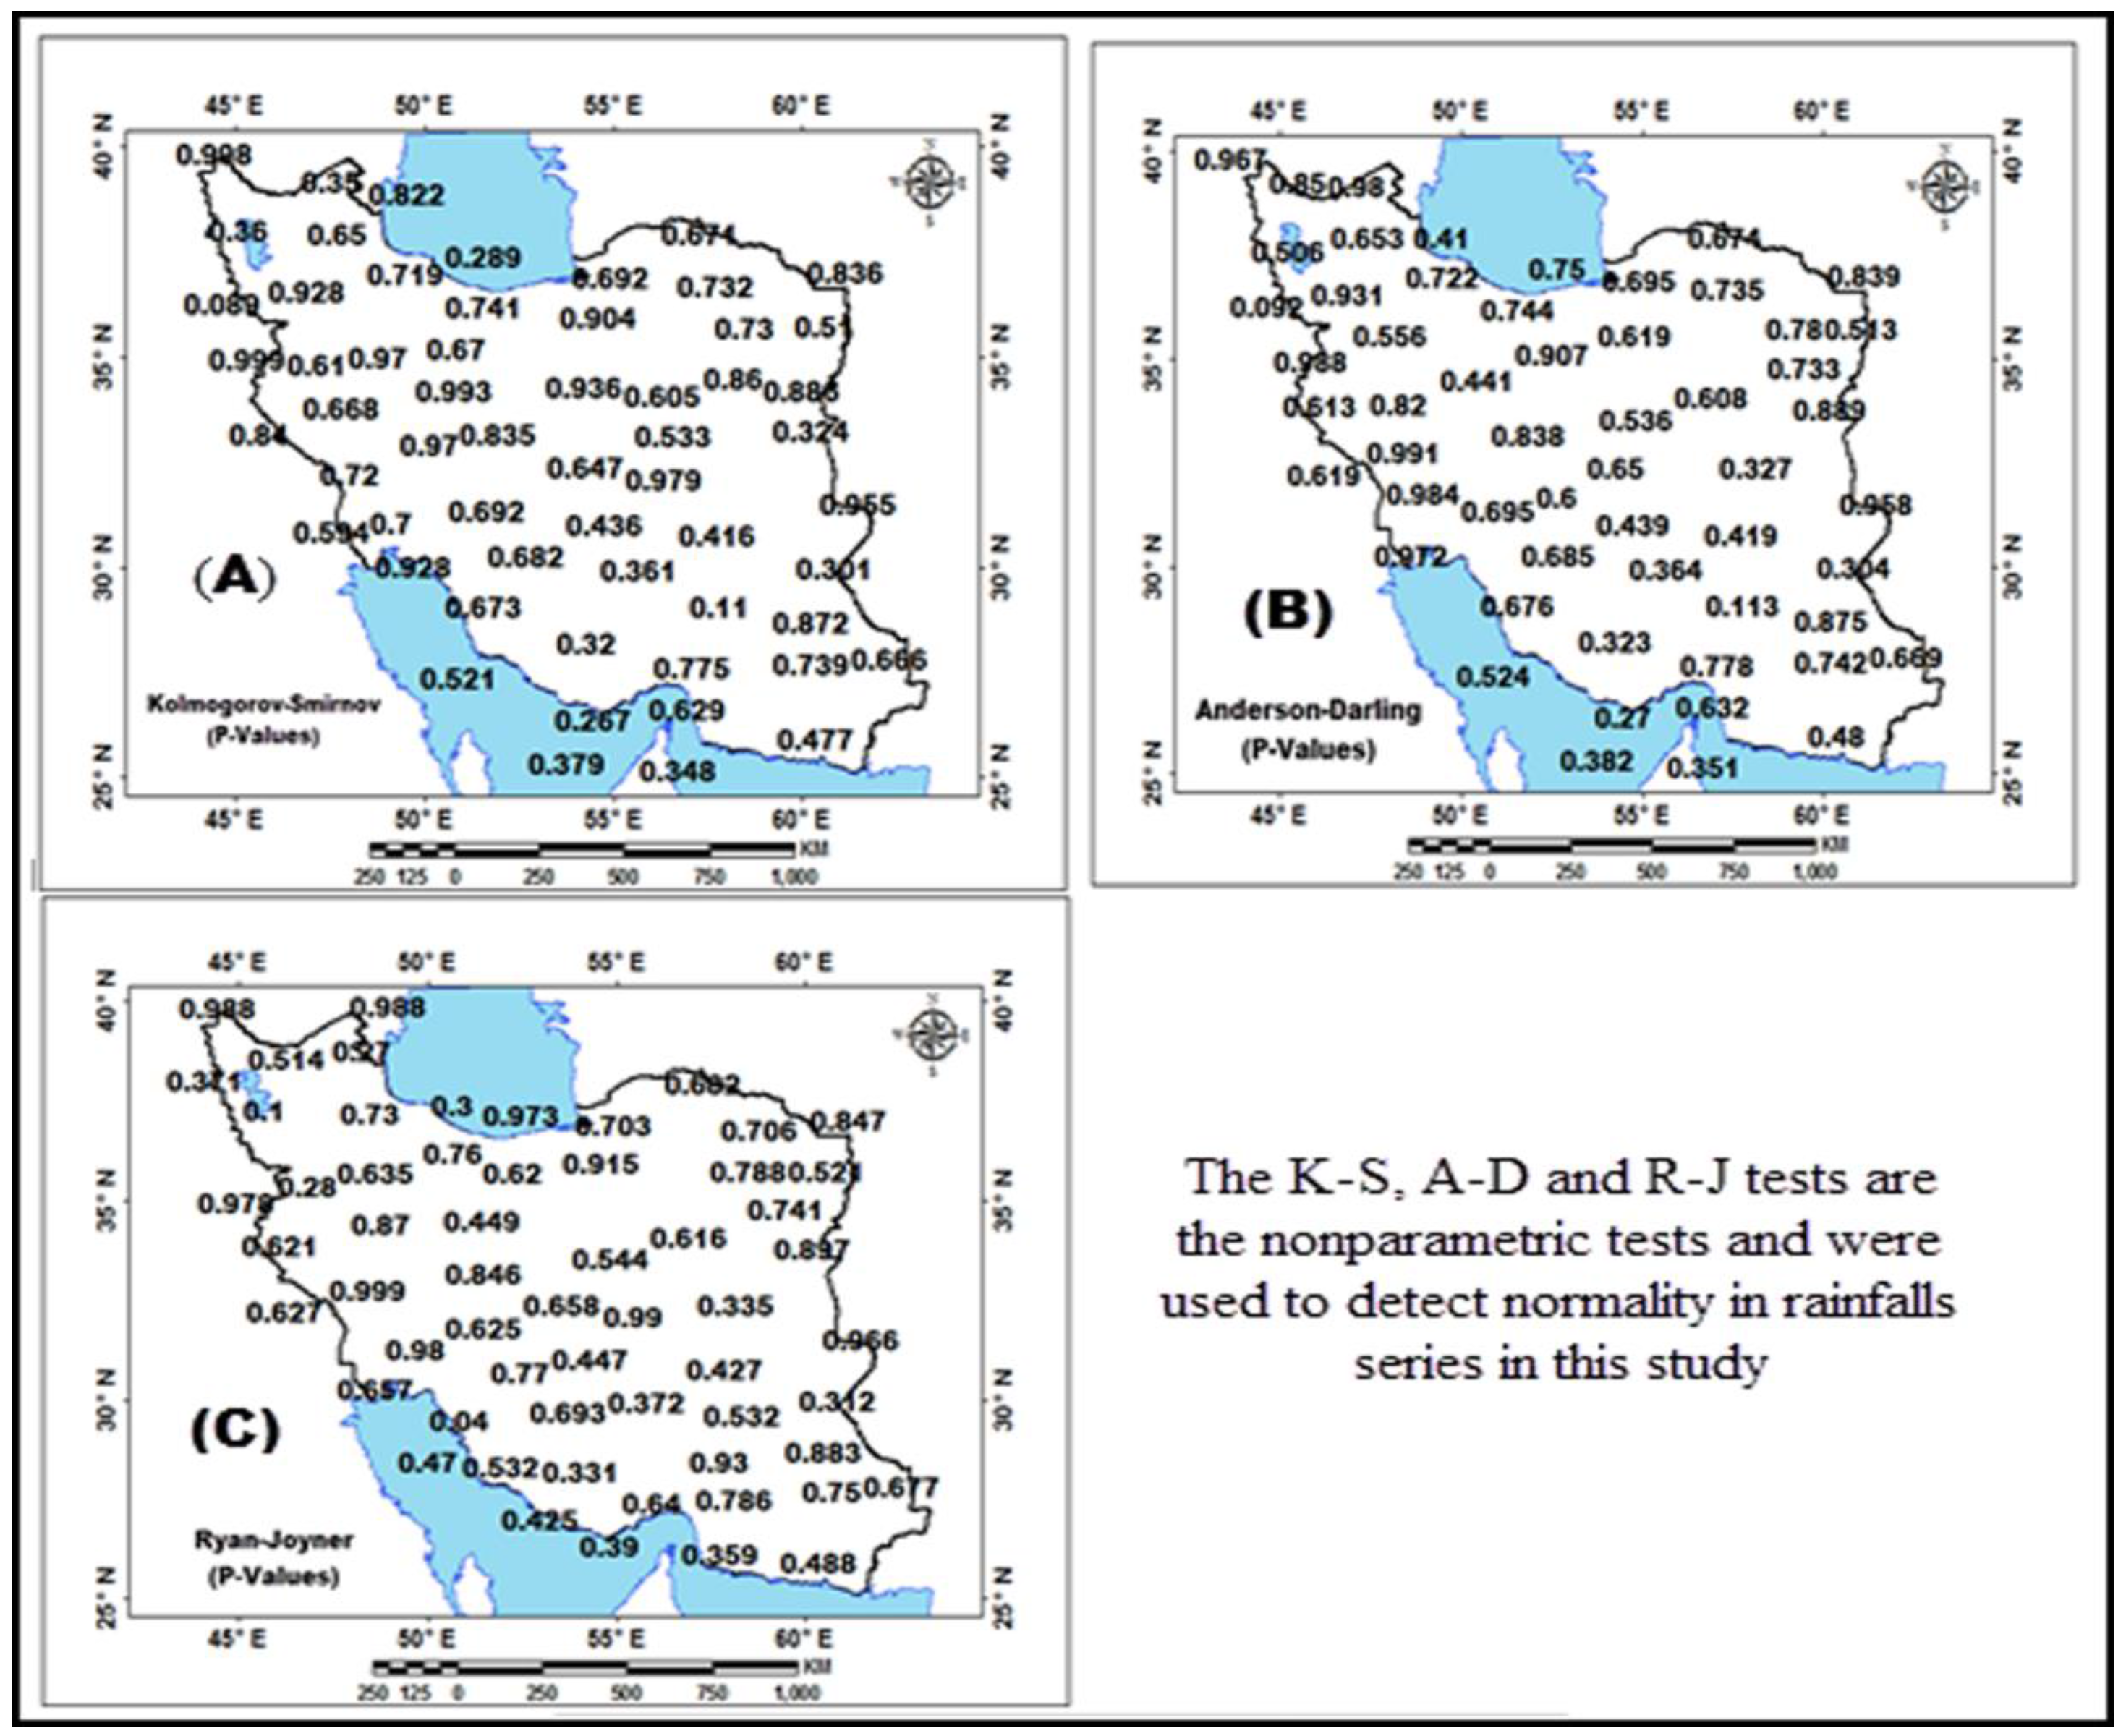
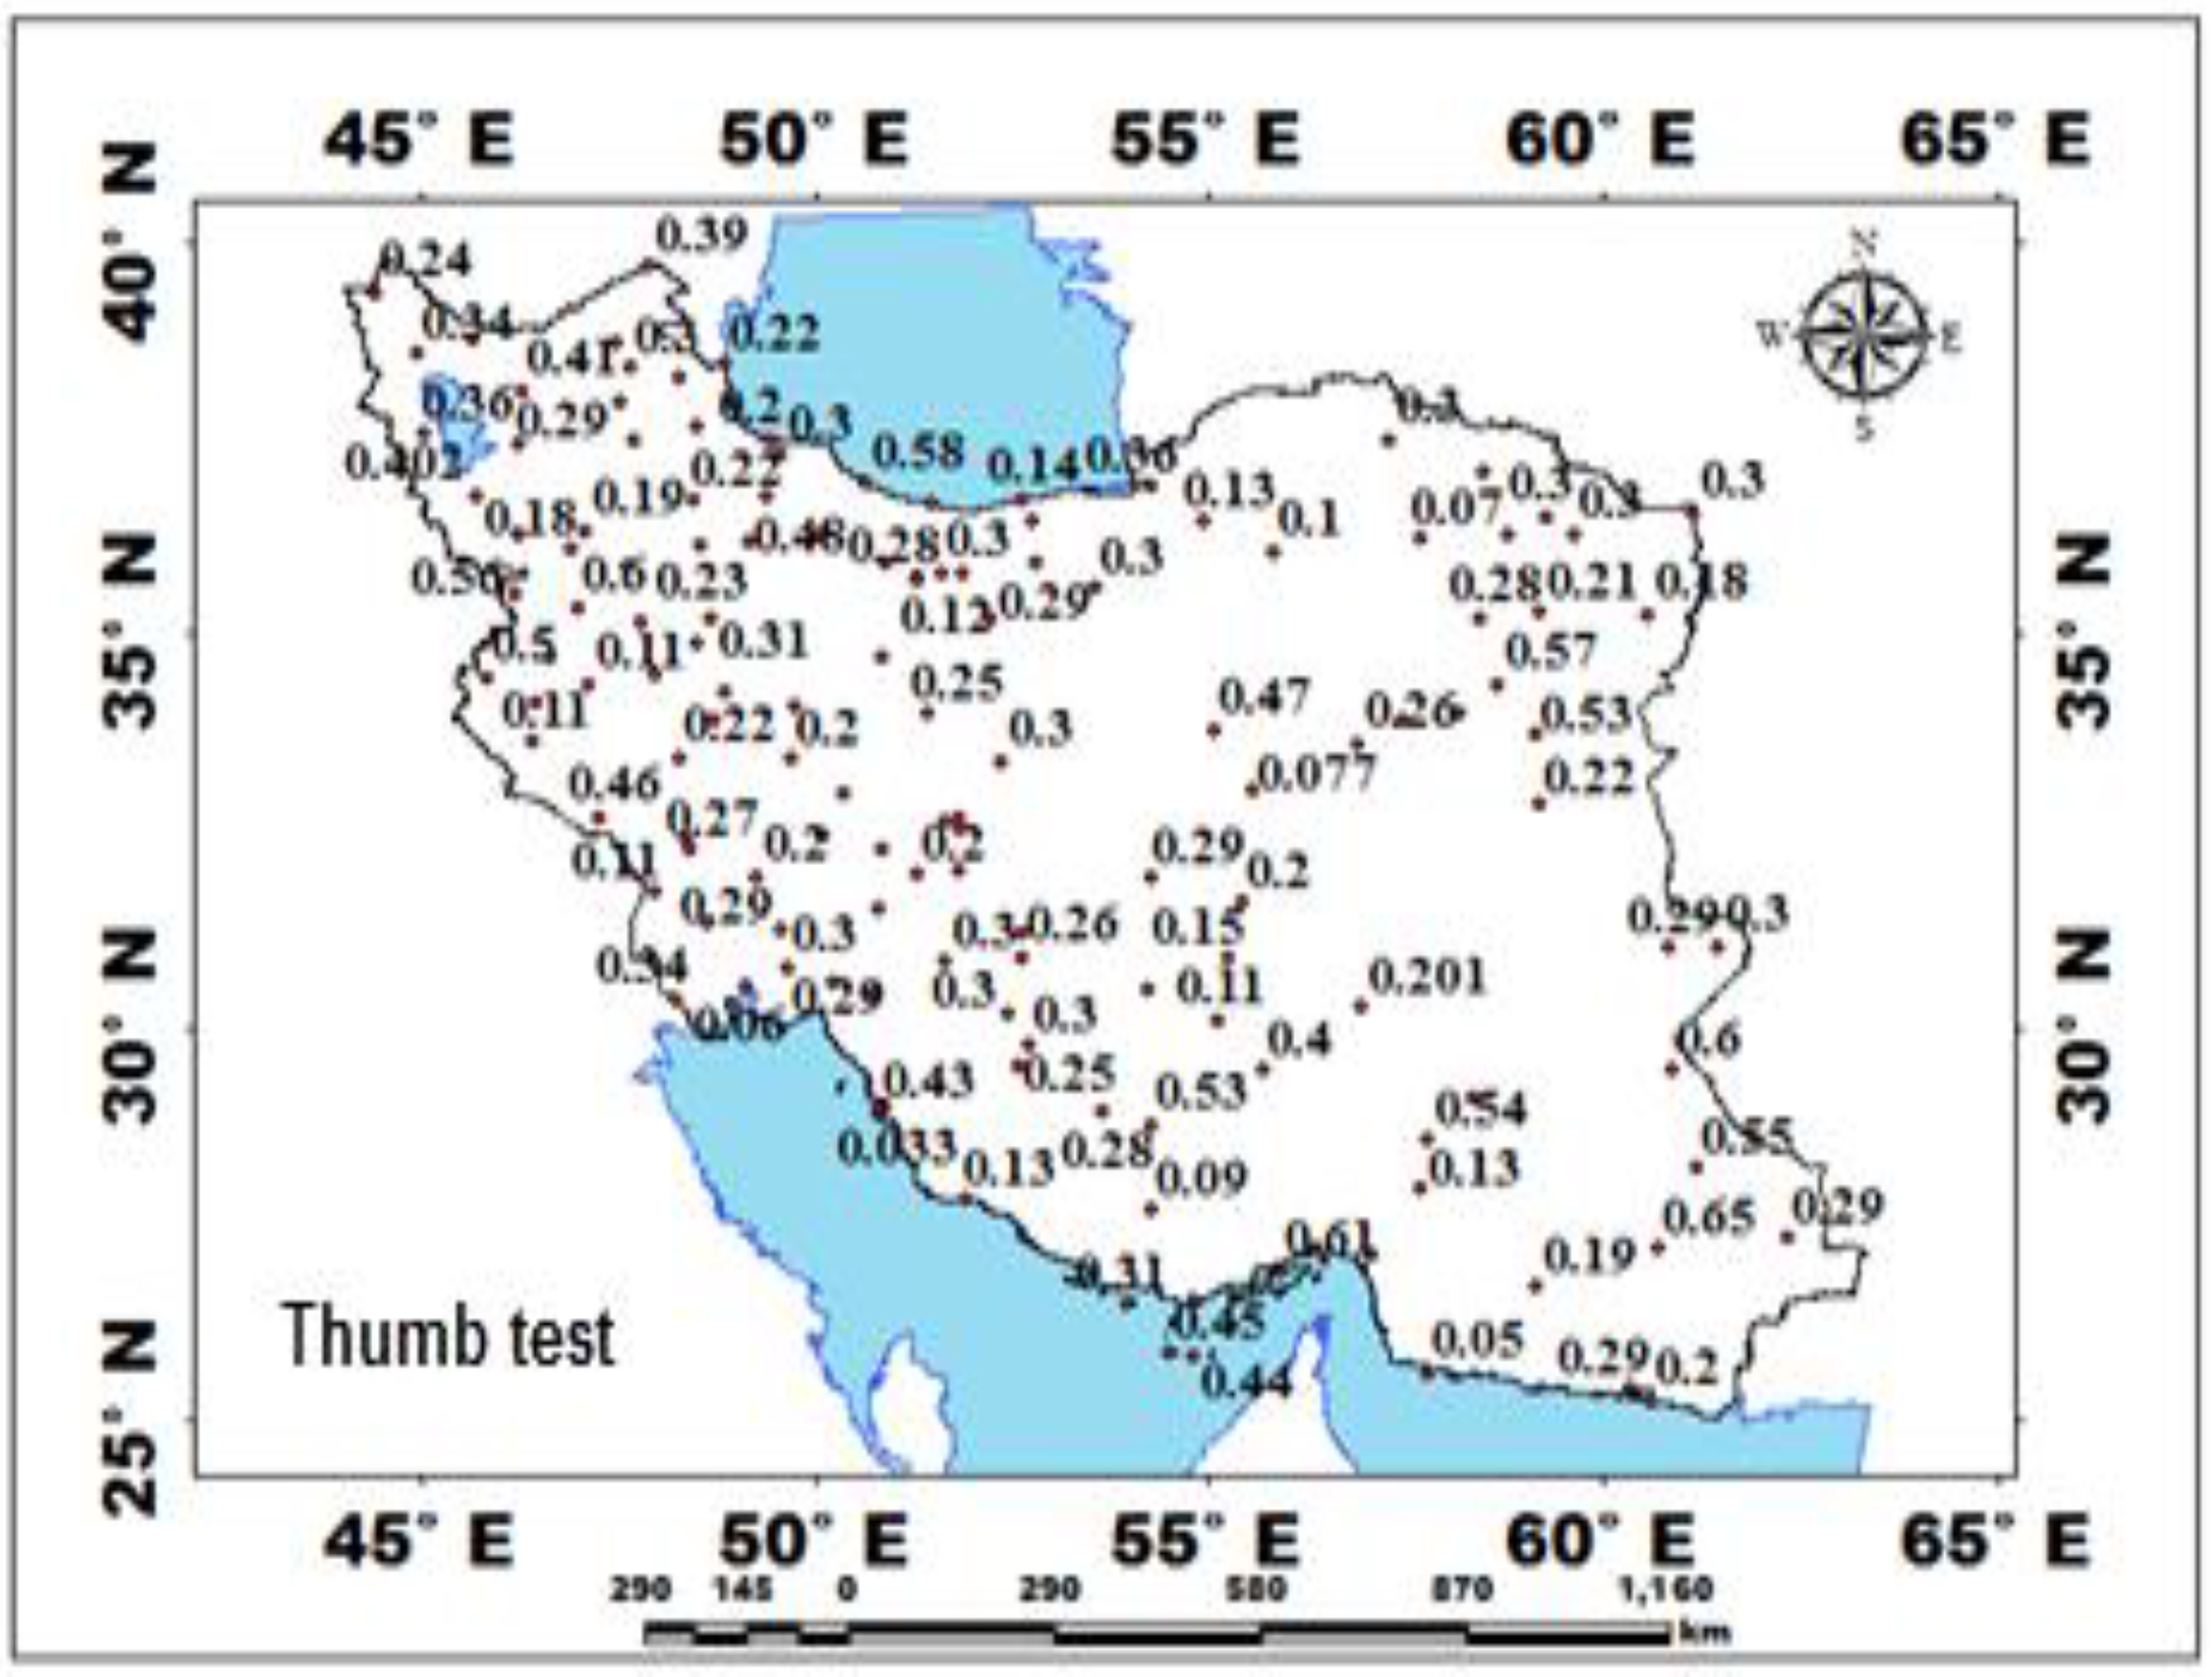
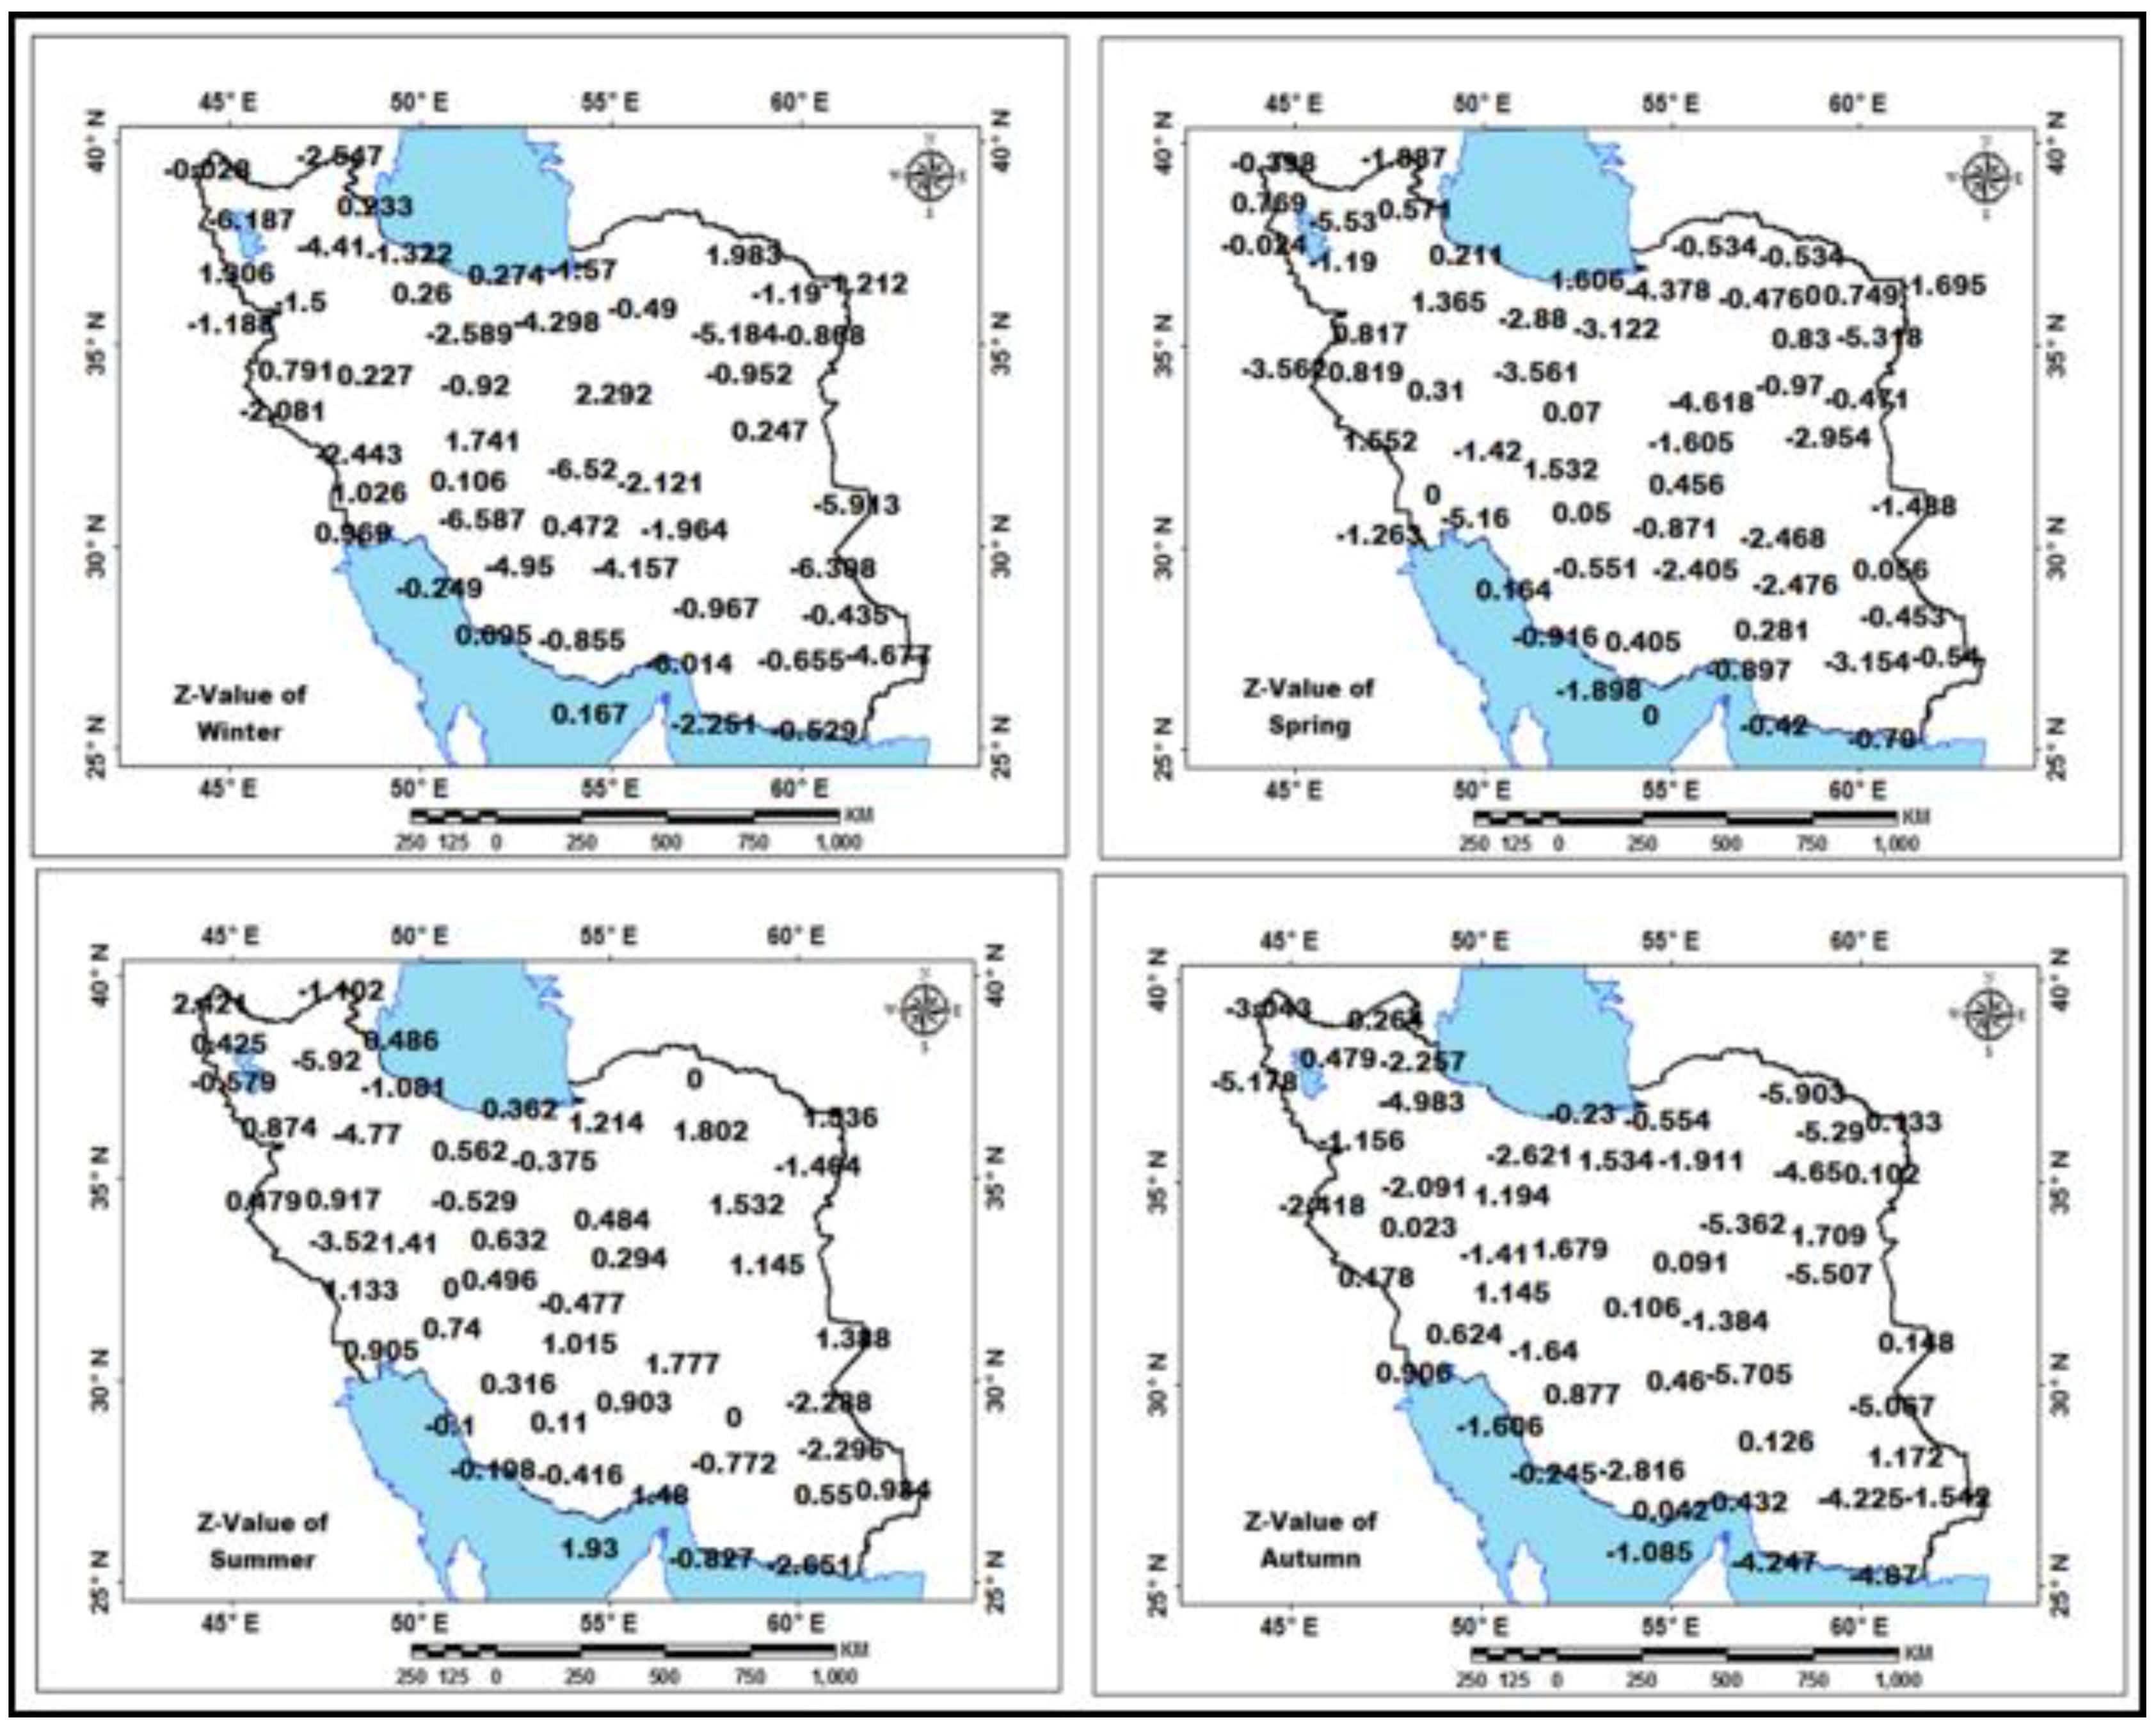
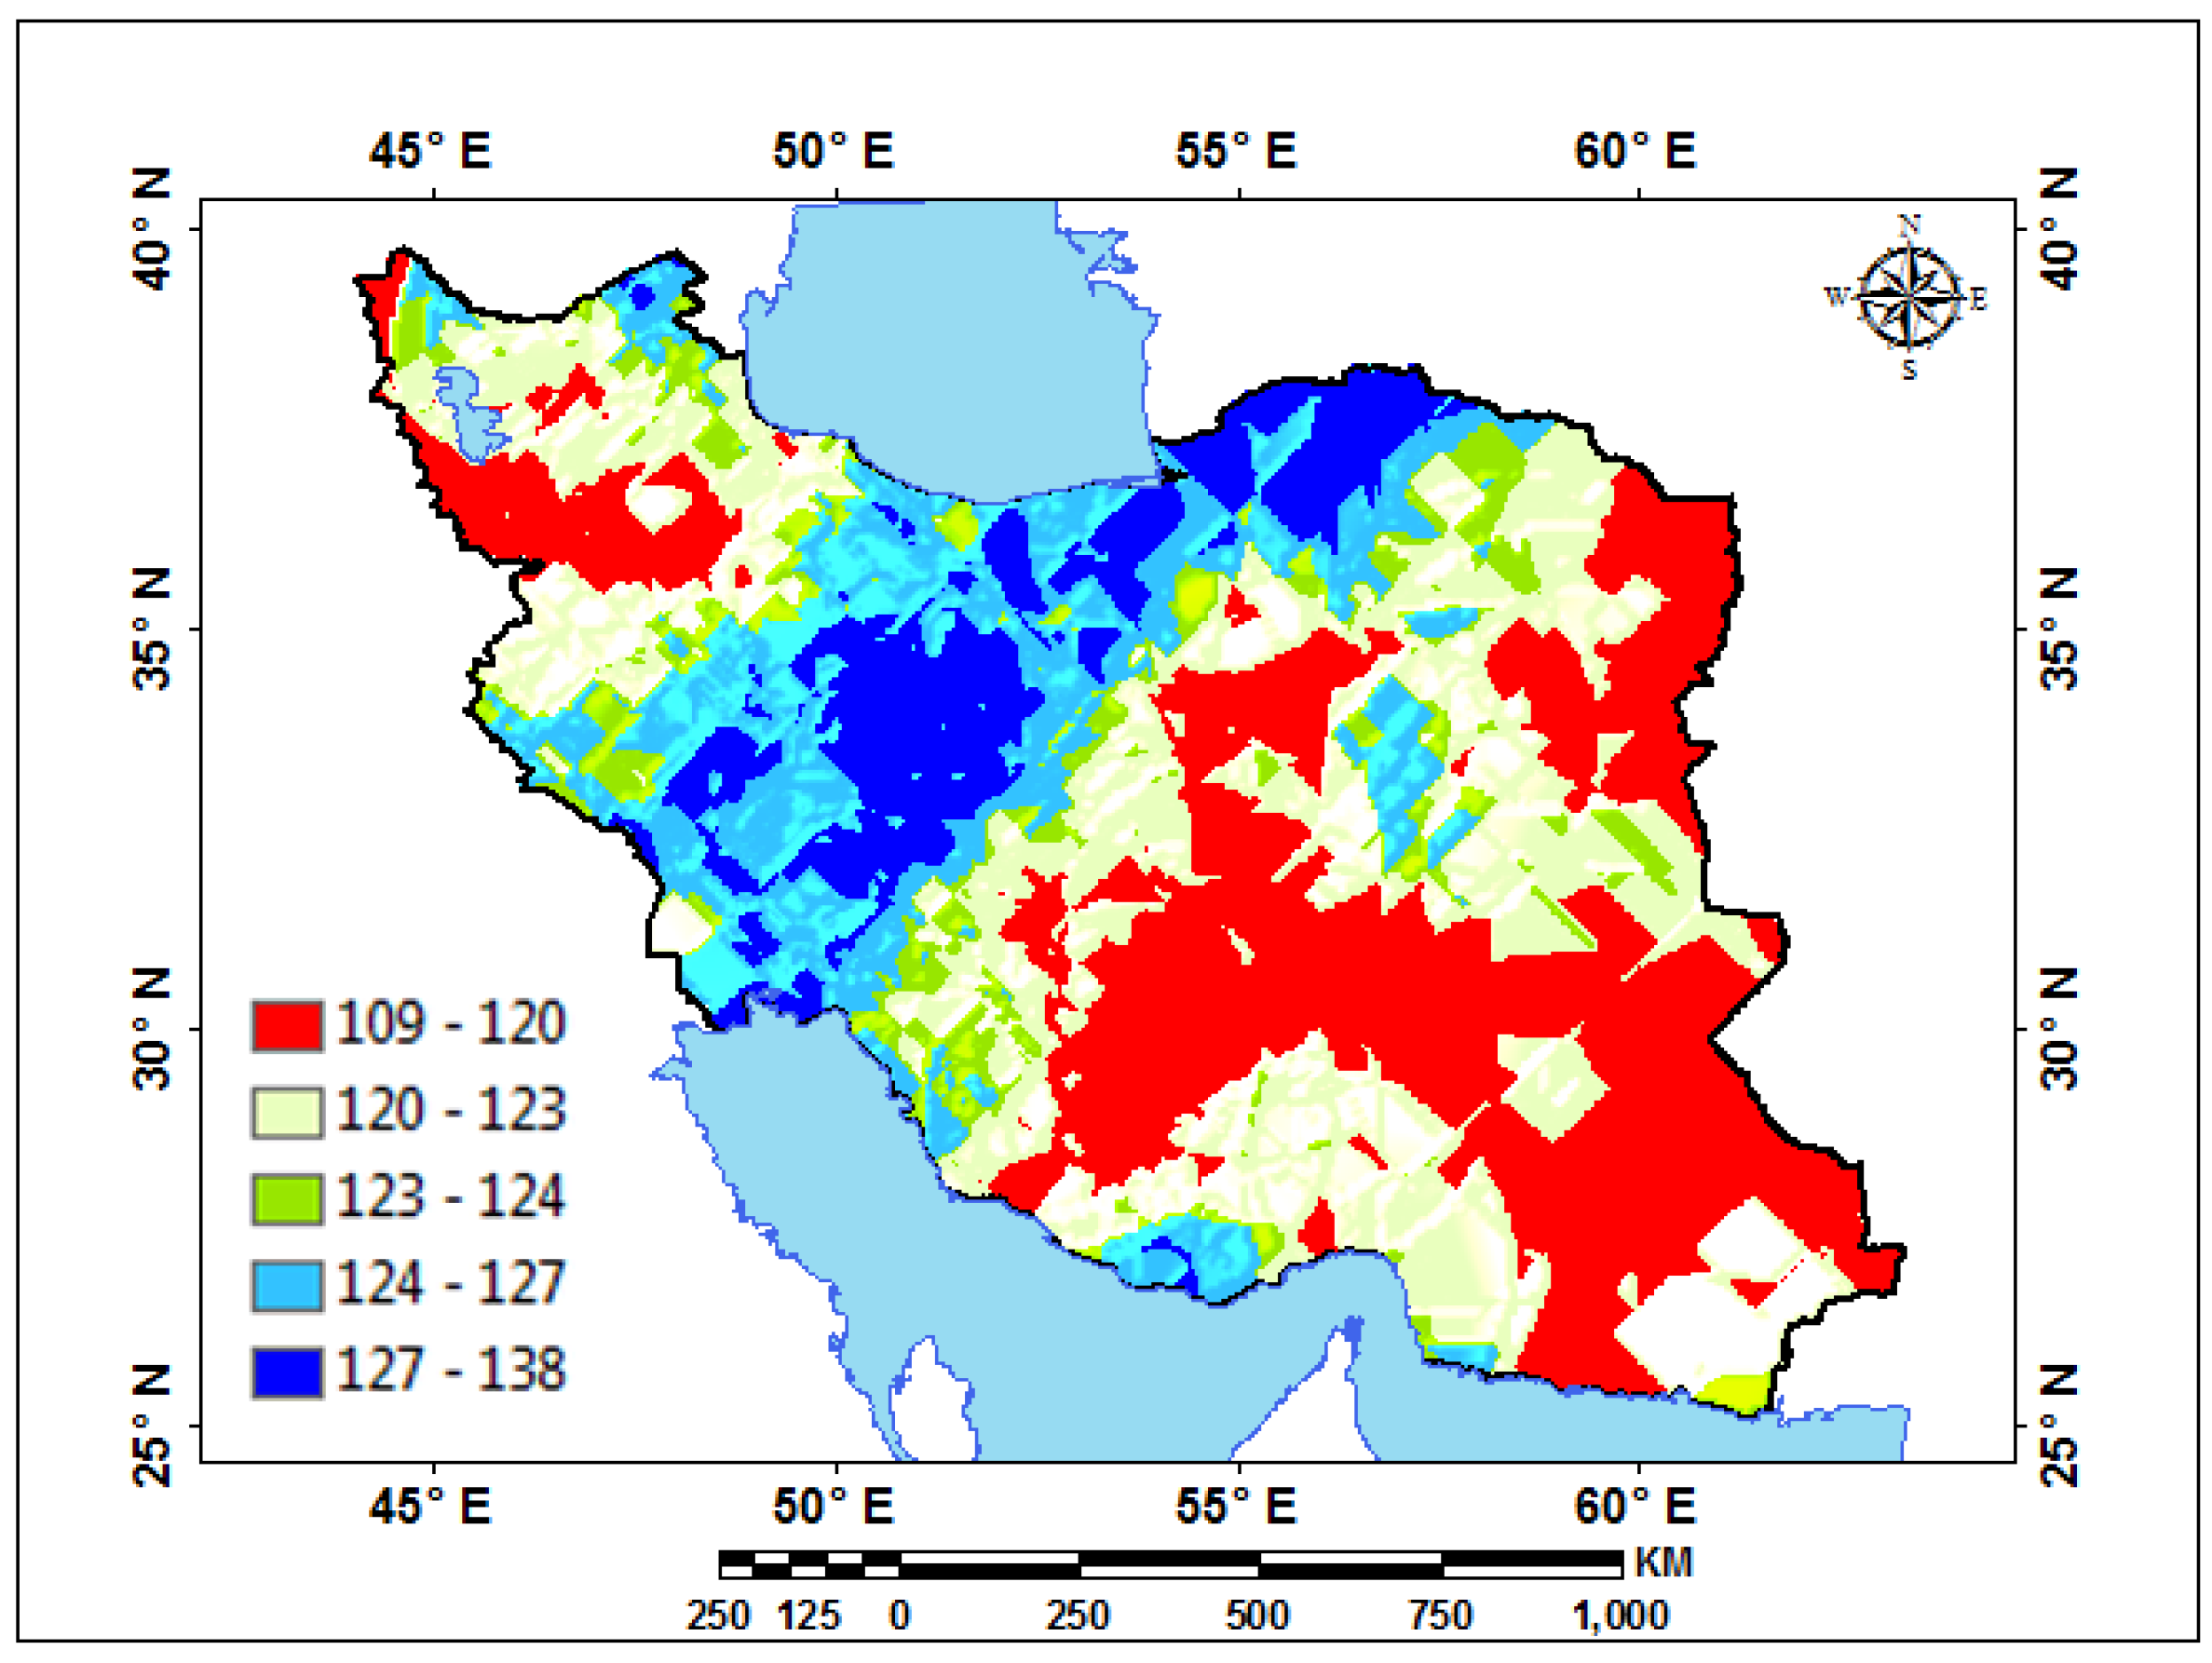

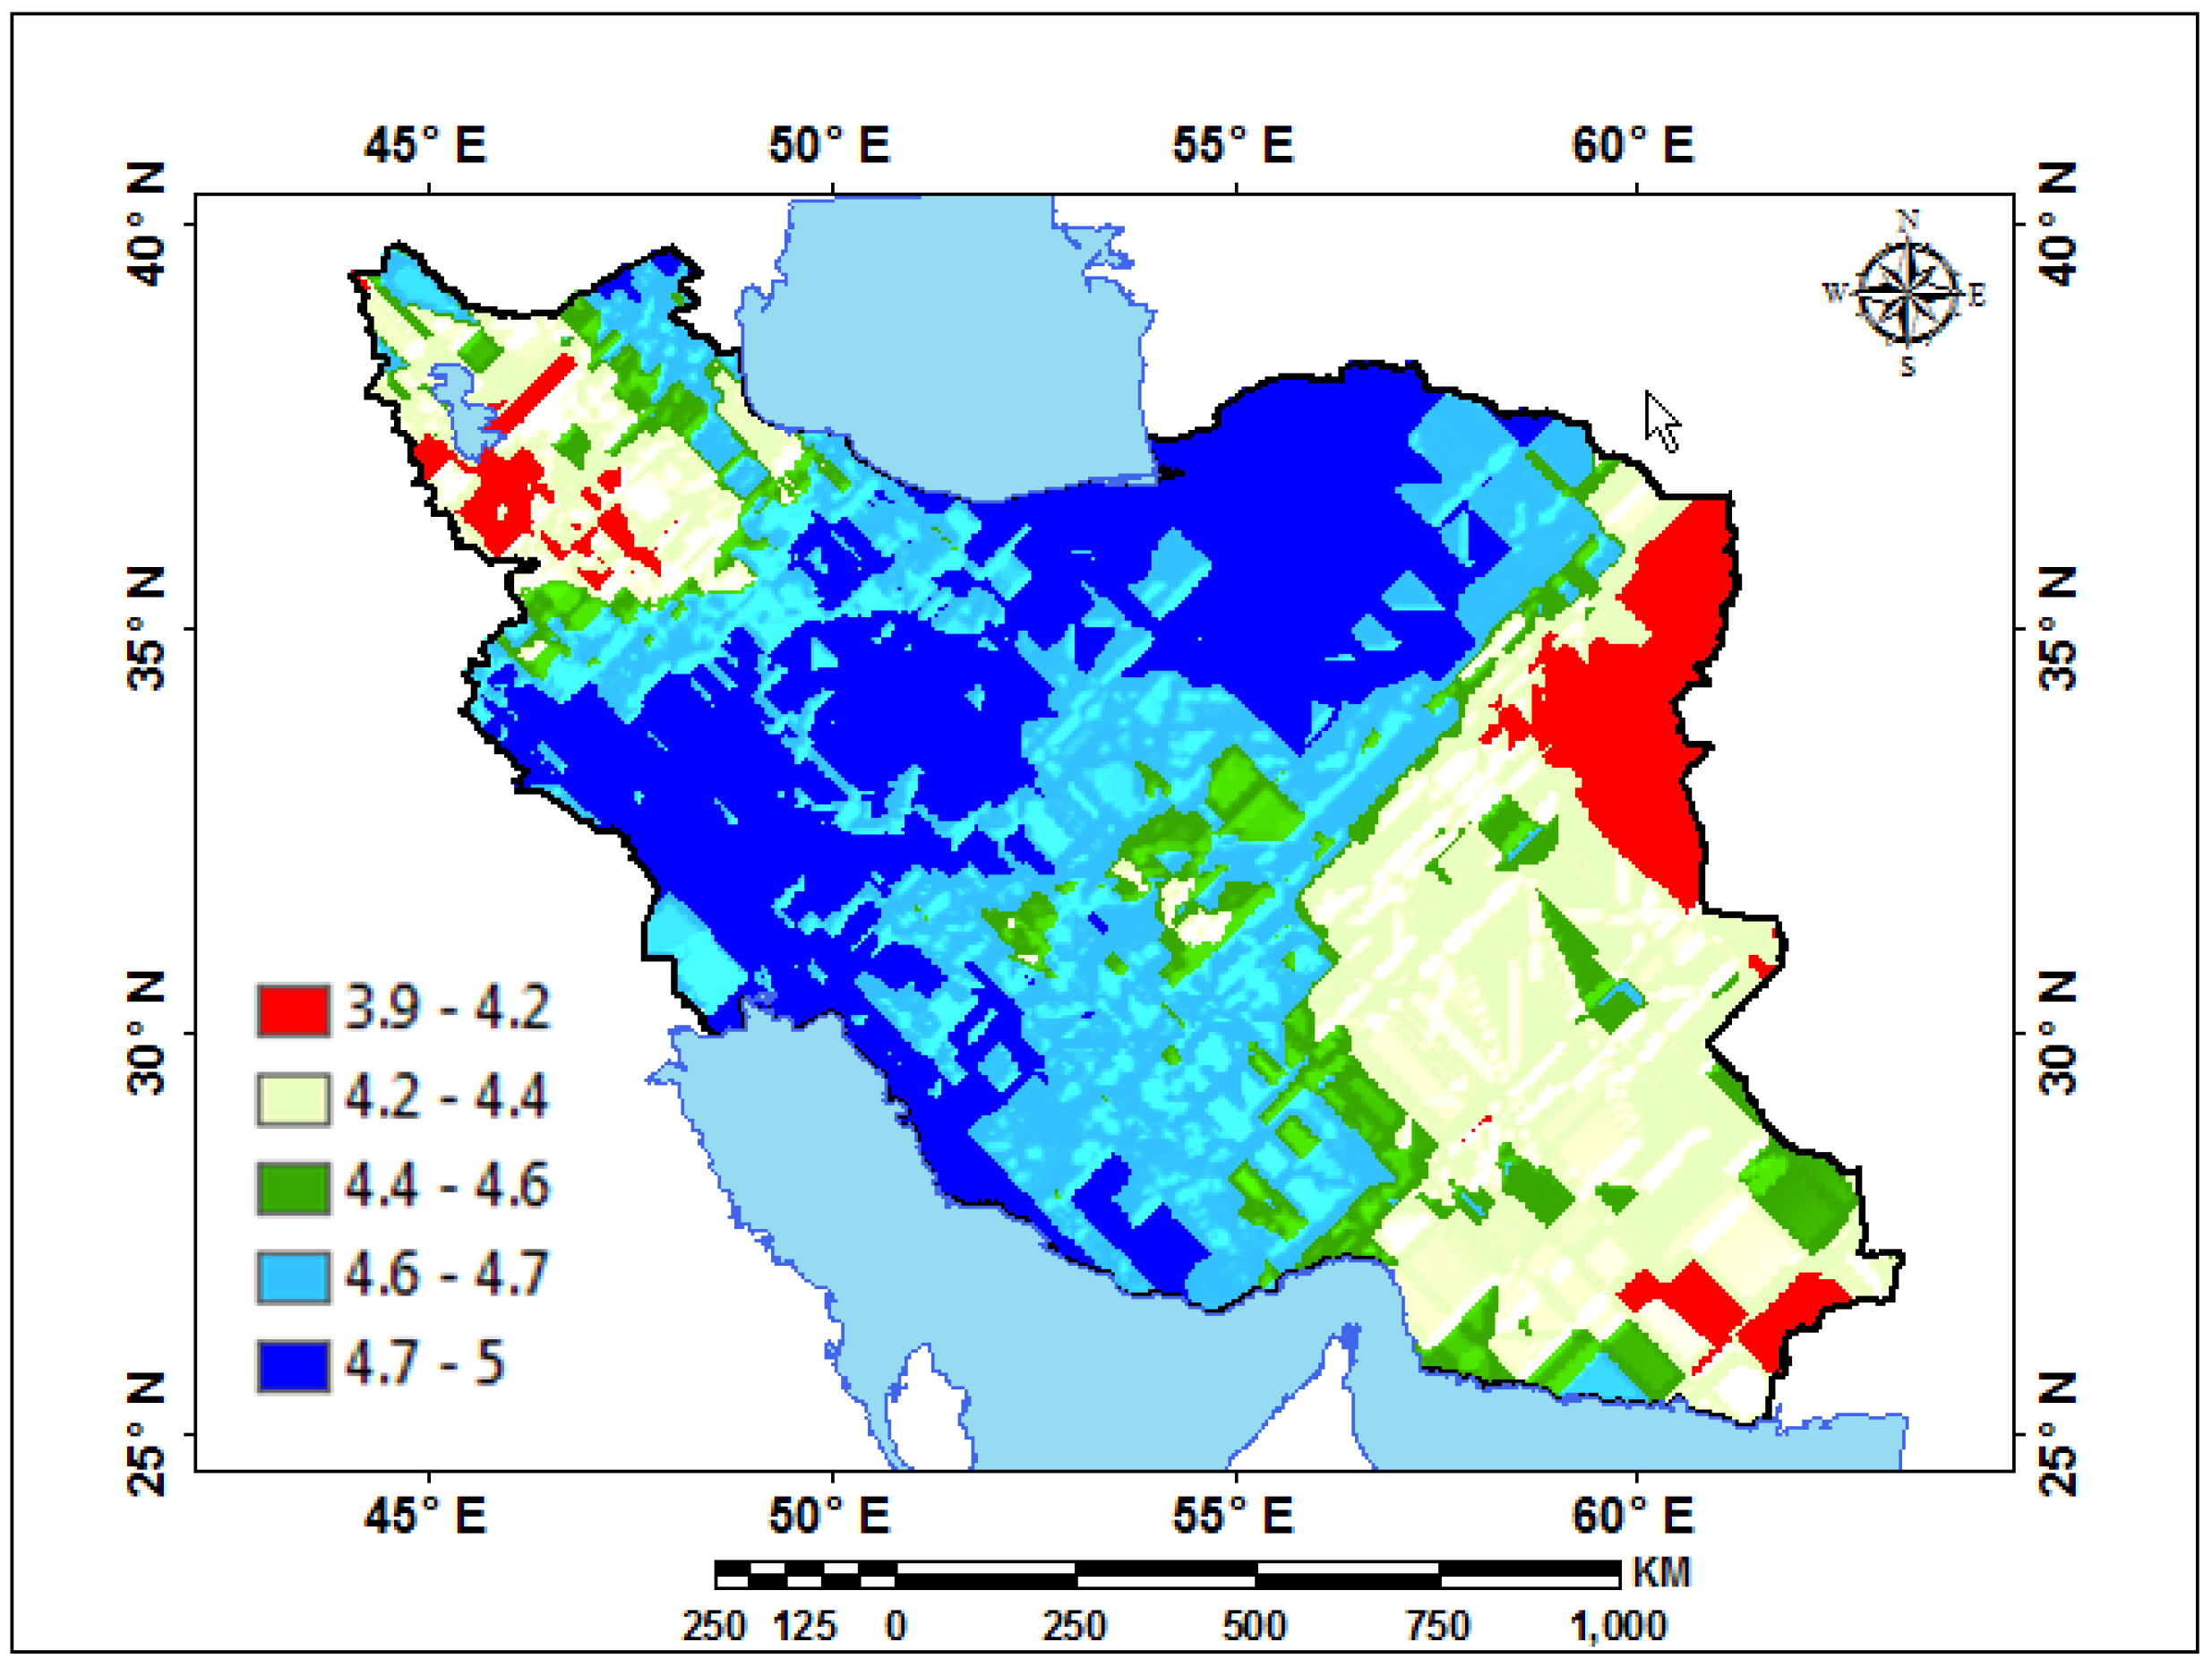


| Station | Pettitt Test-p-Value | Station | Pettitt Test-p-Value | Station | Pettitt Test-p-Value | Station | Pettitt Test-p-Value | Station | Pettitt Test-p-Value | Station | Pettitt Test-p-Value |
|---|---|---|---|---|---|---|---|---|---|---|---|
| ABADAN | 0.062 | BOROOJEN | 0.821 | GHORVEH | 0.215 | KHALKHAL | 0.698 | NEYSHABOOR | 0.023 | SHAHROUD | 0.061 |
| ABADEH | 0.082 | BOSHROOY | 0.101 | GOLMAKAN CHENARAN | 0.745 | KHASH | 0.434 | NOUSHAHR | 0.760 | SHARGH ESFAHAN | 0.523 |
| ABALI | 0.939 | BOSTAN | 0.321 | GONABAD | 0.089 | KHODABANDEH | 0.472 | OMIDIYEH (PAYGAH) | 0.442 | SHIRAZ | 0.277 |
| AHAR | 0.115 | BROUJERD | 0.156 | GORGAN | 0.004 | KHOOR BIABANAK | 0.002 | OMIDIYEH (AGHAJARI | 0.598 | SHOMALE TEHRAN | 0.872 |
| AHWAZ | 0.327 | BUSHEHR (COASTAL) | 0.210 | HAMEDAN FOROUDGAH | 0.529 | KHORRAMABAD | 0.203 | OROOMIEH | 0.030 | SIRJAN | 0.149 |
| ALIGOODARZ | 0.930 | BUSHEHR | 0.501 | HAMEDAN NOZHEH | 0.311 | KHORRAMDAREH | 0.559 | PARSABADE-MOGHAN | 0.679 | TABASS | 0.828 |
| ANAR | 0.179 | CHAHBAHAR | 0.493 | HASANABADE DARAB | 0.121 | KHOY | 0.004 | RAMHORMOZ | 0.120 | TABRIZ | 0.001 |
| ARAK | 0.056 | DARAN | 0.736 | ILAM | 0.055 | KOOHRANG | 0.324 | RAMSAR | 0.566 | TAKAB | 0.025 |
| ARDEBIL | 0.001 | DEHLORAN | 0.081 | IRANSHAHR | 0.277 | LAR | 0.279 | RASHT | 0.474 | TEHRAN MEHRABAD | 0.214 |
| ARDESTAN | 0.318 | DEZFUL | 0.696 | JASK | 0.035 | LORDEGAN | 0.702 | RAVANSAR | 0.159 | TORBATE HEYDARIEH | 0.370 |
| ASTARA | 0.082 | DOGONBADAN | 0.460 | JAZIREH ABOMOOSA | 0.483 | MAHABAD | 0.256 | ROBAT POSHTBADAM | 0.913 | TORBATE JAM | 0.109 |
| BABOLSAR | 0.053 | DOUSHAN TAPPEH | 0.903 | JAZIREH GHESHM | 0.091 | MAKOO | 0.182 | SABZEVAR | 0.035 | YASOUJ | 0.534 |
| BAFGH | 0.366 | EGHLIDE FARS | 0.469 | JAZIREH KISH | 0.027 | MALAYER | 0.886 | SAD DOROUDZAN | 0.379 | YAZD | 0.412 |
| BAM | 0.057 | ESFAHAN | 0.327 | JAZIREH SIRI | 0.795 | MANJIL | 0.487 | SAFIABAD | 0.345 | ZABOL | 0.093 |
| B. ABASS | 0.257 | ESLAMABAD GHARB | 0.022 | JOLFA | 0.401 | MARAGHEH | 0.003 | SAGHEZ | 0.025 | ZAHEDAN | 0.010 |
| B. ANZALI | 0.061 | FASSA | 0.518 | KABOOTARABAD | 0.716 | MARIVAN | 0.046 | SANANDAJ | 0.004 | ZANJAN | 0.290 |
| B. DAIER | 0.611 | FERDOUS | 0.021 | KAHNOUJ | 0.113 | MARVAST | 0.279 | SAR POL ZOHAB | 0.002 | ZARGHAN | 0.008 |
| B.LENGEH | 0.118 | FIROUZKOOH | 0.190 | KANGAVAR | 0.497 | MASHHAD | 0.489 | SARAB | 0.363 | ZARINEHO | 0.250 |
| B.MAHSHAHR | 0.139 | GARMSAR | 0.514 | KARAJ | 0.583 | MASJED SOLEYMAN | 0.045 | SARAKHS | 0.348 | ZAHAK | 0.061 |
| BEHBAHAN | 0.616 | GHAEN | 0.013 | KASHAN | 0.725 | MESHKINSHAHR | 0.231 | SARAVAN | 0.123 | ZARINEH OBATO | 0.523 |
| BIARJAMAND | 0.385 | GHARAKHIL GHAEMSHR | 0.961 | KASHMAR | 0.281 | MIANDEH JIROFT | 0.001 | SEMNAN | 0.627 | Pettitt test-p-value | |
| BIJAR | 0.001 | GHAZVIN | 0.545 | KENARAK | 0.466 | MIANEH | 0.327 | SHAHR BABAK | 0.060 | ||
| BIRJAND | 0.298 | GHOM | 0.342 | KERMAN | 0.020 | MINAB | 0.602 | SHAHREKORD | 0.667 | ||
| BOJNURD | 0.604 | GHOOCHAN | 0.658 | KERMANSHAH | 0.217 | MOSHIRAN | 0.240 | SHAHREZA | 0.289 | ||
| Station | SHHT Test-p-Value | Station | SHHT Test-p-Value | Station | SHHT Test-p-Value | Station | SHHT Test-p-Value | Station | SHHT Test-p-Value | Station | SHHT Test-p-Value |
|---|---|---|---|---|---|---|---|---|---|---|---|
| ABADAN | 0.328 | BOROOJEN | 0.251 | GHORVEH | 0.416 | KHALKHAL | 0.920 | NEYSHABOOR | 0.008 | SHAHROUD | 0.226 |
| ABADEH | 0.742 | BOSHROOY | 0.310 | GOLMAKAN CHENARAN | 0.966 | KHASH | 0.581 | NOUSHAHR | 0.528 | SHARGH ESFAHAN | 0.672 |
| ABALI | 0.739 | BOSTAN | 0.270 | GONABAD | 0.197 | KHODABANDEH | 0.924 | OMIDIYEH (PAYGAH) | 0.557 | SHIRAZ | 0.006 |
| AHAR | 0.302 | BROUJERD | 0.100 | GORGAN | 0.109 | KHOOR BIABANAK | 0.001 | OMIDIYEH (AGHAJARI | 0.338 | SHOMALE TEHRAN | 0.824 |
| AHWAZ | 0.366 | BUSHEHR (COASTAL) | 0.337 | HAMEDAN FOROUDGAH | 0.514 | KHORRAMABAD | 0.268 | OROOMIEH | 0.033 | SIRJAN | 0.274 |
| ALIGOODARZ | 0.768 | BUSHEHR | 0.100 | HAMEDAN NOZHEH | 0.410 | KHORRAMDAREH | 0.540 | PARSABADE-MOGHAN | 0.136 | TABASS | 0.618 |
| ANAR | 0.056 | CHAHBAHAR | 0.703 | HASANABADE DARAB | 0.080 | KHOY | 0.027 | RAMHORMOZ | 0.046 | TABRIZ | 0.008 |
| ARAK | 0.175 | DARAN | 0.825 | ILAM | 0.074 | KOOHRANG | 0.182 | RAMSAR | 0.761 | TAKAB | 0.020 |
| ARDEBIL | 0.009 | DEHLORAN | 0.249 | IRANSHAHR | 0.480 | LAR | 0.319 | RASHT | 0.215 | TEHRAN MEHRABAD | 0.332 |
| ARDESTAN | 0.309 | DEZFUL | 0.302 | JASK | 0.163 | LORDEGAN | 0.325 | RAVANSAR | 0.456 | TORBATE HEYDARIEH | 0.266 |
| ASTARA | 0.203 | DOGONBADAN | 0.342 | JAZIREH ABOMOOSA | 0.550 | MAHABAD | 0.444 | ROBAT POSHTBADAM | 0.563 | TORBATE JAM | 0.370 |
| BABOLSAR | 0.201 | DOUSHAN TAPPEH | 0.724 | JAZIREH GHESHM | 0.002 | MAKOO | 0.132 | SABZEVAR | 0.080 | YASOUJ | 0.105 |
| BAFGH | 0.278 | EGHLIDE FARS | 0.496 | JAZIREH KISH | 0.071 | MALAYER | 0.892 | SAD DOROUDZAN | 0.173 | YAZD | 0.492 |
| BAM | 0.056 | ESFAHAN | 0.195 | JAZIREH SIRI | 0.600 | MANJIL | 0.056 | SAFIABAD | 0.535 | ZABOL | 0.189 |
| B. ABASS | 0.282 | ESLAMABAD GHARB | 0.087 | JOLFA | 0.104 | MARAGHEH | 0.003 | SAGHEZ | 0.055 | ZAHEDAN | 0.005 |
| B. ANZALI | 0.009 | FASSA | 0.296 | KABOOTARABAD | 0.843 | MARIVAN | 0.040 | SANANDAJ | 0.013 | ZANJAN | 0.006 |
| B. DAIER | 0.678 | FERDOUS | 0.040 | KAHNOUJ | 0.225 | MARVAST | 0.469 | SAR POL ZOHAB | 0.002 | ZARGHAN | 0.135 |
| B.LENGEH | 0.237 | FIROUZKOOH | 0.278 | KANGAVAR | 0.573 | MASHHAD | 0.614 | SARAB | 0.355 | ZARINEHO | 0.416 |
| B.MAHSHAHR | 0.172 | GARMSAR | 0.188 | KARAJ | 0.317 | MASJED SOLEYMAN | 0.071 | SARAKHS | 0.569 | ZAHAK | 0.226 |
| BEHBAHAN | 0.052 | GHAEN | 0.051 | KASHAN | 0.922 | MESHKINSHAHR | 0.468 | SARAVAN | 0.420 | ZARINEH OBATO | 0.672 |
| BIARJAMAND | 0.938 | GHARAKHIL GHAEMSHR | 0.291 | KASHMAR | 0.488 | MIANDEH JIROFT | 0.005 | SEMNAN | 0.332 | SNHT test-p-value | |
| BIJAR | 0.001 | GHAZVIN | 0.469 | KENARAK | 0.858 | MIANEH | 0.385 | SHAHR BABAK | 0.057 | ||
| BIRJAND | 0.301 | GHOM | 0.117 | KERMAN | 0.040 | MINAB | 0.775 | SHAHREKORD | 0.596 | ||
| BOJNURD | 0.439 | GHOOCHAN | 0.525 | KERMANSHAH | 0.292 | MOSHIRAN | 0.712 | SHAHREZA | 0.376 | ||
| Station | Buishand’s Test-p-Value | Station | Buishand’s Test-p-Value | Station | Buishand’s Test-p-Value | Station | Buishand’s Test-p-Value | Station | Buishand’s Test-p-Value | Station | Buishand’s Test-p-Value |
|---|---|---|---|---|---|---|---|---|---|---|---|
| ABADAN | 0.153 | BOROOJEN | 0.460 | GHORVEH | 0.279 | KERMANSHAH | 0.183 | NEYSHABOOR | 0.013 | SHAHROUD | 0.133 |
| ABADEH | 0.748 | BOSHROOY | 0.118 | GOLMAKAN CHENARAN | 0.814 | KHALKHAL | 0.345 | NOUSHAHR | 0.798 | SHARGH ESFAHAN | 0.778 |
| ABALI | 0.919 | BOSTAN | 0.401 | GONABAD | 0.105 | KHASH | 0.426 | OMIDIYEH (PAYGAH) | 0.488 | SHIRAZ | 0.067 |
| AHAR | 0.154 | BROUJERD | 0.131 | GORGAN | 0.023 | KHODABANDEH | 0.788 | OMIDIYEH (AGHAJARI | 0.501 | SHOMALE TEHRAN | 0.914 |
| AHWAZ | 0.365 | BUSHEHR (COASTAL) | 0.346 | HAMEDAN FOROUDGAH | 0.730 | KHOOR BIABANAK | 0.004 | OROOMIEH | 0.034 | SIRJAN | 0.150 |
| ALIGOODARZ | 0.892 | BUSHEHR | 0.157 | HAMEDAN NOZHEH | 0.371 | KHORRAMABAD | 0.222 | PARSABADE-MOGHAN | 0.376 | TABASS | 0.436 |
| ANAR | 0.094 | CHAHBAHAR | 0.804 | HASANABADE DARAB | 0.166 | KHORRAMDAREH | 0.276 | RAMHORMOZ | 0.137 | TABRIZ | 0.001 |
| ARAK | 0.053 | DARAN | 0.812 | ILAM | 0.043 | KHOY | 0.008 | RAMSAR | 0.717 | TAKAB | 0.009 |
| ARDEBIL | 0.001 | DEHLORAN | 0.066 | IRANSHAHR | 0.344 | KOOHRANG | 0.368 | RASHT | 0.342 | TEHRAN MEHRABAD | 0.201 |
| ARDESTAN | 0.303 | DEZFUL | 0.731 | JASK | 0.058 | LAR | 0.185 | RAVANSAR | 0.232 | TORBATE HEYDARIEH | 0.251 |
| ASTARA | 0.080 | DOGONBADAN | 0.547 | JAZIREH ABOMOOSA | 0.524 | LORDEGAN | 0.364 | ROBAT POSHTBADAM | 0.920 | TORBATE JAM | 0.185 |
| BABOLSAR | 0.093 | DOUSHAN TAPPEH | 0.783 | JAZIREH GHESHM | 0.023 | MAHABAD | 0.175 | SABZEVAR | 0.055 | YASOUJ | 0.328 |
| BAFGH | 0.233 | EGHLIDE FARS | 0.562 | JAZIREH KISH | 0.031 | MAKOO | 0.304 | SAD DOROUDZAN | 0.262 | YAZD | 0.283 |
| BAM | 0.100 | ESFAHAN | 0.437 | JAZIREH SIRI | 0.337 | MALAYER | 0.861 | SAFIABAD | 0.521 | ZABOL | 0.195 |
| B. ABASS | 0.272 | ESLAMABAD GHARB | 0.059 | JOLFA | 0.284 | MANJIL | 0.379 | SAGHEZ | 0.026 | ZAHEDAN | 0.011 |
| B. ANZALI | 0.027 | FASSA | 0.657 | KABOOTARABAD | 0.695 | MARAGHEH | 0.002 | SANANDAJ | 0.009 | ZANJAN | 0.230 |
| B. DAIER | 0.645 | FERDOUS | 0.019 | KAHNOUJ | 0.080 | MARIVAN | 0.041 | SAR POL ZOHAB | 0.003 | ZARGHAN | 0.020 |
| B.LENGEH | 0.141 | FIROUZKOOH | 321.000 | KANGAVAR | 0.370 | MARVAST | 0.259 | SARAB | 0.395 | ZARINEHO | 0.215 |
| B.MAHSHAHR | 0.087 | GARMSAR | 0.479 | KARAJ | 0.489 | MASHHAD | 0.396 | SARAKHS | 0.318 | ZAHAK | 0.133 |
| BEHBAHAN | 0.277 | GHAEN | 0.013 | KASHAN | 0.926 | MASJED SOLEYMAN | 0.042 | SARAVAN | 0.156 | ZARINEH OBATO | 0.778 |
| BIARJAMAND | 0.870 | GHARAKHIL GHAEMSHR | 0.962 | KASHMAR | 0.304 | MESHKINSHAHR | 0.360 | SEMNAN | 0.717 | Buishand’s test-p-value | |
| BIJAR | 0.001 | GHAZVIN | 0.504 | KENARAK | 0.711 | MIANDEH JIROFT | 0.002 | SHAHR BABAK | 0.068 | ||
| BIRJAND | 0.382 | GHOM | 0.046 | KERMAN | 0.071 | MIANEH | 0.176 | ||||
| BOJNURD | 0.682 | GHOOCHAN | 0.780 | KERMANSHAH | 0.183 | MINAB | 0.670 | ||||
© 2016 by the author; licensee MDPI, Basel, Switzerland. This article is an open access article distributed under the terms and conditions of the Creative Commons Attribution (CC-BY) license (http://creativecommons.org/licenses/by/4.0/).
Share and Cite
Javari, M. Trend and Homogeneity Analysis of Precipitation in Iran. Climate 2016, 4, 44. https://doi.org/10.3390/cli4030044
Javari M. Trend and Homogeneity Analysis of Precipitation in Iran. Climate. 2016; 4(3):44. https://doi.org/10.3390/cli4030044
Chicago/Turabian StyleJavari, Majid. 2016. "Trend and Homogeneity Analysis of Precipitation in Iran" Climate 4, no. 3: 44. https://doi.org/10.3390/cli4030044
APA StyleJavari, M. (2016). Trend and Homogeneity Analysis of Precipitation in Iran. Climate, 4(3), 44. https://doi.org/10.3390/cli4030044


