Article

A Survey of the Relationship between Climatic Heat Stress Indices and Fundamental Milk Components Considering Uncertainty

by
Mohammad Reza Marami Milani
1,*,
Andreas Hense
2,
Elham Rahmani
2 and
Angelika Ploeger
1
1
Department of Organic Food Quality and food Culture, University of Kassel, Nordbahnhofstr. 1a, Witzenhausen 37213, Germany
2
Meteorological Institute, University of Bonn, Auf dem Hügel 20, Bonn 53121, Germany
*
Author to whom correspondence should be addressed.
Climate 2015, 3(4), 876-900; https://doi.org/10.3390/cli3040876
Submission received: 21 July 2015 / Revised: 27 October 2015 / Accepted: 4 November 2015 / Published: 13 November 2015
(This article belongs to the Special Issue Climate Change on Crops, Foods and Diets)

Abstract

:
The main purpose of this study is to assess the relationship between four bioclimatic indices for cattle (environmental stress, heat load, modified heat load, and respiratory rate predictor indices) and three main milk components (fat, protein, and milk yield) considering uncertainty. The climate parameters used to calculate the climate indices were taken from the NASA-Modern Era Retrospective-Analysis for Research and Applications (NASA-MERRA) reanalysis from 2002 to 2010. Cow milk data were considered for the same period from April to September when the cows use the natural pasture. The study is based on a linear regression analysis using correlations as a summarizing diagnostic. Bootstrapping is used to represent uncertainty information in the confidence intervals. The main results identify an interesting relationship between the milk compounds and climate indices under all climate conditions. During spring, there are reasonably high correlations between the fat and protein concentrations vs. the climate indices, whereas there are insignificant dependencies between the milk yield and climate indices. During summer, the correlation between the fat and protein concentrations with the climate indices decreased in comparison with the spring results, whereas the correlation for the milk yield increased. This methodology is suggested for studies investigating the impacts of climate variability/change on food and agriculture using short term data considering uncertainty.

1. Introduction

Climate variability and climate change have direct effects on livestock through stress factors during periods of high temperature as well as indirect effects on their feed and diet [1]. Coping with climate variability is easier for animals than for crops due to their ability to adapt to different conditions and feed management systems. Thus, investigating the effect of climate variability on livestock and their products is complex. This interaction needs to be investigated using different climatic indices that have considered various climatic parameters. Additionally, genetic parameters play a strategic role in heat stress tolerance by reducing the effects of heat stress on dairy cattle [2]. According to the study by Lambertz et al. [3] in different housing systems, heat stress resulted in decreasing milk yield, fat, and protein percentages under warm and cold climate conditions with and without access to grazing. Sharma et al. [4] reported that the quality and quantity of milk compounds changed over time due to environmental and climate variability. These authors showed that the milk yield of Holsteins was more sensitive to the climate than the milk yield of Jerseys, whereas the other milk composition of the Jerseys was more sensitive. The milk yield of Holsteins was also more sensitive to heat stress compared to Jersey cattle.
The strongest focus of studies in this field over the last five decades was the effect of the Temperature Humidity Index (THI), which is a heat stress index used for livestock. THI is a combination of the temperature and humidity.
The main goal of the current study was to determine which climate parameter or bioclimatic index was most influential on cow milk as a strategic product for human nutrition. To partially answer the question, we investigated the relationship between physiologically relevant climate indices of cattle (Environmental Stress Index (ESI), Heat Load Index (HLI), modified HLI (HLI New), and Respiratory Rate Predictor (RRP)) and milk compound observations (milk yield, fat, and protein). Another purpose of this study was to compare the effect of these relatively new heat stress indices on dairy cows under different climate conditions.
A first explanatory analysis of our study also focused on the THI and Equivalent Temperature Index (ETI) [5]. Thus, in this study we applied relatively new bioclimatic indices such as the ESI, HLI, and RRP to evaluate the interactions of temperature, humidity, wind speed, and solar radiation with milk components. These indices were applied for the first time and had the advantage of enabling the direct use of solar radiation, relative humidity, and wind speed in the heat stress equation. A summary of the reviews concerning the climate indices used in this study is presented in Table 1.
The potential of respiratory and skin evaporation by the animal is reduced under high humidity conditions. The effect of high temperature is decreased by wind, but solar radiation increases the heat effect on metabolic processes [6]. The first effect is due to the reduction of latent heat loss in moist environments, whereas the second effect results from general increases in the bulk sensible and latent heat loss from the body due to increasing wind speed that enhances turbulence around the body. In several studies, a positive correlation was reported between the dry-bulb temperature, solar radiation, relative humidity, and respiration rate index with the physiological reactions of livestock [7,8,9,10,11,12]. For instance, Mader and Davis reported a negative correlation between wind speed and respiration [13].
Therefore, a general assessment of the relationships between physiologically motivated climate indices and milk compounds is of central interest for predictions of the effects of large-scale changes in climate variables upon cattle livestock productivity. We developed a linear regression analysis using the bootstrapping method to assess the inherent sampling uncertainty in the data. The correlation coefficient was extracted from each individual regression analysis as a summarizing diagnostic. Bootstrapping is especially important when using data with a relatively small size, an expensive or difficult data collection procedure, or data that possess basic uncertainties (e.g., due to unknown farm management practices) [5].
The results of this study may be used to find optimum situations to minimize the negative effect of short term climate variability and longer term climate change on milk compounds. Moreover, the results may allow the utilization of more suitable conditions in the design of dairy factories according to the economic justifications of dairy production and the feeding of cattle that will allow the system to be managed with less risk of climate variability, especially in developing countries.
Based on published studies from different regions of the world, there was a lack of studies in Iran. Therefore, correcting this deficit was a second purpose for this study.
Table 1. Published studies of climatic indices in different regions of the world.
YearIndicesAbbr. of IndicesAuthor(s)
2001, 2003Environmental Stress IndexESIMoran et al. [14,15]
2002Heat Load IndexHLIGaughan et al. [16]
2003Respiratory Rate IndexRR or RRPEigenberg et al. [17]
2008Heat Load Index (modified)HLIGaughan et al. [18]
This paper also focused on data preparation and on introducing statistical methods to cope with uncertainties in special data sets, which is similar to a previous study by these authors [5]. In this study, climate indices were selected from the literature to identify basic relationships between milk compound data and climate indices.
The particular choice of linear regression and correlation analysis was motivated by future investigations on the multivariate regression relationships between climate variables and milk production.

2. Materials and Methods

The main purpose of this study was to evaluate the relationship between relatively new heat stress indices and milk compounds. Therefore, additional climatic indices were calculated from several climate parameters to provide more combinations that could affect the quality and quantity of milk compounds. The Environmental Stress Index (ESI), Heat Load Index (HLI), modified HLI (HLI New), and Respiratory Rate Predictor (RRP) indices were used in this study. To determine these complex indices based on fundamental physiological reasoning, climate variables such as solar radiation, two meter height (T2m), dew point, relative humidity, wind speed, sea level pressure, and specific humidity were taken into account. These variables were extracted from the Modern Era Retrospective-Analysis for Research and Applications (MERRA) undertaken by NASA’s global modeling and assimilation office [19]. This study is a statistical downscaling experiment of coarse climate information to local or regional information from the biosphere. Similar approaches for plant phenology have been reported (e.g., in Maak and v. Storch [20] or Matulla et al. [21]). These studies showed that an explicit downscaling of coarse climate information to climate information on the local scale was not necessary. Instead, a direct statistical fit between the coarse climate data and the biological variable in question provided very valuable insights. During the review process, one of the reviewers noted that humidity and wind could not be directly downscaled from the large to local scales without extended modeling. This is true, and we consider the regression model a pragmatic, readily applicable first-order statistical approximation of this model in place of resource-intensive dynamic downscaling using a regional climate model.
The milk component data consisted of the fat, protein, and milk yield in the spring and summer in Iran. A linear regression analysis was performed using the milk compound data as the predictands and the climate indices as the predictors. The bootstrap method, which represents an active field of research in statistics for dependent data [22,23], was applied to consider the uncertainty and construct confidence intervals for the regression coefficients or correlations. Lunneborg [24] reported that bootstrapping expanded the confidence intervals. In contrast, Rasmussen [25] demonstrated that bootstrapping overly limited the confidence intervals. Jhun and Jeong [26] also reported that the bootstrap method presented more reliable results.

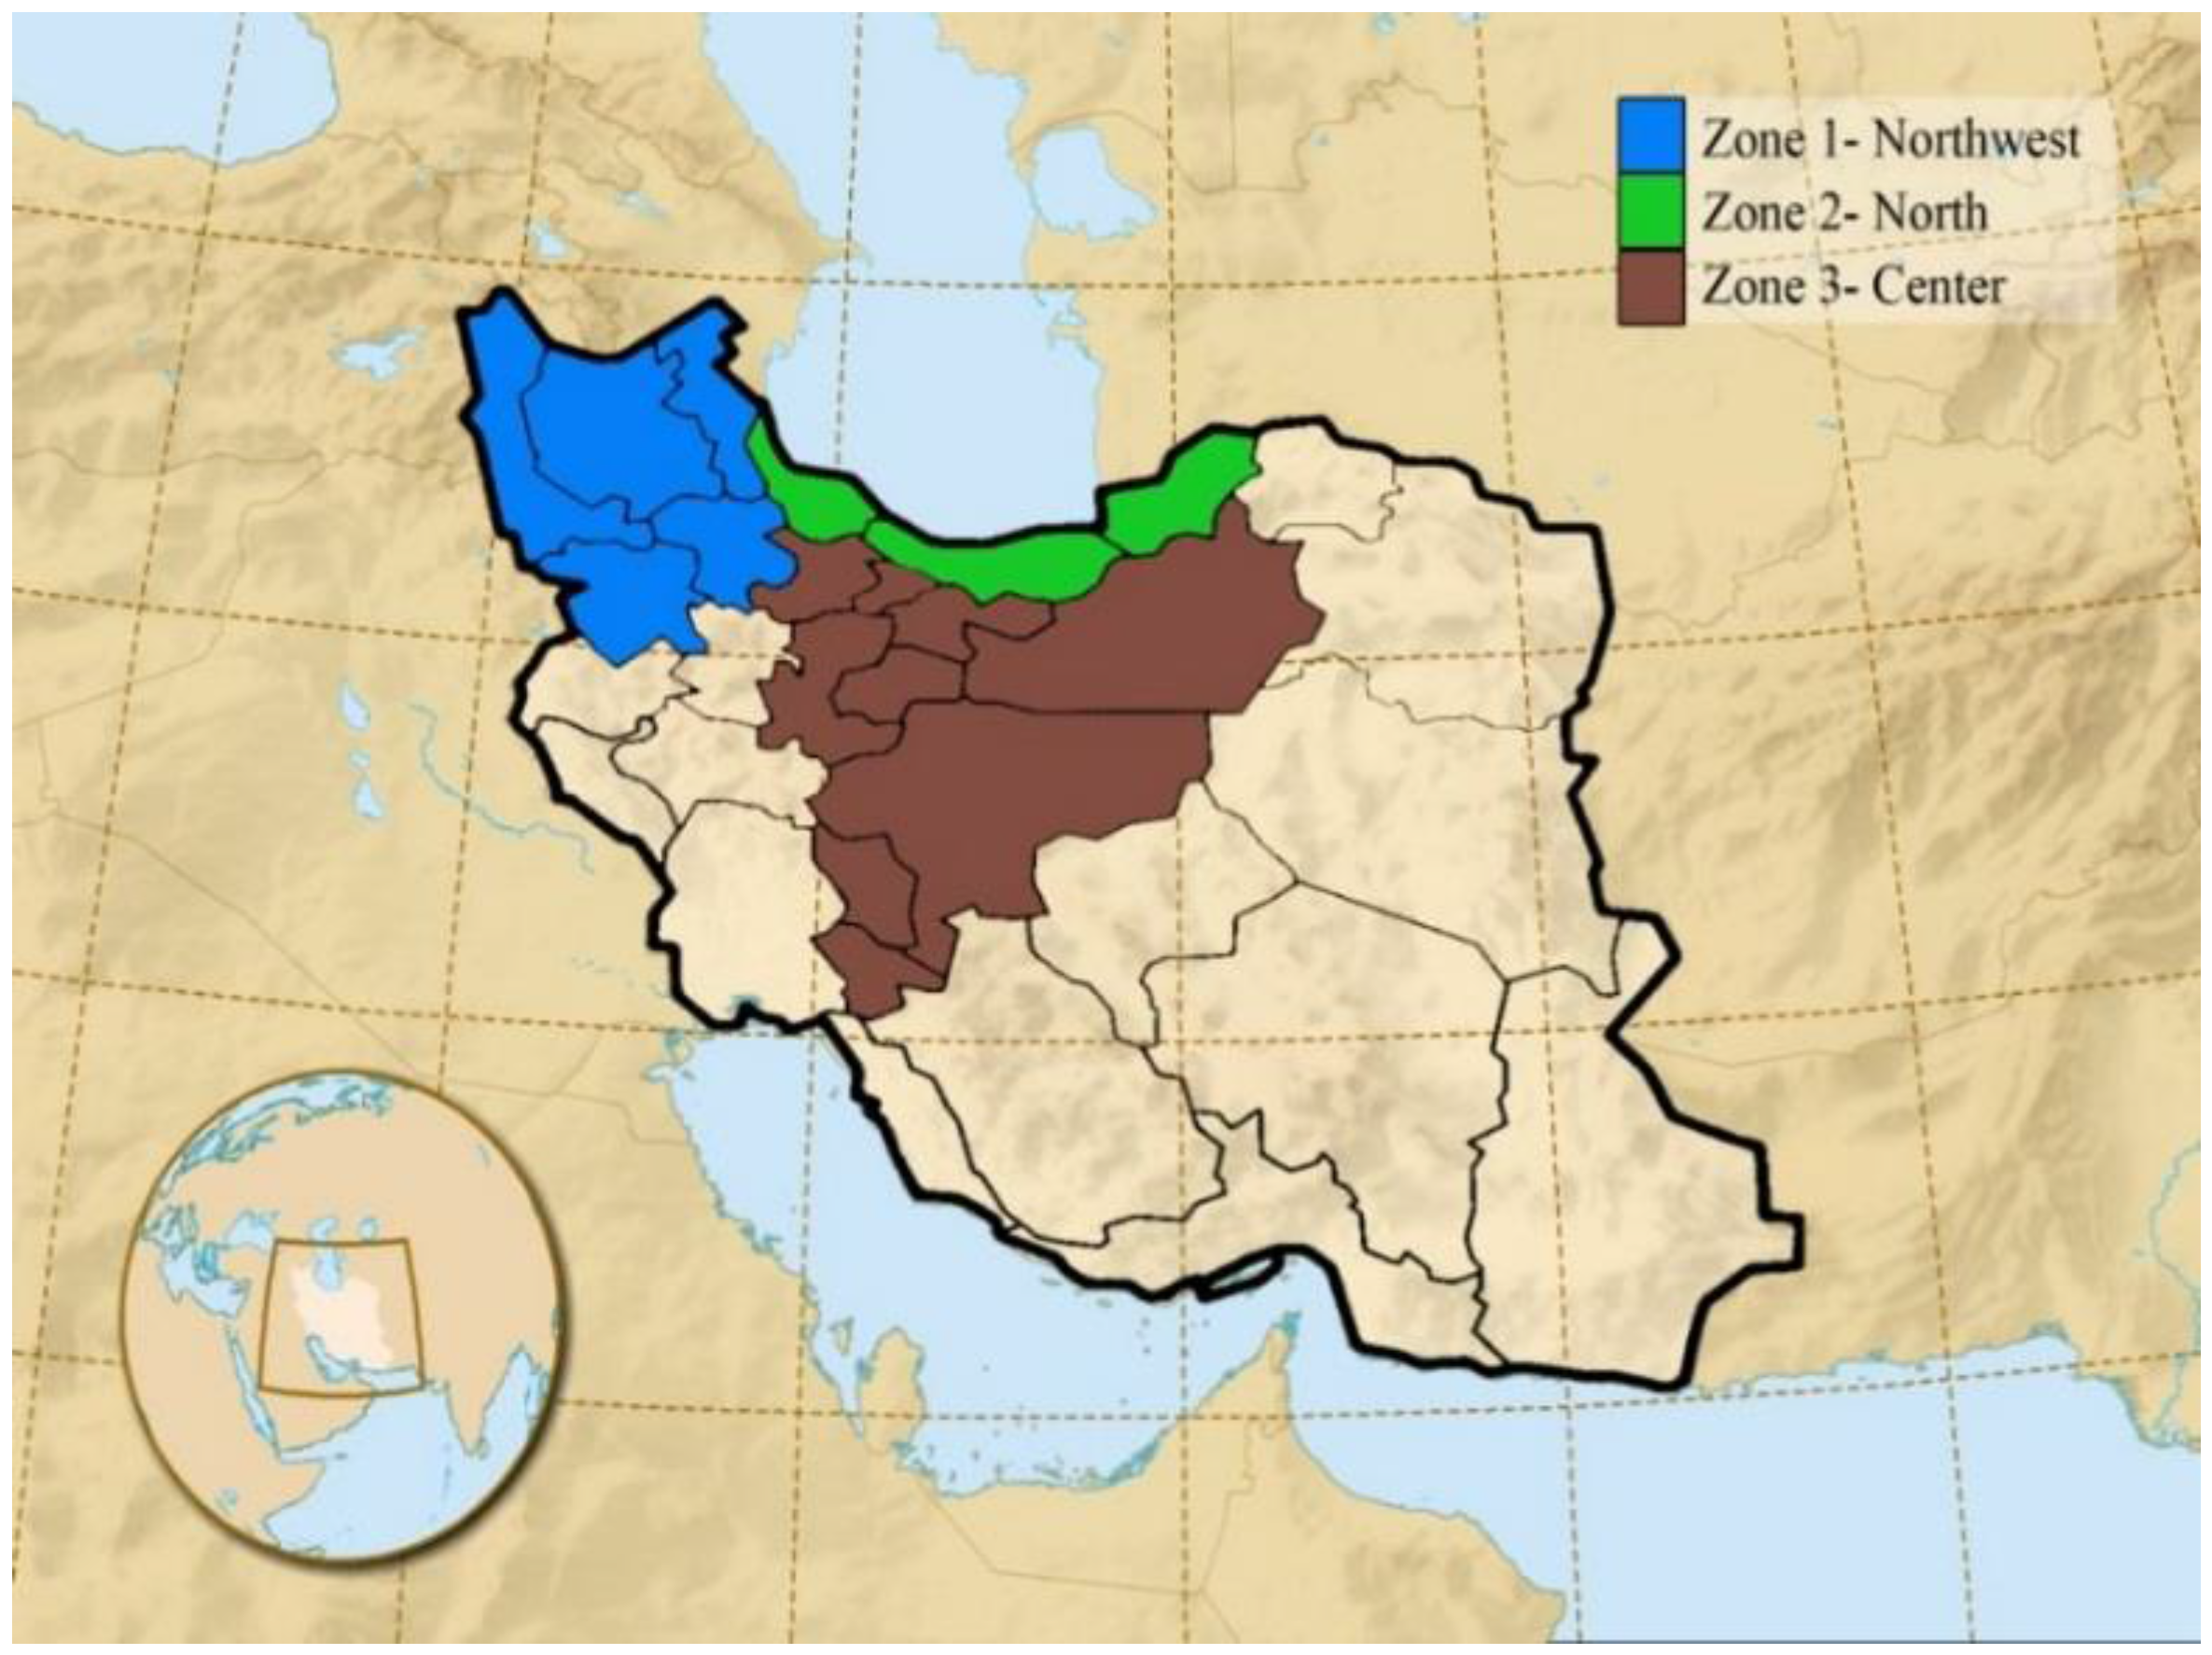
2.1. Geography of the Study Domain

This study was performed in three selected zones in the northwest, north, and central regions of Iran according to data availability and different climate conditions (cold semi-arid, Caspian mild and humid, semi-warm, and semi-arid). Figure 1 shows the assumed geographical and climatic areas in this study [27,28,29].
Figure 1. Classification of the considered study zones according to various climate conditions in Iran [27].
Climate 03 00876 g001

2.2. Observed and Reanalysis Data and Calculated Climate Indices

In Iran, 18,295 industrial herd stations with approximately 1.3 million cows are active from a total of 25,353 stations with the capacity for approximately 3.3 million cows. A total of 66% of the cows in Iran are pure Holstein, Jersey, and Brown Swiss, 27% are hybrids, and 7% are home-born cows. According to the published statistics, the total milk yield in Iran in 2013 was 3792 tons [30].
We considered important factors that could affect milk data gathering conditions (i.e., genetics, cow age, environmental conditions, season, lactation, pregnancy, and feeding management) from industrial herd stations with good health services under controlled conditions and veterinary care.
In this study, we used the monthly average of test-day (TD) records of milk yield (kg), with the TD representing the day that the cow was milked. The milk yield and three-times-a-week records of fat and protein contents (g/100 mL milk) were collected from almost 600 industrial Holstein herd stations. The herd sizes varied between 75 and 200 cows, and the cows had access to grazing from April to September from 2002 to 2010. The final milk monthly averaged data bank was a matrix of 3 × 936,227 individuals comprised of milk yield, fat, and protein data. Data were gathered under the condition that the cows were on days four to 305 of the milking time and between their third and sixth calves over their lifetime without a record of mastitis throughout the entire study period. All of the records from cows that had a dry period or mastitis illness were omitted from the primary raw data set. Mastitis is known to be one of the most prevalent illnesses of cows and to have a major effect on milk yield [31]. Finally, the individual records from all herds within one of the three climatic zones and the selected month were averaged to enhance a potential joint signal. Bootstrapping with a resampling N = 1000 was employed to assess the sampling uncertainty of this final data preparation step. This step basically represents a resampling with replacement among the herds/stations within one of the three climatic zones in each month of the years 2002 to 2010. For further details, the reader is referred to Section 2.3.
Climate data were taken from the MERRA reanalysis [19] data set. This data set has a nominal resolution of 1/2 degrees latitude and 2/3 degrees longitude covering the same months and years as the milk data. THI is a widely used indicator of thermal conditions and the heat stress index. Marami et al. [5] reported a correlation of THI with fat, milk yield, and protein, with values of (−0.47, −0.22, 0.37) in spring and (−0.32, −0.26, 0.31) in summer, respectively. According to the study by West [32], variability in other climate factors, such as solar radiation, wind speed, and their interactions, affected the performance of dairy cows. We also selected relatively new indices based on these predictors. The four new climate indices are defined in the following sections.
These indices are the Environment Stress Index (ESI), Heat Load Index (HLI), modified Heat Load Index (HLI New), and Respiratory Rate Predictor (RRP). The indices are calculated using the corresponding climate data parameters from the daily values at individual grid points and subsequently averaged to months and overall grid points within each of the three climatic zones. This step was performed based on previous results [20,27] that showed that, typically, the area-averaged large-scale climate information provided the most important predictor for variability in the biosphere. Due to the nonlinear dependencies between the climate indices and input climate variables (especially for HLI and ESI; see Equations 1 and 5), the results would be different when monthly or seasonally averaged climate data were used.
The structure of the data set for climatic and milk parameters is presented in Figure 2. We separately considered the parameters during the period from the years 2002 to 2010 for summer (July, August, and September) and spring (April, May, and June).
Figure 2. Structure of the climatic and milk parameter data set.
Climate 03 00876 g002
In this study, all of the analyses were implemented using R version 3.0.2, which provided various packages for statistical data analysis, calculations, and graphical display [33].

2.2.1. Environmental Stress Index (ESI)

Moran et al. [14] introduced an environmental stress index (ESI) as a substitute for the wet bulb globe temperature (WBGT). The ESI index considers the Ta (ambient temperature; °C), RH (relative humidity; %), and SR (solar radiation; wm−2). According to the study of Epstein and Moran [34], the WBGT index is well justified for many regions but is hard to use. The ESI is highly correlated with the WBGT (R² ≥ 0.981) even for hot-wet and hot-dry climate conditions [35].
ESI = 0.63 Ta 0.03 RH + 0.002 SR + 0.0054 Ta × RH 0.073 ( 0.1 + SR ) 1
The RH is calculated by the Magnus formula [36] using other climate parameters, such as vapor pressure (e) and saturated vapor pressure ( e w * )
e = 1.6077 p q
where e is the vapor pressure (hPa), p is the local pressure (hPa), and q is the specific humidity. The difference between the local and sea surface pressure can be important in mountainous areas, where the local pressure p is less than the sea level pressure and leads to an overestimation of the vapor pressure.
e w * = 6.1  exp ( 17.6   T T + 243.5 )
where   e w *   is the saturated vapor pressure (hPa) and is calculated by the two meter height (T2m in °C).
RH (relative humidity; %) is calculated as
RH = e e w *

2.2.2. Heat Load Index (HLI)

The HLI was suggested for the first time by Gaughan et al. [16]. The HLI is based on V (wind speed; m/s), RH (relative humidity; %), and T g *   (predicted globe temperature; °C).
HLI = 33.2 + 0.2 RH + 1.2 T g * ( 0.82 V ) 0.1 log ( 0.4 V 2 + 0.0001 )
T g * = 1.33 T 2.65 T 1 2 + 3.21 log  ( SR + 1 ) + 3.5
Since 2008, HLI has been modified ( HLI  New ) by Gaughan et al. [18] to two formulas based on a globe temperature above and below 25 °C.
When T g *   < 25 °C,
HLI  New = 10.66 + 0.28 RH + 1.3 T g * V
When T g > 25 °C,
HLI  New = 8.62 + 0.38 RH + 1.55 T g *   0.5 V + e 2.4 V
Silva et al. [6] showed that the first version of the HLI was the best thermal stress index under tropical conditions. The classification by HLI can be divided into four categories: cool (≤70.0), warm (between 70.1 and 77.0), hot (between 77.1 and 86.0), and very hot (≥86.0) [18].

2.2.3 Respiratory Rate Predictor Index (RRP)

The RRP was suggested by Eigenberg et al. [17] for no-shade conditions and consisted of the wind speed (V; m/s), RH (relative humidity; %), T (predicted globe temperature; °C), and SR (solar radiation; wm−2).
RRP = 5.4 T + 0.58 RH 0.63 V + 0.024 SR 110.9
where V is the wind speed (m/s) derived for the zonal and meridional wind components.
There are four categories in the RRP classification: normal (≤ 85), warning (between 85 and 110), danger (between 110 and 133), and emergency (≥ 133).

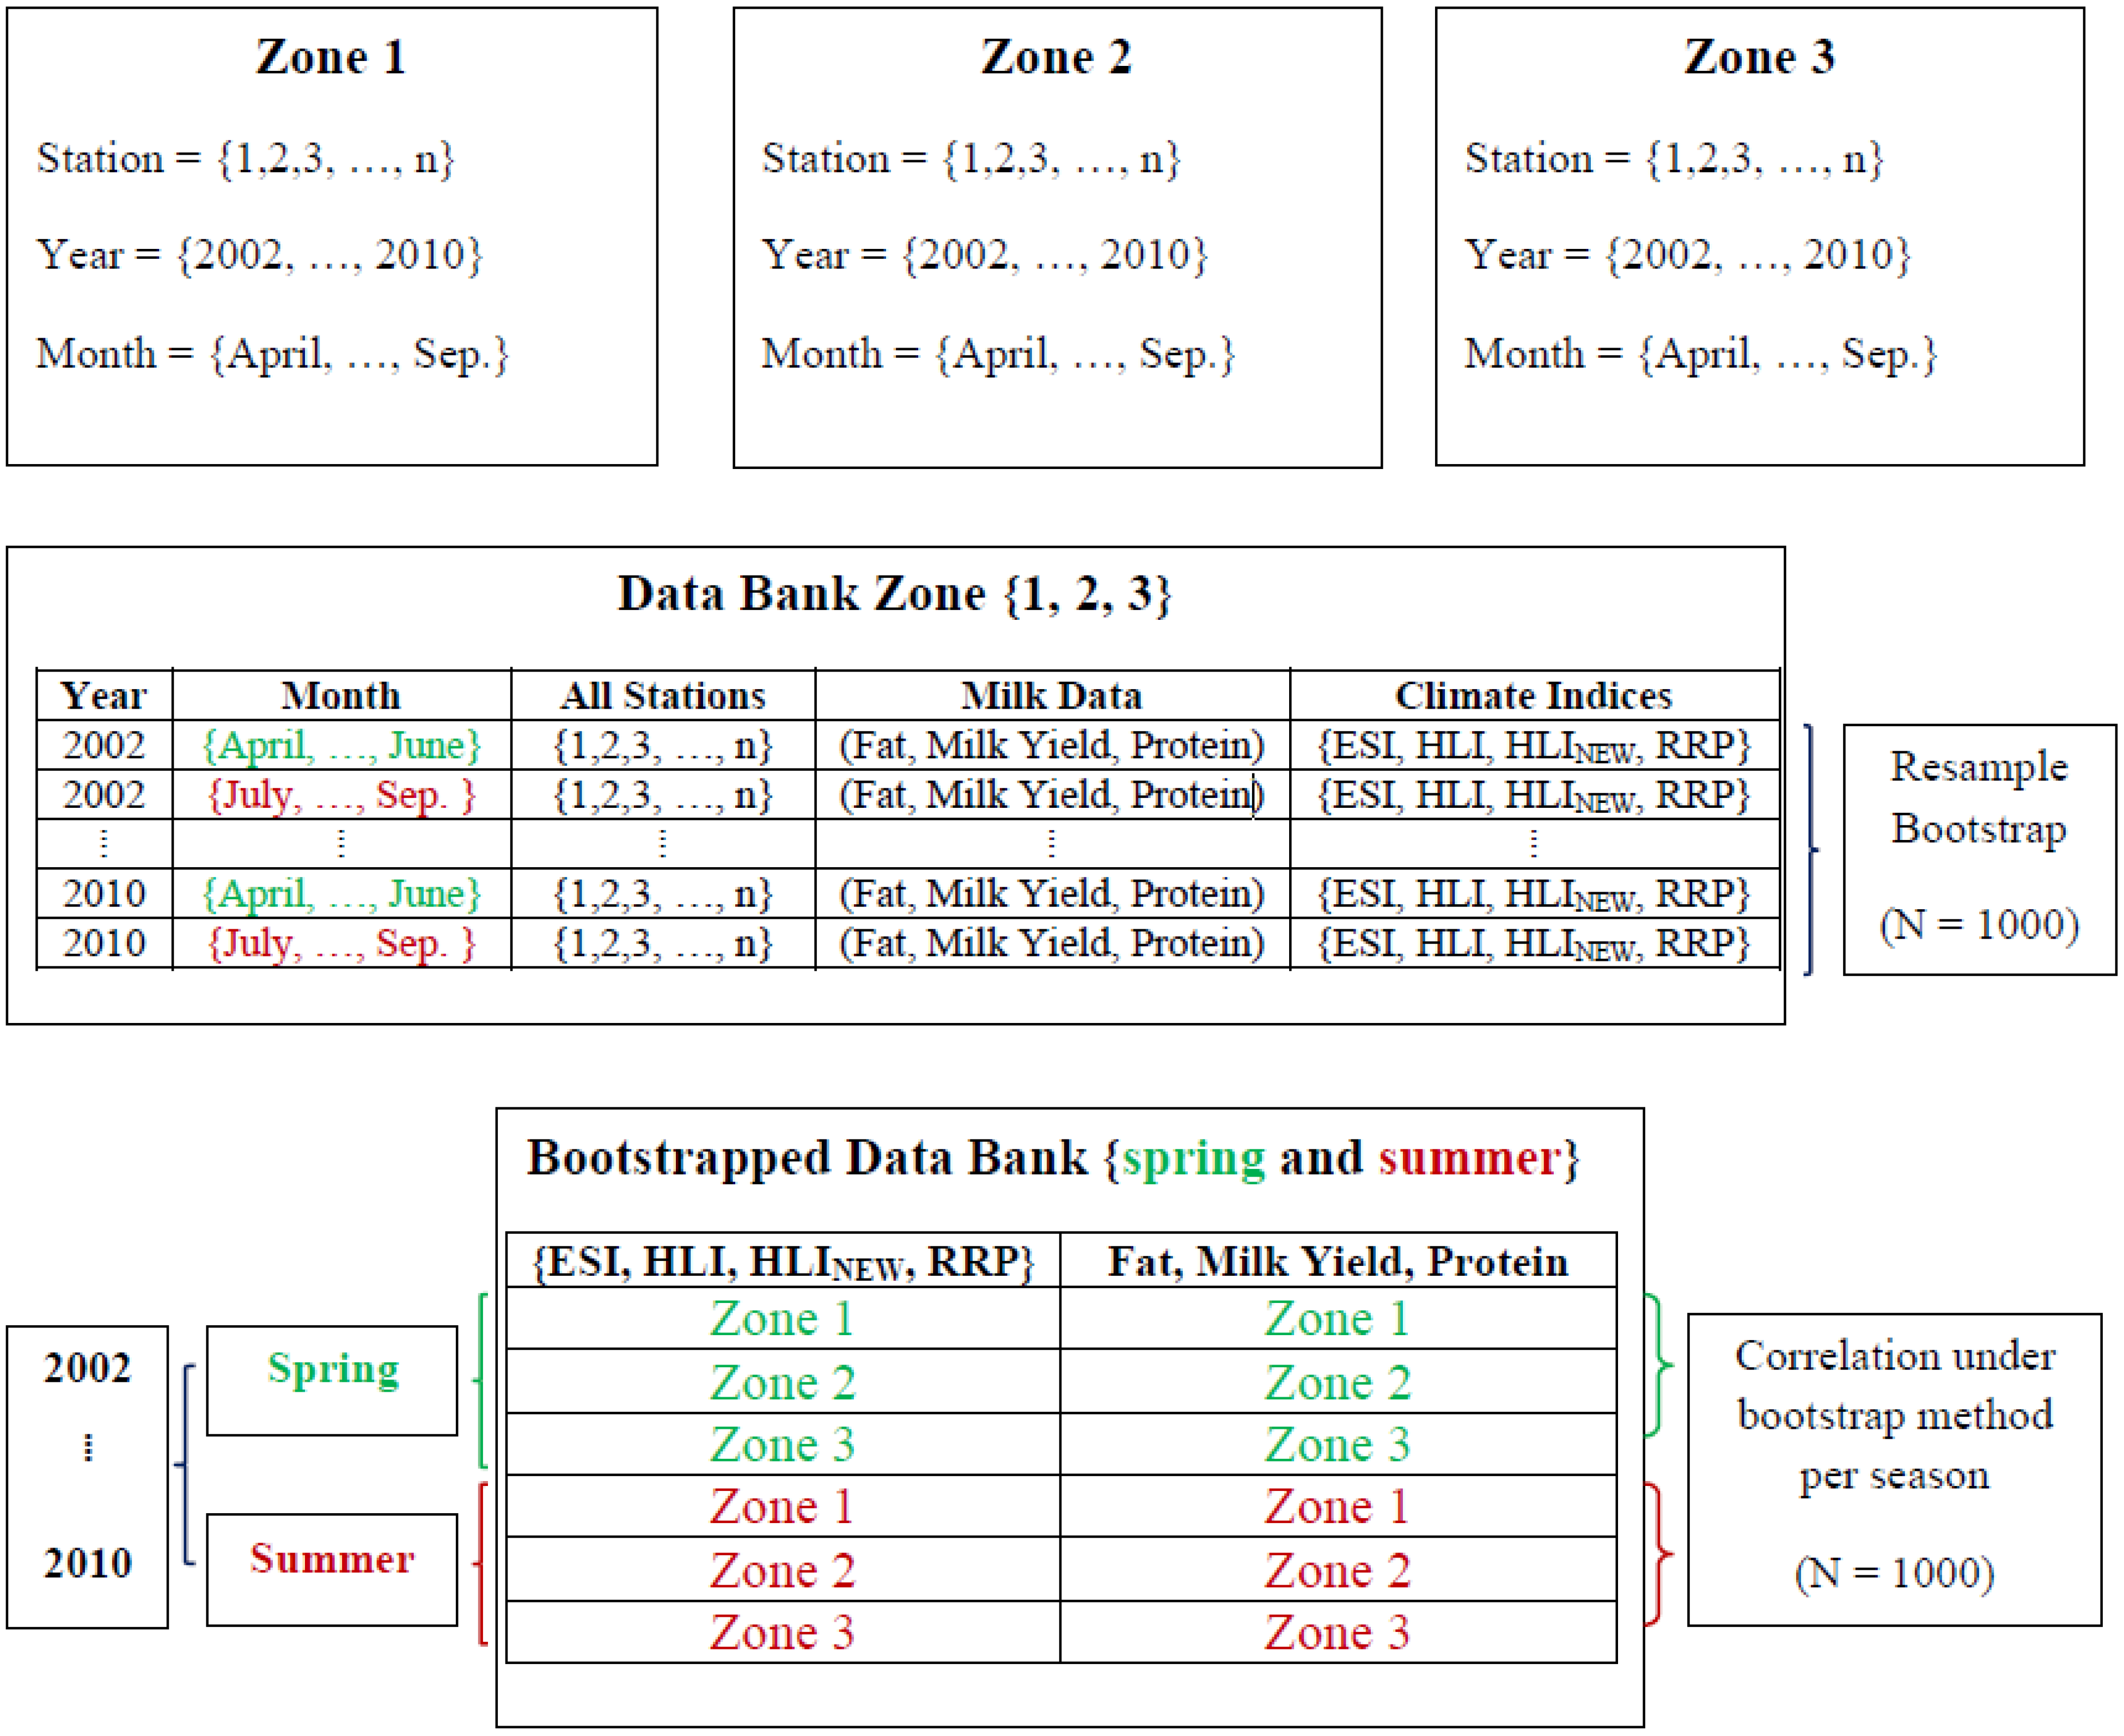
2.3. Uncertainty Consideration by Applying the Bootstrap Technique

The statistical analysis of short term data sets such as those used in this study requires careful consideration of their inherent uncertainty. This consideration is essential to avoid misleading results due to the small sample size.
A comparatively large data set of milk compounds in Iran is available. However, analyzing the statistically meaningful relationship with the inter-annual climate data results in a distinctive decrease in the sample size because only nine years of data (2002−2010) are available to estimate the dependency between near-surface climate variations and milk compound changes. Although a nine-year period of data is not a short term data set in agricultural investigations, in climate research nine years might represent a relatively small-sized data set.
Bootstrapping is a resampling technique that is a very valuable statistical method for the assessment of the influence of uncertainty within the available data sample on the results of the analysis [37] Bootstrapping is based on the empirical probability distribution function or the cumulative distribution function (cdf) of the data sample. Bootstrap methods use simulations to calculate standard errors, confidence intervals, and significance tests. They can be applied for any level of modeling and any type of statistical analysis [38]. The method used to estimate the cdf from the original sample distinguishes between parametric and non-parametric bootstrapping.
In the parametric bootstrapping method, the values of the mean and variance of an assumed Gaussian cdf are estimated from the original sample. Then, new sample values are generated by plugging these parameters and randomly drawing from this cdf [39].
The second way to generate new bootstrap samples is by estimating the cdf non-parametrically by sorting the original sample in increasing order. Sampling at random from this empirical cdf leads directly to a random sampling of the original data set with replacement such that, in the new sample, some of the original data are left out and replaced with copies of the remaining original data.
In this study, the non-parametric bootstrap technique was applied to the data and correlation analysis for the comparison of the milk and climate data. Thus, in the first step, the bootstrap technique was applied to the data from each station (i.e., herds) in each zone separately by generating 1000 samples of the monthly means of the milk yield, and fat and protein concentrations for the full period (2002–2010). In the second step, a correlation analysis was performed using the non-parametric bootstrapping analysis instead of the classical linear correlation approach.

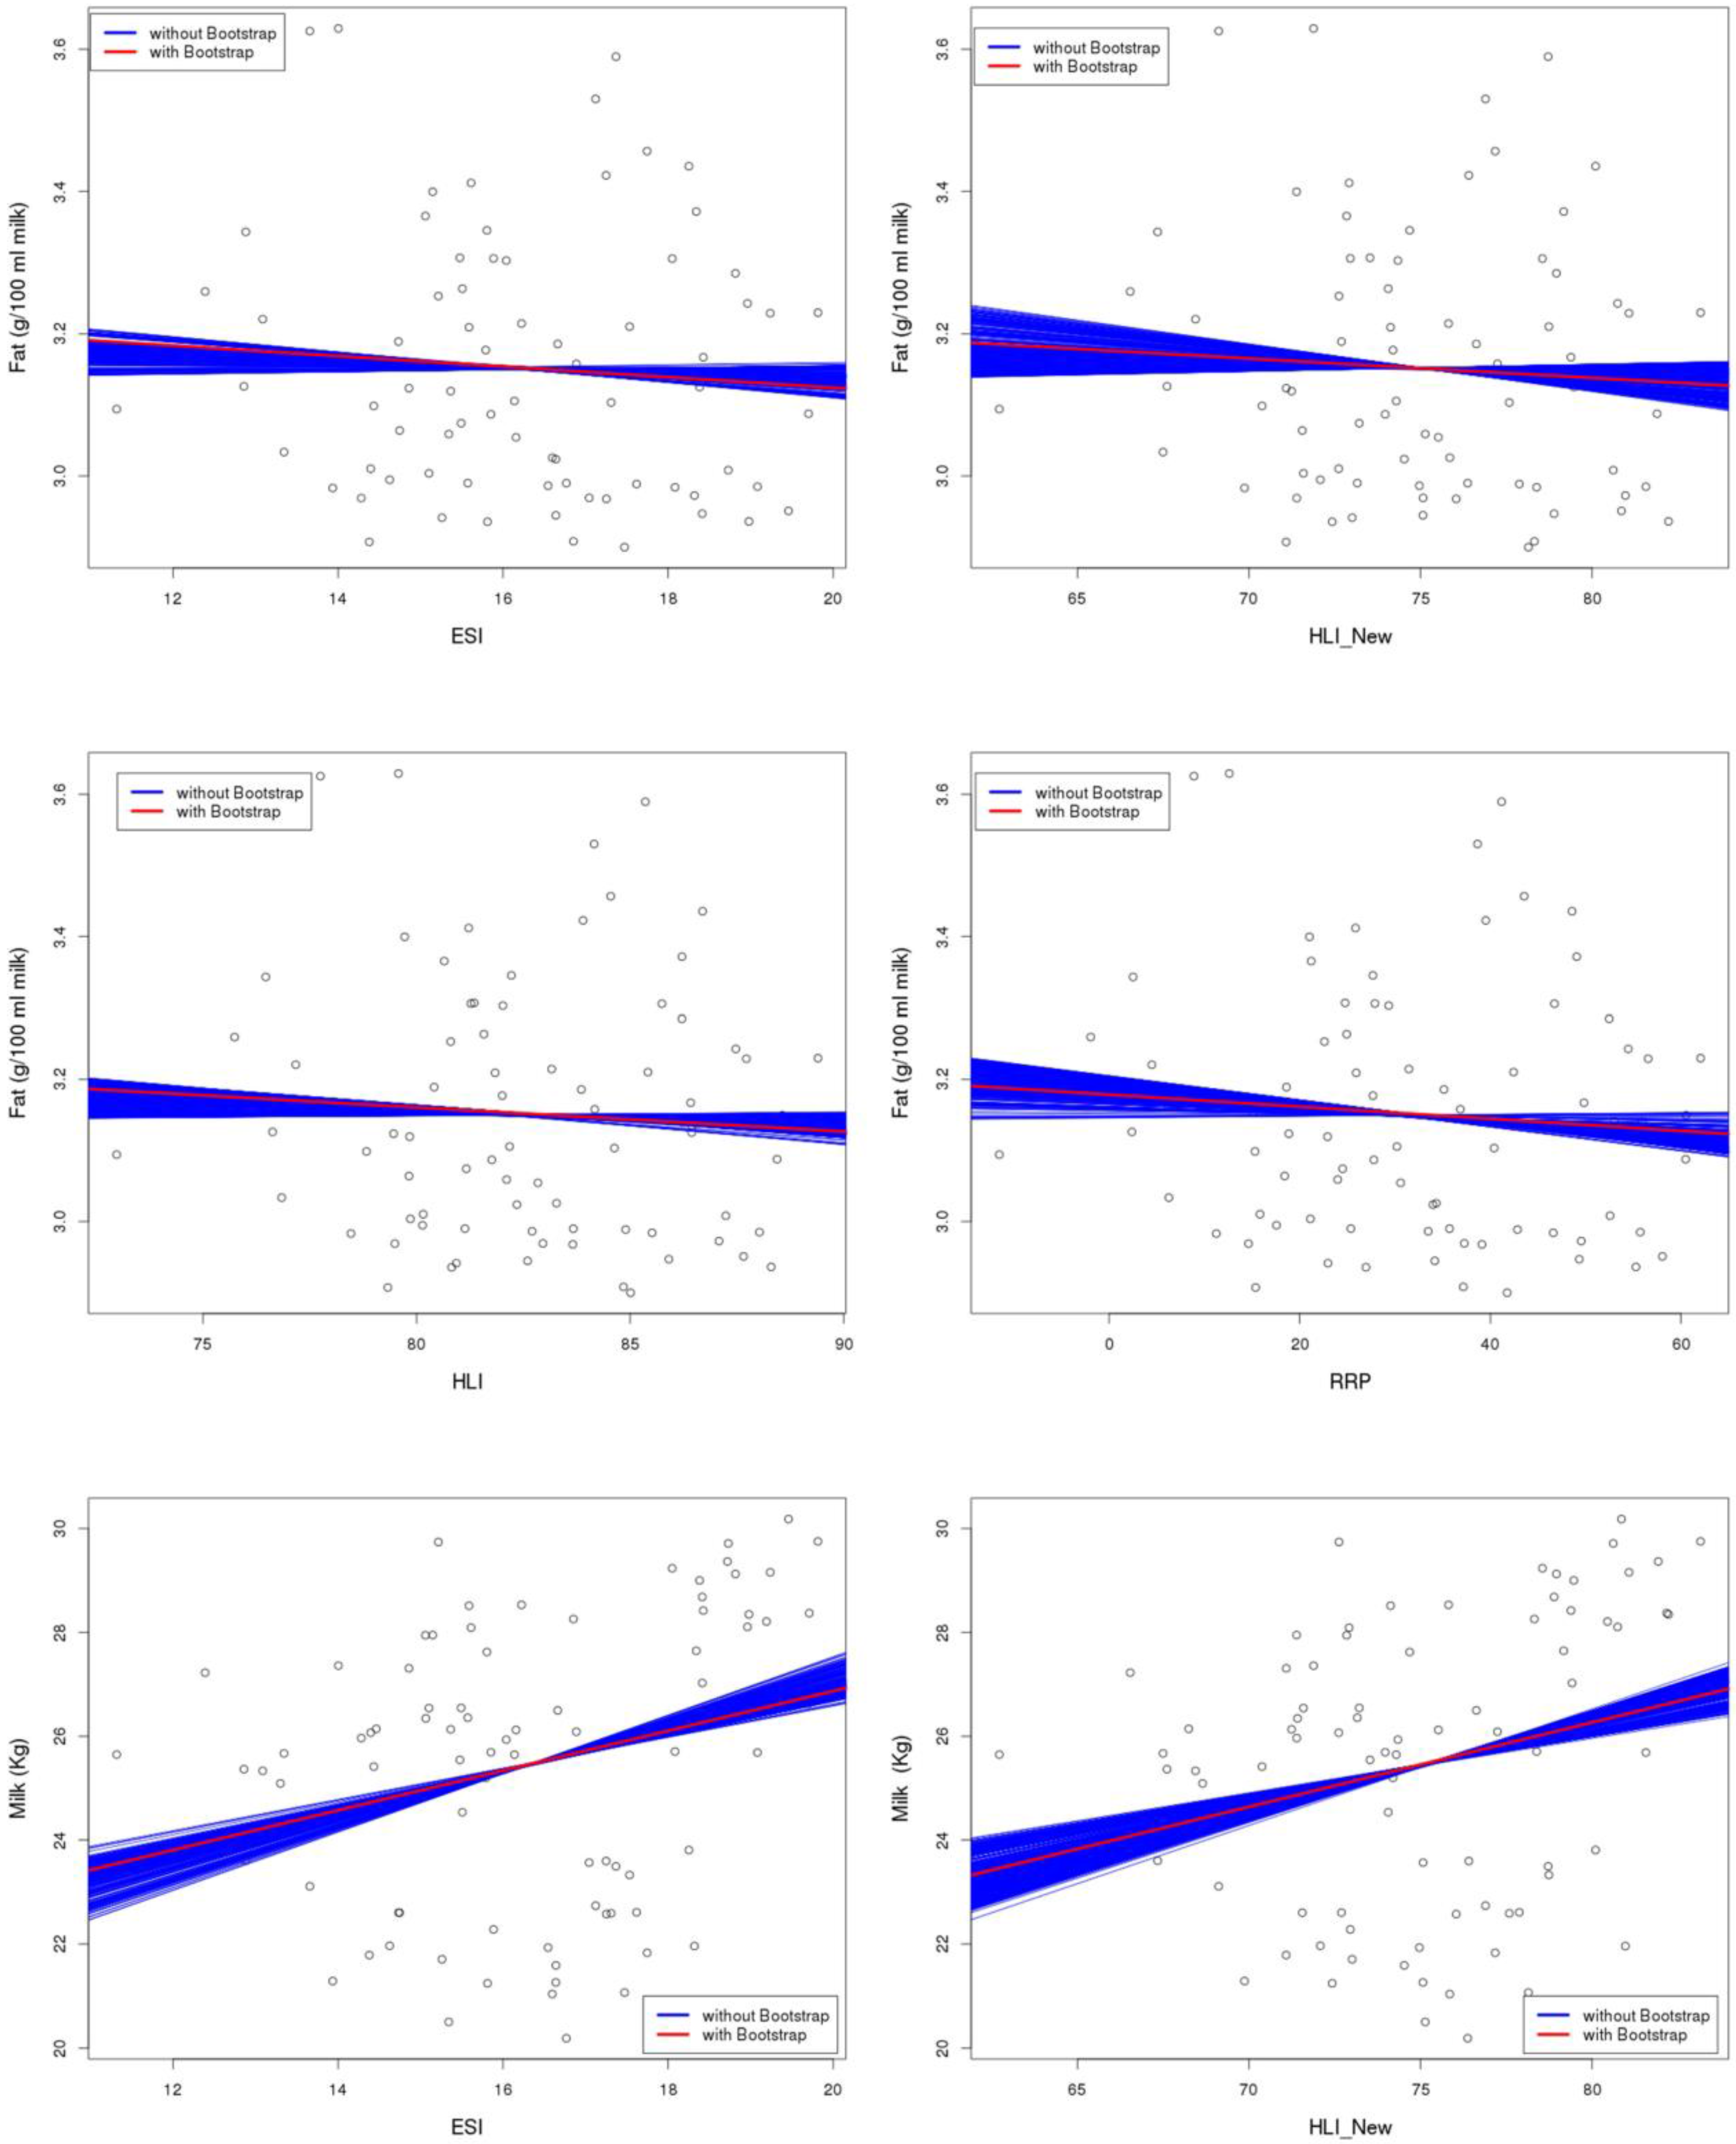
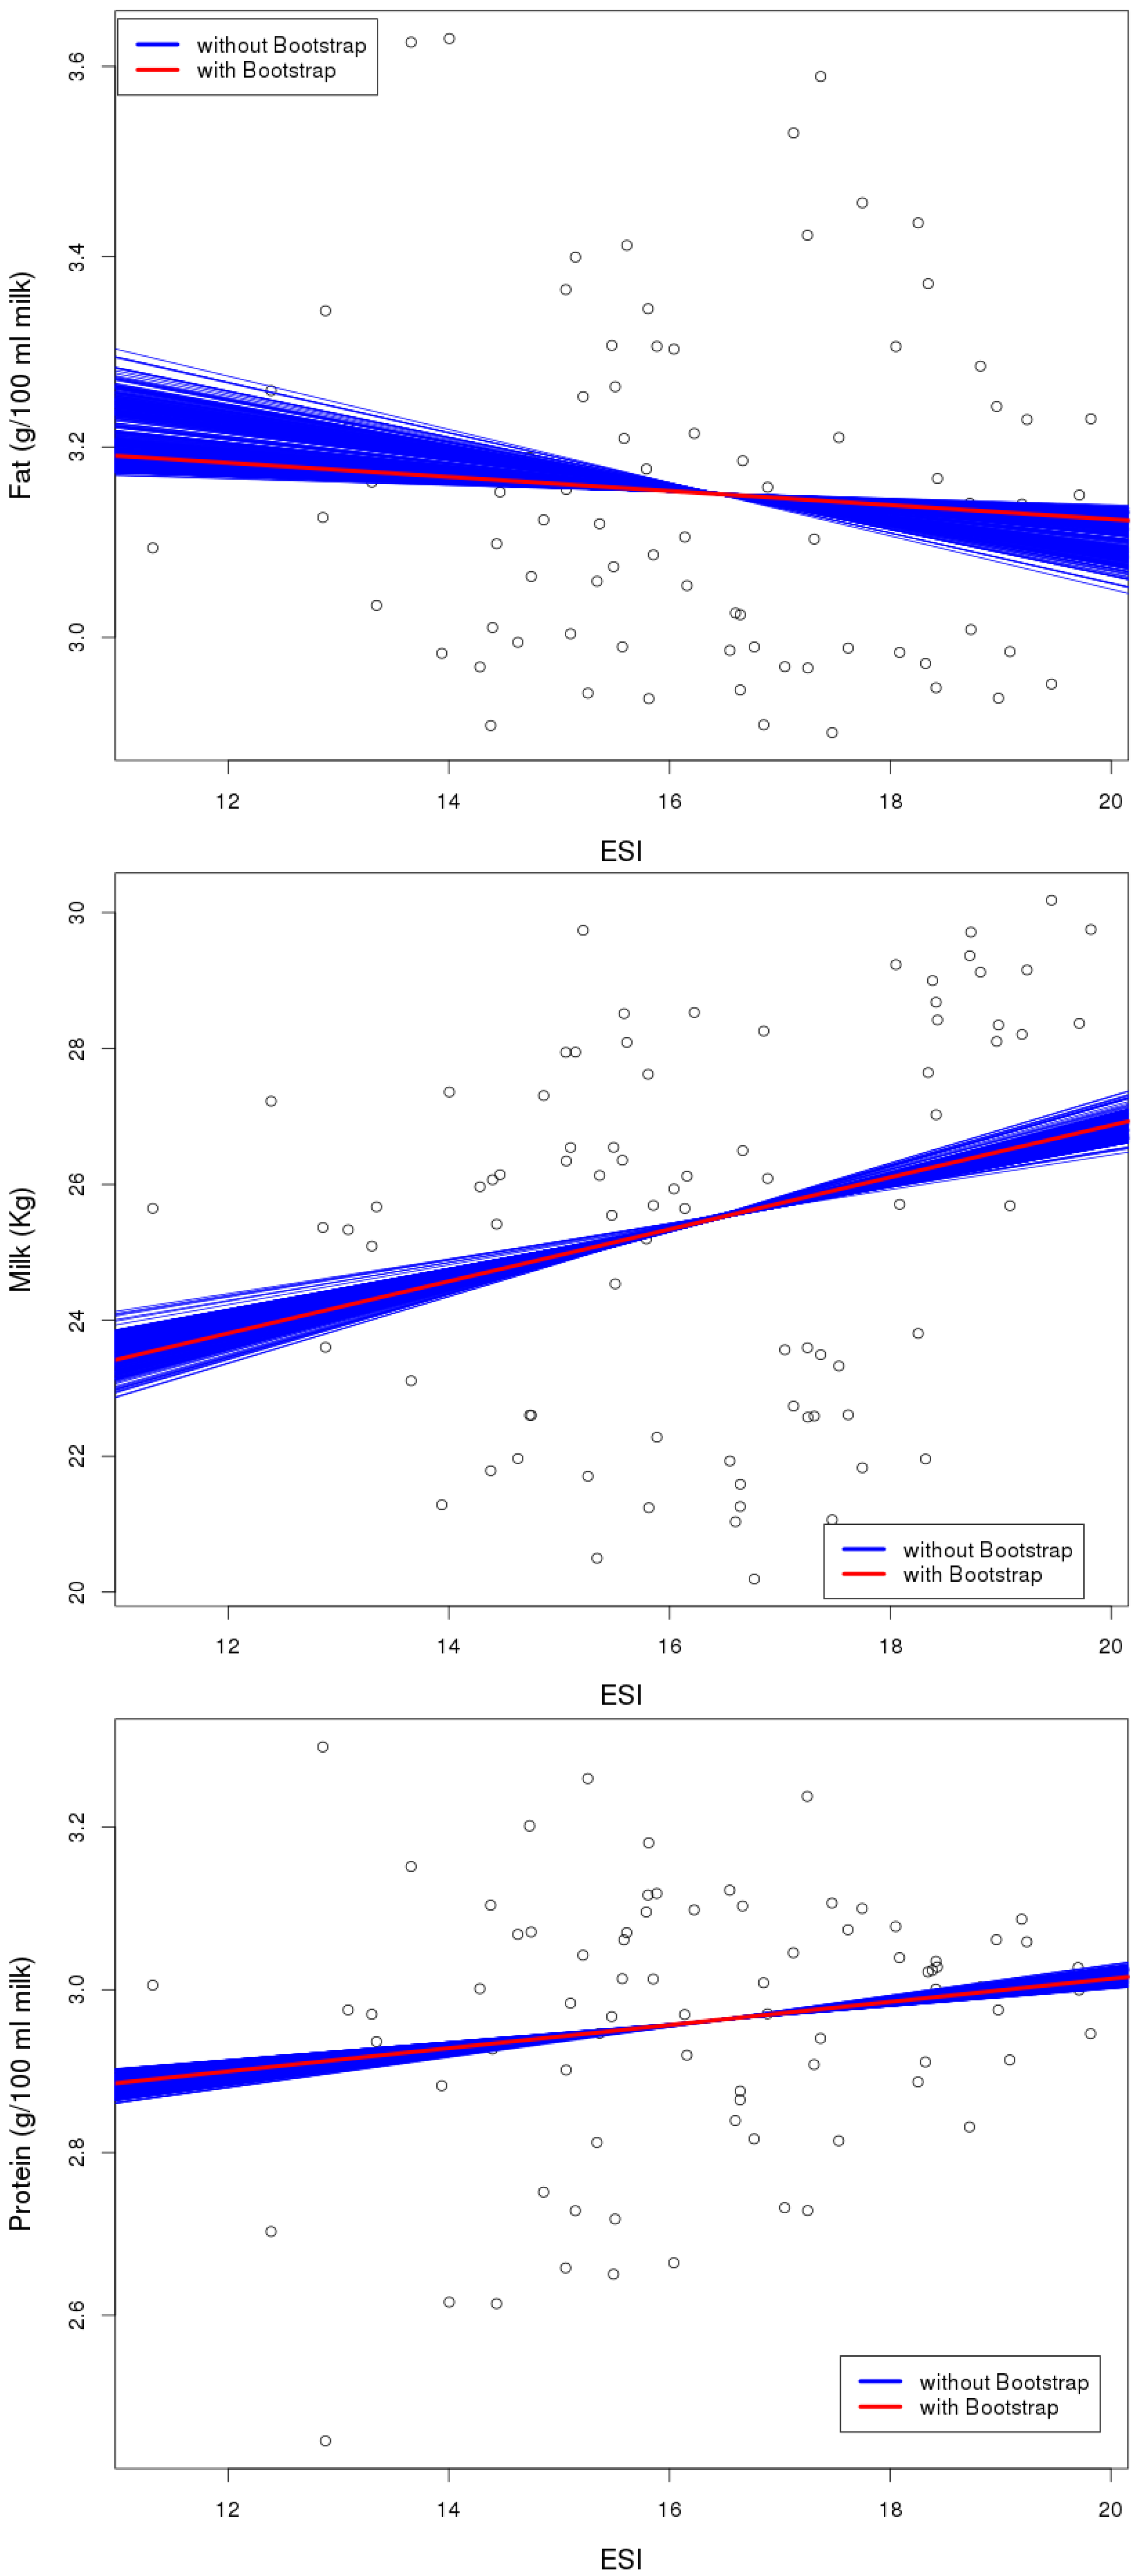
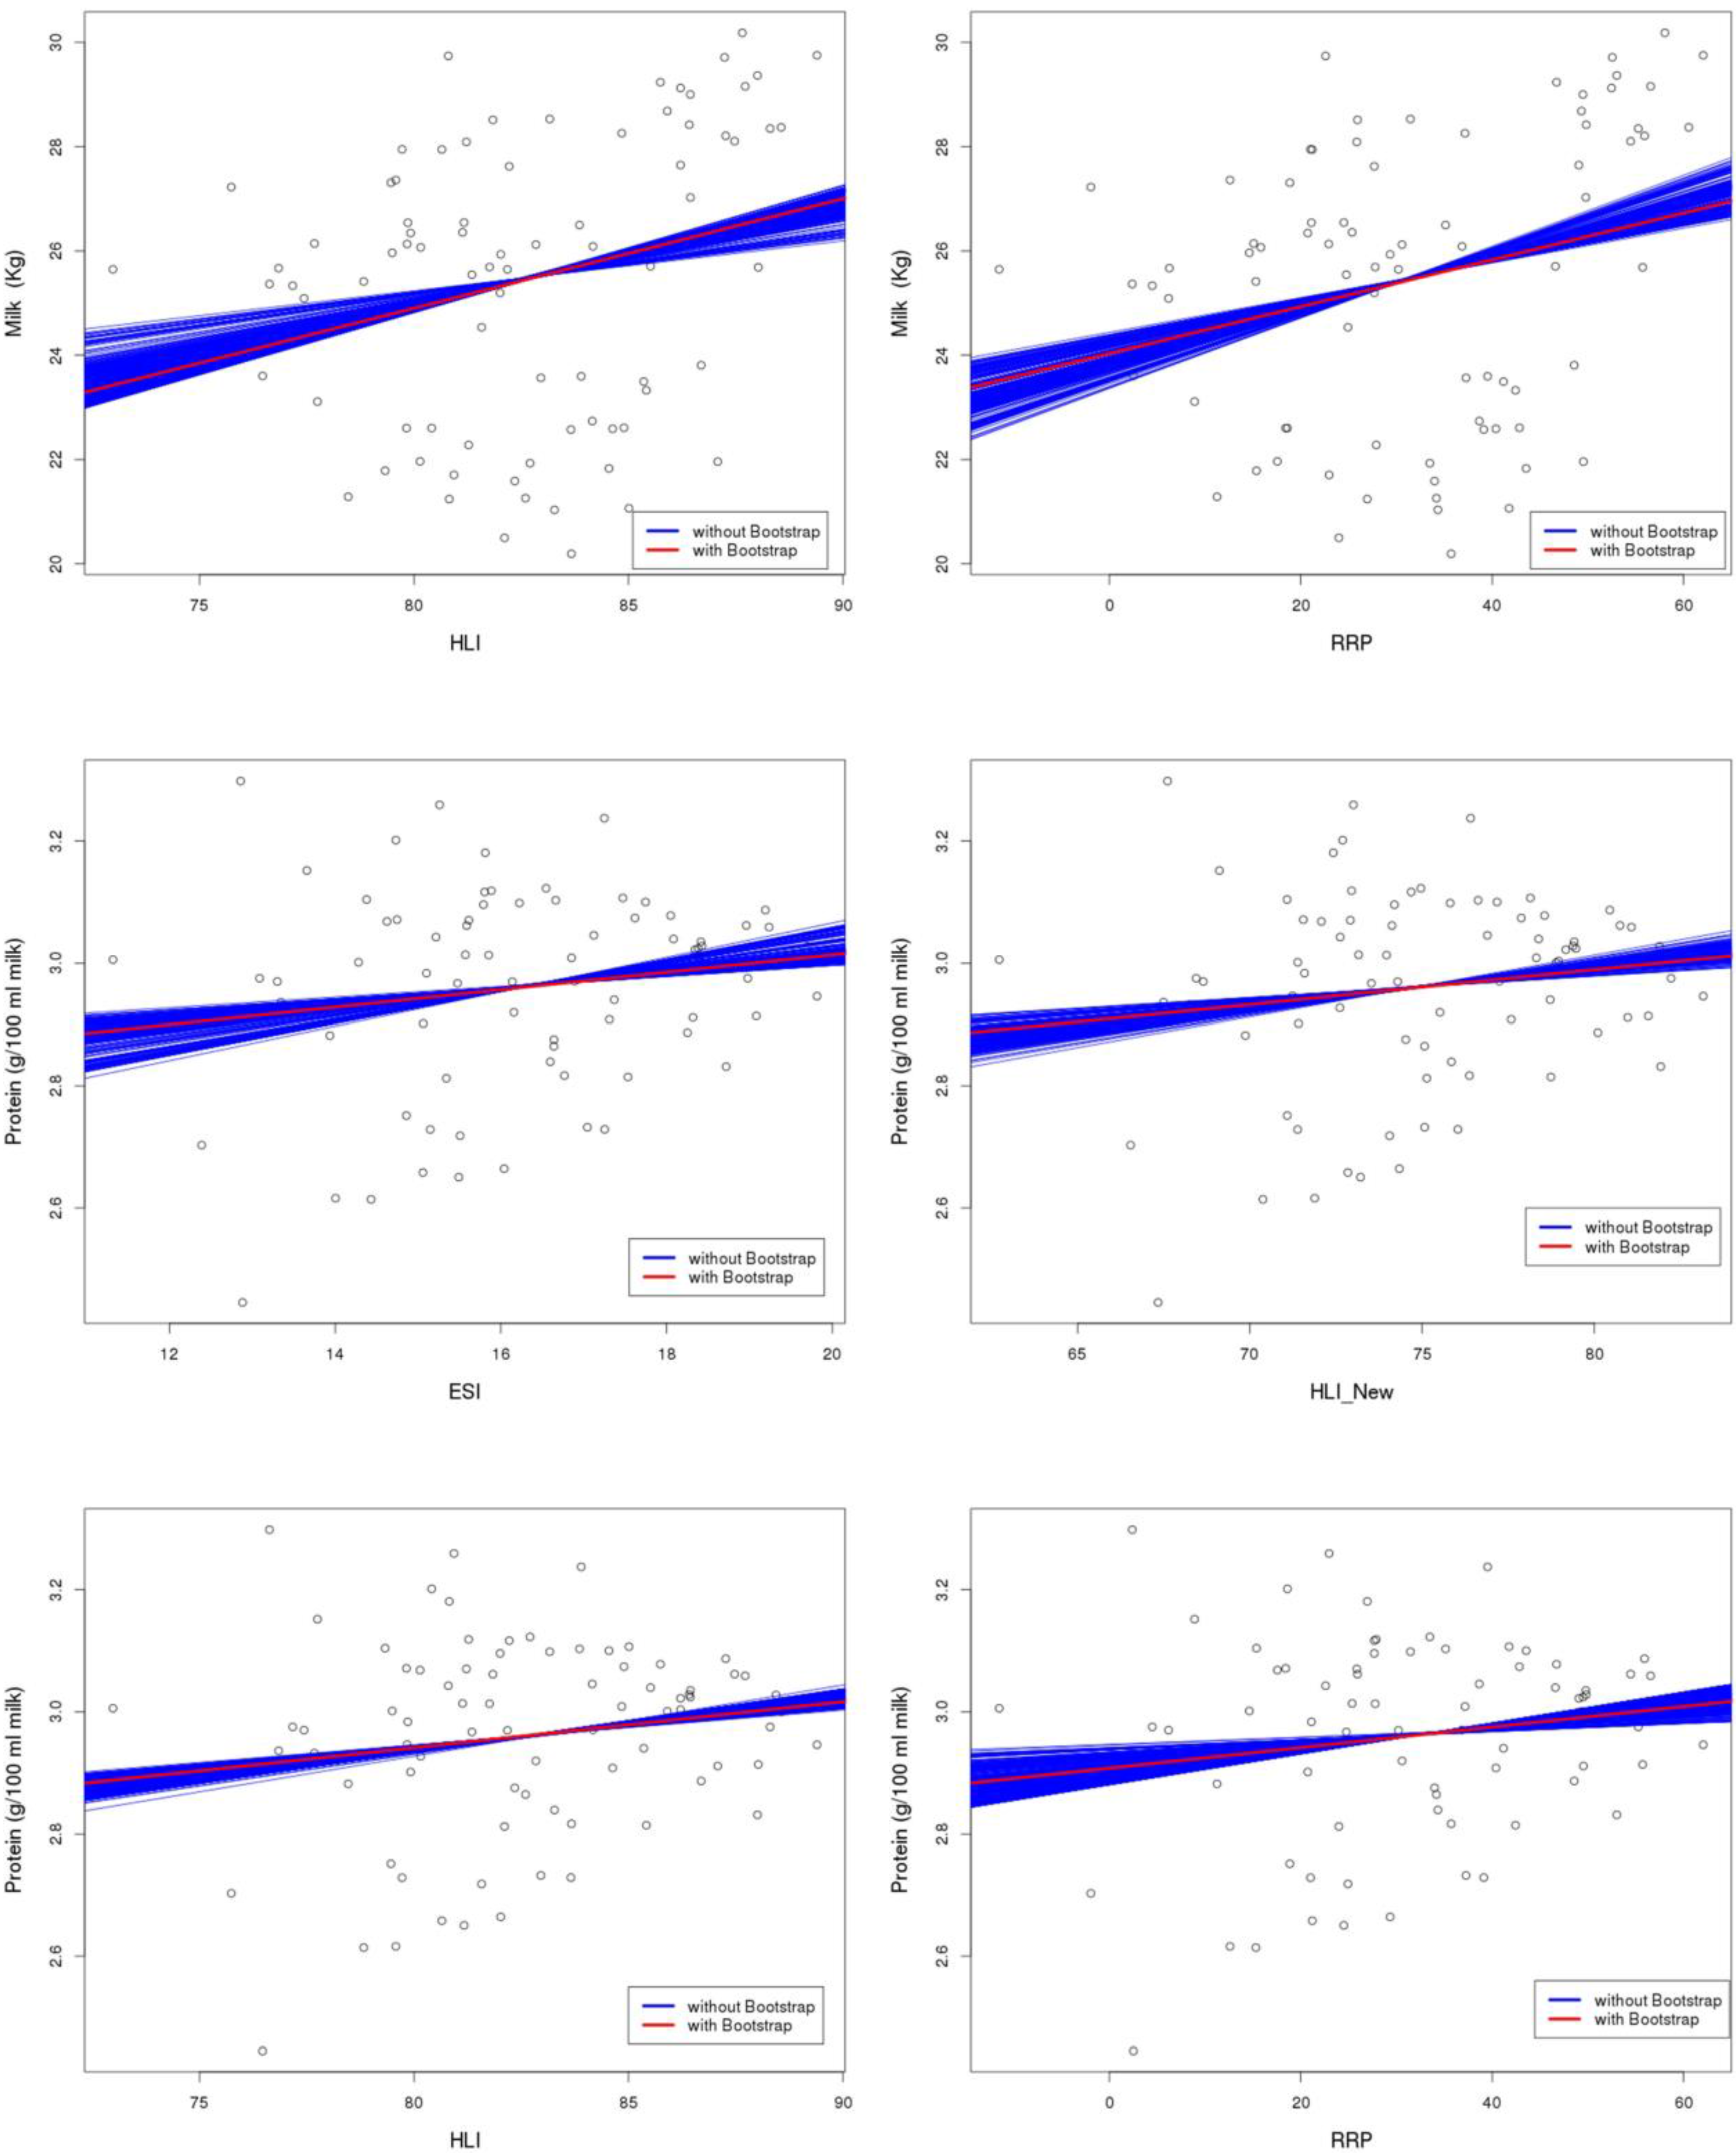
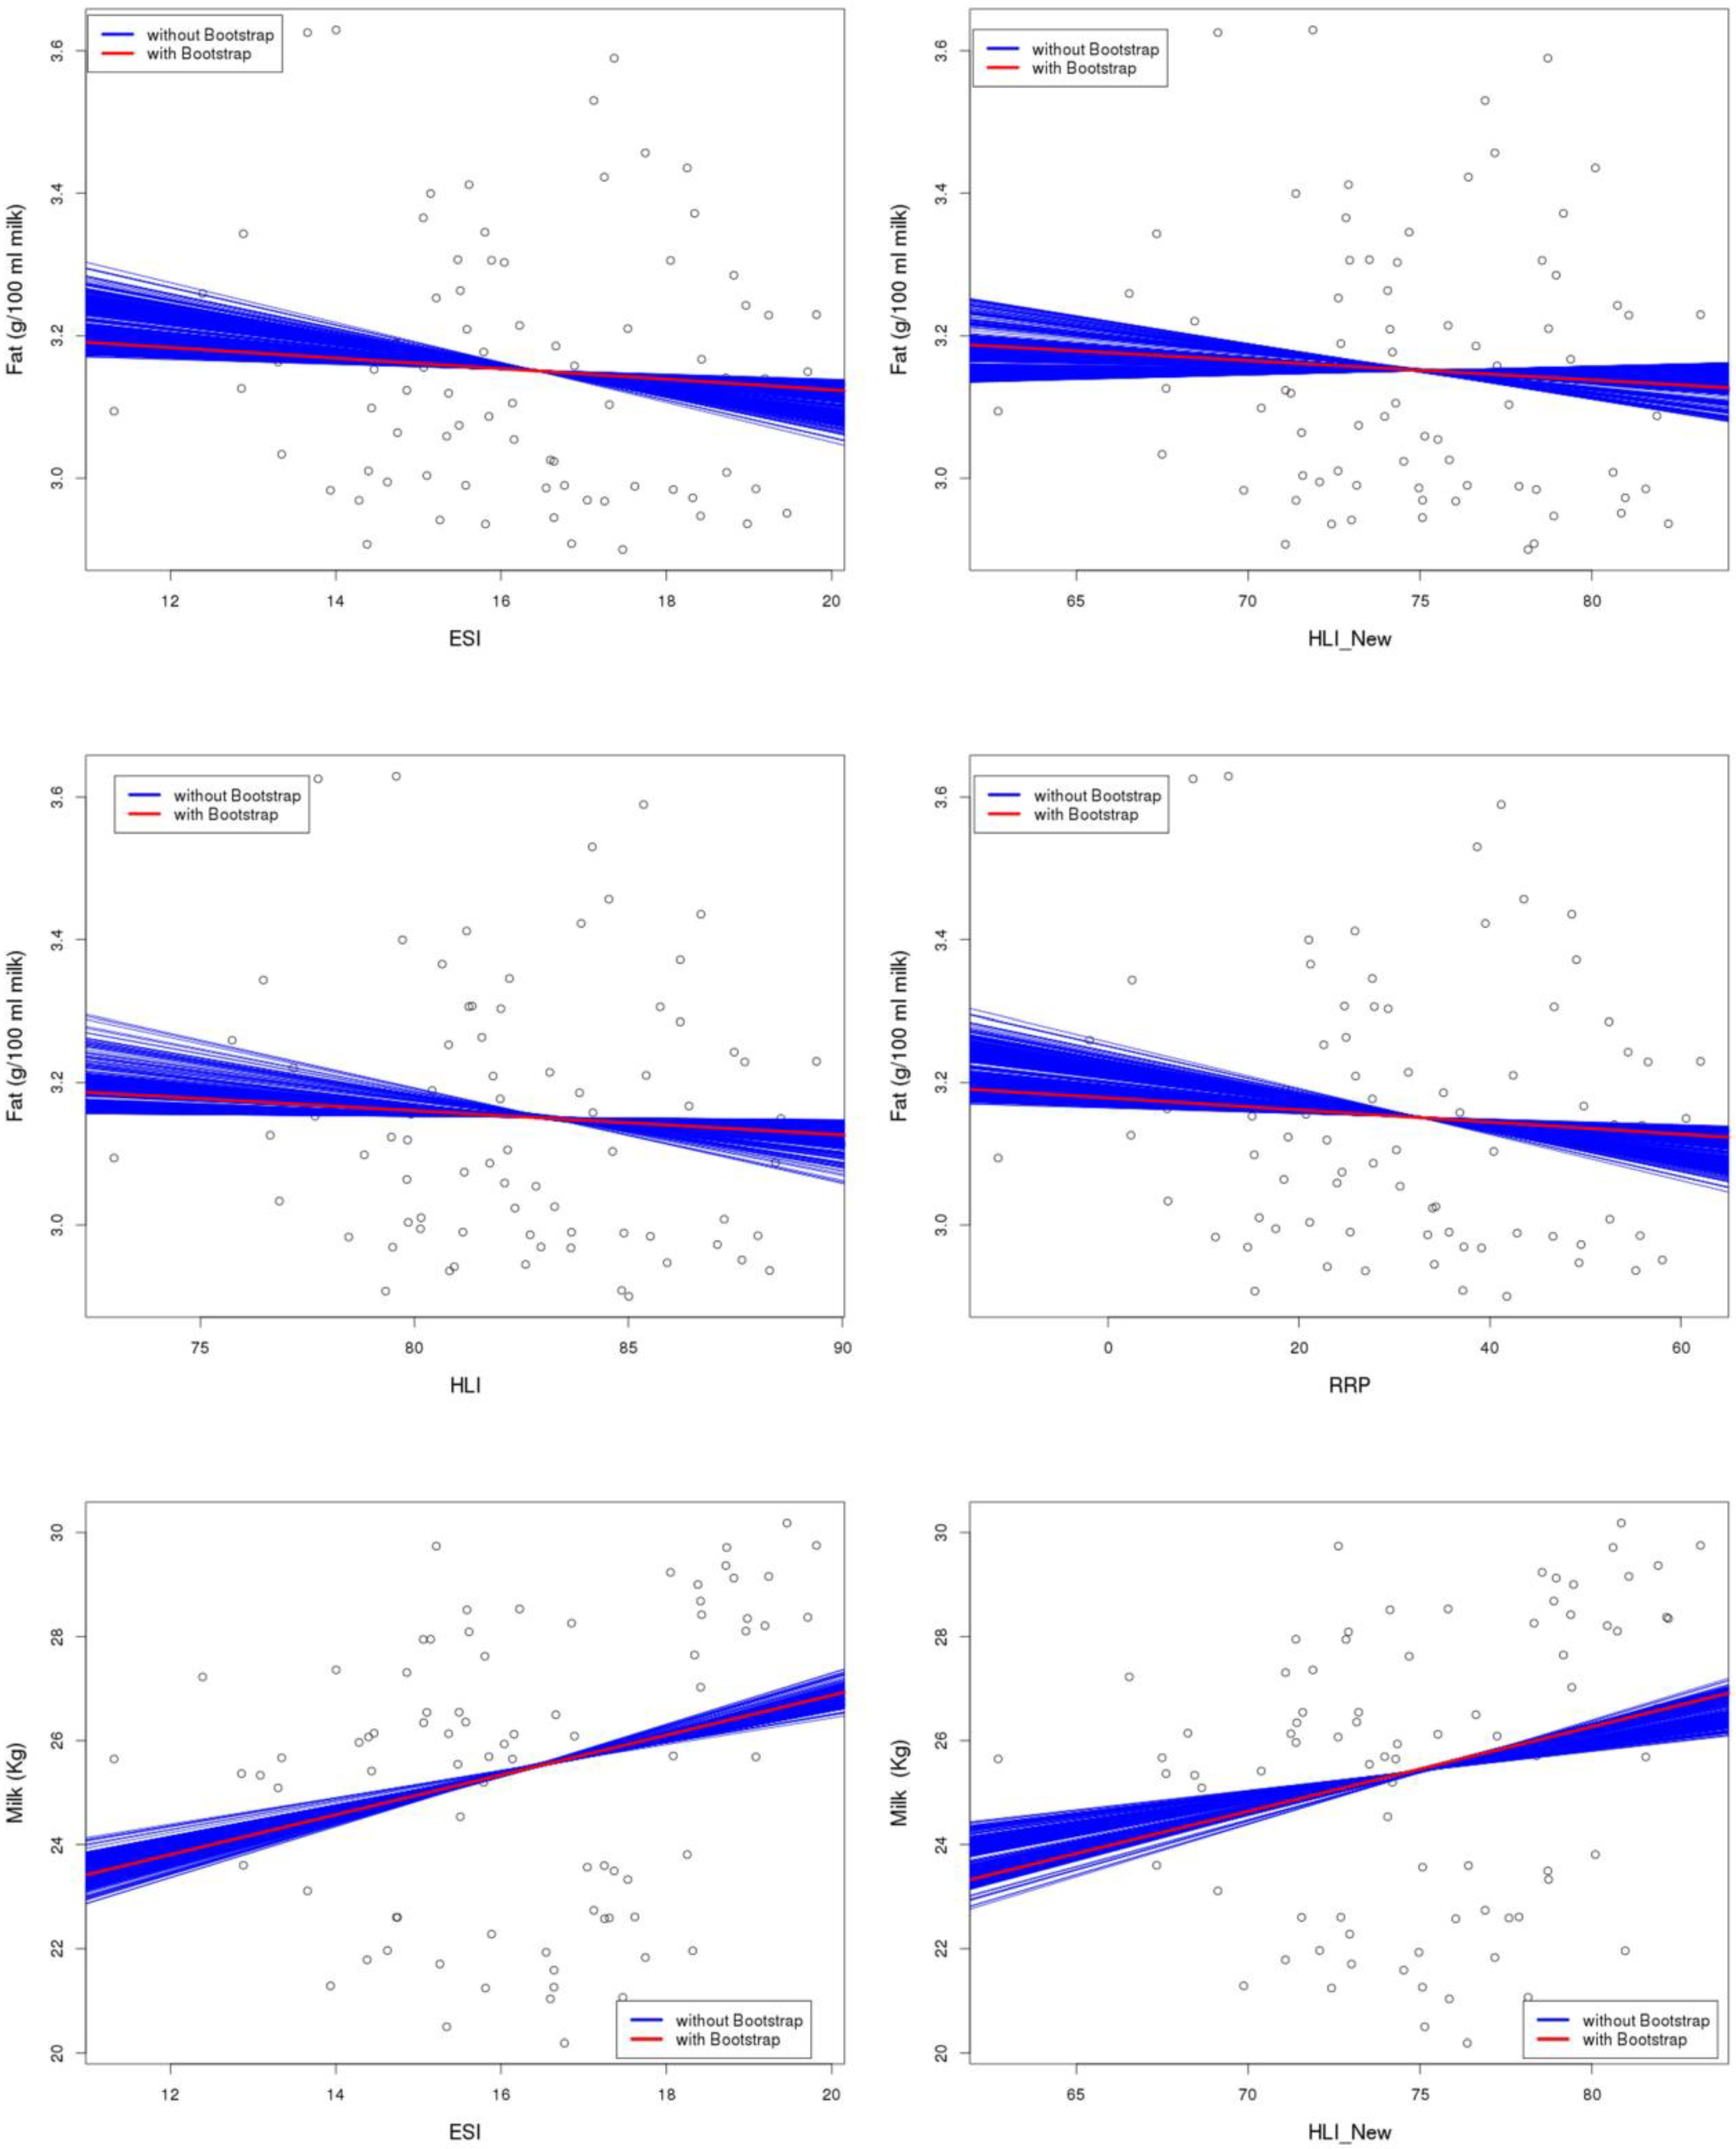
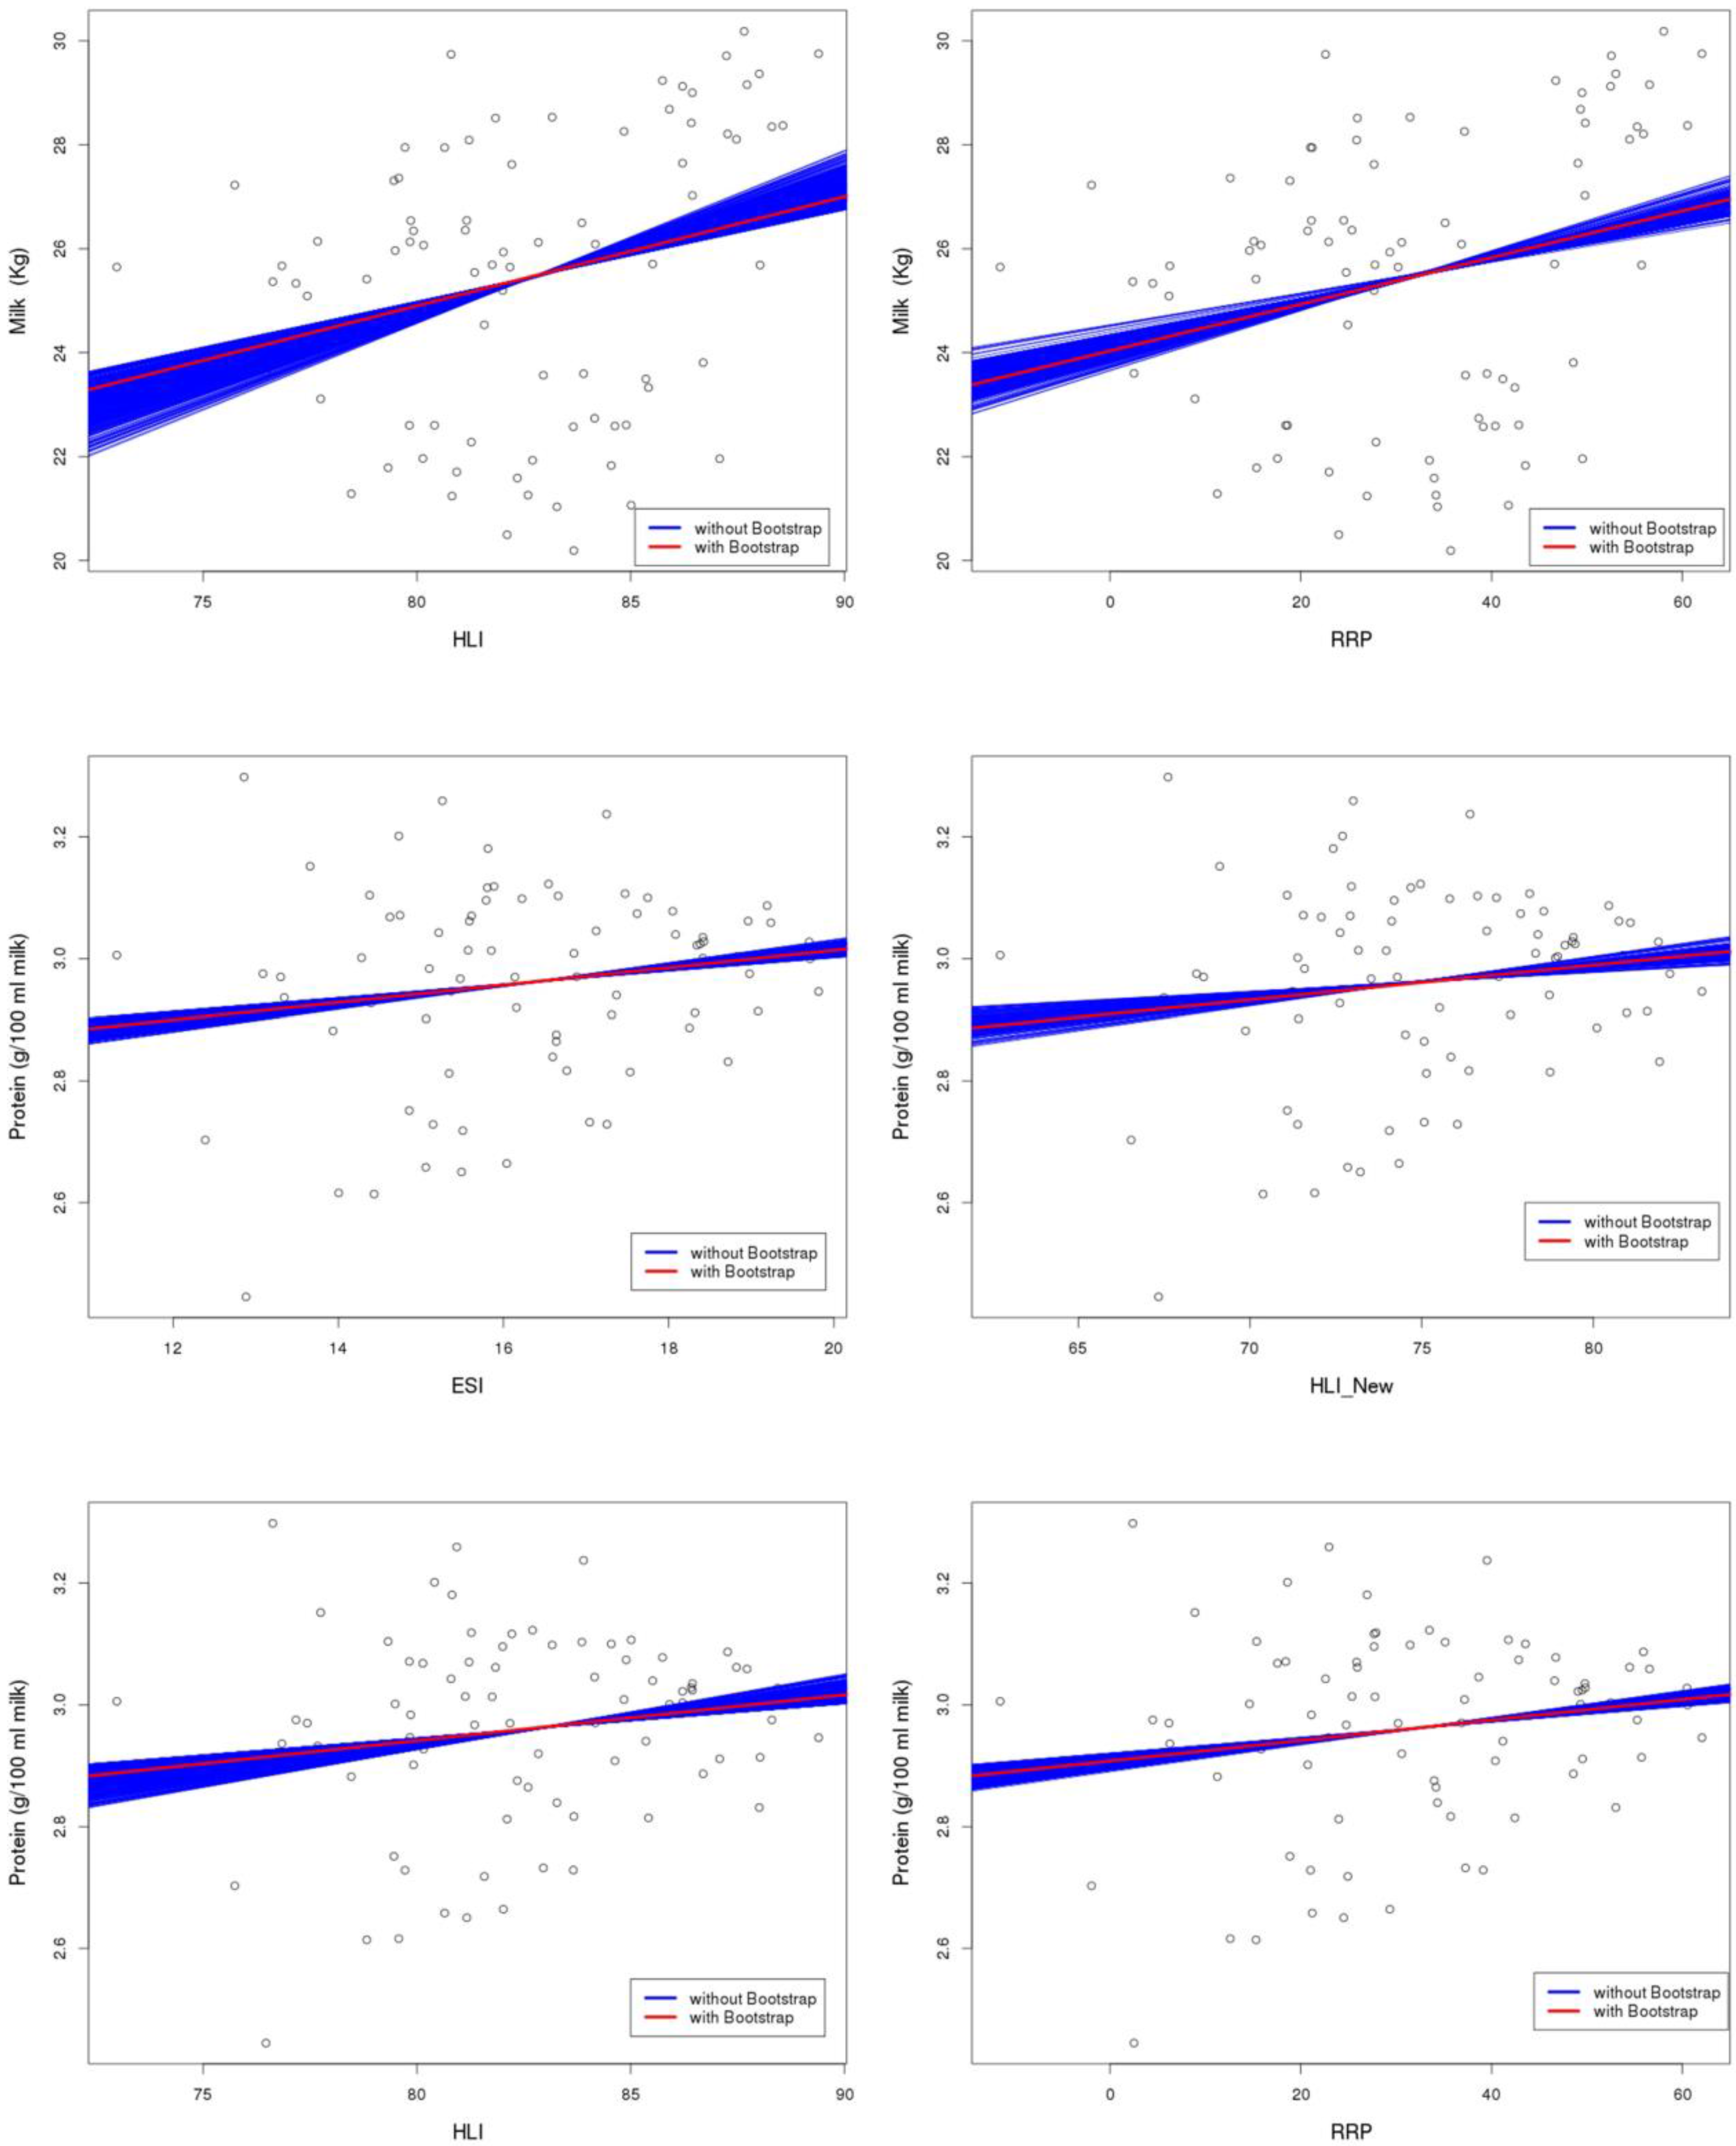
2.4. Linear Regression Analysis between Climatic Indices and Milk Compounds with Bootstrapping

The linear relationships between the indices (ESI, HLI, HLI New, and RRP) and the milk compounds (milk yield, protein, and fat) were estimated via linear regression analysis with bootstrapping. The structure of the data used in this analysis is shown in Figure 2.
The inherent uncertainty was assessed by the second bootstrapping analysis. The nonparametric approach resampled among the time series from 2002 to 2010 for each month within a season and the climatic zones using the climate indices as the predictors and the milk compounds as the predictands. To account for the seasonal dependencies of the climatic input parameters and the physiological responses of cows, we analyzed two separate seasons (spring and summer) using three individual monthly averages within each season.
The linear regression analysis was performed in spring and summer during the time period from 2002 to 2010. The correlation coefficient was used as a diagnostic for each regression analysis based on N = 1000 bootstrap samples. In the resulting matrices, the respective correlation coefficients were averaged from the correlations across all climatic zones within each bootstrap sample with a sample size of 1000. Each of the N = 1000 bootstrap samples provided a linear Pearson correlation estimate coefficient across the nine years (2002 to 2010), the three individual months of each season, and the three climatic zones. For each correlation coefficient, the p-value for the Null hypothesis that the ensemble correlation was zero was calculated using Student’s t-test implemented in the R function rcorr-test [33]. The interquartile range of the bootstrap sample of the correlation coefficients and the averaged bootstrap p-values were used to estimate the confidence intervals and the significance of the Null hypothesis of the underlying regression analysis.

3. Results and Discussion

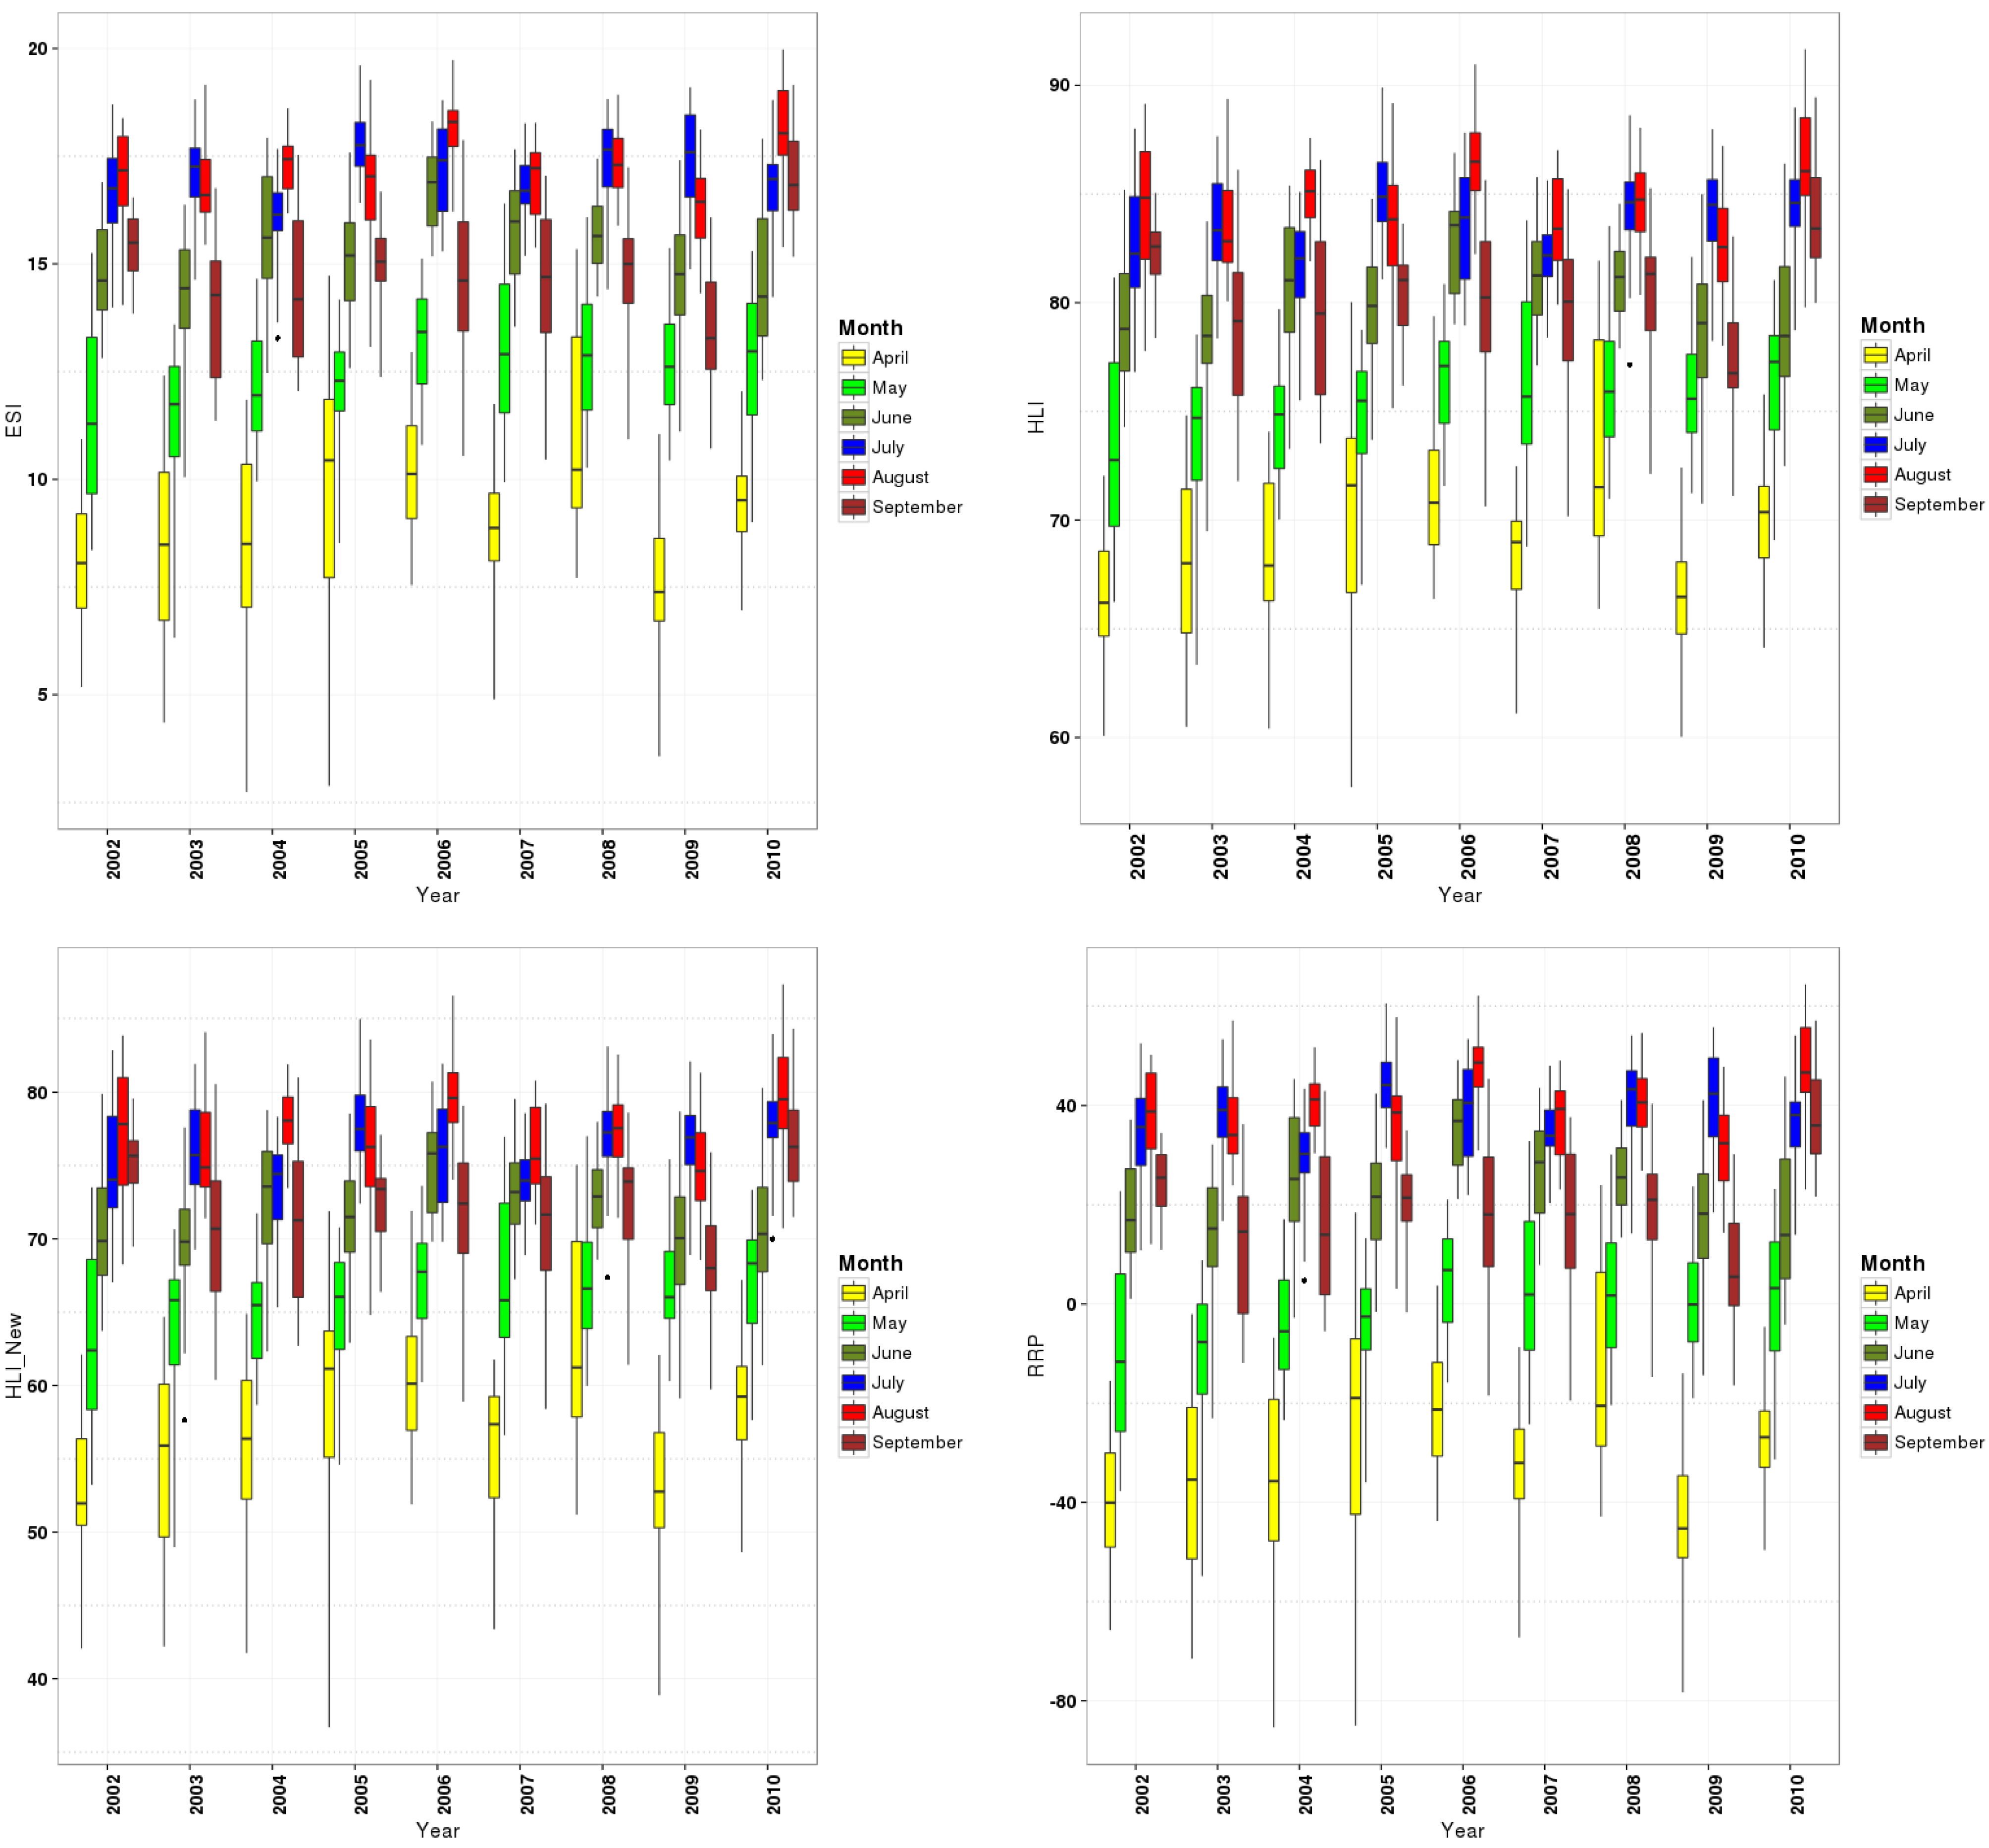
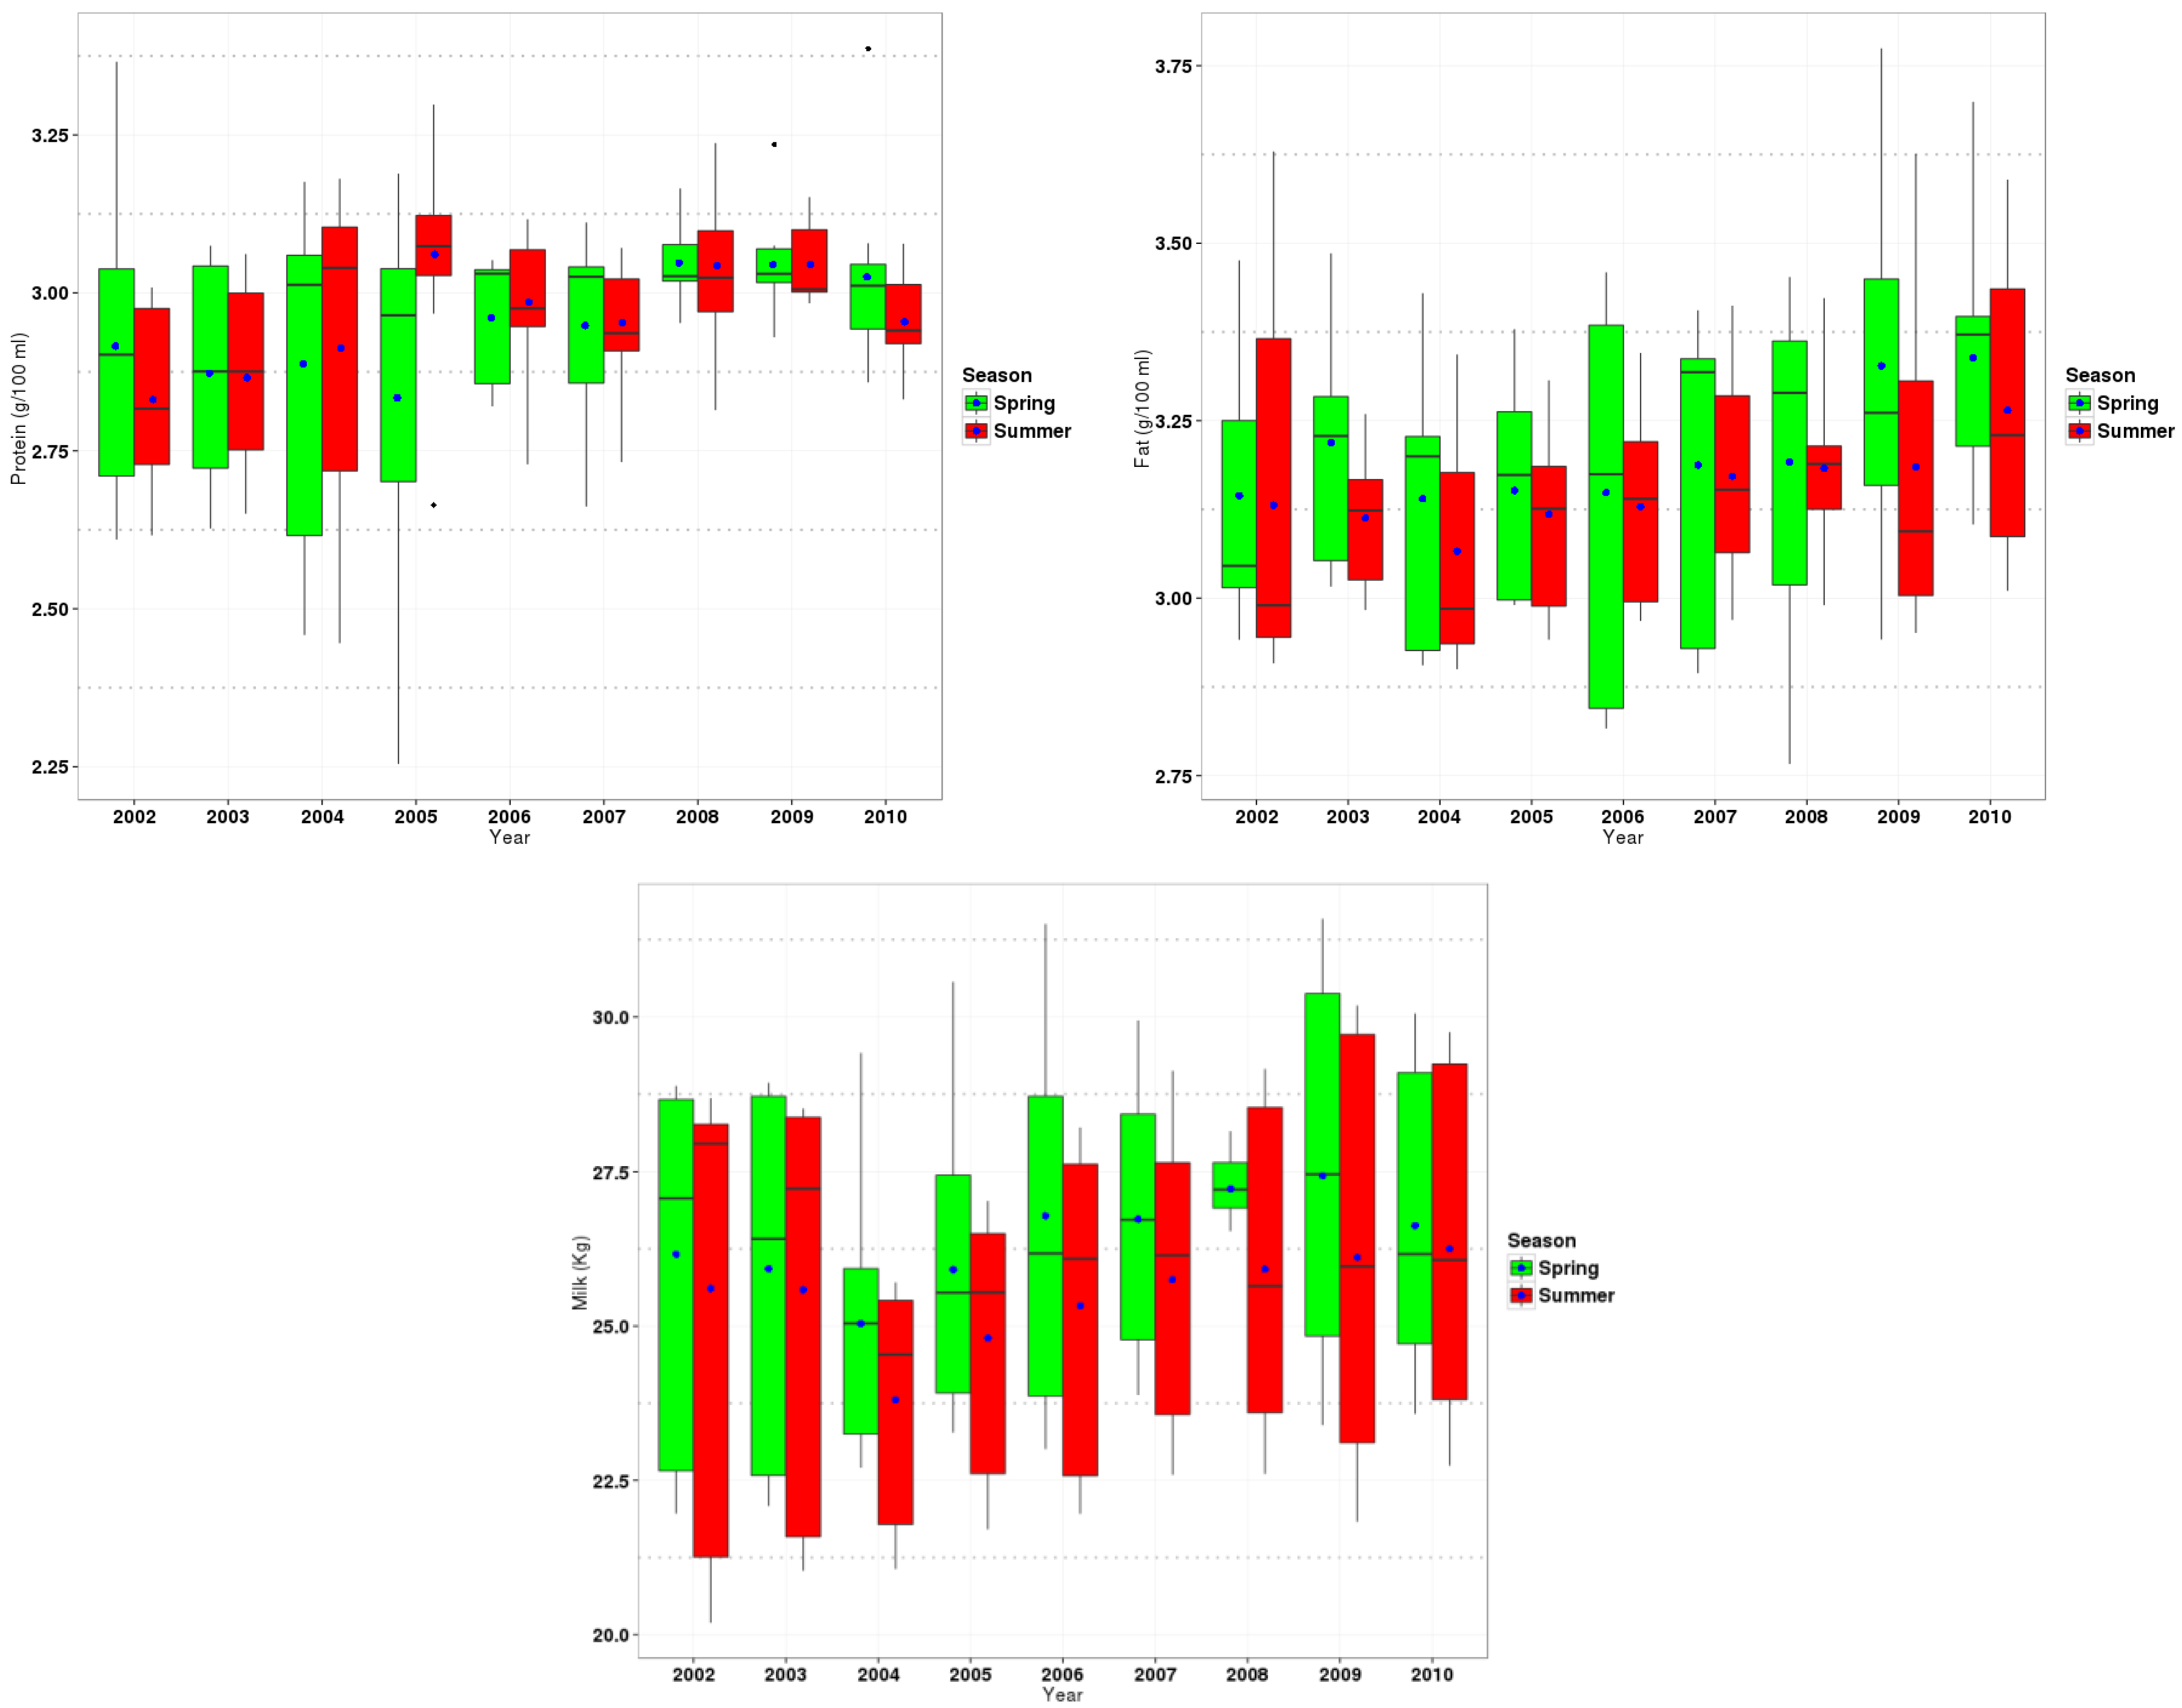
3.1. Climatic Index and Milk Parameter Statistics

The averages of the milk parameters based on the yields of milk (TD), fat, and protein (g/100 mL of milk) of Holstein cows during spring and summer from 2002 to 2010 are presented in Table 2. On average, the seasonal mean milk yield decreased by 1 to 2 kg per day from spring into summer over the years 2002 to 2010. This decrease might be the effect of climate variability or the interaction of climate variability and the physiology of the cow and lactation. This seasonal effect was not obvious for the other two variables (fat and protein concentration).
Neither Knapp and Grummer [40] nor Roman-Ponce et al. [41] found any significant relationship between fat reduction and heat stress.
A decreasing milk yield was reported by Rodriquez et al. [42] and Bouraoui et al. [43], who also investigated the reduction in the fat, protein, and milk yield from spring to summer.
Table 2. Seasonal averages of fat, protein, and milk yield (Kg) of Holstein cows in spring and summer from 2002 to 2010.
Fat (g/100 mL)Protein (gr/100 mL)Milk Yield (kg)
SpringSummerSpringSummerSpringSummer
20023.143.132.922.8326.1625.61
20033.223.112.872.8725.9325.59
20043.143.072.892.9125.0423.8
20053.153.122.833.0625.9224.8
20063.153.132.962.9826.7825.33
20073.193.172.952.9526.7325.75
20083.193.183.053.0427.2325.98
20093.333.183.053.0527.4426.1
20103.343.273.032.9526.6426.26
No critical ESI value could be found from the literature to serve as the starting point of stress for the cows. The critical values of heat stress could vary under different climate conditions. Therefore, we reported this value in Table 3 and did not consider it in our analysis.
The average value of all indices increased from spring to summer. The monthly average values for the ESI, HLI, HLINew, and RRP indices changed from 13.32, 76.87, 67.62, and 5.85 in the spring to 16.33, 82.68, 75.07, and 31.88 in the summer, respectively.
Table 3. ESI, HLI, HLI New, and RRP and the number of days that the cows were under stress (NDS) in the spring and summer from 2002 to 2010.
SpringSummer
ESIHLIHLI NewRRPESIHLIHLI NewRRP
Minimum8.4468.0756.01–36.1913.4077.1868.176.64
Median13.8678.2269.4610.8216.8383.5075.9436.2
Average13.3276.8767.625.8516.3382.6875.0731.88
Maximum17.6084.4377.0342.3718.0786.3079.6347.1
NDS----113110---2471020
Figure 3. Lines inside the plot boxes indicate the median and the points show the season averages of the milk compounds milk yield (Kg), fat (g/100 mL milk), and protein (g/100 mL milk) in fresh products in the spring and summer from 2002 to 2010.
Climate 03 00876 g003
The monthly averages of the daily, minimum, maximum, and median of the climate indices (ESI, HLI, HLI New, and RRP) in the spring and summer from 2002 to 2010 are shown in Table 3. Additional information on the average number of days of stress (NDS) for the cows is also provided in Table 3. The critical values of HLI and HLI New were assumed to be 77 for the starting point, indicating that the cows were probably subjected to heat stress. When the indices rose above 86, the cows were under extreme heat stress. The starting point of heat stress for RRP was assumed to be 110; when the value exceeded 133, the cows were in an emergency situation [44].
Figure 3 and Figure 4 present a statistical overview of the milk yield and fat and protein content and the climate variability. The summarized statistics are separately shown in box plots for the short term data (2002–2010) in the summer (July, August, and September) and spring (April, May, and June) in the study area.
Figure 4. The box plots of ESI, HLI, HLI New, and RRP from 2002 to 2010 in the spring and summer.
Climate 03 00876 g004
The box plots in Figure 3 represent the variability in milk compounds across all stations and years. There was hardly any visible seasonal signal in the data from the three milk compounds, which justified the use of only two seasons (spring (green boxes) and summer (red boxes)). The variability in the protein concentrations indicated by the width of the boxes changed from 2002 to the spring of 2005 to the summer of 2005 to 2010 without any clear changes in the median or mean. This lack of change is due to the shortage of available protein data from summer 2005.
Figure 4 shows the annual cycle of the climate indices across all stations and their short term changes from 2002 to 2010. A very prominent annual cycle can be observed for all climate indices, with a stronger change during the spring months compared with summer. This special configuration also justifies the selection of the two seasons.

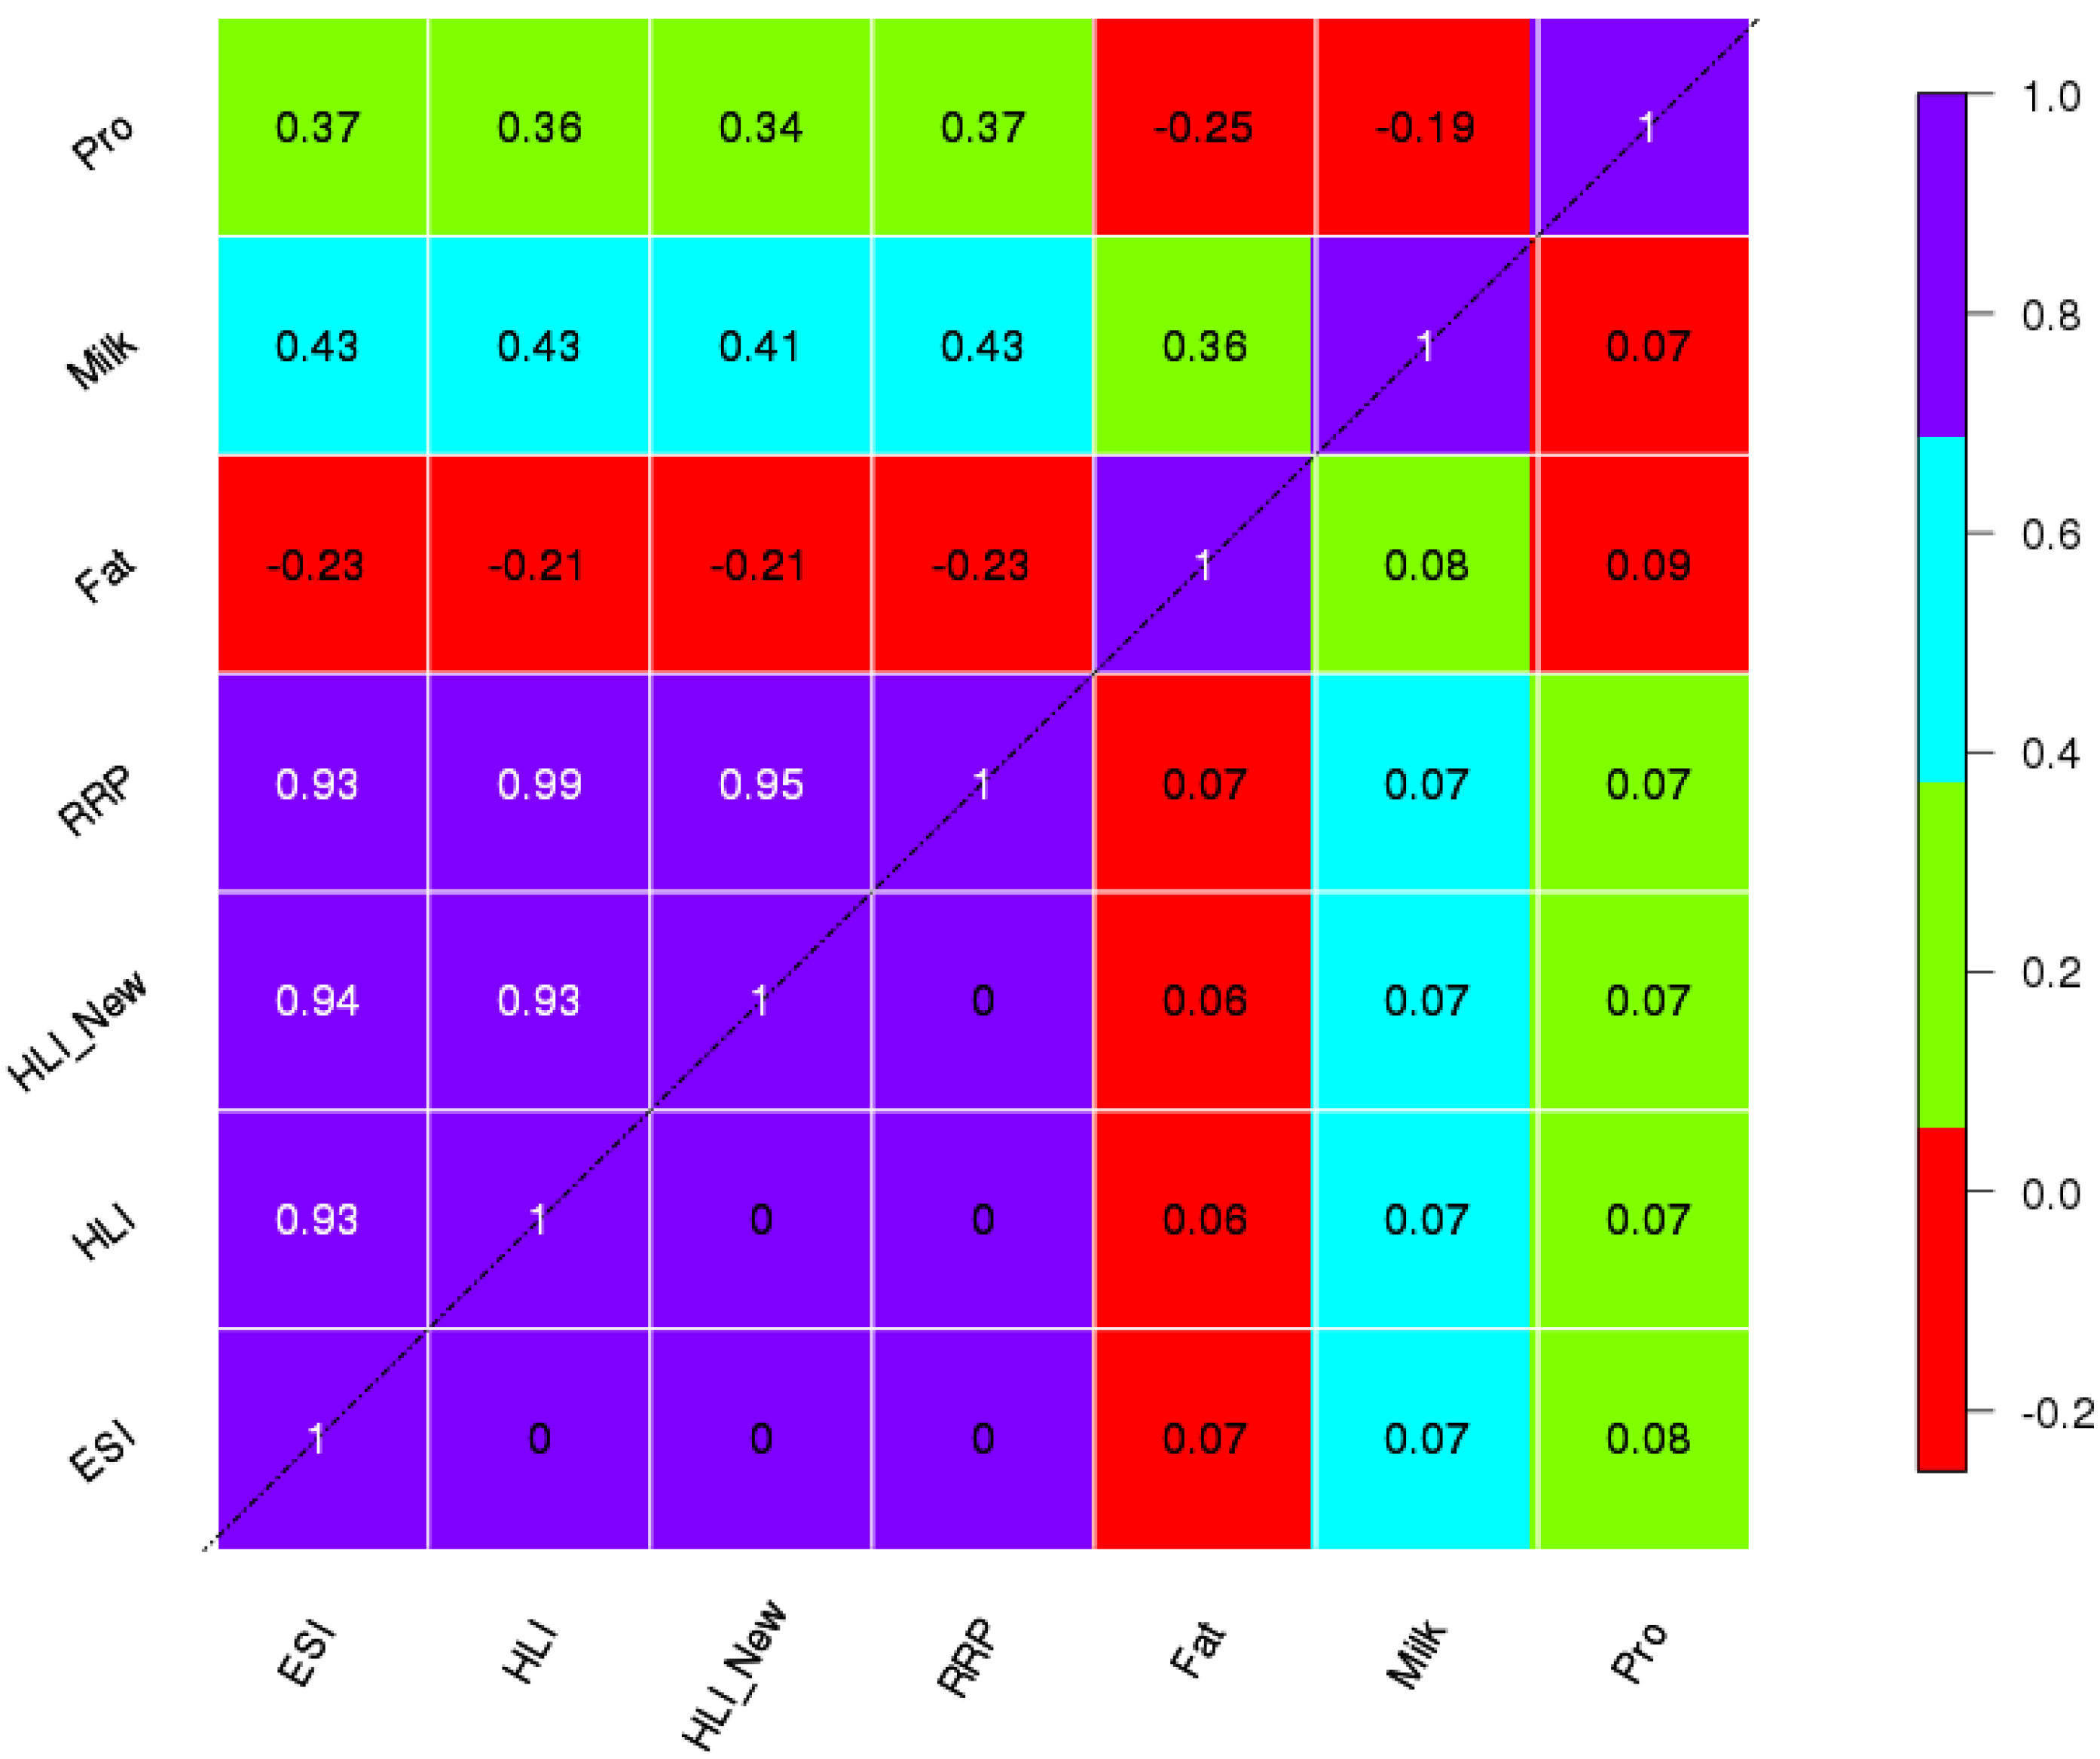
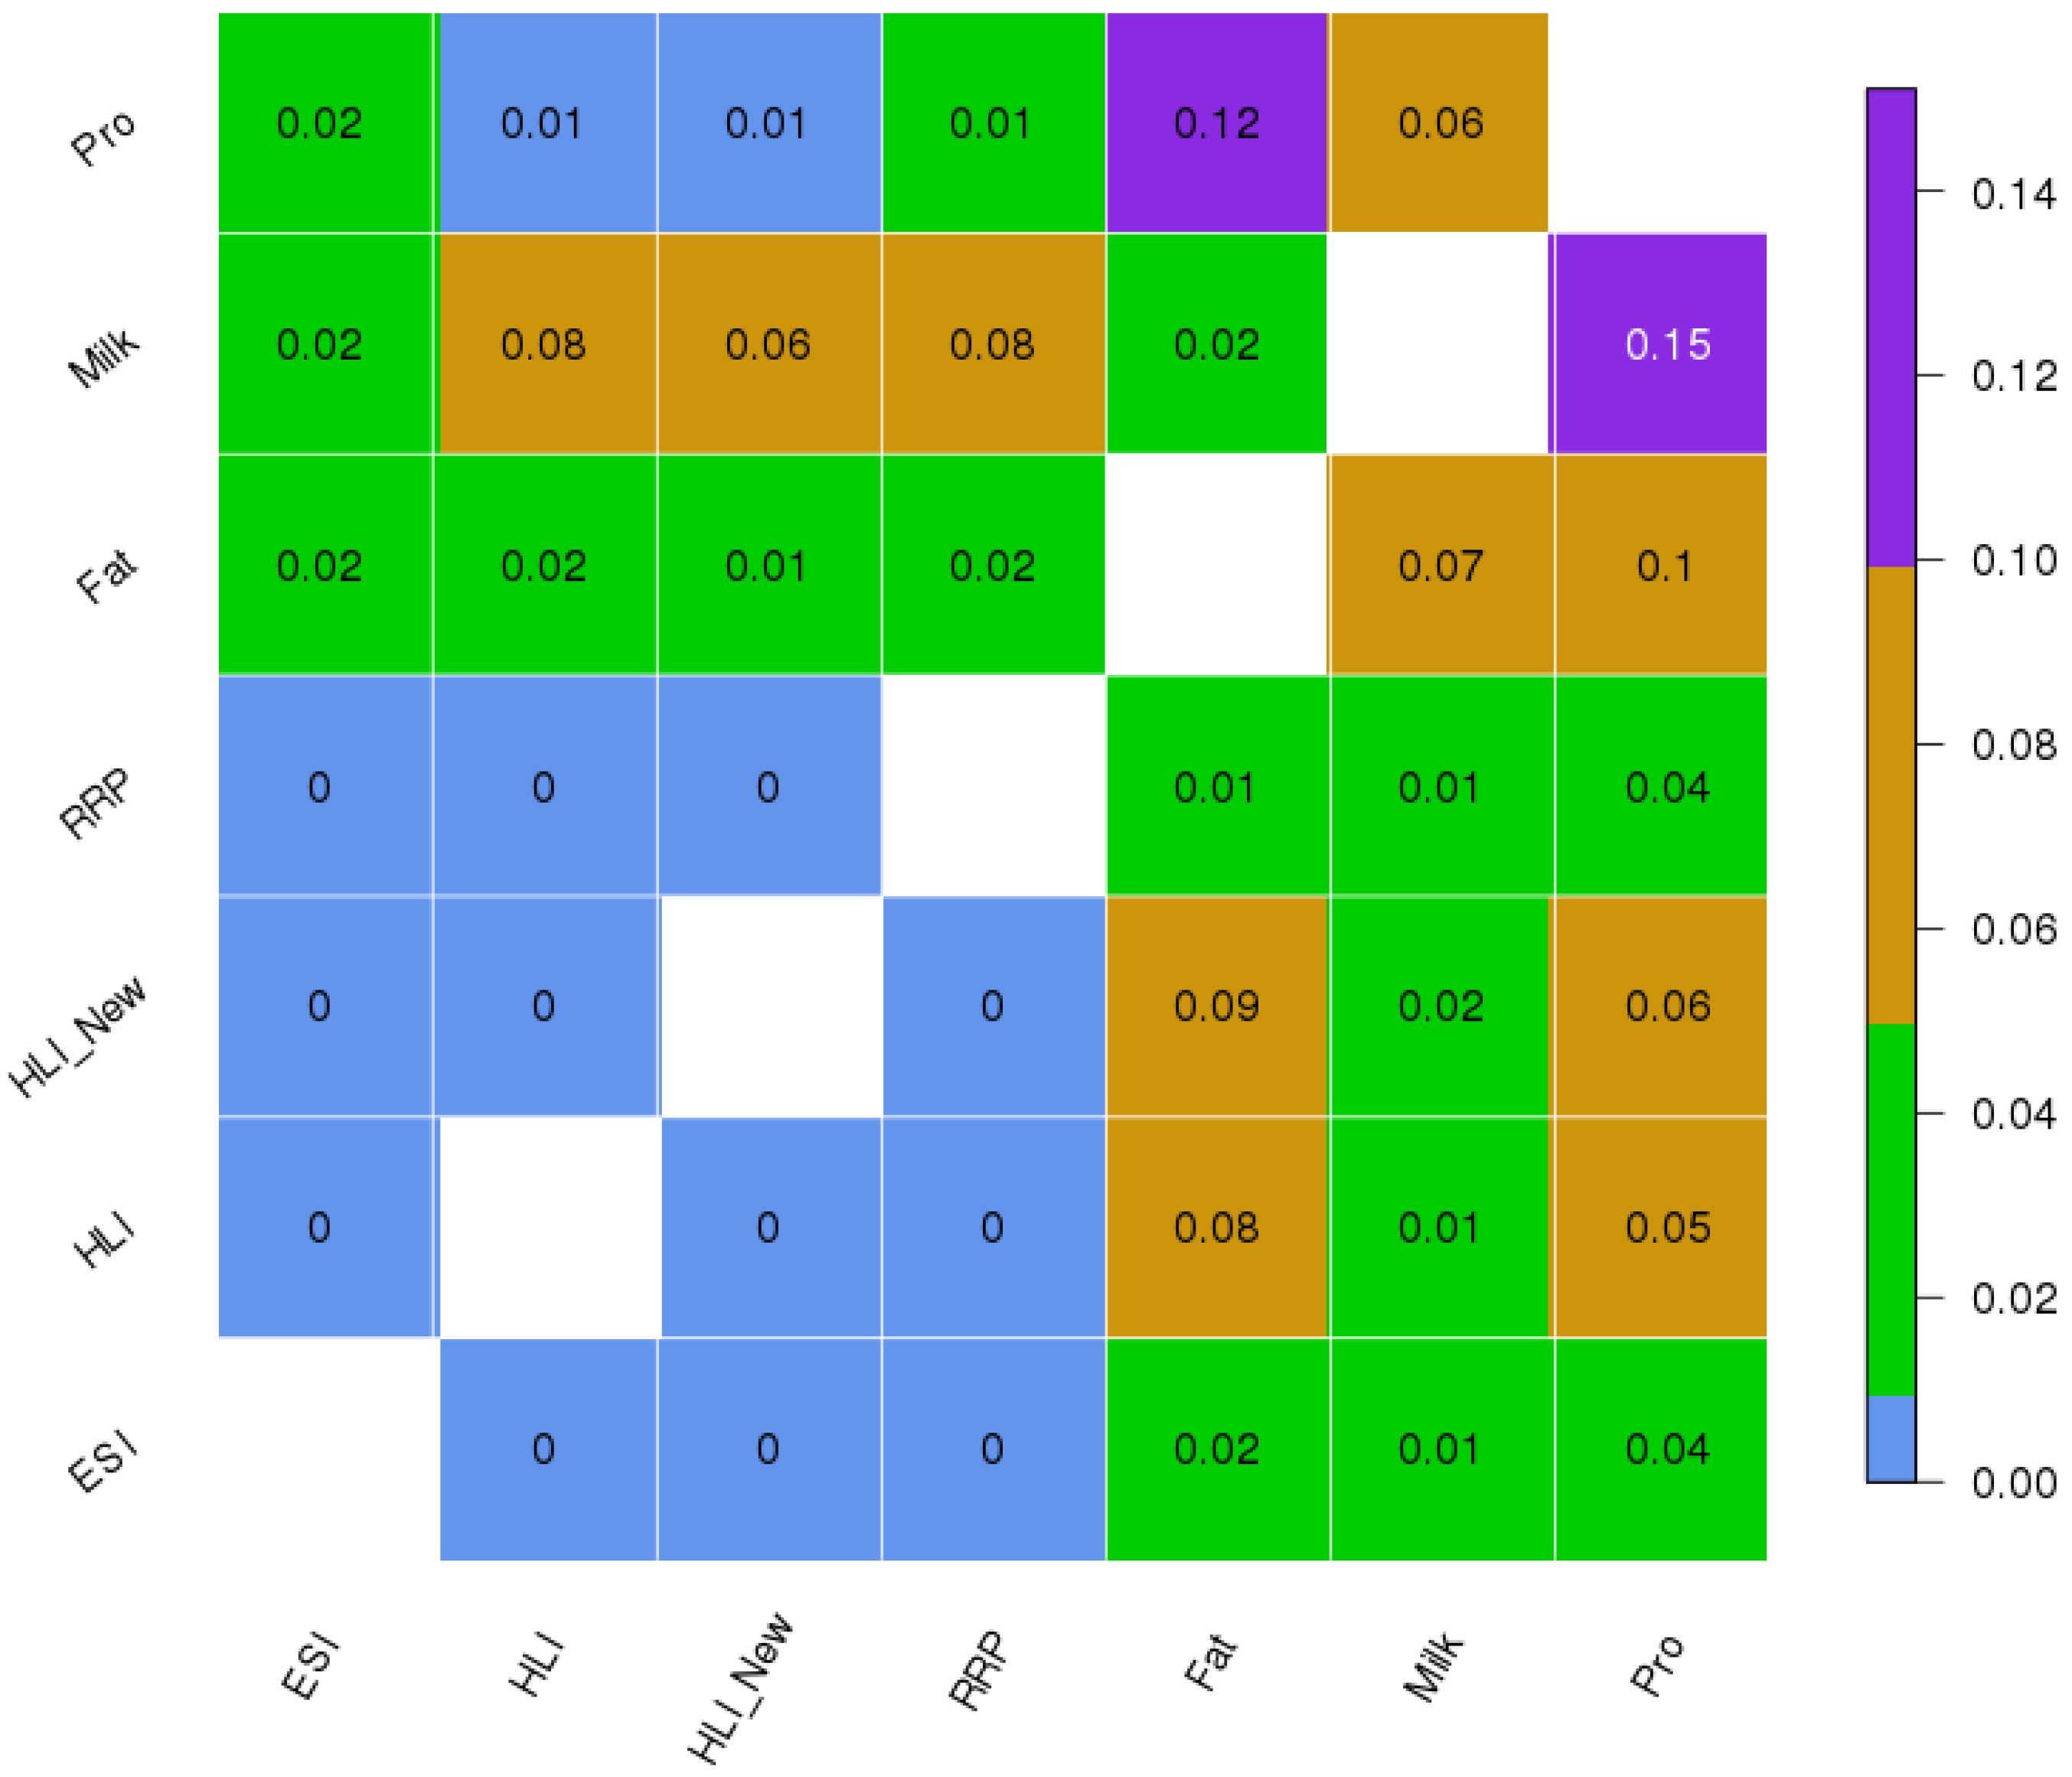
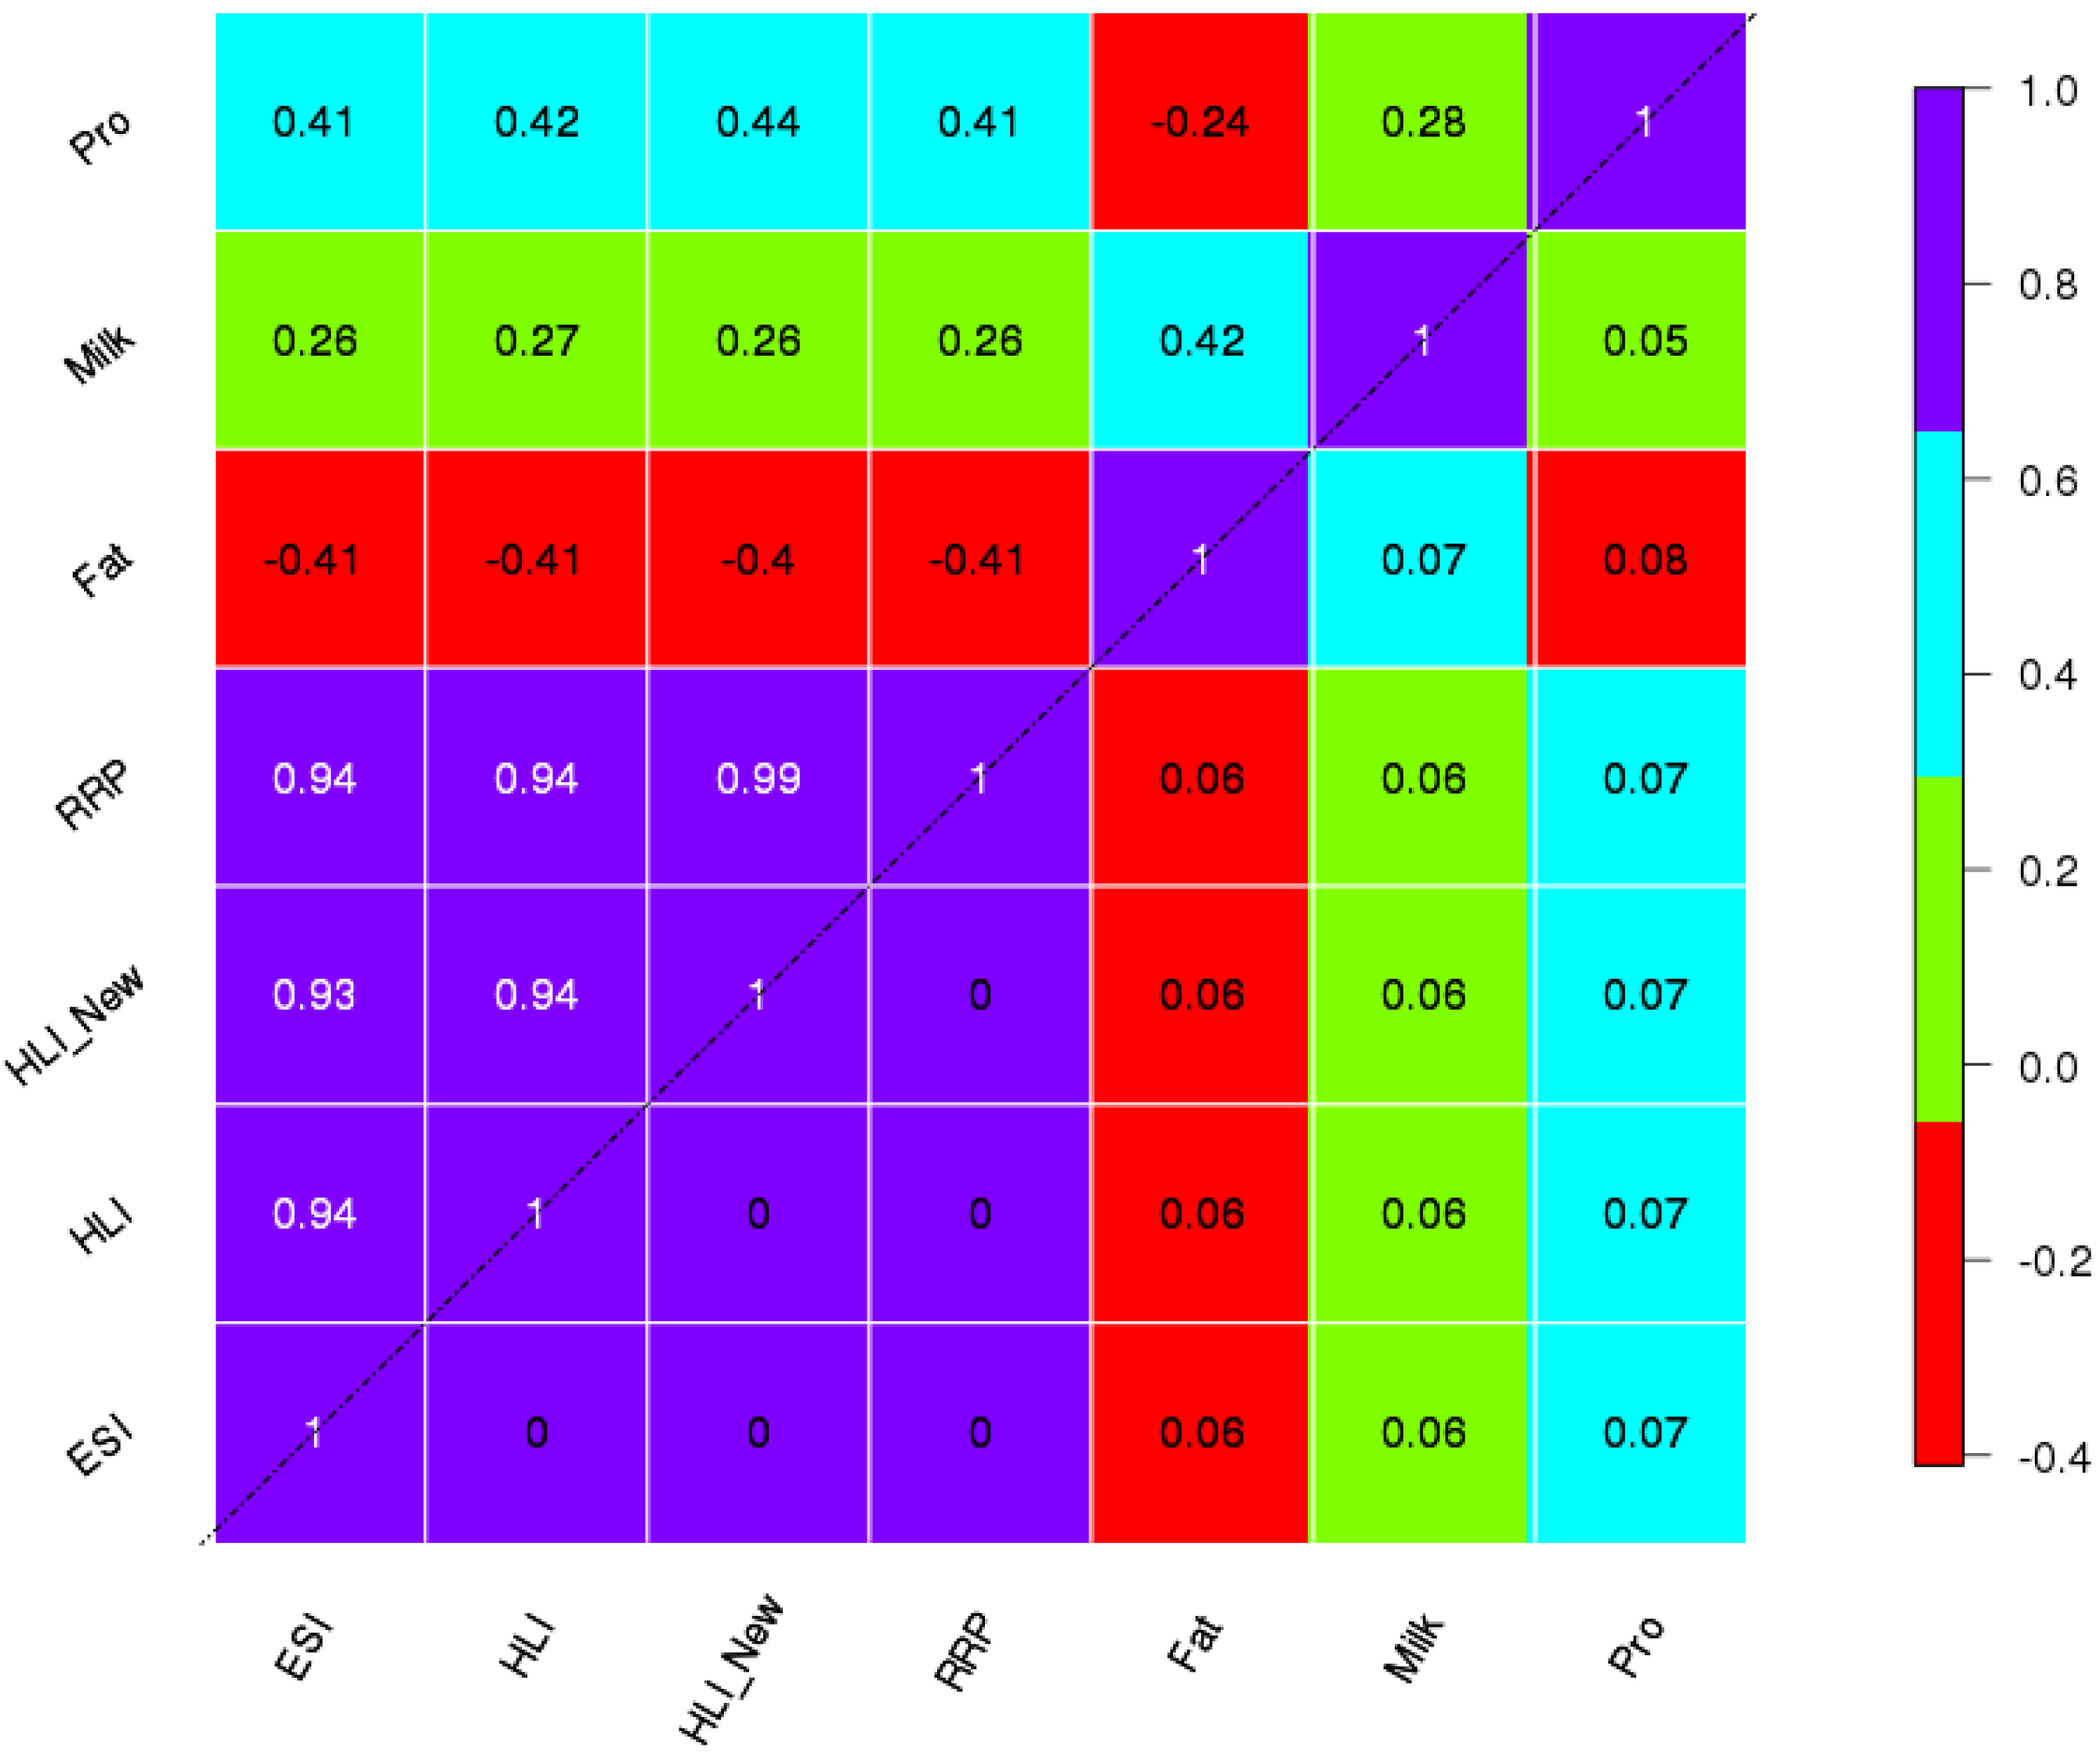
3.2. Correlation between the Climatic Indices and Milk Parameters

Next, we investigated the relationship between the milk parameters and climate indices. Figure 5 and Figure 6 present the correlation analysis between ESI, HLI, HLI New, and RRP and the milk yield, fat, and protein in the spring and summer, respectively. The data were normalized to a mean of zero and standard deviation of one. For the correlation analysis, anomalies in the data were included and the bootstrapping technique was applied. The corrgram technique was used to visualize exploratory displays of the correlation matrix [45]. The values above the diagonal in the matrices are the respective correlation coefficients as averages of the correlations across all stations during the time period 2002–2010 within each bootstrap sample. As shown in Figure 2, bootstrapping with a random sample size of 1000 with replacement was applied to the total sample size of 81 (9 × 3 × 3) formed by all nine years in all three climatic zones in the spring (April, May, and June) and summer (July, August, and September). The values below the diagonal are the estimated confidence intervals from the inter-quartile ranges of the correlation coefficients across all bootstrapped samples. These values can be read as ± Δρ.
Figure 5 and Figure 6 represent the correlation values between all variables in the spring and summer, respectively. The p-values for the correlation coefficients are presented in Figure 7, in which the upper diagonal shows the spring values and the lower diagonal presents the summer p-values.
In spring, the correlation results shown in the upper triangle in Figure 5 presented a positive correlation between all climate indices (ESI, HLI, HLI New, and RRP) with the protein (almost 0.4, p-value < 0.05) and milk yield by a value of almost 0.3 (p-value ESI < 0.05 and p-value HLI, HLI-New, RRP < 0.1). Conversely, fat showed a negative correlation (−0.4, p-value < 0.05) with all climate indices.
Figure 5 also presented a positive correlation between the milk yield with fat (0.42, p-value < 0.05) and protein (0.28, p-value < 0.1) in the spring. This result suggested that the fat and protein concentrations increased with the increasing milk yield. Hammami et al. also presented a positive correlation between the milk yield with protein and fat [46]. Conversely, the negative correlation between fat and protein (−0.24, p-value < 0.1) was not significant.
As explained above, during spring, the fat and protein concentrations exhibited reasonably strong correlations (with typical correlation coefficients of 0.4 ± 0.07 and p-values < 0.05) with all climate indices. It should be kept in mind that these components themselves were strongly correlated with each other, which explained the variance of approximately 16% to 19% of the data. In contrast, the whole milk yield had a weak dependency (0.26 ± 0.06, p-values between 0.02 and 0.08) with the climate indices.
Figure 5. Correlation with bootstrapping between milk compounds and climatic indices in the spring (values under the diagonal are the estimated confidence intervals from the inter-quartile range).
Climate 03 00876 g005
Figure 6. Correlation with bootstrapping between milk compounds and climatic indices in the summer (values under the diagonal are estimated confidence intervals from the inter-quartile range).
Climate 03 00876 g006
Figure 7. P-values of the correlations between milk compounds and climate indices. The upper diagonal indicates spring and the lower diagonal shows the summer p-values.
Climate 03 00876 g007
The correlation results for the summer shown in the upper triangle in Figure 6 also showed a positive correlation between milk yield and fat (0.36, p-value < 0.1). In contrast, a negative correlation existed between protein and fat (–0.25, p-value = 0.1). In contrast to spring, in summer the milk yield did not show a significant correlation with protein (p-value < 0.1). The squared value of the maximal positive correlation (milk yield vs. fat with a correlation 0.36) allowed for the quantification of the linear dependency between the predictand (or independent variable) and the predictor (or dependent variable) and explained 13% of the total variability vs. a remaining scatter with 87% of the total variability.
In summer, Figure 6 presented a positive correlation between all climate indices (ESI, HLI, HLI New, and RRP) with the milk yield (almost 0.4, p-value < 0.05) and protein (almost 0.4, p-value ESI, RRP < 0.05 and p-value HLI, HLI-New < 0.1). In contrast, fat showed a negative correlation (−0.2, p-value ESI, RRP < 0.05 and p-value HLI, HLI-New < 0.1) with all climate indices. Fat presented less of a negative correlation with the climate indices in the summer than in the spring.
In summer, warm conditions dominate more of the climate parameters, bioclimatic indices, and cattle physiological conditions. Evidently, the dependency of the structure between milk variables and the climate indices changes between spring and summer, once again supporting the initial decision to split the data set into two seasons.
The milk yield showed the largest dependency with the climate indices (p-value < 0.05) compared with the spring season, whereas fat and protein showed less of a correlation compared to spring.
For both seasons, all climate indices (ESI, HLI, HLI New, and RRP) showed a very high positive correlation with one another (p-value < 0.001). In contrast with the small dependency between the milk components, we observed a very high dependency between the climatic variables. Additionally, interesting relationships were present between the milk compounds and the climate indices.
Figure 8. The best-fitted regression lines before (red line) and after 1000 bootstraps (blue lines) between milk components (fat, protein, and milk) and ESI in the summer.
Climate 03 00876 g008
According to the study by Marami et al. [5], THI showed less of a correlation with the milk yield and protein compared with the current indices used in this study but exhibited a slightly increased correlation (about +0.09) with fat in the spring and summer.
Figure 8 presents additional explanations regarding the regression analysis before and after bootstrapping (for more figures, please see the Appendix). For example, the milk components were considered predictands and ESI the predictor in the summer. In these samples, the slope of the best-fitting straight line between the variables presented a positive or negative correlation in the summer. The red line was the regression line without bootstrapping and consisted of the predicted score on y for each possible value of x . The blue lines showed the range of changes in the intercept and slope in the resampling data during the 1000 bootstraps. As shown in Figure 6, the values of the positive correlation between protein-ESI (0.37) and milk yield-ESI (0.43) arose from the positive slopes of the regression lines between these variables in Figure 8. These data accounted for approximately 14% and 18% of the linear dependency vs. 86% and 82% for the unexplained scatter. For the fat content vs. ESI, the regression line changed to a negative correlation (−0.23) and explained only 5% of the total variability vs. the remaining scatter, which explained 95% of the total variability.

4. Conclusions

This study investigates the most influential climate parameter or bioclimatic index on cow milk as a strategic product and presents a relationship between physiologically relevant climate indices for cattle (ESI, HLI, and RRP) and milk compound (milk yield, fat, protein) observations. We also compare the effects of these relatively new heat stress indices on dairy cows under different climate conditions.
The analysis was performed with the statistical bootstrapping method to compare the influence of dairy variables over a time series on climate variables over a time series while considering unavoidable uncertainty. The application of the bootstrapping method has advantages in these studies and can serve as a good tool to validate the predictive model for studies in developing countries with short term data sets.
Generally, the linear regression analysis exhibited a positive correlation between the milk yield, protein, and climate indices during the spring and summer but a negative correlation between fat and the climate indices. Protein seems to be less sensitive than fat to the negative effects of heat stress and climate variability. The results in this study agree with the results reported by other studies, such as [47,48,49,50,51,52,53].
Under the heat stress condition, there is a possibility for cows to choose to stay in the barn or to graze on the pasture in the pasturing system. It might be better to keep the cows indoors because shade plays an important role in management techniques to reduce the negative effect of heat stress [54].
Climate variability plays a reasonable role in cow physiological adaptation, fodder and nutrition, husbandry systems, DNA accuracy, and changes in their characteristics [44]. Based on characteristic changes and the cow’s ability to adapt under different conditions, the effect of climate variability on animal products (i.e., the critical point of heat stress) is also changed. Thus, cows may increase their tolerance to climate variability.
We strongly believe that new and significant indices are needed to control critical heat stress conditions that consider more predictors of the effect of climate variability on animal products, such as sunshine duration, the quality of the cow’s diet, the number of days of stress (NDS), the color of skin with attention to large black spots, and categorical predictors such as breed, welfare facility, and management system.
We concluded that care must be taken in choosing the climate indices in different climate conditions to assess the relationship between milk components and climate variability. For instance, Holstein cows bred in tropical and subtropical conditions have differences in their hair coat characteristics compared with those bred in temperate regions [6,55].
Based on our results of this investigation into the effect of heat stress on milk compounds (milk yield, fat, and protein), we suggest the use of ESI and RRP in the summer and ESI in the spring. HLINew is also suggested for fat and protein content in the spring. Silva et al. suggested HLI for tropical regions, and Moran and Epstein evaluated ESI for hot/dry and hot/wet climates [6,35].
To improve the correlations and achieve the best linear relationship, a study of the mixed effect of climate indices is strongly suggested.

Acknowledgments

The authors warmly thank Nasim Azari at the Food Science Engineering Department of the Science and Research branch of Tehran Islamic Azad University, Ahmad Moghimi Esfand Abadi and Asghar Salimi Niknam at the Animal Breeding Centre of Iran in Karaj, branch of the Iranian Ministry of Agriculture, and Behnam Saremi and Ali Asadi for supporting the milk data. We are also grateful to Ali Mortazavi in the Department of Food Science, Ferdowsi Mashhad University for his cooperation.

Author Contributions

Andreas Hense and Angelika Ploeger supervised the methodology of the study and the statistical methods used. Elham Rahmani contributed data and tools for the analysis. Mohammad Reza Marami Milani performed the statistical analysis, interpreted the results, and wrote the initial manuscript. All authors contributed by reading and editing the final manuscript.

Conflicts of Interest

The authors declare no conflict of interest.

Appendix

Figure A1. The best-fitted regression line before (red line) and after bootstrapping (N = 1000) (blue lines) between indices (ESI, HLI, HLINew, and RRP) and milk components (fat, protein and milk yield) in the spring.
Climate 03 00876 g009aClimate 03 00876 g009b
Figure A2. The best-fitted regression line before (red line) and after bootstrapping (N = 1000) (blue lines) between indices (ESI, HLI, HLINew, and RRP) and milk components (fat, protein and milk yield) in the summer.
Climate 03 00876 g010aClimate 03 00876 g010b

References

  1. Watson, R.T.; Albritton, D.L.; Barker, T.; Bashmakov, I.A.; Canziani, O.; Christ, R.; Cubasch, U.; Davidson, O.; Gitay, H.; Griggs, D.; et al. Climate Chance 2001: IPCC Synthesis Report. Avalable oneline: http://ipcc.ch/meetings/session18/doc3b.pdf (accessed on 5 March 2015).
  2. Renaudeau, D.; Collin, A.; Yahav, S.; De Basilio, V.; Gourdine, J.L.; Collier, R.J. Adaptation to hot climate and strategies to alleviate heat stress in livestock production. Animal 2012, 6, 707–728. [Google Scholar] [CrossRef] [PubMed]
  3. Lambertz, C.; Sanker, C.; Gauly, M. Climatic effects on milk production traits and somatic cell score in lactating Holstein-Friesian cows in different housing systems. J. Dairy Sci. 2014, 97, 319–329. [Google Scholar] [CrossRef] [PubMed]
  4. Sharma, A.K.; Rodriguez, L.A.; Mekonnen, G.; Wilcox, C.J.; Bachman, K.C.; Collier, R.J. Climatological and genetic effects on milk composition and yield. J. Dairy Sci. 1983, 66, 119–126. [Google Scholar] [CrossRef]
  5. Marami Milani, M.R.; Hense, A.; Rahmani, E.; Ploeger, A. A pilot investigation of the relationship between climate variability and milk compounds under the bootstrap technique. Foods 2015, 4, 420–439. [Google Scholar] [CrossRef]
  6. Silva, R.G.; Morais, D.A.; Guilhermino, M.M. Evaluation of thermal stress indexes for dairy cows in tropical regions. R. Bras. Zootec. 2007, 36, 1192–1198. [Google Scholar] [CrossRef]
  7. Eigenberg, R.A.; Hahn, G.L.; Nienaber, J.A.; Brown-Brandl, T.M. Development of a new respiration rate monitor for cattle. Trans. ASAE 2000, 43, 723–728. [Google Scholar] [CrossRef]
  8. Hahn, G.L.; Mader, T.L. Heat waves in relation to thermoregulation, feeding behavior and mortality of feedlot cattle. In Proceedings of the 5th International Livestock Environment Symposium, Bloomington, MN, USA, 29–31 May 1997; pp. 545–549.
  9. Ingram, D.L.; Mount, L.E. Heat exchange between animal and environment. In Man and Animals in Hot Environments; Springer: New York, NY, USA, 1975; pp. 5–23. [Google Scholar]
  10. Mader, T.L.; Dahlquist, J.M.; Hahn, G.L.; Gaughan, J.B. Shade and wind barrier effects on summertime feedlot cattle performance. J. Anim. Sci. 1999, 77, 2065–2072. [Google Scholar] [PubMed]
  11. McLean, J.A. Loss of heat by evaporation. In Heat Loss from Animals and Man: Assessment and Control; Monteith, J.L., Mount, L.E., Eds.; Butterworth-Heinemann: London, UK, 1974; pp. 19–31. [Google Scholar]
  12. Spain, J.N.; Spiers, D.E. Effects of supplemental shade on thermoregulatory response of calves to heat challenge in a hutch environment. J. Dairy Sci. 1996, 79, 639–646. [Google Scholar] [CrossRef]
  13. Mader, T.L.; Davis, M.S. Wind speed and solar radiation corrections for the temperature-humidity index. In Proceedings of the 15th Conference on Biometeorology and Aerobiology Joint with 16th International Congress on Biometeorology, Kansas City, MO, USA, 27 October 2002; pp. 10–28.
  14. Moran, D.S.; Pandolf, K.B.; Shapiro, Y.; Heled, Y.; Shani, Y.; Matthew, W.T.; Gonzales, R.R. An environmental stress index (ESI) as a substitute for the wet bulb globe temperature (WBGT). J. Therm. Biol. 2001, 26, 427–431. [Google Scholar] [CrossRef]
  15. Moran, D.S.; Pandolf, K.B.; Shapiro, Y.; Laor, A.; Heled, Y.; Gonzalez, R.R. Evaluation of the environmental stress index for physiological variables. J. Therm. Biol. 2003, 28, 43–49. [Google Scholar] [CrossRef]
  16. Gaughan, J.G.; Goopy, L.; Spark, J. Excessive Heat Load Index for Feedlot Cattle; Meat and Livestock Australia: Sydney, NSW, Australia, 2002. [Google Scholar]
  17. Eigenberg, R.A.; Nienaber, J.A.; Brown-Brandl, T.M. Development of a livestock safety monitor for cattle. In Proceedings of the 2003 American Society of Agricultural and Biological Engineers (ASABE) Annual Meeting, St. Joseph, MI, USA, 27–30 July 2003.
  18. Gaughan, J.G.; Mader, T.L.; Holt, S.M.; Lisle, A. A new heat load index for feedlot cattle. J. Anim. Sci. 2008, 86, 226–234. [Google Scholar] [CrossRef] [PubMed]
  19. Rienecker, M.M.; Suarez, M.J.; Gelaro, R.; Todling, R.; Bacmeister, J.; Liu, E.; Bosilovich, M.G.; Schubert, S.D.; Takacs, L.; Kim, G.K.; et al. MERRA: NASA’s Modern-Era retrospective analysis for research and applications. J. Climate 2011, 24, 3624–3648. [Google Scholar] [CrossRef]
  20. Maak, K.; von Storch, H. Statistical downscaling of monthly mean air temperature to the beginning of flowering of Galanthus nivalis L. in Northern Germany. Int. J. Biometeorol. 1997, 41, 5–12. [Google Scholar] [CrossRef]
  21. Matulla, C.; Scheifinger, H.; Menzel, A.; Koch, E. Exploring two methods for statistical downscaling of Central European phenological time series. Int. J. Biometeorol. 2003, 48, 56–64. [Google Scholar] [CrossRef] [PubMed]
  22. Lahiri, S.N. Bootstrap methods. In Resampling Methods for Dependent Data; Springer: New York, NY, USA, 2003; pp. 17–43. [Google Scholar]
  23. Politis, D.N.; Romano, J.P.; Wolf, M. Subsampling; Springer: New York, NY, USA, 1999. [Google Scholar]
  24. Lunneborg, C.E. Estimating the correlation coefficient: The bootstrap approach. Psychol. Bull. 1985, 98, 209–215. [Google Scholar] [CrossRef]
  25. Rasmussen, J.L. Estimating correlation coefficients: Bootstrap and parametric approaches. Psychol. Bull. 1987, 101, 136–139. [Google Scholar] [CrossRef]
  26. Jhun, M.; Jeong, H.C. Applications of bootstrap methods for categorical data analysis. Comput. Stat. Data Anal. 2000, 35, 83–91. [Google Scholar] [CrossRef]
  27. Rahmani, E. The Effect of Climate Variability on Wheat in Iran. Ph.D. Thesis, University of Bonn, Bonn, Germany, 2015. [Google Scholar]
  28. Rahmani, E.; Friederichs, P.; Keller, J.; Hense, A. Development of an effective and potentially scalable weather generator for temperature and growing degree days. Theor. Appl. Climatol. 2015. [Google Scholar] [CrossRef]
  29. Kousari, M.R.; Ahani, H.; Hendi-Zadeh, R. Temporal and spatial trend detection of maximum air temperature in Iran during 1960–2005. Glob. Planet. Change 2013, 111, 97–110. [Google Scholar] [CrossRef]
  30. Statistical Center of Iran / History. Available online: http://www.amar.org.ir/Default.aspx?tabid=281 (accessed on 05 August 2014).
  31. Lescourret, F.; Coulon, J.B. Modeling the impact of mastitis on milk production by dairy cows. J. Dairy Sci. 1994, 77, 2289–2301. [Google Scholar] [CrossRef]
  32. West, J.W. Effects of heat-stress on production in dairy cattle. J. Dairy Sci. 2003, 86, 2131–2144. [Google Scholar] [CrossRef]
  33. R Development Core Team. R: A Language and Environment for Statistical Computing; R Foundation for Statistical Computing: Vienna, Austria, 2011. [Google Scholar]
  34. Epstein, Y.; Moran, D.S. Thermal comfort and the heat stress indices. Ind. Health 2006, 44, 388–398. [Google Scholar] [CrossRef] [PubMed]
  35. Moran, D.S.; Epstein, Y. Evaluation of the environmental stress index (ESI) for hot/dry and hot/wet climates. Ind. Health 2006, 3, 399–403. [Google Scholar] [CrossRef]
  36. Kraus, H. Die Luftfeuchtigkeit. In Die Atmosphäre der Erde, 3rd ed.; Springer: Berlin, Germany, 2004; pp. 67–89. [Google Scholar]
  37. Efron, B.; Tibshirani, R. Bootstrap methods for standard errors, confidence intervals, and other measures of statistical accuracy. J. Statist. Sci. 1986, 1, 54–75. [Google Scholar] [CrossRef]
  38. Davison, A.C.; Hinkley, D.V. Bootstrap Methods and Their Application; Cambridge University Press: New York, NY, USA, 1997. [Google Scholar]
  39. Press, W.H.; Teukolsky, S.A.; Vetterling, W.T.; Flannery, B.P. Numerical Recipes: The Art of Scientific Computing, 3rd ed.; Cambridge University Press: Cambridge, UK, 2007. [Google Scholar]
  40. Knapp, D.M.; Grummer, R.R. Response of lactating dairy cows to fat supplementation during heat stress. J. Dairy Sci. 1991, 74, 2573–2579. [Google Scholar] [CrossRef]
  41. Roman-Ponce, H.; Thatcher, W.W.; Buffington, D.E.; Wilcox, C.J.; Van Horn, H.H. Physiological and production responses of dairy cattle to a shade structure in a subtropical environment. J. Dairy Sci. 1977, 60, 424–430. [Google Scholar] [CrossRef]
  42. Rodriquez, L.A. Effects of relative humidity, maximum and minimum temperature, pregnancy, and stage of lactation on milk composition and yield. J. Dairy Sci. 1985, 68, 973–978. [Google Scholar] [CrossRef]
  43. Bouraoui, R.; Lahmarb, M.; Majdoubc, A.; Djemalic, M.; Belyead, R. The relationship of temperature-humidity index with milk production of dairy cows in a Mediterranean climate. J. Anim. Res. 2002, 51, 479–491. [Google Scholar] [CrossRef]
  44. Silva, R.G.; Campos Maia, A.S. Thermal stress indexes. In Principles of Animal Biometeorology; Springer: Dordrecht, Netherlands, 2013; pp. 207–229. [Google Scholar]
  45. Friendly, M. Corrgrams: Exploratory displays for correlation matrices. Am. Stat. 2002, 56, 316–324. [Google Scholar] [CrossRef]
  46. Hammami, H.; Vandenplas, J.; Vanrobays, M.L.; Rekik, B.; Bastin, C.; Gengler, N. Genetic analysis of heat stress effects on yield traits, udder health, and fatty acids of Walloon Holstein cows. J. Dairy Sci. 2015, 98, 4956–4968. [Google Scholar] [CrossRef] [PubMed]
  47. Beatty, D.T.; Barnes, A.; Taylor, E.; Pethick, D.; McCarthy, M.; Maloney, S.K. Physiological responses of Bostaurus and Bosindicus cattle to prolonged continuous heat and humidity. J. Animal Sci. 2006, 84, 972–985. [Google Scholar]
  48. Ciais, Ph.; Reichstein, M.; Viovy, N.; Granier, A.; Ogée, J.; Allard, V.; Aubinet, M.; Buchmann, N.; Bernhofer, Chr.; Carrara, A.; et al. Europe-wide reduction in primary productivity caused by the heat and drought in 2003. J. Nature 2005, 437, 529–533. [Google Scholar] [CrossRef] [PubMed]
  49. Collier, R.J.; Dahl, E.; VanBaale, M.J. Major advances associated with environmental effects on dairy cattle. J. Dairy Sci. 2006, 89, 1244–1253. [Google Scholar] [CrossRef]
  50. Gauly, M.; Bollwein, H.; Breves, G.; Brugemann, K.; Danicke, S.; Das, G.; Demeler, J.; Hansen, H.; Isselstein, J.; Konig, S.; et al. Future consequences and challenges for dairy cow production system arising from climate change in center Europe—A review. Animal 2013, 7, 843–859. [Google Scholar] [CrossRef] [PubMed]
  51. Myneni, R.B.; Keeling, C.D.; Tucker, C.J.; Asrar, G.; Nemani, R.R. Increased plant growth in the northern high latitudes from 1981 to 1991. Nature 1997, 386, 698–702. [Google Scholar] [CrossRef]
  52. Nikkhah, A.; Furedi, C.J.; Kennedy, A.D.; Scott, S.L.; Wittenberg, K.M.; Crow, G.H.; Plaizier, J.C. Morning v.s. evening feed delivery for lactating dairy cows. Can. J. Anim. Sci. 2011, 91, 113–122. [Google Scholar] [CrossRef]
  53. O’Brien, M.D. Metabolic adaptations to heat stress in growing cattle. Domest. Anim. Endocrinol. 2010, 38, 86–94. [Google Scholar] [CrossRef] [PubMed]
  54. Brown-Brandl, T.M.; Eigenberg, R.A.; Nienaber, J.A.; Hahn, G.L. Dynamic response indicators of heat stress in shaded and non-shaded feedlot cattle, Part 1: Analyses of indicators. Biosyst. Eng. 2005, 90, 451–462. [Google Scholar] [CrossRef]
  55. Udo, H.J.M. Hair Coat Characteristics in Friesian Heifers in the Netherlands and Kenya: Experimental Data and A Review of Literature. Ph.D. Thesis, University of Wageningen, Wageningen, The Netherlands, 1978. [Google Scholar]

