Article

Hydrological Impacts of the Changes in Simulated Rainfall Fields on Nakanbe Basin in Burkina Faso

by
Boubacar Ibrahim
1,*,†,
Harouna Karambiri
1,‡ and
Jan Polcher
2,‡
1
Institut International d'Ingénierie de l'Eau et de l'Environnement de Ouagadougou (2iE), 01 BP 594 Ouagadougou, Burkina Faso
2
Laboratoire de Météorologie Dynamique du CNRS/IPSL, Université P. & M. Curie (Paris 6), Tour 45, 3ème étage, Case 99, 4 pl. Jussieu, 75252 Paris cedex 05, 4 Place Jussieu, 75005 Paris, France
*
Author to whom correspondence should be addressed.
Current Address: West African Science Service Center on Climate Change and Adapted Land Use (WASCAL), 06 BP 9507 Ouagadougou, Burkina Faso.
These authors contributed equally to this work.
Climate 2015, 3(3), 442-458; https://doi.org/10.3390/cli3030442
Submission received: 3 February 2015 / Revised: 8 June 2015 / Accepted: 18 June 2015 / Published: 25 June 2015

Abstract

:
Changes in rainfall regime during the last five decades over the West African Sahel have significantly modified the hydrological regime of many rivers with a significant impact on water resources. In this study, the main hydrological processes on the Nakanbe watershed in Burkina Faso are described with two hydrological models: GR2M (lumped and monthly model) and ORCHIDEE (ORganising Carbon and Hydrology In Dynamic EcosystEms) (distributed and half hourly model). Both models were calibrated on the watershed from observed runoff data at Wayen outlet (area of 22,000 km2) for the 1978–1999 period. The mean annual hydrological balance components on the watershed over this period are composed of about 4% of runoff, 10% of groundwater recharge and 86% of actual evapotranspiration for both models. An assessment of the hydrological impacts of the changes in rainfall regime simulated by five regional climate models shows some discrepancies. The hydrological simulations show that the hydrological impacts on the water balance of the watershed come mainly from the changes in rainfall field with regard to the frequency and the intensity of rain events. Compared to the decrease in frequency, it appears that the decrease in the intensity of rain events is much more prejudicial to runoff and groundwater recharge.

1. Introduction

Water resources management under climate change conditions raises several questions on water availability in the Sahelian countries. The continuous deficit in annual rainfall amount since the beginning of the 1970s [1,2] has significantly reduced water resources in the region as rainfall is the main input of water into the reservoirs. Average river discharges have significantly decreased at some outlets over the main basins of West Africa (Niger, Volta, and Senegal) during the 1970–2009 period in comparison with the previous decades of 1950–1970 [3,4,5,6]. Bricquet et al. [3] showed from a study of the annual runoff evolution over the 1950–1990 period in three Sahelian basins (Niger, Senegal, and Chari) a continuation of the overdrawn years in runoff since 1970. In addition, dramatic low flows were recorded on Niger and Senegal rivers during the 1980s decade at some hydrometric stations: the runoff has stopped at the Niamey gauge on the Niger river and at the Bakel gauge on the Senegal river in 1984 [7]. Furthermore, groundwater is also affected by this drought condition with a depletion of the underground reservoirs [8,9]. This is materialized by a lowering of the water table, which did not reach its mean level (estimated during the 1950–1960 period on the crystalline bedrock areas) since 1970 [6,10]. Thus, water resources management in the Sahelian area has been complicated [11,12] under the two constraints: decrease in runoff and depletion of groundwater.
On the other hand, climate change conditions over the future period under the different IPCC scenarios [13] is expected to modify the rainfall regime over the Sahel [14]. However, the changes in annual rainfall amount (the main characteristic of the rainy season) over the West African Sahel for the horizon of the 2050s in comparison to the 1961–2000 period depend on the climate models [15,16,17,18]. The diversified trends in the rainfall regime under the climate change condition would certainly have different impacts on the hydrological processes over the different basins [16,19,20]. Ruelland et al. [20] found a decreasing trend in runoff evolution under the A2-scenario from two global climate models (HadCM3 and MPI-M) over the Bani catchment (a sub basin of Niger) at Douna during the 21st century in comparison to the 1961–1990 period. Ardoin-Bardin et al. [21] show from an assessment of the climate change impact on runoff over three large basins (the Senegal, the Gambia, the Sassandra and the Chari), different trends in runoff evolution for the 21st century. This assessment was conducted using four GCMs (CSIRO-Mk2, ECHAM4, HadCM3 and NCAR-PCM) under the A2 climate change scenario. Moreover, the hydrological impacts of climate change depend on the hydrological functioning of the basin, the climate model and the climate change scenario.
The upstream of the Nakanbe or White Volta (one of the affluents of the Volta), which represents the Sahelian part of the Volta basin in Burkina Faso is under the threat of climate change. This part of the basin has recorded a significant deterioration of the natural resources during the second half of the 20th century. The hydrological regime at Wayen gauge has significantly changed [22] during the 1970–2000 period in comparison to the previous decades of 1950–1969.
Thus, as in the past, water resources availability in the Nakanbe basin for the future depends on the magnitude of the impacts of changes in rainfall field on the main hydrological components (runoff, groundwater recharge and evaporation). The aim of this study is to assess the sensitivity of the Sahelian part of the Nakanbe basin to rainfall changes from two different hydrological models: GR2M a lumped and monthly model and ORCHIDEE (ORganising Carbon and Hydrology In Dynamic EcosystEms) a spatially distributed and half hourly time-step model. The impacts are determined from an ensemble of five scenarios of changes in rainfall field elaborated from the changes between the 1971–2000 period and the 2021–2050 period determined in the simulations of five region climate models for Burkina Faso.

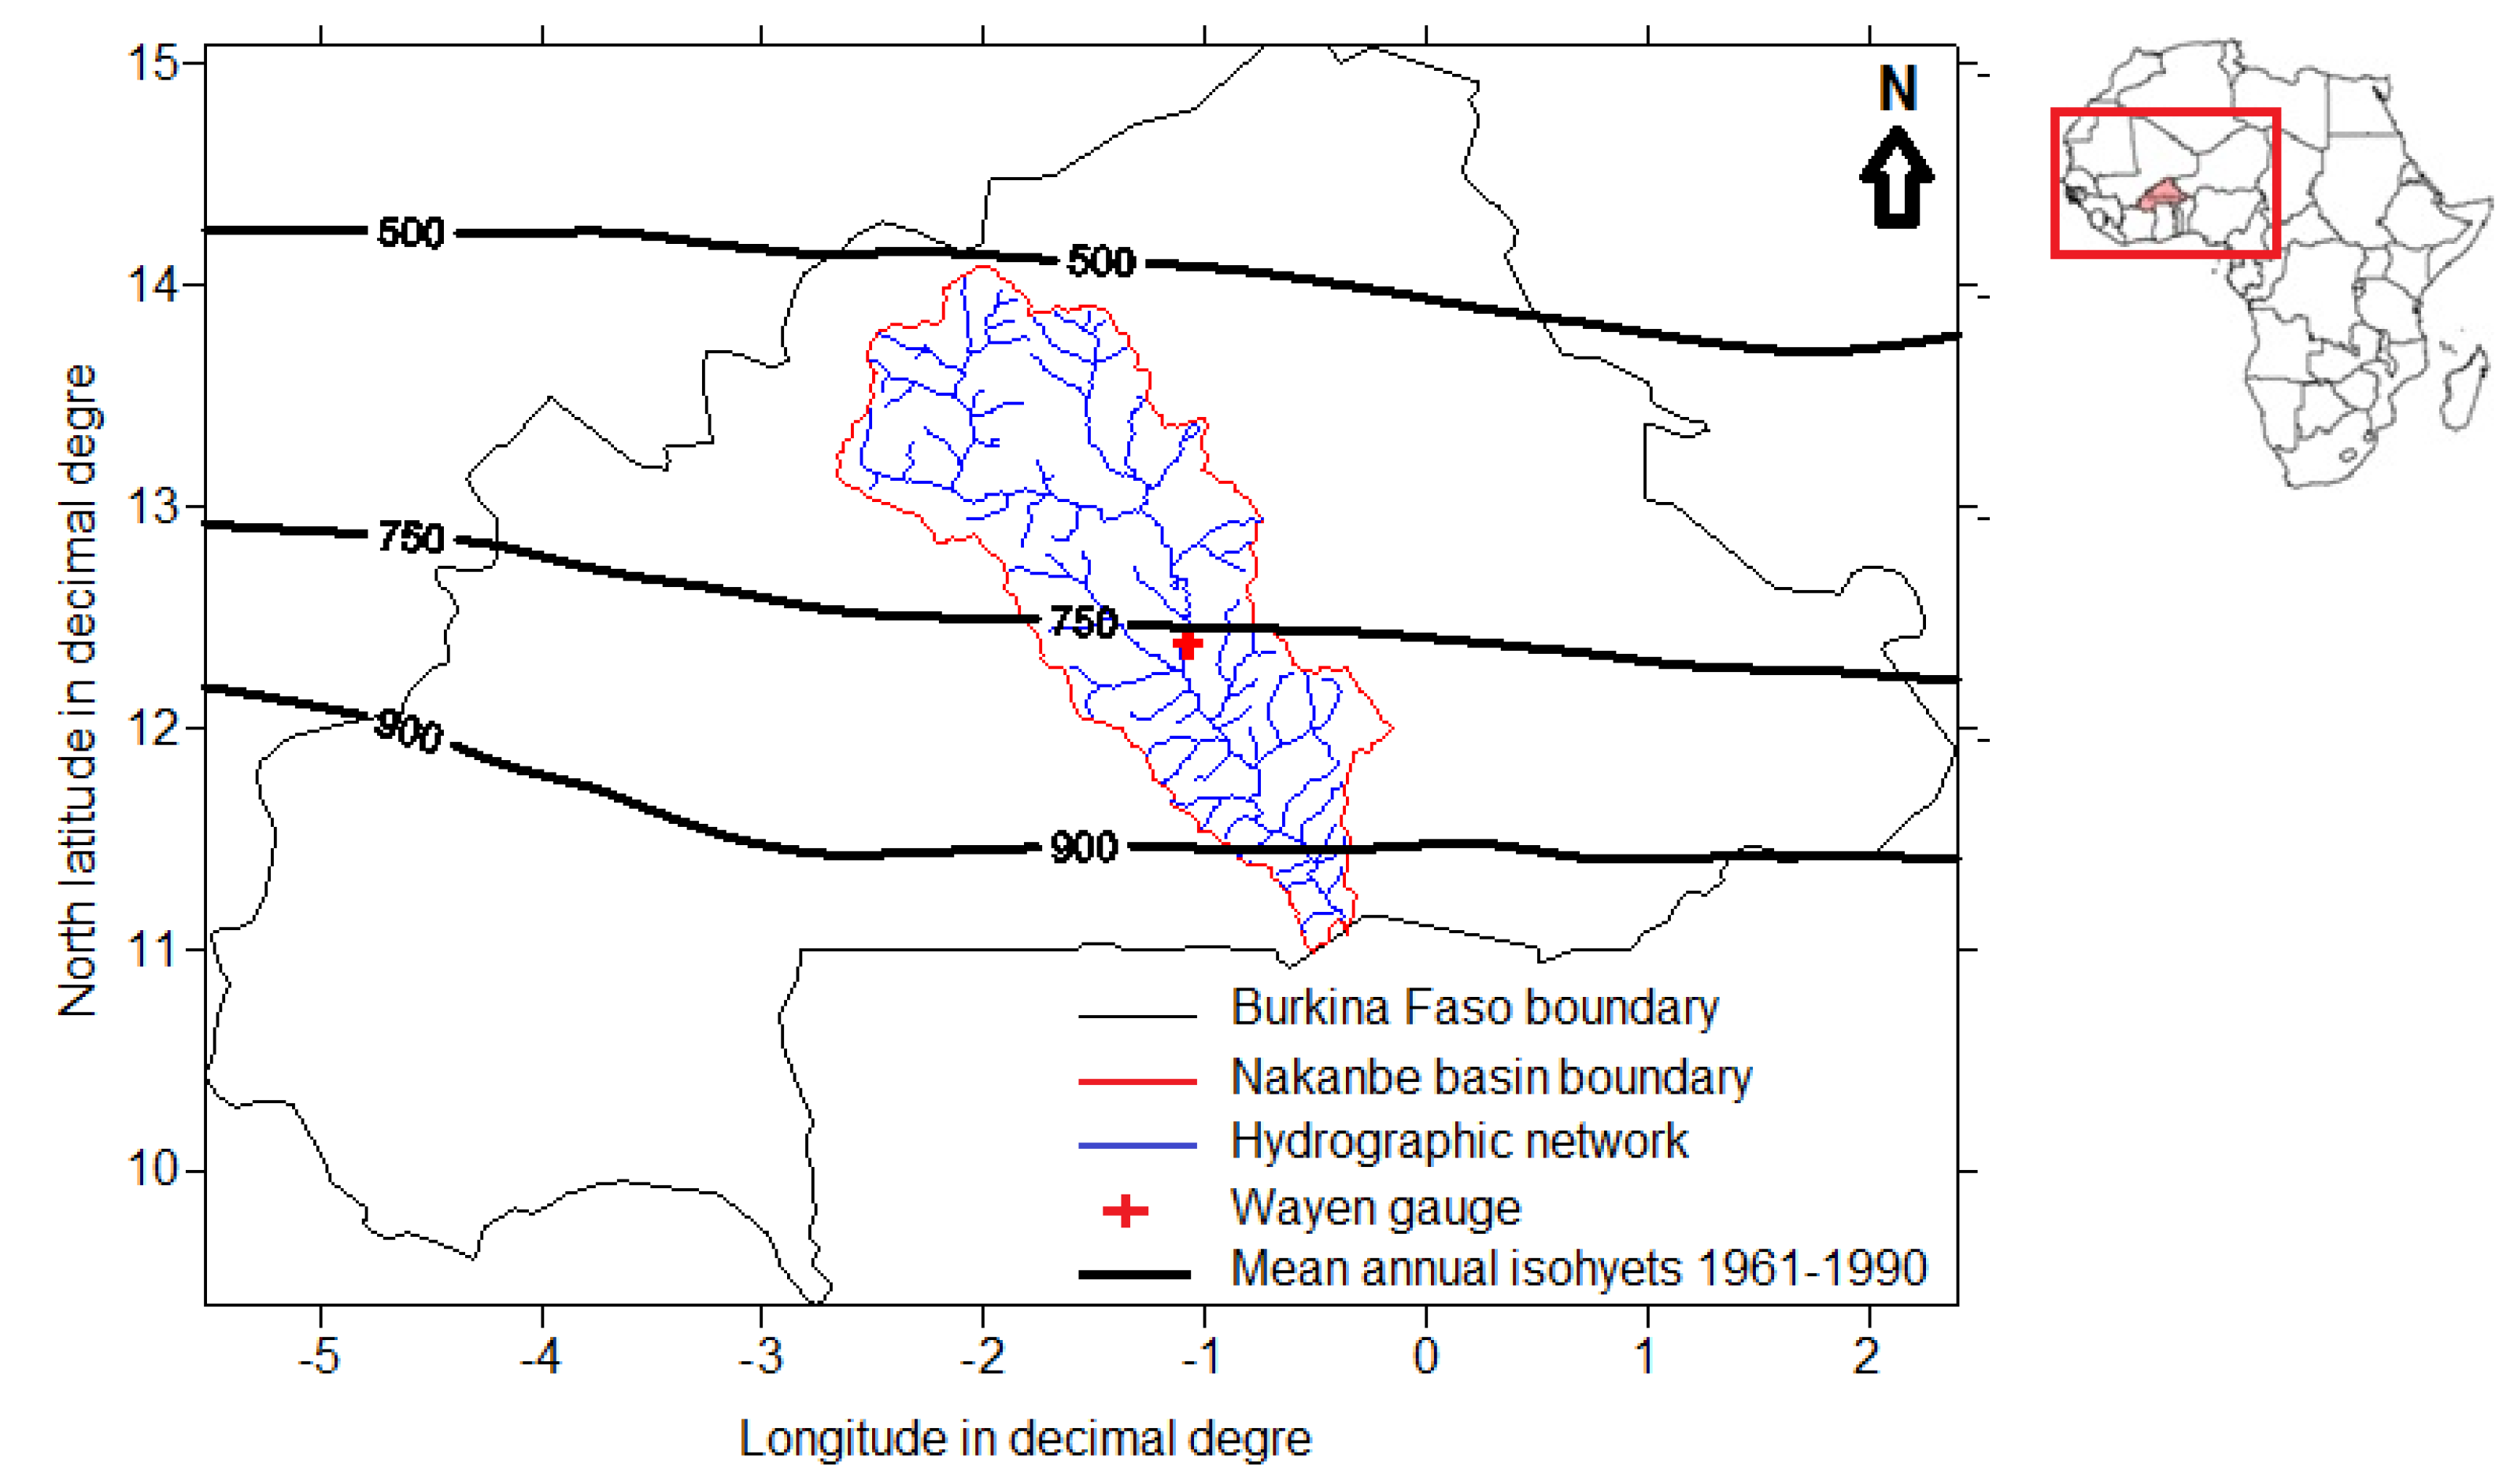
2. Description of the Watershed and Data Review

Volta basin, the second largest basin in West Africa (after Niger basin) with a surface of around 400,000 km2 and shared between six countries (Benin, Burkina Faso, Côte d’Ivoire. Ghana, Mali, Togo) is also under this menace of climate change. This basin represents important natural resources for the riparian population and lodged over 2,000 reservoirs with the biggest dam in the region, the Akossombo dam. With more details, the upstream of the Nakanbe or White Volta (one of the affluents of the Volta), which represents the Sahelian part of the Volta basin in Burkina Faso lodged over 400 reservoirs. Nakanbe basin covers a surface of about 15% of Burkina Faso (44,000 km2) and overlaps the central part of the country from the North to the South (Figure 1). The basin is distributed over the three main climate zones that characterized Burkina Faso climate: the Sahelian climate with annual rainfall amount between 300 mm and 600 mm, the Sub-Sahelian climate with annual rainfall amount between 600 and 900 mm and the north Sudanese climate with annual rainfall amount between 900 mm and 1200 mm [14]. Our study focuses on the Sahelian part of the basin (an area of about 22,000 km2), which constitutes the upstream of Wayen hydrometric station (Figure 1).
Two types of climate data are considered in this study: the interpolated data from observations and the simulations from RCMs. The data are constituted with rainfall, temperature, and the potential evapotranspiration. The interpolated climate data at the spatial resolution of 0.5° × 0.5° over 1971–2009 period comes from four data sources: IRD, CRU [23], WATCH [24] and in situ data (observations) from the ten synoptic stations of Burkina Faso [14]. The observed data from the synoptic stations concerned the main climate parameters (rainfall, temperature, humidity, insolation and wind) and cover the period from 1961 to 2009. The IRD and CRU are monthly data while the WATCH data are processing data at 3 hours. An assessment of the representativeness [23] of all the interpolated or processed data (IRD, CRU, WATCH) showed that these data are relevant in the region. The climate simulations are produced by five regional climate models (RCMs) run under the intermediate climate change scenario of A1B over the 1961–2050 period [14]: CCLM, HadRM3P, RACMO, RCA and REMO. The simulations have been done by ESEMBLE in the framework of AMMA (African Monsoon Multidisciplinary Analysis) [14]. The daily simulated data at the spatial resolution of 50 km × 50 km are available for free download at the ENSEMBLE data portail [25]. More details on the RCMs could be found in Ibrahim et al. [14,18]. The last data used are constituted with the daily discharges measured at Wayen gauge since 1955. However, as these data present significant gaps over 1955–1977 (gaps of more than 50% in the daily data), the hydrological models calibration is performed over the 1978–1999 period, which present less gaps (<5%).
Figure 1. Geographical position of Nakanbe basin in Burkina Faso. The isohyets represent the mean annual rainfall amount over the 1961–1990 period from the CRU data.
Climate 03 00442 g001

3. Hydrological Modeling of the Watershed

This study goes beyond the classical hydrological modeling [26,27] based on the rainfall–runoff relation modeling. This classical hydrological modeling only targets the reproduction of the observed runoff at the outlet with no regard to the other hydrological components (evapotranspiration and groundwater recharge). Our study determined the three main components (runoff, evapotranspiration and recharge) of the hydrological processes that explain the repartition of water from rainfalls in the basin. The hydrological balance of the basin is described from the four hydrological components: runoff at the outlet, groundwater recharge, evapotranspiration and change in soil water content. The annual hydrological balance can be represented with the six terms in Equation (1):
P + R b = R + I R + A E T + Δ S
With P, the rainfall, Rb the base flow (contribution of the groundwater to runoff), R the runoff at the outlet, IR Deep infiltration, AET the actual evapotranspiration (transpiration and direct evaporation), ∆S variation in the water contain of the Vadose zone.
However, over most of the Sahelian basin the contribution of groundwater (Rb) to runoff over the watershed is not estimated because of a lack of data [6,8]. Meanwhile, in this study we compute the difference RE = IRRb which represents the groundwater recharge. Thus, the main Equation (1) is reduced to five terms:
P = R + R E + A E T + Δ S
Altogether, only two terms of Equation (2) are obtained from the observations: P and R. The other terms in this equation are determined from the hydrological modeling of the watershed with the hydrological models. The hydrological functioning of the basin is described through two hydrological models: GR2M [28] and ORCHIDEE [29]. A full description of the GR2M model is presented in Mouelhi et al. [28] and the full description of ORCHIDEE is presented in d’Orgeval [29].
The two hydrological models have to be validated (ORCHIDEE) or calibrated (GR2M) at the hydrometric station of Wayen over a historical period (Figure 2). The hydrological regime over Wayen watershed is characterized by a temporal runoff from April–May to November–December with the maximum runoff recorded between mid-August and mid-September (Figure 2). However, as for the rainfall regime in West African Sahel, the maximum monthly runoff is recorded in August with a mean monthly runoff of around 9 mm/month over 1978–1999 period.
Figure 2. Mean hydrological regime of the upstream watershed of Wayen during the 1978–1999 period.
Climate 03 00442 g002

3.1. Hydrological Functioning of GR2M

GR2M is a spatially lumped and monthly time-step model developed by IRSTEA [30] and the formulation that we use during this study is elaborated by Mouelhi et al. [31]. The hydrological functioning of the model is based on two reservoirs: the production reservoir with capacity X1 and the routing reservoir with a capacity of 60 mm controlled by parameter X2. The hydrological balance of the model is defined by the five terms as in Equation (2). The model is run with monthly data of two climate parameters (the rainfall and the potential evapotranspiration) and the monthly discharge data of the watershed outlet. The implementation of the model consists of the determination of the two parameters X1 and X2 during a calibration period and then a validation where the representativeness of the two parameters is evaluated (different with the calibration period).

3.2. Hydrological Functioning of ORCHIDEE

ORCHIDEE is a distributed model implemented at a spatial resolution of 0.5° × 0.5° (Figure 3) and at a time-step of a half hour [29,31]. These small time steps help to assess the hydrological impacts of the changes in rainfall pattern from the daily scale to the annual scale. Another particular aspect of ORCHIDEE is that it doesn’t need to be calibrated but a validation of the outputs is necessary for an evaluation of the representativeness of the simulated hydrological components over the watershed. The model’s functioning is based on the energetic balance and the hydric balance over the earth surface [29] with a representation of the infiltration processes into a soil layer of 2 m thick discretized into N = 11 small layers. The thickness of the different small layers is determined from the top (surface) to the bottom over the whole soil layer by the fact that the thickness of a layer is twice the thickness of the previous layer (the layer above). Thus, from this condition, the first layer is about 1mm thick and the last layer is about 500 mm thick. The infiltration through the different layers is computed with the Fokker-Planck equation (Equation (3)).
θ ( z , t ) t = z ( D ( θ ) × θ ( z , t ) z K ( θ ) ) S
θ the soil humidity in m3·m−3, D the diffusivity in m2·s−1, K hydraulic conductivity in m·s−1 and S represents the soil water extraction by roots in m3·m−3·s−1.
D the diffusivity is determined from the hydraulic head h by:
D ( θ ) = K ( θ ) h θ
K and D are defined between the residual soil moisture θr and the saturated soil moisture θs.

3.3. Implementation of the Hydrological Models on the Watershed

The hydrological modeling is performed from the distributed climate data at the spatial resolution of 0.5° × 0.5° (Figure 3). From Figure 3, 17 meshes cover the whole watershed and the fractions of the watershed over each mesh are presented in Table 1. Hence, the average value of each climate parameter over the watershed is determined from the interpolated data (IRD, CRU and WATCH) through Equation (5) (case of the rainfall amount):
P b . j = i = 1 19 α i × P i . j
Pb.j average rainfall amount on the basin at the time-step j, αi fraction of the basin over mesh i and Pi.j rainfall amount on mesh i at the time-step j.
The first monthly model, GR2M, is calibrated and validated through the Nash efficiency criterion [32]. The calibration consists in the determination of the model’s optimum parameters which produce the closest discharge data to the observations during the calibration period. Then, the same parameters are used to simulate discharges for another period of validation. For both periods (calibration and validation), the Nash efficiency should be higher than 60% for simulations with the optimum parameters. The efficiency criterion evaluates the representativeness of the simulated monthly discharges by the model from:
N a s = 100 ( 1 i ( Q o b s i Q s i m i ) 2 i ( Q o b s i Q m ) 2 )
with Q o b s i observed discharge for month i, Q s i m i simulated discharge for month i and Qm mean observed discharge over the given period.
Figure 3. Subdivision of the Nakanbe basin at Wayen gauge into meshes of 0.5° × 0.5°. The numbers represent the reference index of the mesh, from 1 to 19.
Climate 03 00442 g003
Table 1. Spatial distribution of the basin within the 19 meshes of 0.5° × 0.5°.
IndexLatitudeLongitudeFraction of the Basin (%)IndexLatitudeLongitudeFraction of the Basin (%)
114.25−2.250.431113.25−1.2512.90
214.25−1.750.241213.25−0.751.31
313.75−2.750.141312.75−2.750
413.75−2.2511.371412.75−2.250.77
513.75−1.7512.311512.75−1.756.17
613.75−1.253.921612.75−1.2511.37
713.75−0.7501712.75−0.756.11
813.25−2.752.351812.25−1.250.99
913.25−2.2514.181912.25−0.750.58
1013.25−1.7514.86
The coordinates are the mesh center coordinates.

4. Results

The hydrological functioning of the Nakanbe basin at Wayen gauge is characterized with the two models from daily to annual time-step. It consists first of the calibration and the validation of the GR2M model over the historical period of 1978–1999 and secondly to the validation of the simulations produced by ORCHIDEE over the same period. However, the hydrological balance of the basin is established for both models at the annual scale.

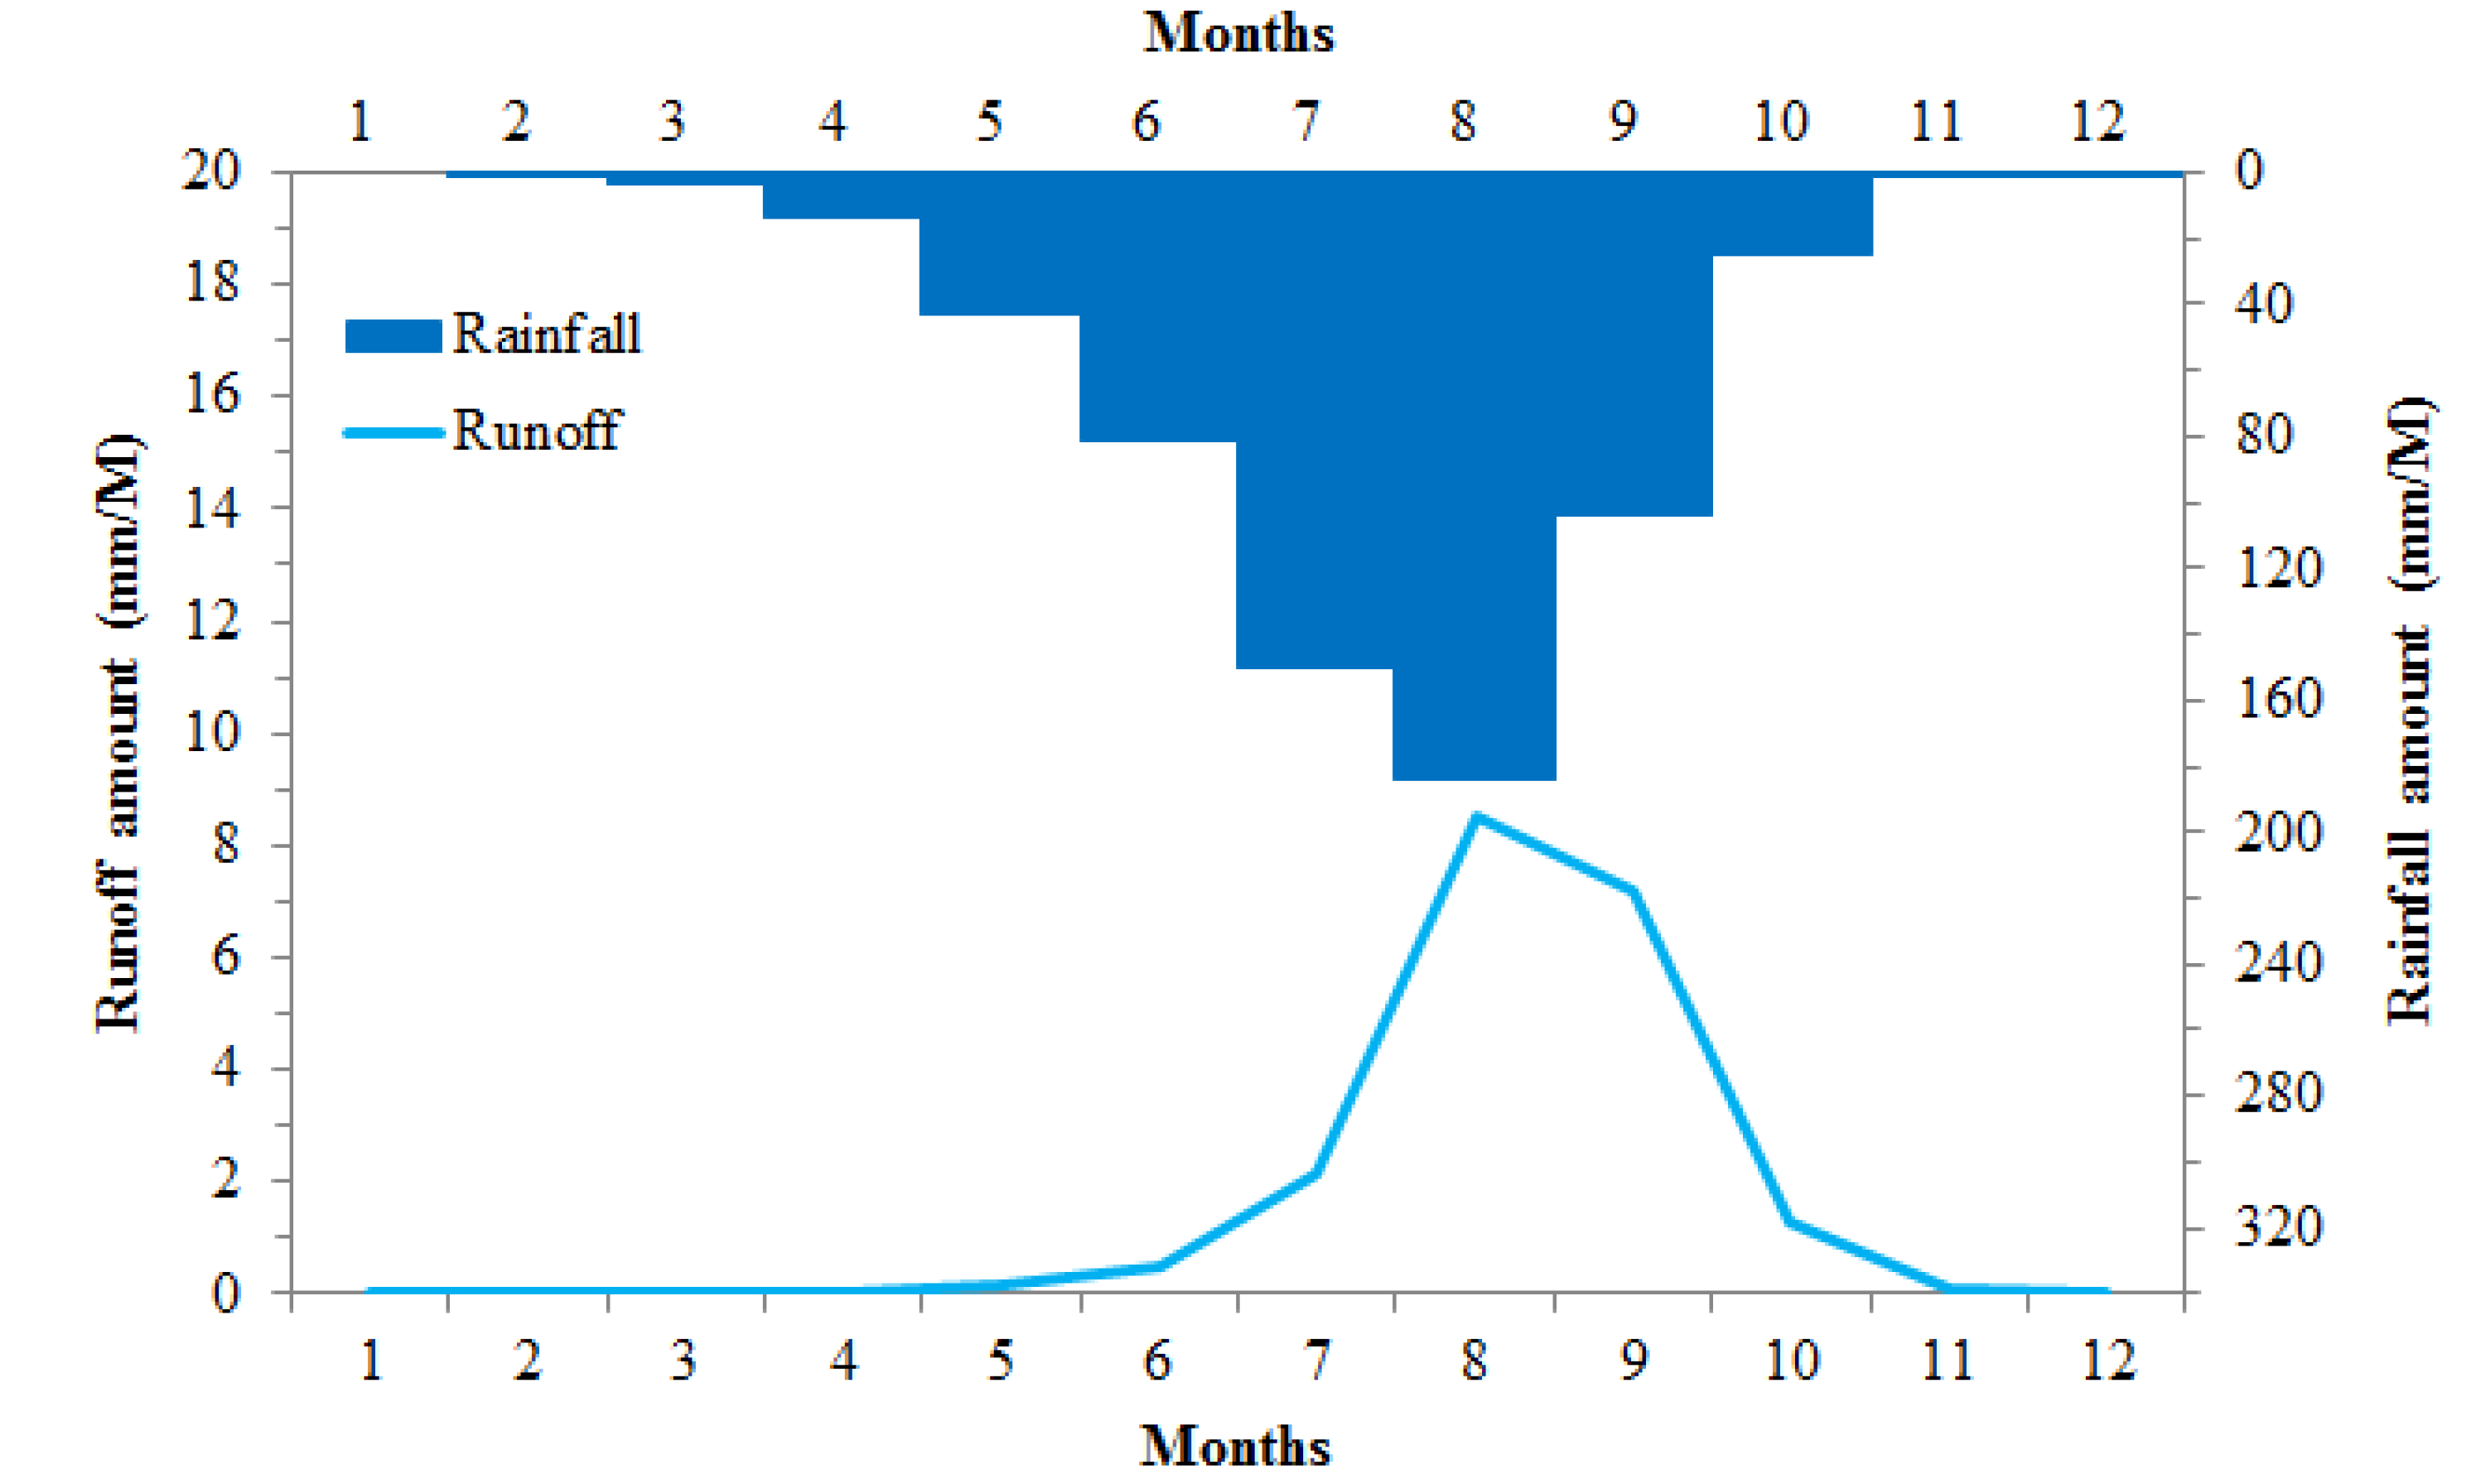
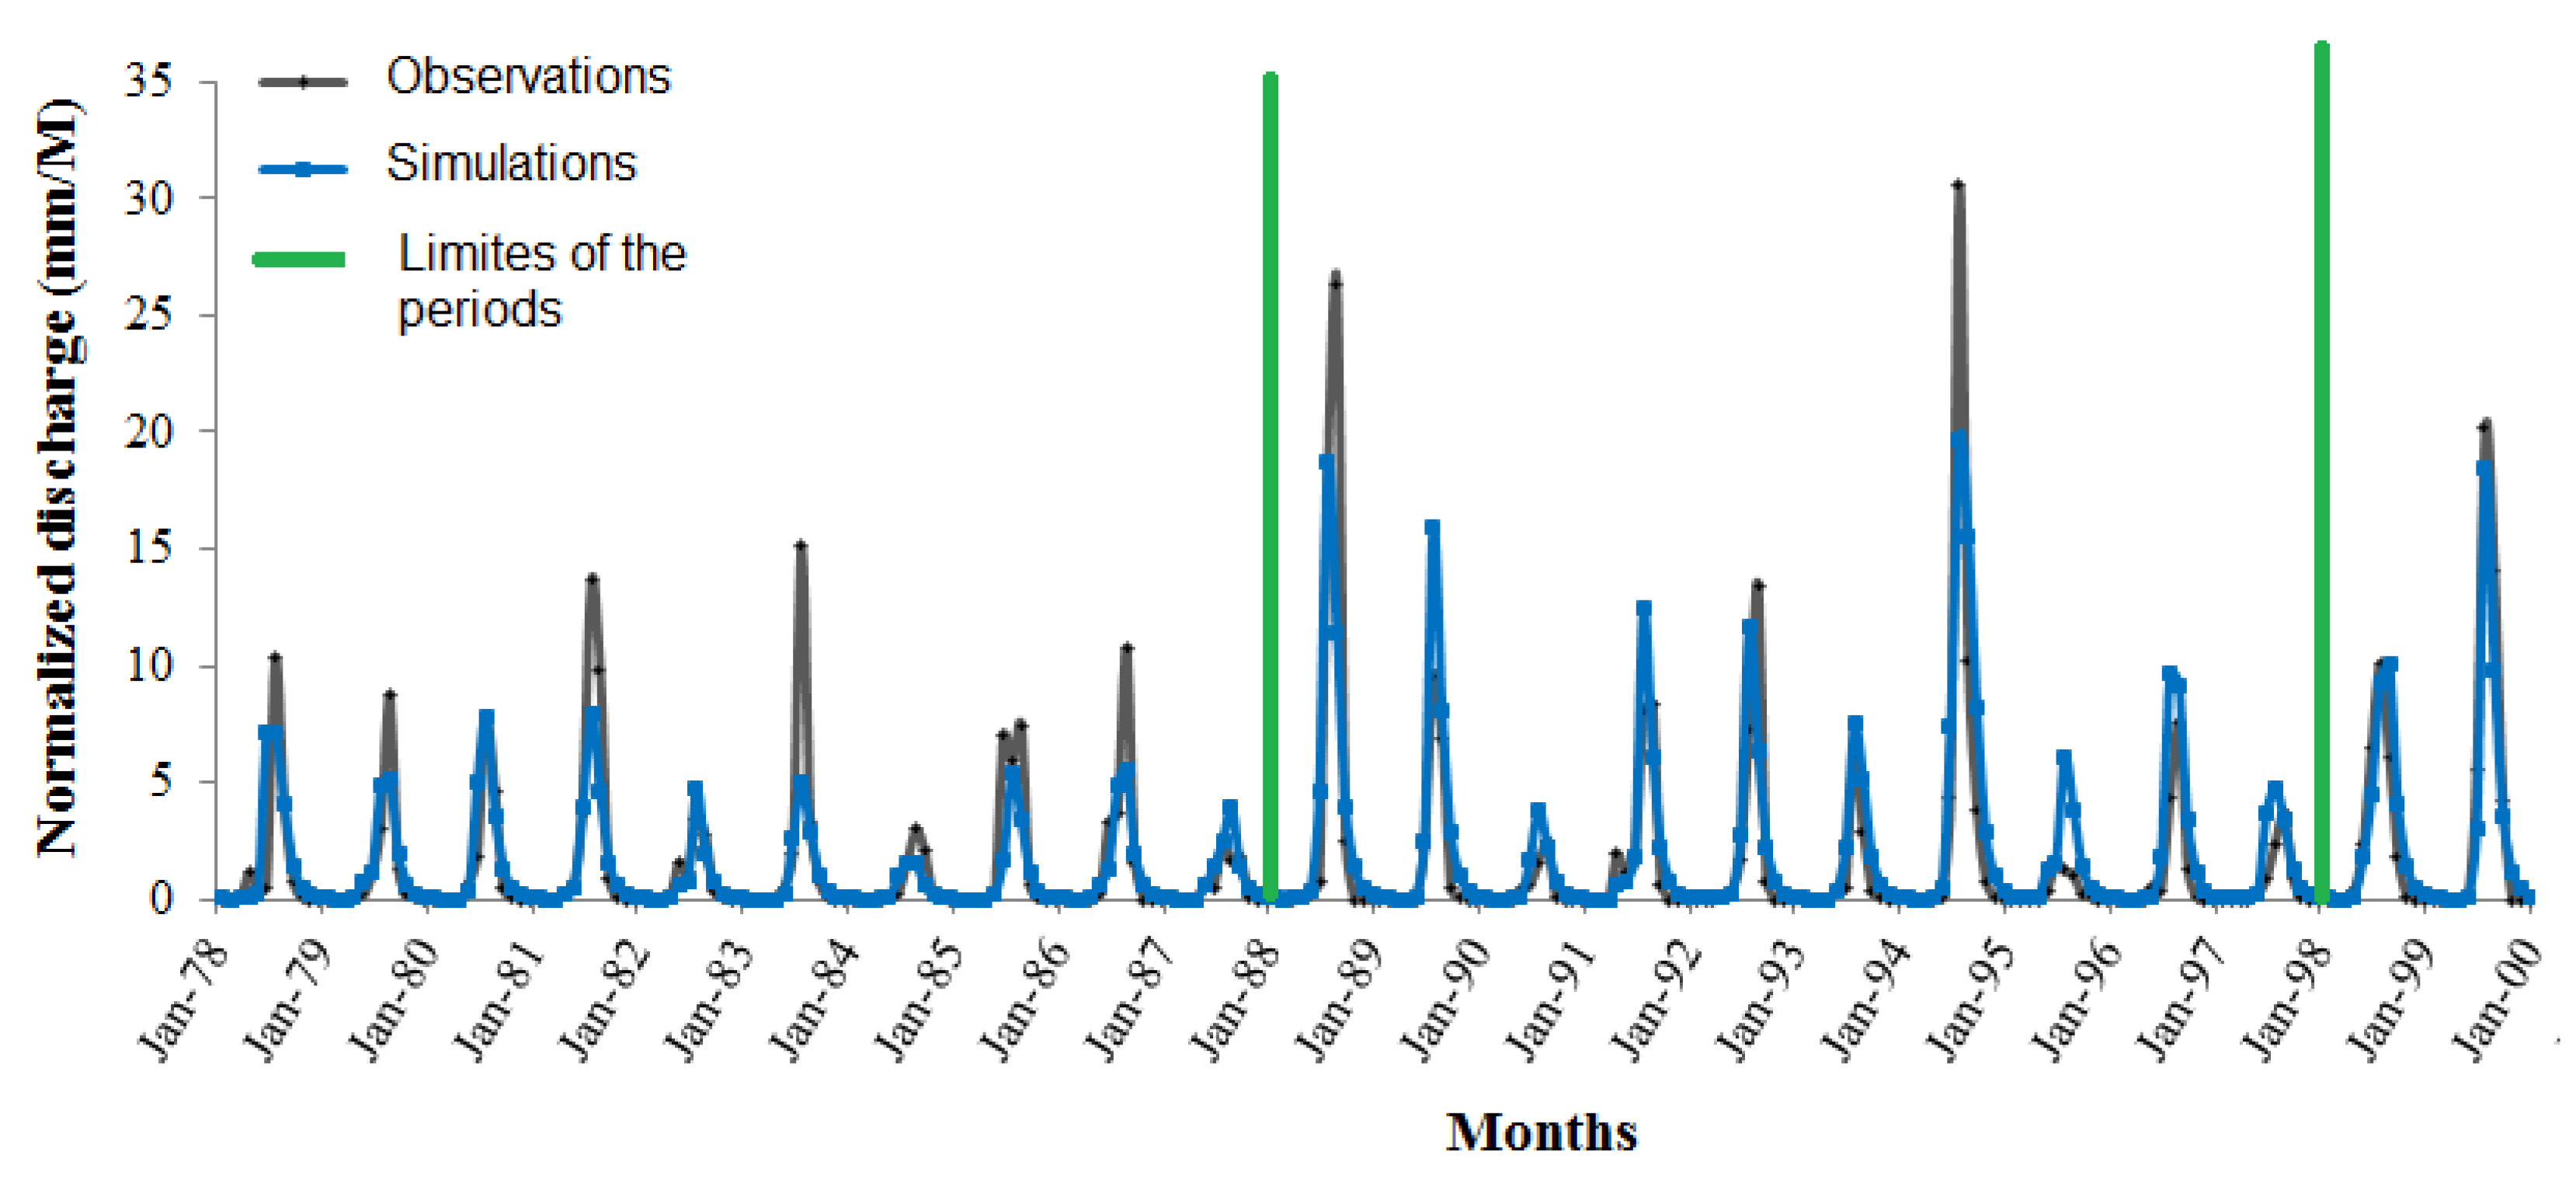
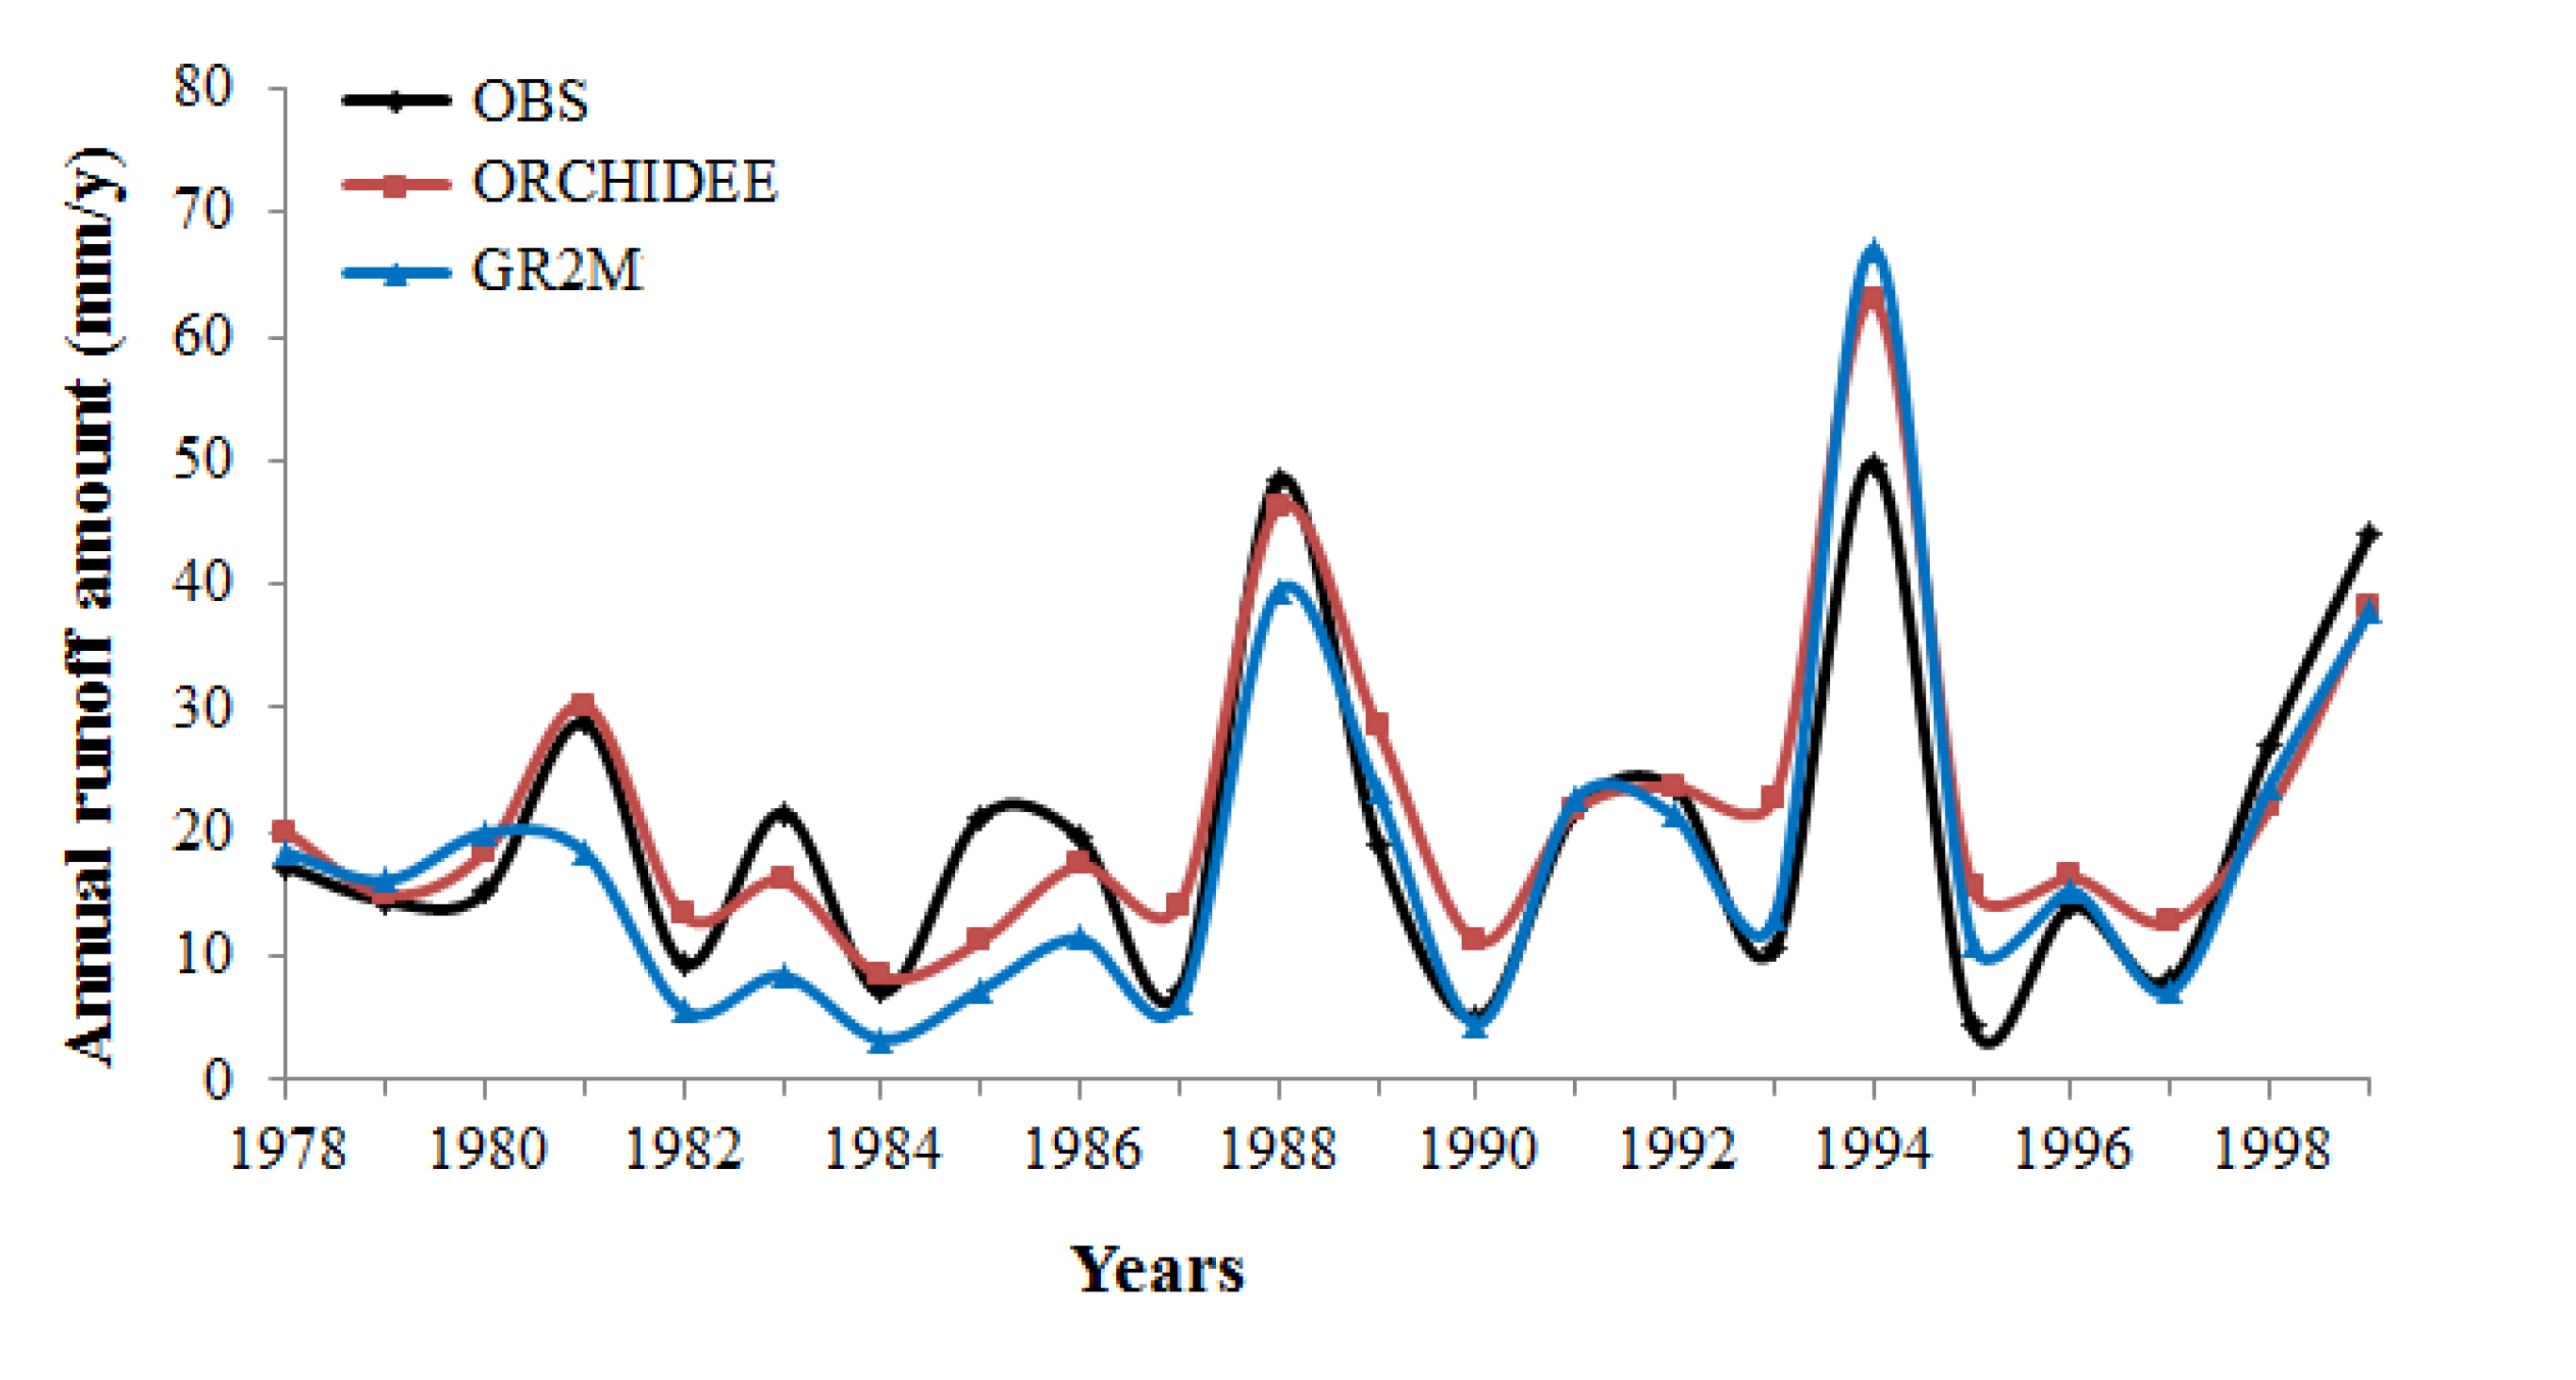
4.1. Model Settings and the Annual Hydrological Balance of the Watershed

GR2M model is implemented from the monthly rainfall and potential evapotranspiration data of the four sources of data (IRD, CRU, WATCH and observations). The monthly average values were calculated based on the proportion of the watershed on each grid (Equation (5)). However, ORCHIDEE is implemented only with WATCH grid data which filled the model’s requirement.
The optimal periods for calibration and validation of GR2M models were searched through several combinations of segments of periods chosen within the 1978–1999 period. The requirements are that the segment for calibration and the segment for validation must have a length of more than seven years [22] and the two segments must be consecutive. Thus, a set of 30 combinations of segments of periods have been made with three lengths (results not shown): seven, ten and eleven years. Overall the combinations, the most representative combination with the highest Nash criteria for both calibration and validation is obtained with IRD rainfall data and ETP data from the synoptic network. The efficiencies are: a Nash of 62% for the calibration period from 1978 to 1987 and a Nash of 73% for the validation period from 1988 to 1997 (Figure 4). However, as reported by Paturel et al. [33] and Mahé et al. [34], the calibration efficiency depends on the source of the climate data and the difference in the Nash criterion obtained with the different sources of data (four sources of rainfall data and two sources of ETP data) is about 5% over the 1978–1997 period. Mahé et al. [34] emphasized that this difference in the Nash criterion comes from the rainfall data. Nevertheless, Figure 4 shows that the simulated and the observed monthly runoffs are very similar with a correlation coefficient of 0.97 and a deviation of less than 3%. Hence, GR2M reproduces a relevant hydrological regime of the basin at Wayen gauge. The model lets one determine the main hydrological components (runoff, groundwater recharge, and evaporation) over the watershed.
On the other hand, ORCHIDEE also reproduces relevant monthly runoff at Wayen gauge as the GR2M model (Figure 4). The two calibrated models are considered the Nakanbe hydrological models.
The inter-annual evolution of the runoff over this period is characterized by three picks (1988, 1994 and 1999) and a long drought period over the 1980–1987 period even if 1995 presents the lowest annual runoff (Figure 4). Both models reproduced this variation in the annual and monthly runoff unless GR2M amplified the shift over the 1980–1987 period due to the high deviation for the monthly maximum runoff. Furthermore, the three curves of the annual runoff amounts on Figure 5 present a significant correlation with a correlation coefficient of 0.9.
Altogether, from the two simulations, the mean annual rainfall amount of 650 mm observed over this period (1978–1999) is distributed in around 86% of evaporation, 10% of groundwater recharge and 4% of runoff. These proportions are similar with the results of other studies on West African basin [35,36,37,38]. Dakouré [35] established an annual hydrological balance over the transboundary catchment of Taoudeni (North-West Burkina Faso and South-West Mali) composed by 2%–5% of runoff, 8%–10% of groundwater recharge and 85%–88% of evaporation.
Figure 4. Monthly discharges at Wayen gauge from the observations and the simulations with GR2M during the 1978–1999 period. The green lines indicate the end of the period of calibration (December 1987) and the end of the validation period (December 1997).
Climate 03 00442 g004
Figure 5. Annual runoff amount simulated by two models (GR2M and ORCHIDEE) and the observations at Wayen gauge over the 1978–1999 period.
Climate 03 00442 g005

4.2. Assessment of the Changes in the Hydrological Balance of Nakanbe Watershed

4.2.1. Changes in Rainfall Field over the 2021–2050 Period from the Five RCMs

An analysis of changes in annual rainfall amount over Burkina Faso from five RCMs over the 1971–2050 period [18] shows that they come mainly from the changes in two characteristics of the rainy season: the number of rain days (frequency of rain events) and the intensity of rain events. Three RCMs (CCLM, RCA and REMO) out of the five RCMs show a dominate decrease in the number of rain days up to 13% over the 2021–2050 period in comparison to the 1971–2000 period. The two other RCMS (HadRM3P and RACMO) show a dominant increase in the intensity of the rainfall up to 12% over the 2021–2050 period in comparison to the 1971–2000 period. Only the RCA model presents a decrease in the two characteristics of the rainy season.
Henceforth, an assessment of the impacts of climate change on hydrological components from climate simulations have to be done through an assessment of the impact of changes in the two main characteristics of the rainfall field (the frequency of rain events and their intensity). However, it may be noted from Ibrahim [39] that the impact of the change in the potential evapotranspiration (consequently, the change in the temperature), the second climate parameter of the hydrological processes, is less important than that from the rainfall regime. A decrease of 5% in the rainfall amount has produced a decrease of 15% in the annual runoff in contrast to a decrease of 4% in the runoff for an increase of 5% in the potential evapotranspiration.

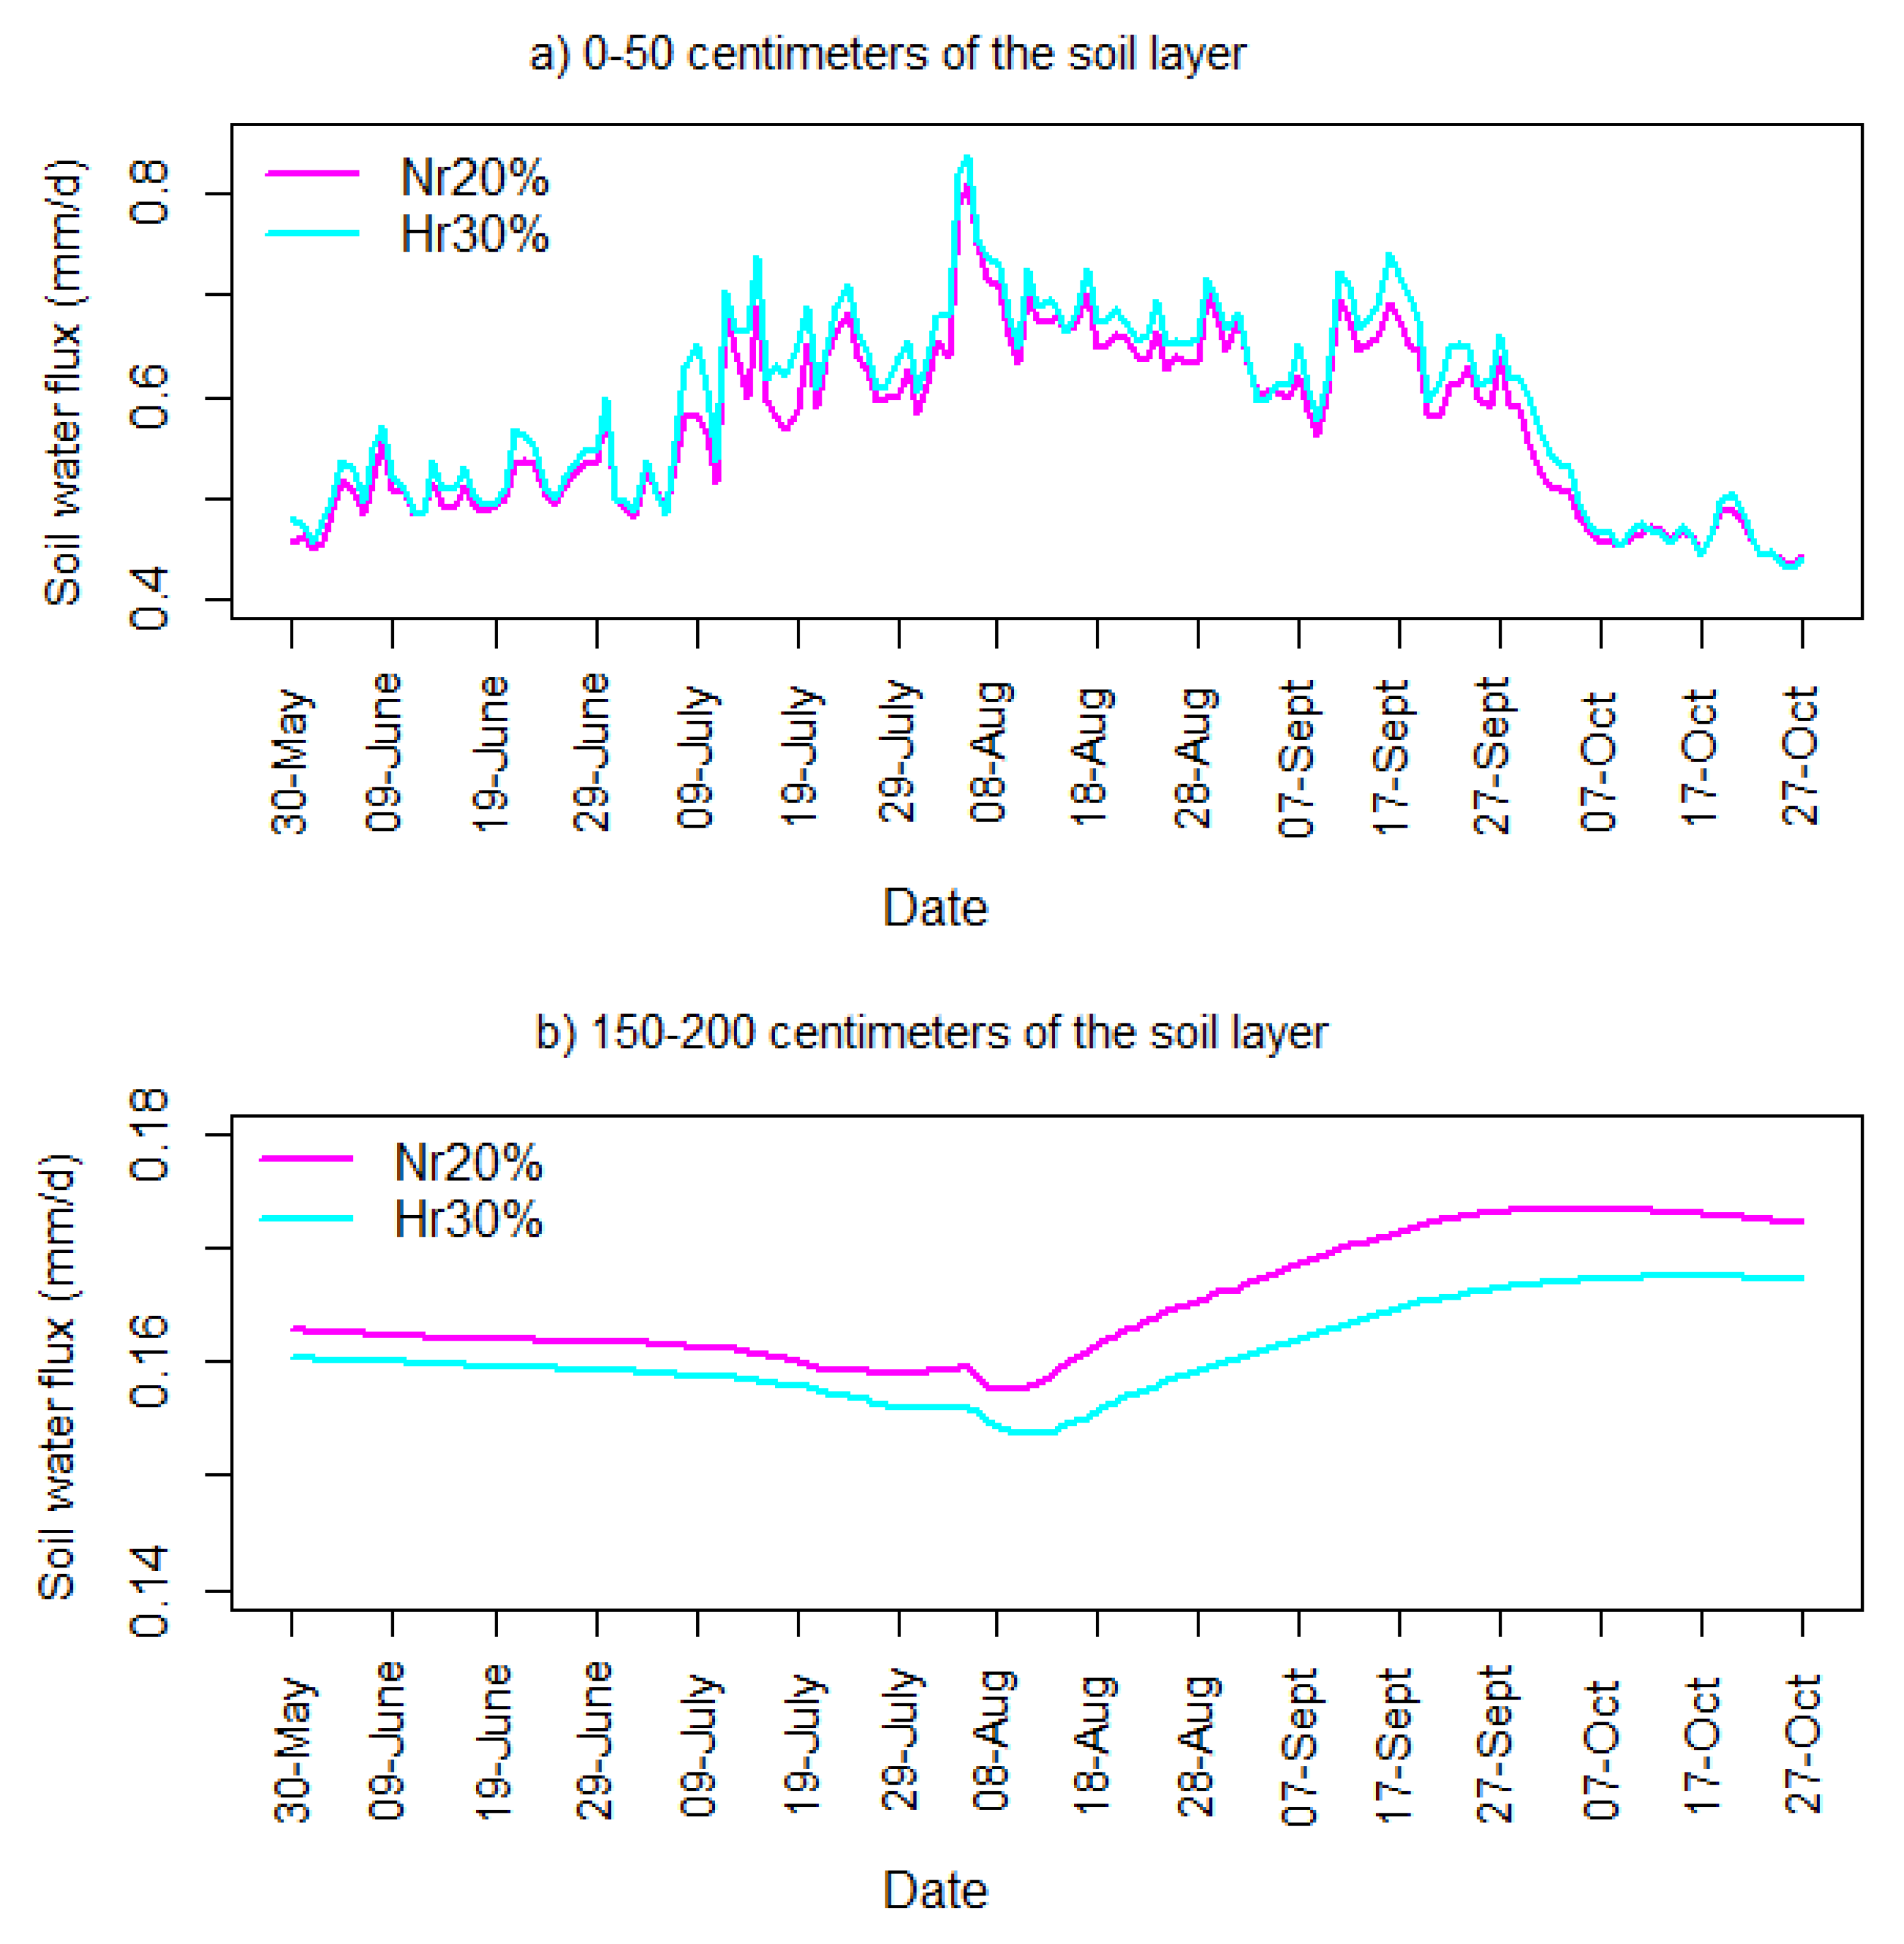
4.2.2. Hydrological Impacts of the Changes in Rainfall Field

The hydrological impacts of the different changes in rainfall field are assessed through the elaboration of five scenarios of change. The scenarios were built from the changes determined above from the five RCMs. They are implemented through two main changes in the number of rain days (decreases of 10% and 20%). This range covers the whole magnitude of the changes found in rainfall field simulated by the RCMs (maximum decrease of 13%). The five scenarios are implemented on WATCH data over the reference period of 1971–2000.
The two first scenarios are:
-
a decrease of 10% in the number of rain days thereafter designed as Nr10%;
-
a decrease of 20% in the number of rain days thereafter designed as Nr20%.
The number of rain days is reduced from the reference data by a random assignment of 0 mm to the corresponding proportion of days with rainfall higher than 1 mm/d. In order to respect the seasonal regime of rainfall in the region (unimodal), the numbers of rain days to transform to 0 mm are computed for each month. The first scenario produced a decrease of 17% in the annual rainfall amount and the second scenario produced a decrease of 30% in the annual rainfall amount.
Thus, in order to assess the difference in the hydrological impact due to a change in the intensity of rainfall, two other scenarios were built with two magnitudes of change in the intensity of rainfall (decreases 17% and 30%):
-
a decrease of 17% in the intensity of daily rainfall thereafter designed as Hr17%;
-
a decrease of 30% in the intensity of daily rainfall thereafter designed as Hr30%.
The two last scenarios are similar with the first two scenarios with regard to the change in the annual rainfall amount. They are only different with regard to the two characteristics (number of rain days and intensity of daily rainfall).
Then, the last scenario is established with an increase of 20% in the intensity of daily rainfall (Hi20%) for two RCMs (HadRM3P and RACMO) that show an increase in the intensity of rainfalls.
The hydrological impacts of the different change in rainfall regime with ORCHIDEE (Table 2) depend on the change in the characteristics of the rainy season. The decrease in the annual runoff is 10% more important in the case of the decrease in the intensity of rain days (Hr17% and Hr30%) than in the case of a decrease in the number of rain days (Nr10% and Nr20%). The decrease in the groundwater recharge is also twice as important in the case of the decrease in the intensity of rain days (Hr17% and Hr30%). Thus, the hydrological impacts of a decrease in the annual rainfall are more important when the changes in the rainfall field concern the intensity of the daily rainfalls (Hr17% and Hr30%). This difference comes from the process of the water movement through the soil layer or the hydrological processes in the vadose zone (Figure 6). A decrease in the number of rain days entails a lengthening of dry spells with more sunny days that dry out the shallow soil layers after a rainfall event. In contrary, for the decrease in the intensity of the rainfall, the frequent rainfall usually waters the shallow soil layers which remain wetter than at the previous case. Figure 6a shows that the water flux for the shallow layer (0–50 cm) is more important in the case of the scenario Hr30% than in the case of Nr20% scenario (the results are similar with Nr10% and Hr17%). Thus, as the shallow soil layers are much solicited by evaporation, the evaporation amount becomes more important for the scenarios of the decrease in the intensities (Hr30%). Hence, the decrease in the evapotranspiration is more important in magnitude under a decrease in the number of rain days (Table 2). However, in contrary to Figure 6a,b shows that the soil water flux is more important for the deep layers in the case of the scenario of the decrease in the number of rain days (Nr20%). Thus, infiltrations to the deep soil layers (lower than 100 cm) are more important for the scenarios of the decrease in the number of rain days than in the scenarios of the decrease in the intensity of rainfall (Figure 6b). The weak deep infiltration in the scenario Hr30% in comparison to the scenario Nr20% (Figure 6b) explains the important decrease in groundwater recharge for the scenarios of the decrease in the intensity of rainfalls (Table 2). Jia et al. [38] found from a set of different patterns of rain event that when the ground surface is dry, the infiltration capacity can be high because of the steep matric suction gradient. In the same way, Table 2 shows that the decreases in the discharge intensity are more important with the scenario of the decrease in the intensity of rainfall (Hr17% and Hr30%). Thus, even if the shallow soil layers are very dry for these scenarios (Nr10% and Nr20%), the high intensities of the rainfall (17% and 30% more important) entail a quick saturation of the first centimeters that govern the direct runoff. Hence, the decrease in the maximum discharge intensity is about three times more important for the scenarios of the decrease in the intensity of rainfall (Hr17% and Hr30%) than in the scenarios of the decrease in the number of rain days (Nr10% and Nr20%). These results show that the rainfall pattern significantly influences the cumulative infiltration and runoff under the same total amount of rainfall [40].
Table 2. Relative variations of the hydrological components with ORCHIDEE (ORganising Carbon and Hydrology In Dynamic EcosystEms) under the five scenarios of the changes in rainfall field.
ScenariosRainfall (%)Runoff (%)Groundwater Recharge (%)AET (%)Qmax (%)
Nr10%−17−44−16−16−9
Nr20%−30−69−25−28−16
Hr17%−17−53−28−12−28
Hr30%−30−78−46−23−46
Hi20%20101451449
Decrease of 10% in the number of rain days thereafter designed as Nr10%; decrease of 20% in the number of rain days thereafter designed as Nr20%; decrease of 17% in the intensity of daily rainfall thereafter designed as Hr17%; decrease of 30% in the intensity of daily rainfall thereafter designed as Hr30%; an increase of 20% in the intensity of daily rainfall thereafter designed as Hi20%. Qmax: annual maximum discharge.
Table 3. Relative variations of the hydrological components with GR2M under the five scenarios of the changes in the rainfall field.
ScenariosRainfall (%)Runoff (%)Groundwater Recharge (%)AET (%)Qmax (%)
Nr10%−17−51−34−12−51
Nr20%−30−75−55−22−74
Hr17%−17−55−36−13−56
Hr30%−30−79−59−24−80
Hi20%2097501299
Figure 6. Mean soil water flux evolution under two scenarios during the rainy season for two soil depths. Decrease of 20% in the number of rain days designed as Nr20%; decrease of 30% in the intensity of daily rainfall designed as Hr30%. (a) 0–50 centimeters of the soil layer; (b) 150–200 centimeters of the soil layer.
Climate 03 00442 g006
On the other hand, the scenario of an increase of 20% in the intensity of rainfalls (Hi20%) shows an increase of about three times the annual runoff, twice in the groundwater recharge and in the discharge (Table 2 and Table 3). The magnitude of the impact on runoffs of 20% increase in rainfall is higher than the magnitude due to the decrease of 30% in rainfall. Risbey and Entekhabi [41] explained this difference by the nonlinear response of a watershed to changes in rainfall. Altogether, the hydrological impacts of the different change in rainfall regime with GR2M (Table 3) are similar to the impacts produced by ORCHIDEE in the cases of change in the intensity of rainfall for three components (runoff, groundwater recharge and evapotranspiration). As GR2M is a monthly time-step model, the changes at the daily time steps are computed as a change in the monthly amount of rainfall. However, the magnitudes of the impacts are highly different between the two models for the monthly maximum discharge. The changes are two times more important with GR2M in comparison to ORCHIDEE.

5. Discussion and Summary

The resolution of Equation (2) (hydrological balance) requires data of the different terms in the basin during the analyses period. However, even if most of the parameters can be determined through measurements, it is an arduous task to obtain data on evapotranspiration [36,42,43] and on groundwater recharge [6,11,44]. An approximation is done in this study in comparison with some observations over other areas in West African Sahel in order to determine the annual magnitude of the main terms over Wayen watershed. Thus, the lack of data on actual evapotranspiration and on groundwater recharge leads certainly to a high uncertainty in the determination of the hydrological balance of the basin. Nevertheless, the two different hydrological models, GR2M with the setting procedure and ORCHIDEE, produce two close annual hydrological balances of the basin over the 1978–1999 period. From these models, the evaporation represents the domination factor which returns into the atmosphere the most important part of the rainfall, in the proportion of about 85% of the annual rainfall amount [36,43]. These models show also that groundwater recharge is the second most important component of the hydrological balance over the Wayen watershed in a proportion of about 10% of the annual rainfall. Thus, even if most of the hydrological studies focused on runoff [26,45,46], this hydrological component represents less than 5% [35,38] of the annual rainfall amount. Thus, the two important components of the hydrological balance are the less monitored over the Sahelian Basin [11,38]. In addition, an assessment of the sensitivity of the basin to the climate variability through the hydrological models helped to evaluate the magnitude of the basin responses to changes in rainfall. A decrease of about 20% in the annual rainfall produces from GR2M and ORCHIDEE a decrease of about 60% in runoff and 50% in groundwater recharge. Additionally, from the observations, Mahé [47] reported that, over the Niger affluent of Bani, a decrease of 16% in the annual rainfall amount over post-1970 has entailed a decreased of 62% in the annual runoff at Douna gauge.
The assessment of the hydrological impacts of the five scenarios of changes in the rainfall (two levels of decrease in the number of rain days, two levels of decrease in the intensity of rain days and one level of increase in the intensity of rain days) through the implementation of a fine time-step hydrological model (ORCHIDEE) shows some discrepancies in the magnitude of the impacts. The decrease in the number of rain days translated by a lengthening of dry spells [18] entails long periods of soil drying out. The soil drying entails an increase of the evaporation rate. On the contrary, the case of a decrease in the intensity of rainfall presents short dry spells (in comparison to the first case) with more watering of the shallow soil layers. Through these processes in the soil layers, the fine time-scale hydrological model of ORCHIDEE shows different hydrological impacts for the two different changes in the rainfall field. However, an assessment of the impact of these changes with the monthly model, GR2M, shows almost the same magnitudes of impact for the two types of changes (number of rain days and intensity of rain days). The magnitudes of the impacts from GR2M are only close to the impacts produced by ORCHIDEE in the case of the changes in the intensity of rainfall. Thus, the monthly simulations from the cumulative daily rainfalls cannot highlight the hydrological impacts [48] due to changes in the number of rain days (frequency of rainfall). However, one should keep in mind that the different changes found in this study are an indication of the trends in the evolution of the different hydrological components and do not represent the absolute magnitudes of the impacts.

6. Conclusions

The hydrological functioning of a Sahelian watershed is mainly dominated by the rainfall regime. The modeling of the hydrological functioning of Nakanbe basin in the upstream watershed of Wayen with two models (GR2M and ORCHIDEE) has produced pertinent results during the 1978–1999 period. The two models show that evapotranspiration is the most important hydrological component with a rate of about 85% of the annual rainfall amount. The assessment of the hydrological impacts of a decrease in the annual rainfall amount due to two different changes in the rainfall field (number of rain events and intensity of rain events) with ORCHIDEE shows that the decrease in the number of rain events produces a more important decrease in the hydrological components. This model shows that the infiltration processes through the soil layer (vadose zone) determine the magnitude of the hydrological impacts of the different changes in rainfall field. However, a monthly hydrological model could evaluate only the hydrological impacts due to changes in the intensity of rain events and not for the changes in the frequency of rain events. Altogether, efficient water resources management under the climate change condition has to take into account the changes in the rainfall field and the exchanges between the surface processes and the underground processes.

Acknowledgments

The work has been supported by the EU FP6 AMMA project (http://www.amma-international.org/spip.php?rubrique2). The authors would like to thank the water resources service DGRE (Direction General des Ressources en Eau) of Burkina Faso for providing us the discharge data and all the contributors of AMMA-ENSEMBLE simulations. We also thank the two anonymous reviewers whose contributions and suggestions helped us to improve the paper.

Author Contributions

Boubacar Ibrahim conceived the study and processed all the data. Harouna Karambiri corrected the paper and contributed to the data analysis. Jan Polcher made the simulations with ORCHIDEE and contributed to the climate data analysis.

Conflicts of Interest

The authors declare no conflict of interest.

References

  1. Nicholson, S.; Palao, I. A re-evaluation of rainfall variability in the Sahel. Part I. haracteristics of rainfall fluctuations. Int. J. Climatol. 1993, 13, 371–389. [Google Scholar] [CrossRef]
  2. Paturel, J.; Boubacar, I.; L’Aour, A.; Mahé, G. Analyses de grilles pluviométriques et principaux traits des changements survenus au 20ème siècle en Afrique de l’Ouest et Centrale. Hydrol. Sci. J. 2010, 55, 1281–1288. (In French) [Google Scholar] [CrossRef]
  3. Bricquet, J.; Bamba, F.; Mahé, G.; Toure, M.; Olivry, J. Évolution récente des ressources en eau de l’Afrique atlantique. Rev. Sci. Eau. 1997, 3, 321–337. [Google Scholar] [CrossRef]
  4. Servat, É.; Paturel, J.; Lubes-Niel, H.; Kouame, B.; Travaglio, M.; Marieu, B. De la diminution des écoulements en Afrique de l’Ouest et centrale. C. R. Acad. Sci. Ser. IIA-Earth Planet. Sci. 1997, 325, 679–682. [Google Scholar]
  5. Paturel, J.; Barrau, C.; Mahé, G.; Dezetter, A.; Servat, E. Modelling the impact of climatic variability on water resources in West and Central Africa from a non-calibrated hydrological model/Modélisation d’impact de la variabilité climatique en Afrique de l’Ouest et Centrale à partir d'un modèle hydrologique non calibré. Hydrol. Sci. J. 2002, 752, 38–48. [Google Scholar]
  6. Mahé, G. Surface/groundwater interactions in the Bani and Nakambe rivers, tributaries of the Niger and Volta basins, West Africa. Hydrol. Sci. J. 2009, 54, 704–712. [Google Scholar] [CrossRef]
  7. Olivry, J.; Briquet, J.; Mahé, G. de l’évolution de la puissance des crues des grands cours d'eau intertropicaux d’Afrique depuis deux décennies. Rev. Géogr. Alp. 1994, 12, 101–108. [Google Scholar]
  8. De Vries, J.; Simmers, I. Groundwater recharge: An overview of processes and challenges. Hydrogeol. J. 2002, 10, 5–17. [Google Scholar] [CrossRef]
  9. Schuol, J.; Abbaspour, K.; Srinivasan, R.; Yang, H. Estimation of freshwater availability in the West African sub-continent using the SWAT hydrologic model. J. Hydrol. 2008, 352, 30–49. [Google Scholar] [CrossRef]
  10. Aranyossi, J.; Ndiaye, B. Etude et modélisation de la formation des dépressions piézométriques en Afrique sahélienne. Rev. Sci. Eau/J. Water Sci. 1993, 6, 81–96. [Google Scholar] [CrossRef]
  11. Sandwidi, J. Groundwater Potential to Supply Population Demand within the Kompienga Dam Basin in Burkina Faso. Ph.D. Thesis, Rheinischen Friedrich-Wilhelms-Universität, Bonn, Allemagne, 2007. [Google Scholar]
  12. De Condappa, D.; Chaponnière, A.; Lemoalle, J. A decision-support tool for water allocation in the Volta Basin. Water Int. 2009, 34, 71–87. [Google Scholar] [CrossRef]
  13. Nakicenovic, N.; Swart, R. Special Report on Emissions Scenarios; Cambridge University Press: Cambridge, UK, 2000. [Google Scholar]
  14. Ibrahim, B.; Polcher, J.; Karambiri, H.; Rockel, B. Characterization of the rainy season in Burkina Faso and it’s representation by regional climate models. Clim. Dyn. 2012, 39, 1287–1302. [Google Scholar] [CrossRef] [Green Version]
  15. Hulme, M.; Doherty, R.; Ngara, T.; New, M.; Lister, D. African climate change: 1900–2100. Clim. Res. 2001, 17, 145–168. [Google Scholar] [CrossRef]
  16. De Wit, M.; Stankiewicz, J. Changes in surface water supply across Africa with predicted climate change. Science 2006, 311, 1917–1921. [Google Scholar] [CrossRef] [PubMed]
  17. Paeth, H.; Born, K.; Girmes, R.; Podzun, R.; Jacob, D. Regional climate change in tropical and northern Africa due to greenhouse forcing and land use changes. J. Clim. 2009, 22, 114–132. [Google Scholar] [CrossRef]
  18. Ibrahim, B.; Karambiri, H.; Polcher, J.; Yacouba, H.; Ribstein, P. Changes in rainfall regime over Burkina Faso under the climate change conditions simulated by 5 regional climate models. Clim. Dyn. 2014, 42, 1363–1381. [Google Scholar] [CrossRef] [Green Version]
  19. Karambiri, H.; García Galiano, S.; Giraldo, J.; Yacouba, H.; Ibrahim, B.; Barbier, B.; Polcher, J. Assessing the impact of climate variability and climate change on runoff in West Africa: The case of Senegal and Nakambe River basins. Atmos. Sci. Lett. 2011, 12, 109–115. [Google Scholar] [CrossRef] [Green Version]
  20. Ruelland, D.; Ardoin-Bardin, S.; Collet, L.; Roucou, P. Simulating future trends in hydrological regime of a large Sudano-Sahelian catchment under climate change. J. Hydrol. 2012, 424–425, 207–216. [Google Scholar] [CrossRef]
  21. Ardoin-Bardin, S.; Dezetter, A.; Servat, E.; Paturel, J.; Mahe, G.; Niel, H.; Dieulin, C. Using general circulation model outputs to assess impacts of climate change on runoff for large hydrological catchments in West Africa. Hydrol. Sci. J. 2009, 54, 77–89. [Google Scholar] [CrossRef]
  22. Diello, P. Interrelations Climat-Homme-Environnement dans le Sahel Burkinabé: Impacts sur les états de Surface et la Modélisation Hydrologique. Ph.D. Thesis, Université de Montpellier II, Sciences et Techniques du Languedoc, Hérault, France, 2007. [Google Scholar]
  23. Paturel, J.; Boubacar, I.; L’Aour, A.; Mahé, G. Note de recherche: Grilles mensuelles de pluie en Afrique de l’Ouest et Centrale. Rev. Sci. Eau. 2010, 23, 325–333. [Google Scholar] [CrossRef]
  24. Weedon, G.; Gomes, S.; Viterbo, P.; Shuttleworth, W.; Blyth, E.; Österle, H.; Adam, J.; Bellouin, N.; Boucher, O.; Best, M. Creation of the WATCH Forcing Data and its use to assess global and regional reference crop evaporation over land during the twentieth century. J. Hydrometeor. 2011, 12, 823–848. [Google Scholar] [CrossRef]
  25. The ENSEMBLES Project RT3. Available online: http://ensemblesrt3.dmi.dk/ (accessed on 23 June 2015).
  26. Beven, K. Rainfall-Runoff Modeling; Wiley Online Library: Hoboken, NJ, USA, 2001. [Google Scholar]
  27. Mahé, G.; Paturel, J.; Servat, E.; Conway, D.; Dezetter, A. The impact of land use change on soil water holding capacity and river flow modelling in the Nakambe River, Burkina-Faso. J. Hydrol. 2005, 300, 33–43. [Google Scholar] [CrossRef]
  28. Mouelhi, S.; Michel, C.; Perrin, C.; Andreassian, V. Stepwise development of a two-parameter monthly water balance model. J. Hydrol. 2006, 318, 200–214. [Google Scholar] [CrossRef]
  29. D’Orgeval, T. Impact du Changement Climatique sur le Cycle de l’eau en Afrique de l’Ouest: Modelisation et Incertitude. Ph.D. Thesis, Université Pierre et Marie Curie, Paris, France, 2006. [Google Scholar]
  30. IRSTEA | Irstea. Available online: http://www.irstea.fr/ (accessed on 23 June 2015).
  31. De Rosnay, P. Représentation de L’interaction Sol-Végétation-Atmosphère Dans le Modèle de Circulation Générale du Laboratoire de Meteorologie Dynamique. Ph.D. Thesis, Université Pierre et Marie Curie, Paris, France, 1999. [Google Scholar]
  32. Nash, J.; Sutclie, J. River flow forecasting through conceptual models. Part I: A discussion of principle. J. Hydrol. 1970, 10, 282–290. [Google Scholar] [CrossRef]
  33. Paturel, J.; Ouedraogo, M.; Mahé, G.; Servat, E.; Dezetter, A.; Ardoin, S. The influence of distributed input data on the hydrological modelling of monthly river flow regimes in West Africa. Hydrol. Sci. J. 2003, 48, 881–890. [Google Scholar] [CrossRef]
  34. Mahé, G.; Girard, S.; New, M.; Paturel, J.; Cres, A.; Dezetter, A.; Dieulin, C.; Boyer, J.; Rouche, N.; Servat, E. Comparing available rainfall gridded datasets for West Africa and the impact on rainfall-runoff modelling results, the case of Burkina-Faso. Water Sa 2008, 34, 529–536. [Google Scholar]
  35. Dakouré, D. Etude Hydrogéologique et Géochimique de la Bordure Sud-Est du Bassin Sédimentaire de Taoudéni (Burkina Faso—Mali)—Essai de modélisation. Ph.D. Thesis, Université Paris 6—Pierre et Marie Curie, Paris, France, 2003. [Google Scholar]
  36. Dérive, G. Estimation de L’évapotranspiration en Région Sahélienne. Synthèse des Connaissances et Evaluation de Modélisations (SISVAT, RITCHIE): Appllication à la zone d’Hapex-Sahel (Niger). Ph.D. Thesis, Institut National Polytechnique de Grenoble, Valence, France, 2003. [Google Scholar]
  37. Martin, N. Development of a Water Balance for the Atankwidi Catchment, West Africa: A Case Study of Groundwater Recharge in a Semi-Arid Climate. Center for Development Research, University of Bonn: Bonn, Germany, 2006. [Google Scholar]
  38. Vissin, E. Impact de la Variabilité Climatique et de la Dynamique des états de Surface sur les Ecoulements du Bassin Béninois du Fleuve Niger. Ph.D. Thesis, Université de Bourgogne, Dijon, France, 2007. [Google Scholar]
  39. Ibrahim, B. Caractérisation des Saisons de Pluies au Burkina Faso Dans un contexte de Changement Climatique et Evaluation des Impacts Hydrologiques sur le Bassin du Nakanbé. Ph.D. Thesis, Université Pierre et Marie Curie, Paris, France, 2012. [Google Scholar]
  40. Jia, G.W.; Zhan, T.L.T.; Chen, Y.M.; Fredlund, D.G. Influence of rainfall pattern on the infiltration into landfill earthen final cover. In Proceedings of the 2009 International Symposium on Geoenvironmental Engineering, Hangzhou, China, 8–10 September 2009.
  41. Risbey, J.S.; Entekhabi, D. Observed Sacramento Basin streamflow response to precipitation and temperature changes and its relevance to climate impact studies. J. Hydrol. 1996, 184, 209–223. [Google Scholar]
  42. Brunel, J.; Bouron, B. Evaporation des Nappes d’eau Libres en Afrique Sahélienne et Tropicale; Publications CIEH-ORSTOM: Montpellier, France, 1992. (In French) [Google Scholar]
  43. Wallace, J.; Holwill, C. Soil evaporation from tiger-bush in South-West Niger. J. Hydrol. 1997, 188, 426–442. [Google Scholar] [CrossRef]
  44. Milville, F. Etude hydrodynamique et quantication de la recharge des aquifères en climat Soudano-Sahélien: Application a un bassin expérimental au Burkina Faso, in soil water balance in the Sudano-Sahelian zone. In Proceedings of 1991 International Workshop, Niamey, Niger, 18–23 February 1991. (In French)
  45. Vischel, T.; Lebel, T. Assessing the water balance in the Sahel: Impact of small scale rainfall variability on runoff. Part 2: Idealized modeling of runoff sensitivity. J. Hydrol. 2007, 333, 340–355. [Google Scholar] [CrossRef]
  46. Ruelland, D.; Levavasseur, F.; Tribotté, A. Patterns and dynamics of land-cover changes since the 1960s over three experimental areas in Mali. Int. J. Appl. Earth Obs. Geoinf. 2010, 12, S11–S17. [Google Scholar] [CrossRef]
  47. Mahé, G.; Paturel, J. 1896–2006 Sahelian annual rainfall variability and runoff increase of Sahelian Rivers. C. R. Geosci. 2009, 341, 538–546. [Google Scholar] [CrossRef]
  48. Prudhomme, C.; Reynard, N.; Crooks, S. Downscaling of global climate models for flood frequency analysis: where are we now? Hydrol. Proc. 2002, 16, 1137–1150. [Google Scholar] [CrossRef]

