Article

Urban-Induced Mechanisms for an Extreme Rainfall Event in Beijing China: A Satellite Perspective

1
Department of Meteorology and Climate Science, San José State University, San José, CA 95112, USA
2
Department of Geography and Geoinformation Science, George Mason University, Fairfax, VA 22030, USA
3
Beijing Weather Bureau, Beijing 100843, China
*
Author to whom correspondence should be addressed.
Climate 2015, 3(1), 193-209; https://doi.org/10.3390/cli3010193
Submission received: 3 September 2014 / Revised: 30 January 2015 / Accepted: 3 February 2015 / Published: 4 March 2015
(This article belongs to the Special Issue Changes in Precipitation and Impacts on Regional Water Resources)

Abstract

:
Using 1 km satellite remote sensing observations, this paper examines the clouds, aerosols, water vapor and surface skin temperature over Beijing to understand the possible urban system contributions to the extreme rainfall event on 21 July 2012 (i.e., 721 event). Remote sensing measurements, with the advantage of high spatial resolution and coverage, reveal three key urban-related mechanisms: (a) the urban heat island effect (UHI) resulted in strong surface convection and high level cloud cover over Beijing; (b) urban aerosol amount peaked before the rainfall, which “seeded” the clouds and invigorated precipitation; and (c) urban tall buildings provided additional lift for the air mass and provided heat at the underlying boundary to keep the rainfall system alive for a long duration precipitation (>10 hours). With the existing rainfall system moving from the northwest and abundant water vapor was transported from the southeast into Beijing, the urban canyon-lifting, aerosol, and UHI effects all enhanced this extreme rainfall event. This work proves that urban system is responsible, at least partly, for urban rainfall extremes and thus should be considered for urban extreme rainfall prediction in the future.

1. Introduction

On 21 July 21 2012, Beijing, the capital of China was damaged by disastrous flooding from the heaviest rainfall the last 61 years (1952–2012). The death toll was 77 people and economic damage was over 10 billion US dollars. Rainfall extremes, in particular, over big cities severely threaten human life. In a warming climate, such extreme events are expected to occur more frequently [1]. In order to understand, predict, and protect from such extreme events in the future, research on the mechanisms using as many as measurements and approaches is essential.
This rainfall event had some unique features worth noting: (a) It was a long duration event. Normal summer rain storms over Beijing last 2–5 hours [2,3,4,5,6,7], but this system stalled in Beijing for more than 10 hours and even up to 20 hours over some regions [6,7]. We hypothesize that the urban system can “trap” rainfall system via thermal convection, building lift, when abundant water supply was available. Niyogi et al. [8] and Shepherd et al. [9] have found evidence that pre-existing precipitating convective systems can be enhanced or modified by the urban environment. In the Atlanta case examined by Shepherd et al. [9], it was one of the most severe flood events in the city’s history. (b) The rainfall intensity exhibited a great degree of heterogeneity. The west and south stations (Men Tougou, Fang Shan, Chang Ping) reached intensities above 50 mm/hr, while the rainfall intensities above the north stations (e.g., Mi Yun) were less than 20 mm/hr; (c) Discrete rainfall cluster formed and re-formed during the event. For example, the west of Beijing (Men Tougou) reached peaks at 13–14 LT as well as at 17–18 LT, suggesting the reformation of the rainfall cluster.
Studies have focused on mesoscale circulation and large-scale dynamics using ground observation, radar image, reanalysis and forecasting model [6,7,10]. Nevertheless, two perspectives have not been adequately studied yet: one is possible urban contributions to this rainfall event and another is the use of satellite remote sensing. The former addresses dynamics and microphysical processes of rainfall and the latter is a new approach providing independent and high coverage measurements related to aerosol-cloud-rainfall interactions.
Following Easterling et al. [11] extreme rainfall is identified as: (a) extreme high values of daily accumulated amount, which can be assessed using standard climate statistics on multi-year records; and (b) event-driven extremes, such as those related to hurricanes.
This paper aims to (a) determine the extreme values of the Beijing 721 rainfall event from satellite remote sensing, and more importantly, (b) study the urban-induced mechanisms, via satellite observations, that are responsible for rainfall extremes beyond topographic forcing and mesoscale circulation.
The National Aeronautics and Space Administration (NASA) Earth Observing System (EOS) Terra and Aqua Moderate Resolution Imaging Spectroradiometer (MODIS) provides a 13-year (April 2000–present), 4-times-per-day (Terra was launched in 2000, and data from Terra MODIS is from April 2000–present. Aqua is launched in 2002) land skin temperature (Tskin) [12,13] together with other critical land surface and atmosphere observations including land cover, vegetation index, snow coverage, clouds, water vapor, and aerosols [14,15,16,17,18,19]. In addition, these long-duration observations have high spatial resolution (1 km and sampled to 5 km) and global coverage.
The Tropical Rainfall Measuring Mission (TRMM) is a joint program between USA and Japan to monitor precipitation system. Rainfall amount and rainfall frequency are collected from 1998 to present at 3 hours interval each day. The spatial coverage of TRMM is 39°N–39°S. Nevertheless, the Multi-satellite Precipitation Analysis (TMPA) blends data from other satellites to extend latitudinal coverage and spatio-temporal resolution [20]. This study uses 3 hourly, 0.25 degree TMPA rainfall data. Together with MODIS, TRMM provides a unique research opportunity to assess this 721 extreme rainfall event.
Surface rainfall extremes are induced by variety of forcing mechanisms, including mesoscale convention, large-scale circulation and topography. This paper explores the possible contributions of urbanization. TRMM observations show that a rainfall system moved toward Beijing from the northwest around 19 July 2012 and reached Beijing on 21 July 21 2012. Meanwhile, abundant water vapor was advected from the south of Beijing to this region [6] via the subtropical high level circulation. In addition to mesoscale and dynamic processes discussed by previous researchers [5,7,10,21,22], satellite remote data reveal three key urban-related mechanisms [9] which are hypothesized to be relevant for this extreme event:
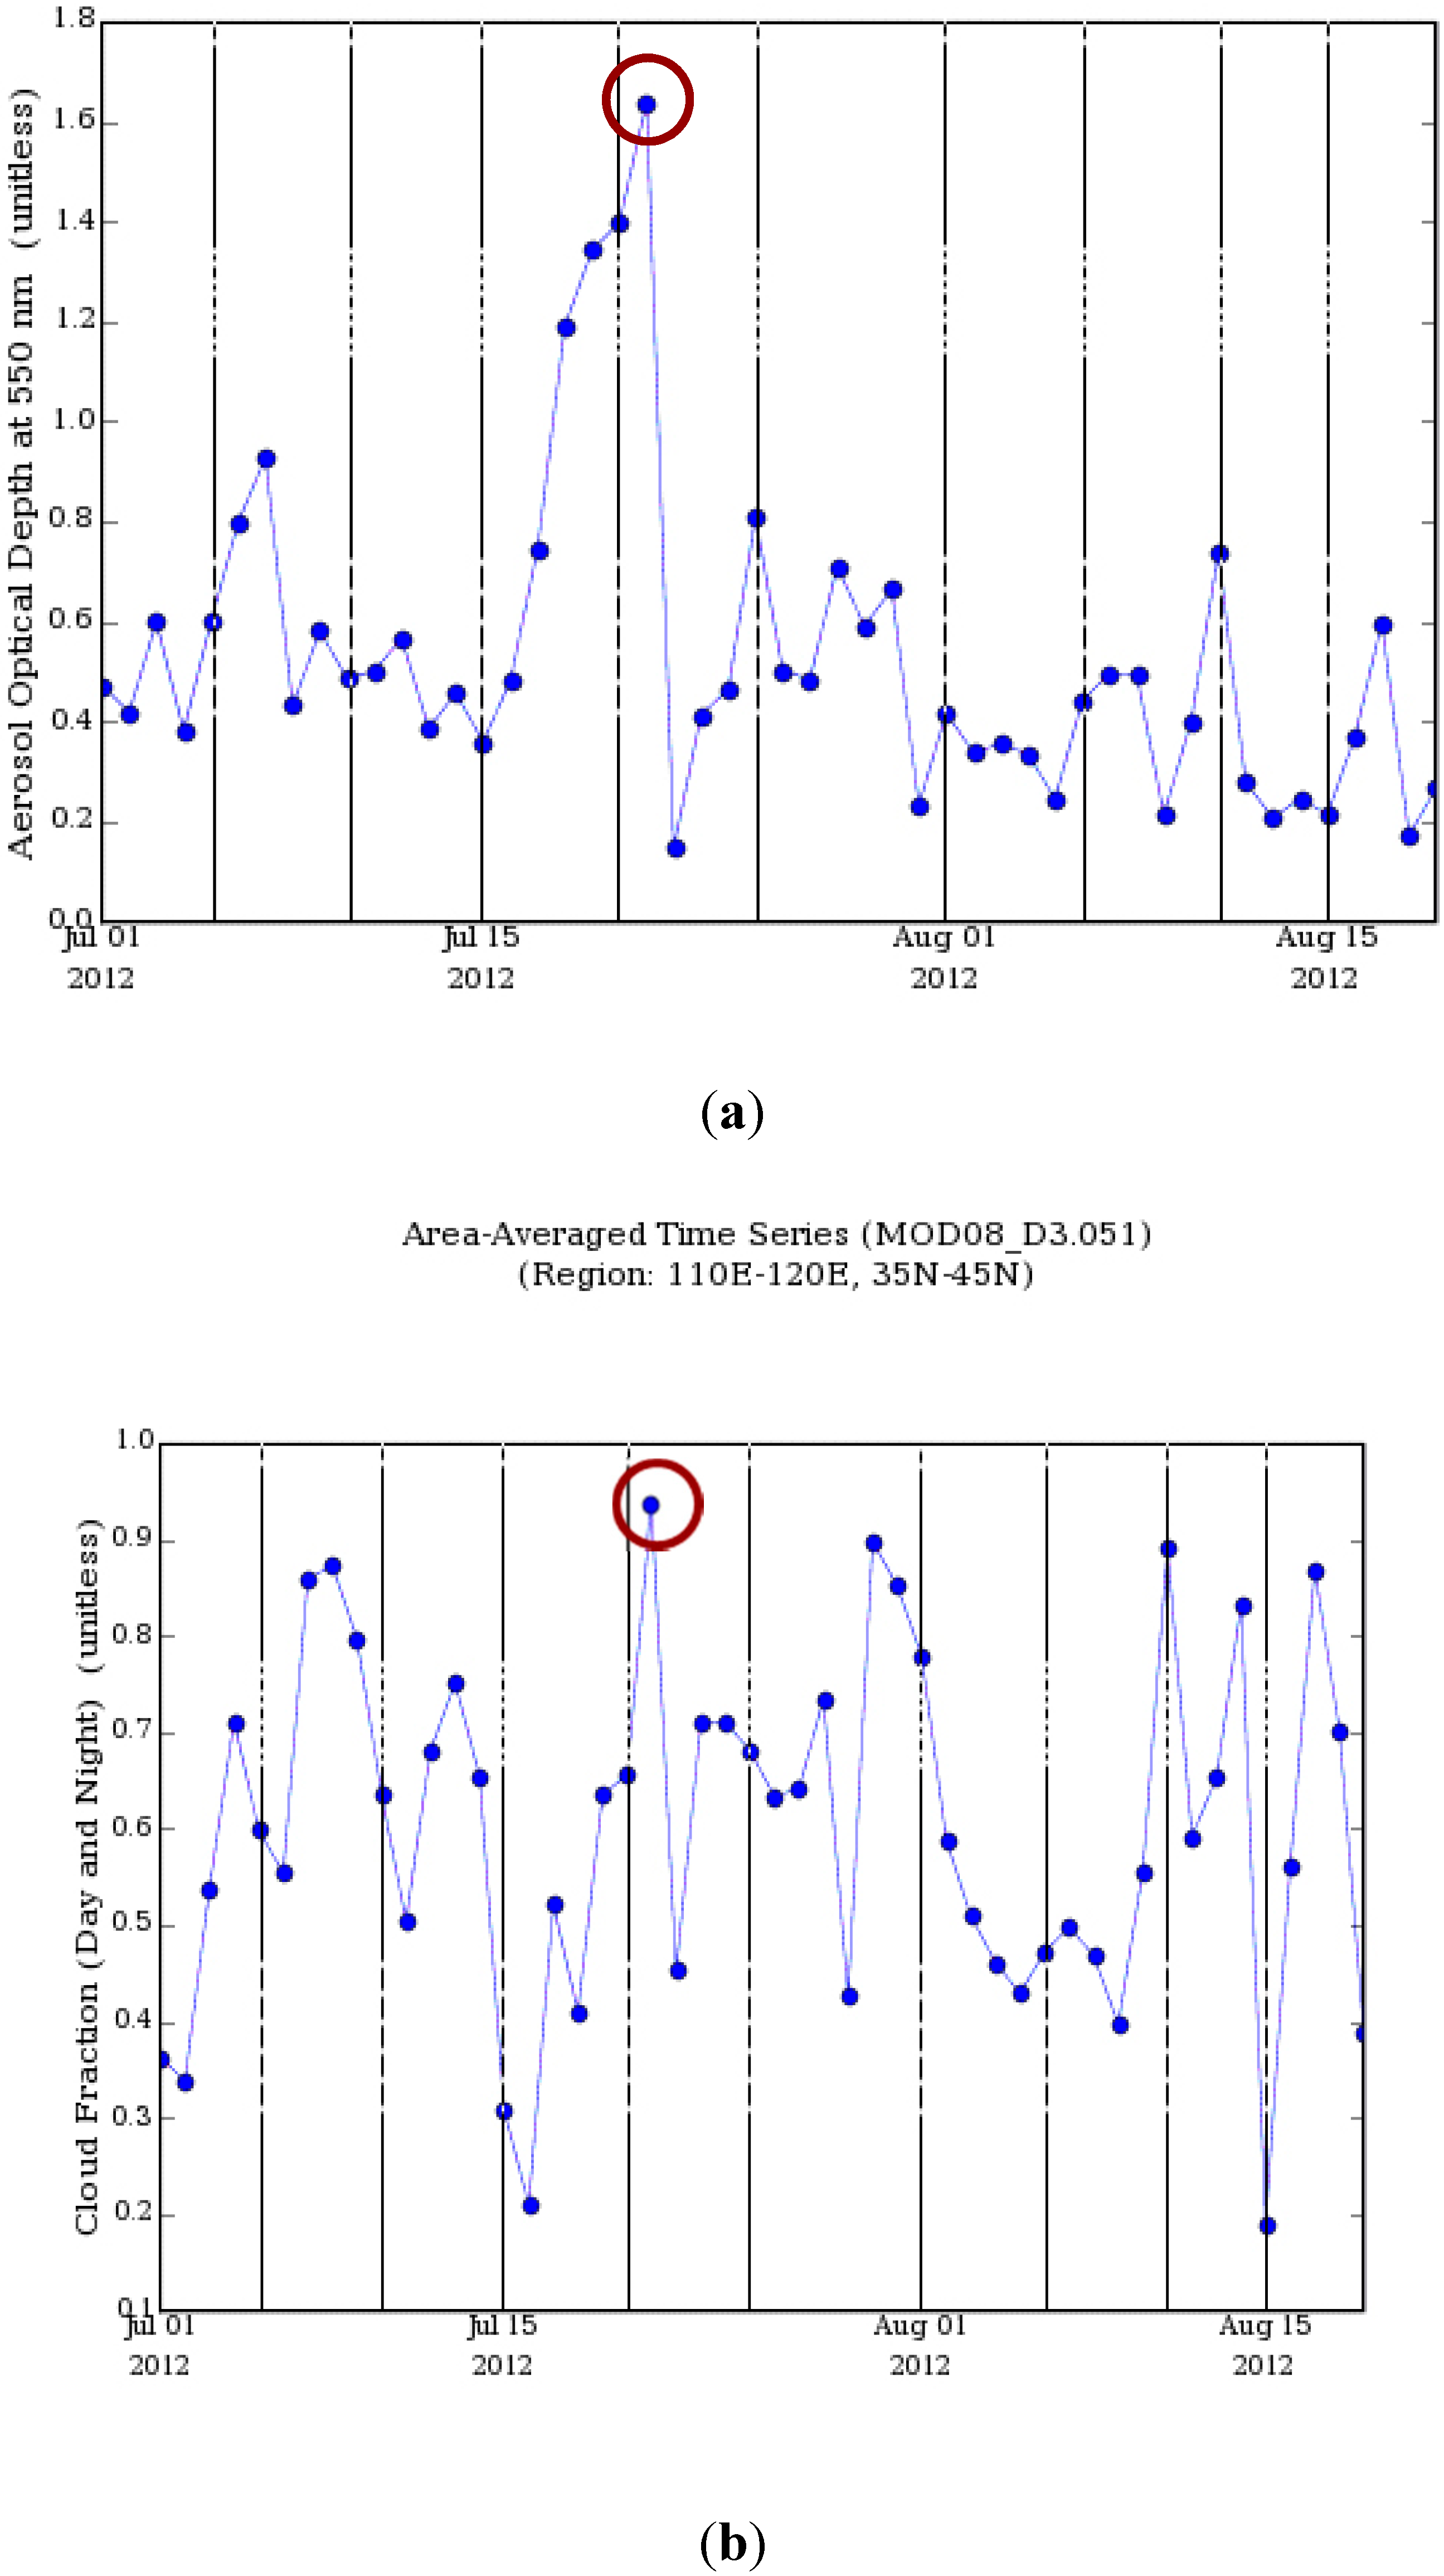
  • Urban aerosol-cloud-rainfall mechanism: Beijing has a large amount of aerosols. These aerosols serve as cloud condensation nuclei to form clouds and rainfall (e.g., aerosol indirect effect) [23,24]. Aerosol optical thickness (AOT) and cloud fraction were extremely high before the 721 event, implying this mechanism;
  • UHI-convection mechanism: Urban heat island effect (UHI) means the urban surface is hotter than surrounding regions. As a result, the UHI changes the temperature gradient at the surface, forms strong surface convection, and modifies local and regional circulations (so-called “urban canyon”);
  • Urban canyon-lifting effect: Urban tall buildings force mechanical turbulence (and therefore convergence), enhance cloud formation, and consequently strengthen rainfall.
Mechanisms b and c favor rainfall. However, aerosols may enhance rainfall or may suppress rainfall. More CCN will lead a large population of smaller cloud droplets, which require more time to grow to raindrop size [25]. In addition, a large percentage of urban aerosols is soot, which absorbs longwave radiation to heat atmosphere and clouds. Therefore, clouds may dissipate (e.g., Semi-direct effect) [26]. Since the 721 event is hypothesized result of all these mechanisms, it may suggest that the collective effect of urban system enhanced this extreme event.
Section 2 describes the data sets used in this paper. Section 3 examines the conditions of aerosols, clouds, water vapor and skin temperature before and after the 721 event. Section 4 discusses urban mechanisms and uncertainties of using satellite data in studies of this nature.

2. Data

2.1. TRMM Precipitation Data

TRMM was launched in November 1997 to monitor tropical rainfall. The TRMM Multi-satellite Precipitation Analysis (TMPA) blends TRMM, other passive microwave instruments, and geosynchronous infrared data to produce a multi-satellite dataset with spatial resolution of 0.25°× 0.25° and a temporal resolution of 3-hours [20]. TMPA is computed twice: first as an experimental product about 9 hours after real time; second as a research-quality product (calibrated with ground based rain gauge data) about 10–15 days after each month, these are referred to as the real-time and research products, respectively. This dataset is available since 1998 and it covers 50°S–50°N. The new version 7 of TMPA-RT, which is used for this extreme case in Beijing, was released on June 25, 2012 UTC. TMPA is viable at daily and monthly scales.

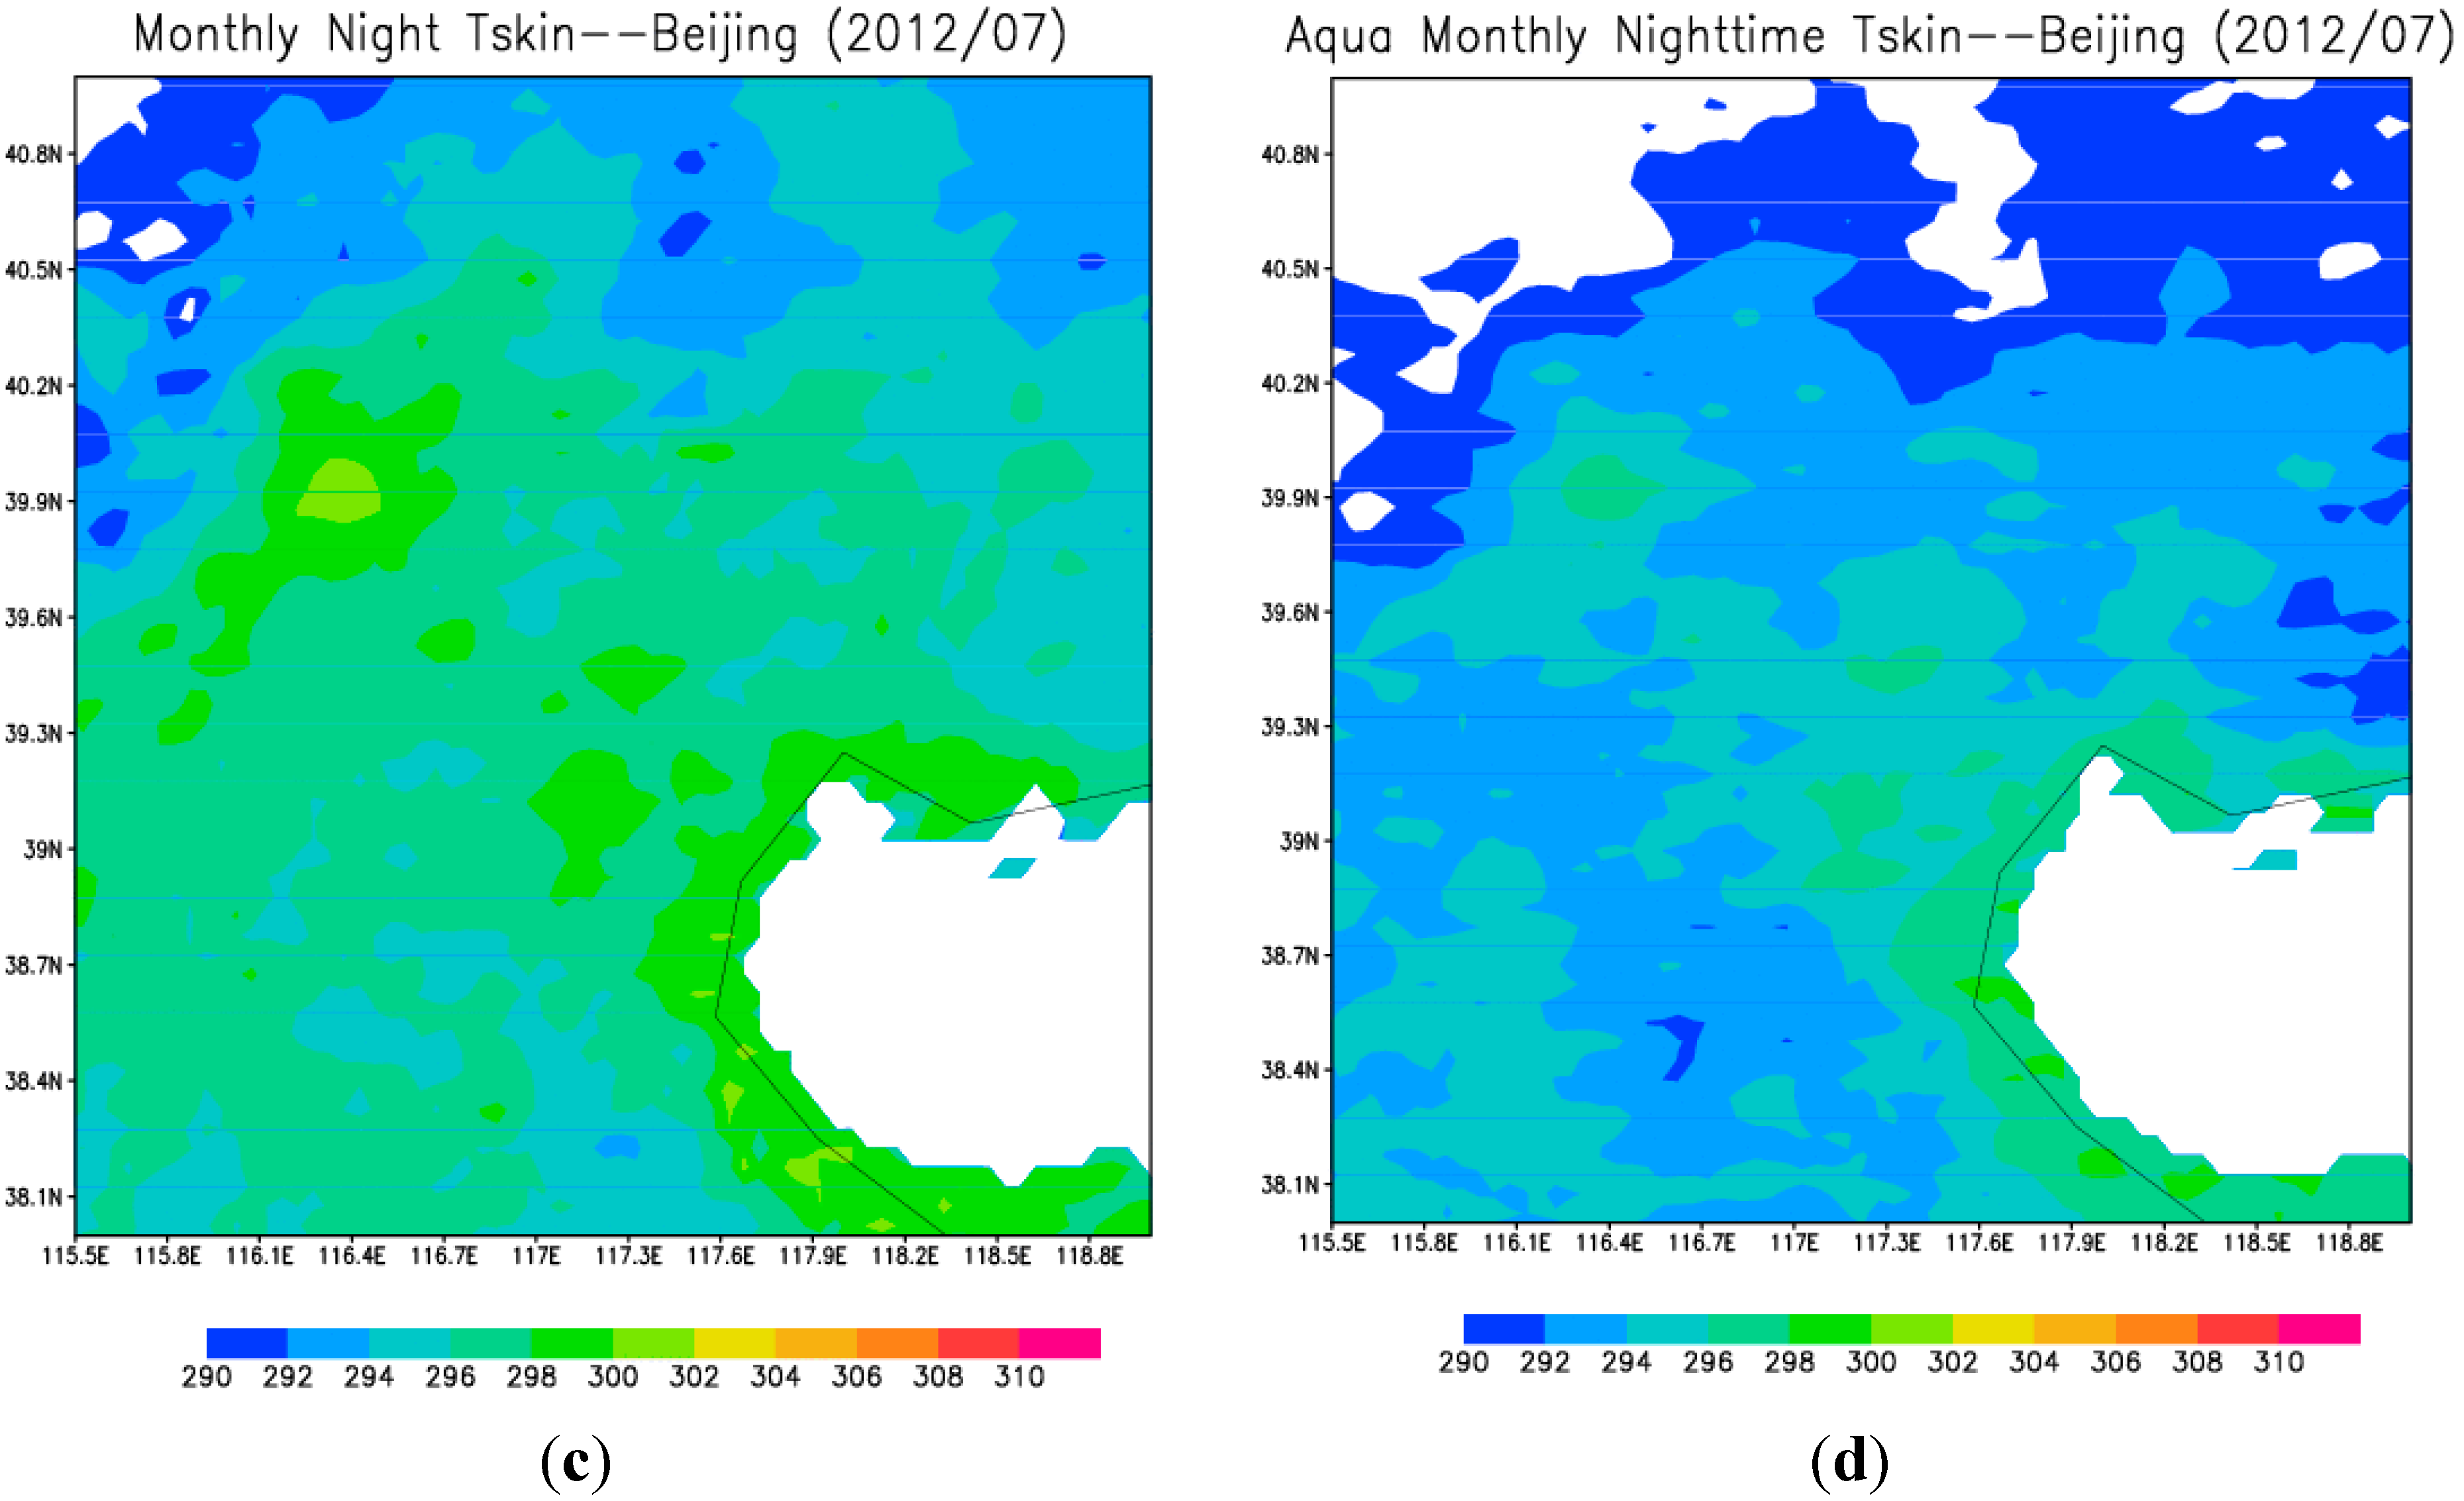
2.2. MODIS Skin Temperature Data

NASA MODIS 4-time-per-day Tskin measurements are analyzed to reveal the coverage and intensity of UHI. Tskin is the radiometric temperature derived from surface longwave emission. This temperature is closely related to land surface radiative properties [12]. The Tskin data is from NASA Terra MODIS and Aqua MODIS at local time 10:30 AM, 10:30 PM (Terra) and 1:30 AM, 1:30 PM (Aqua), respectively.

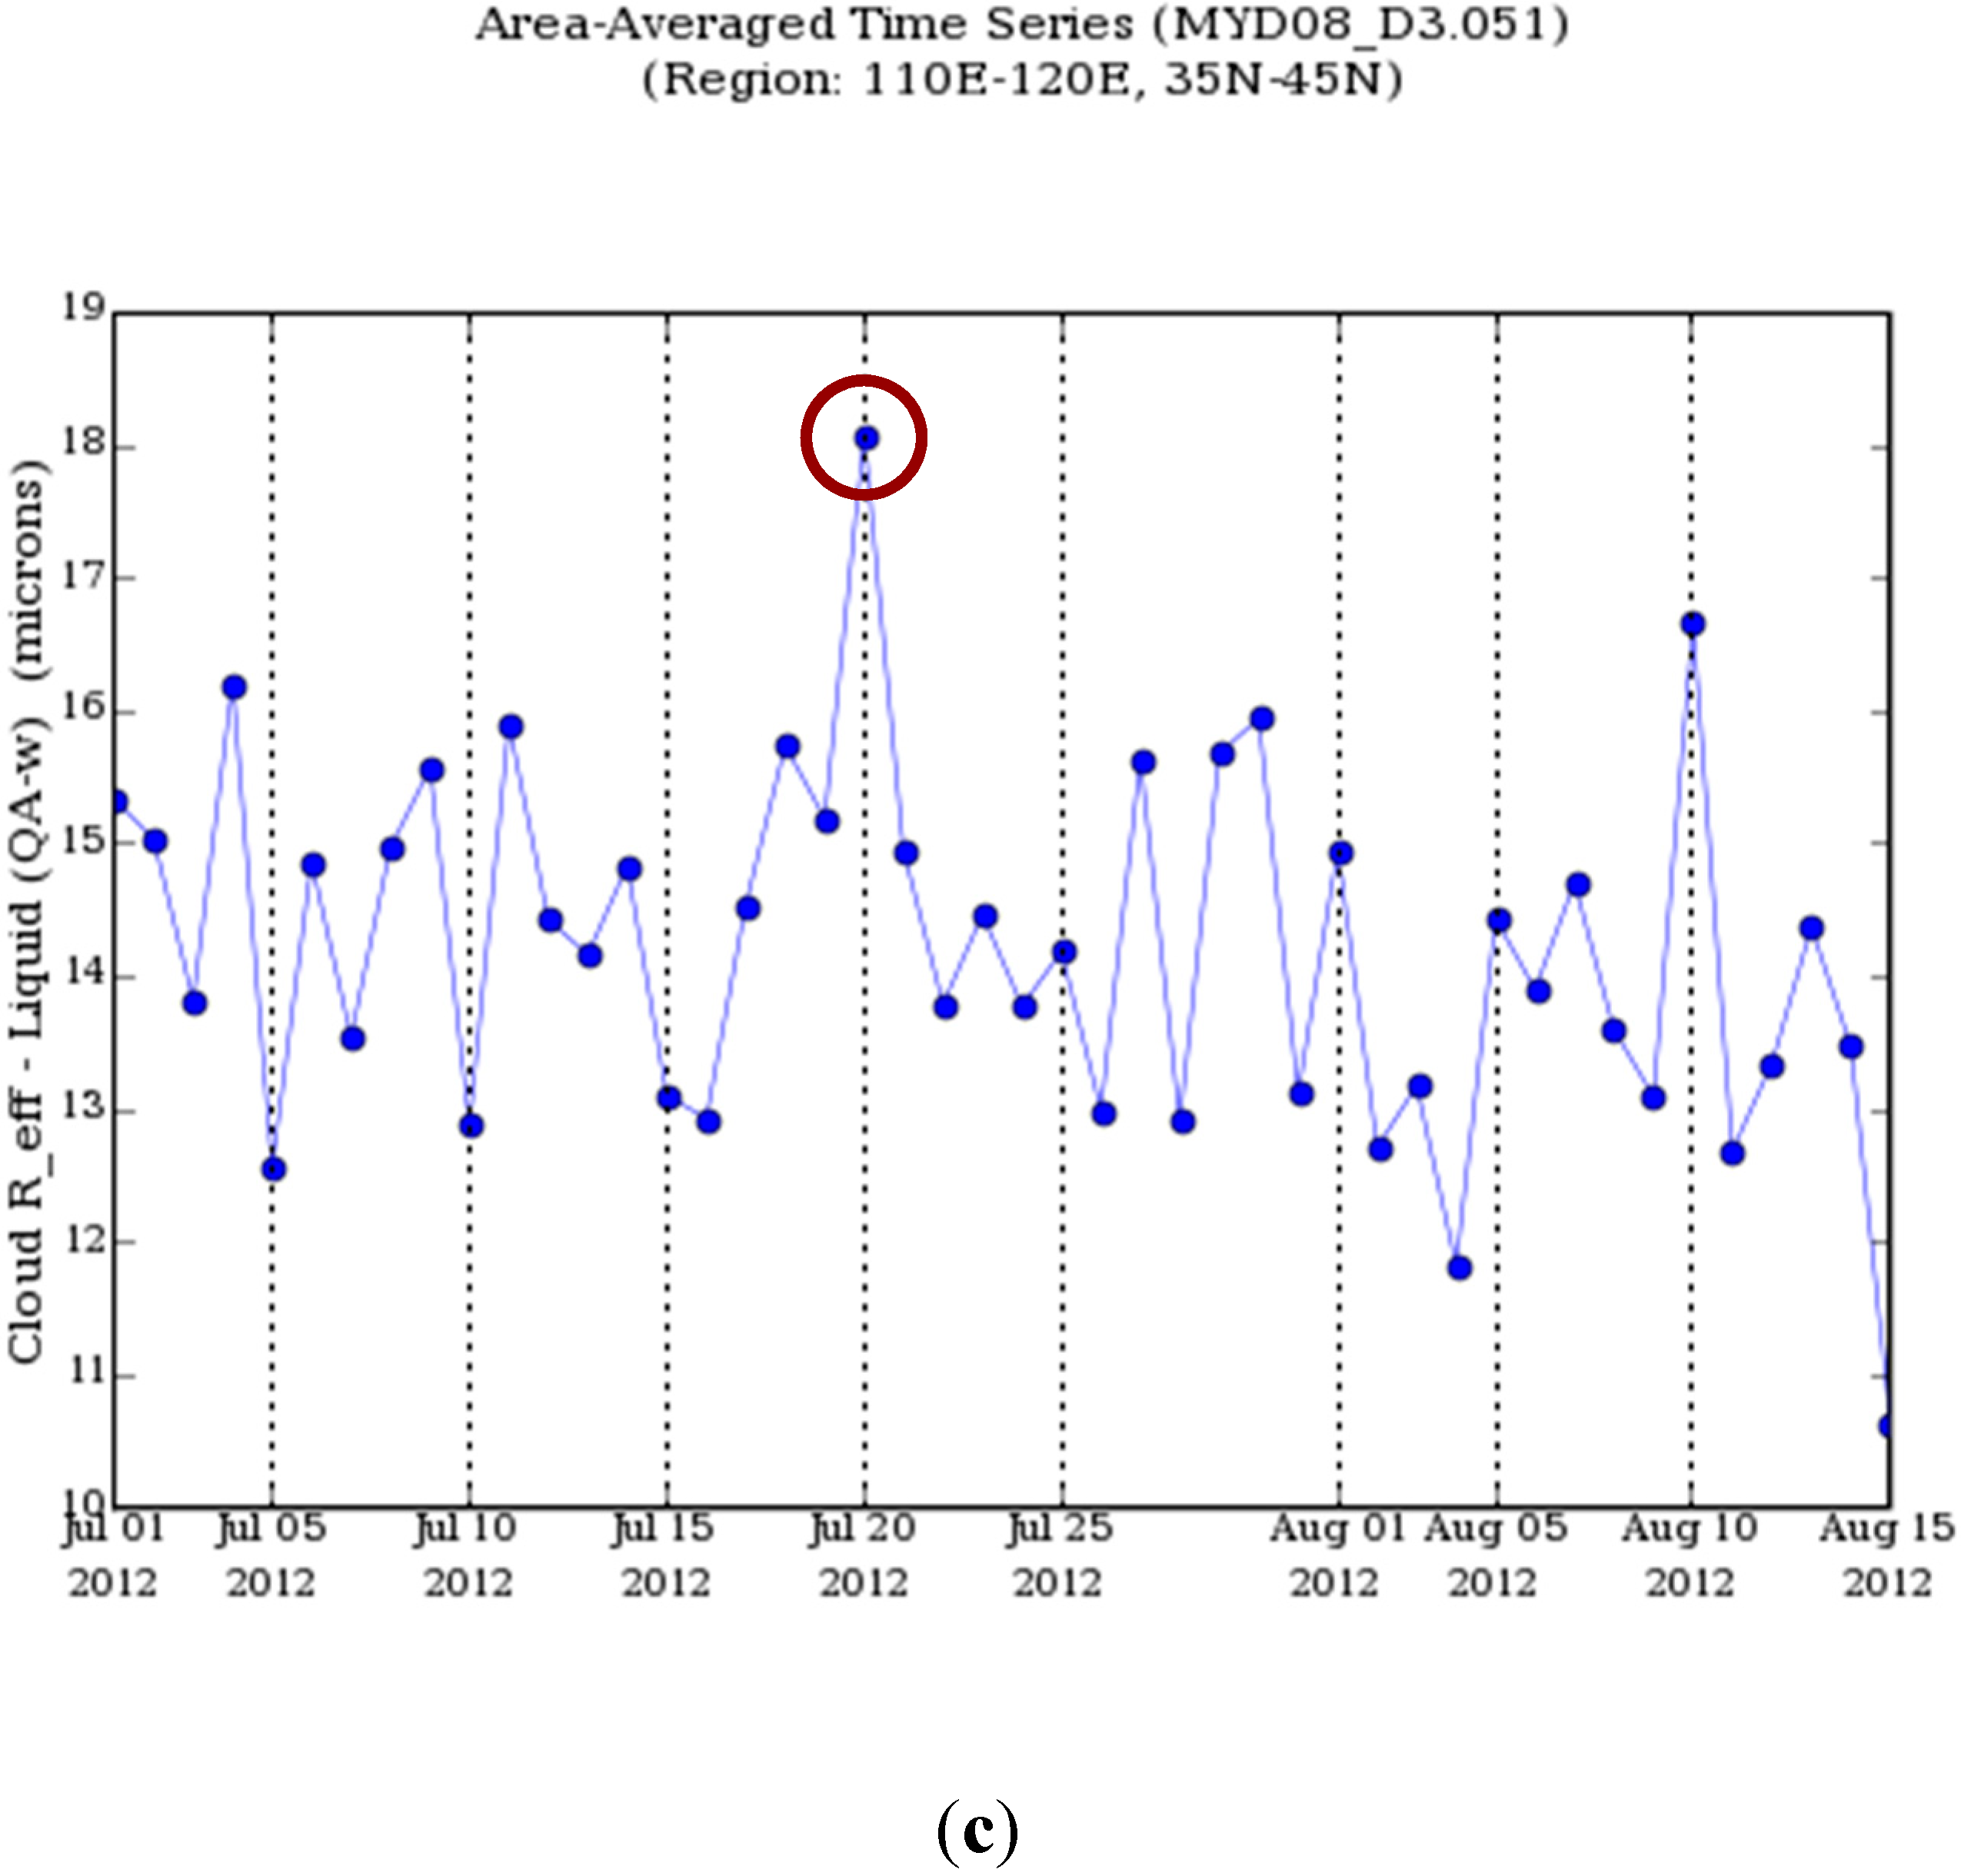
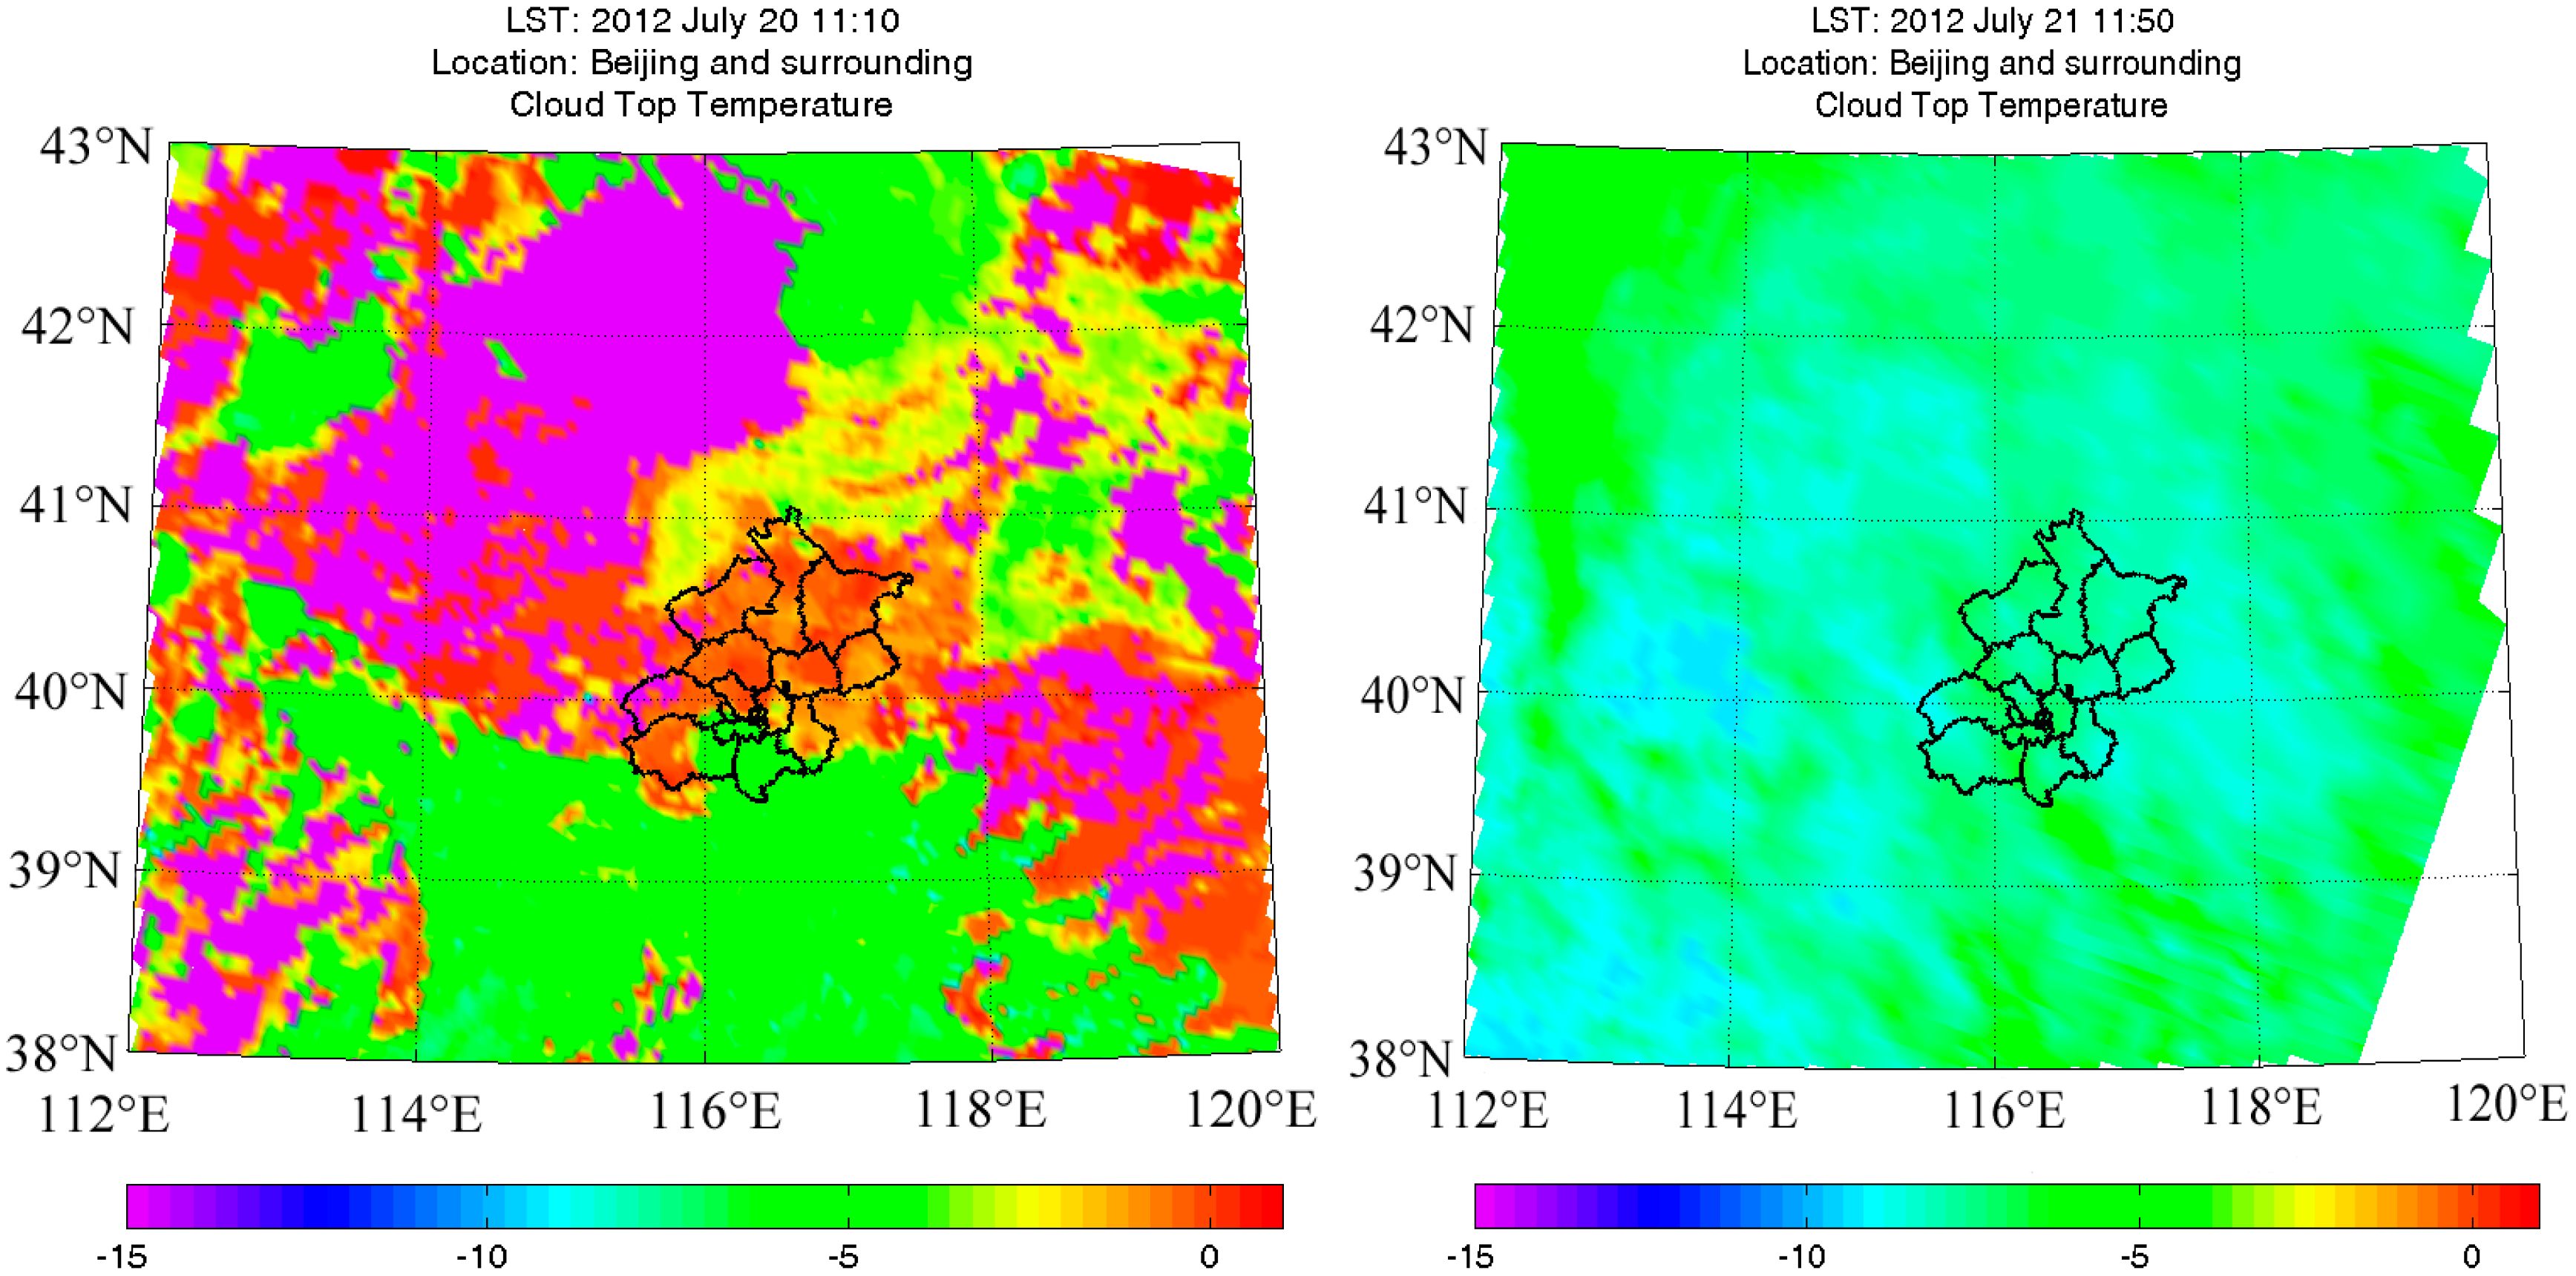
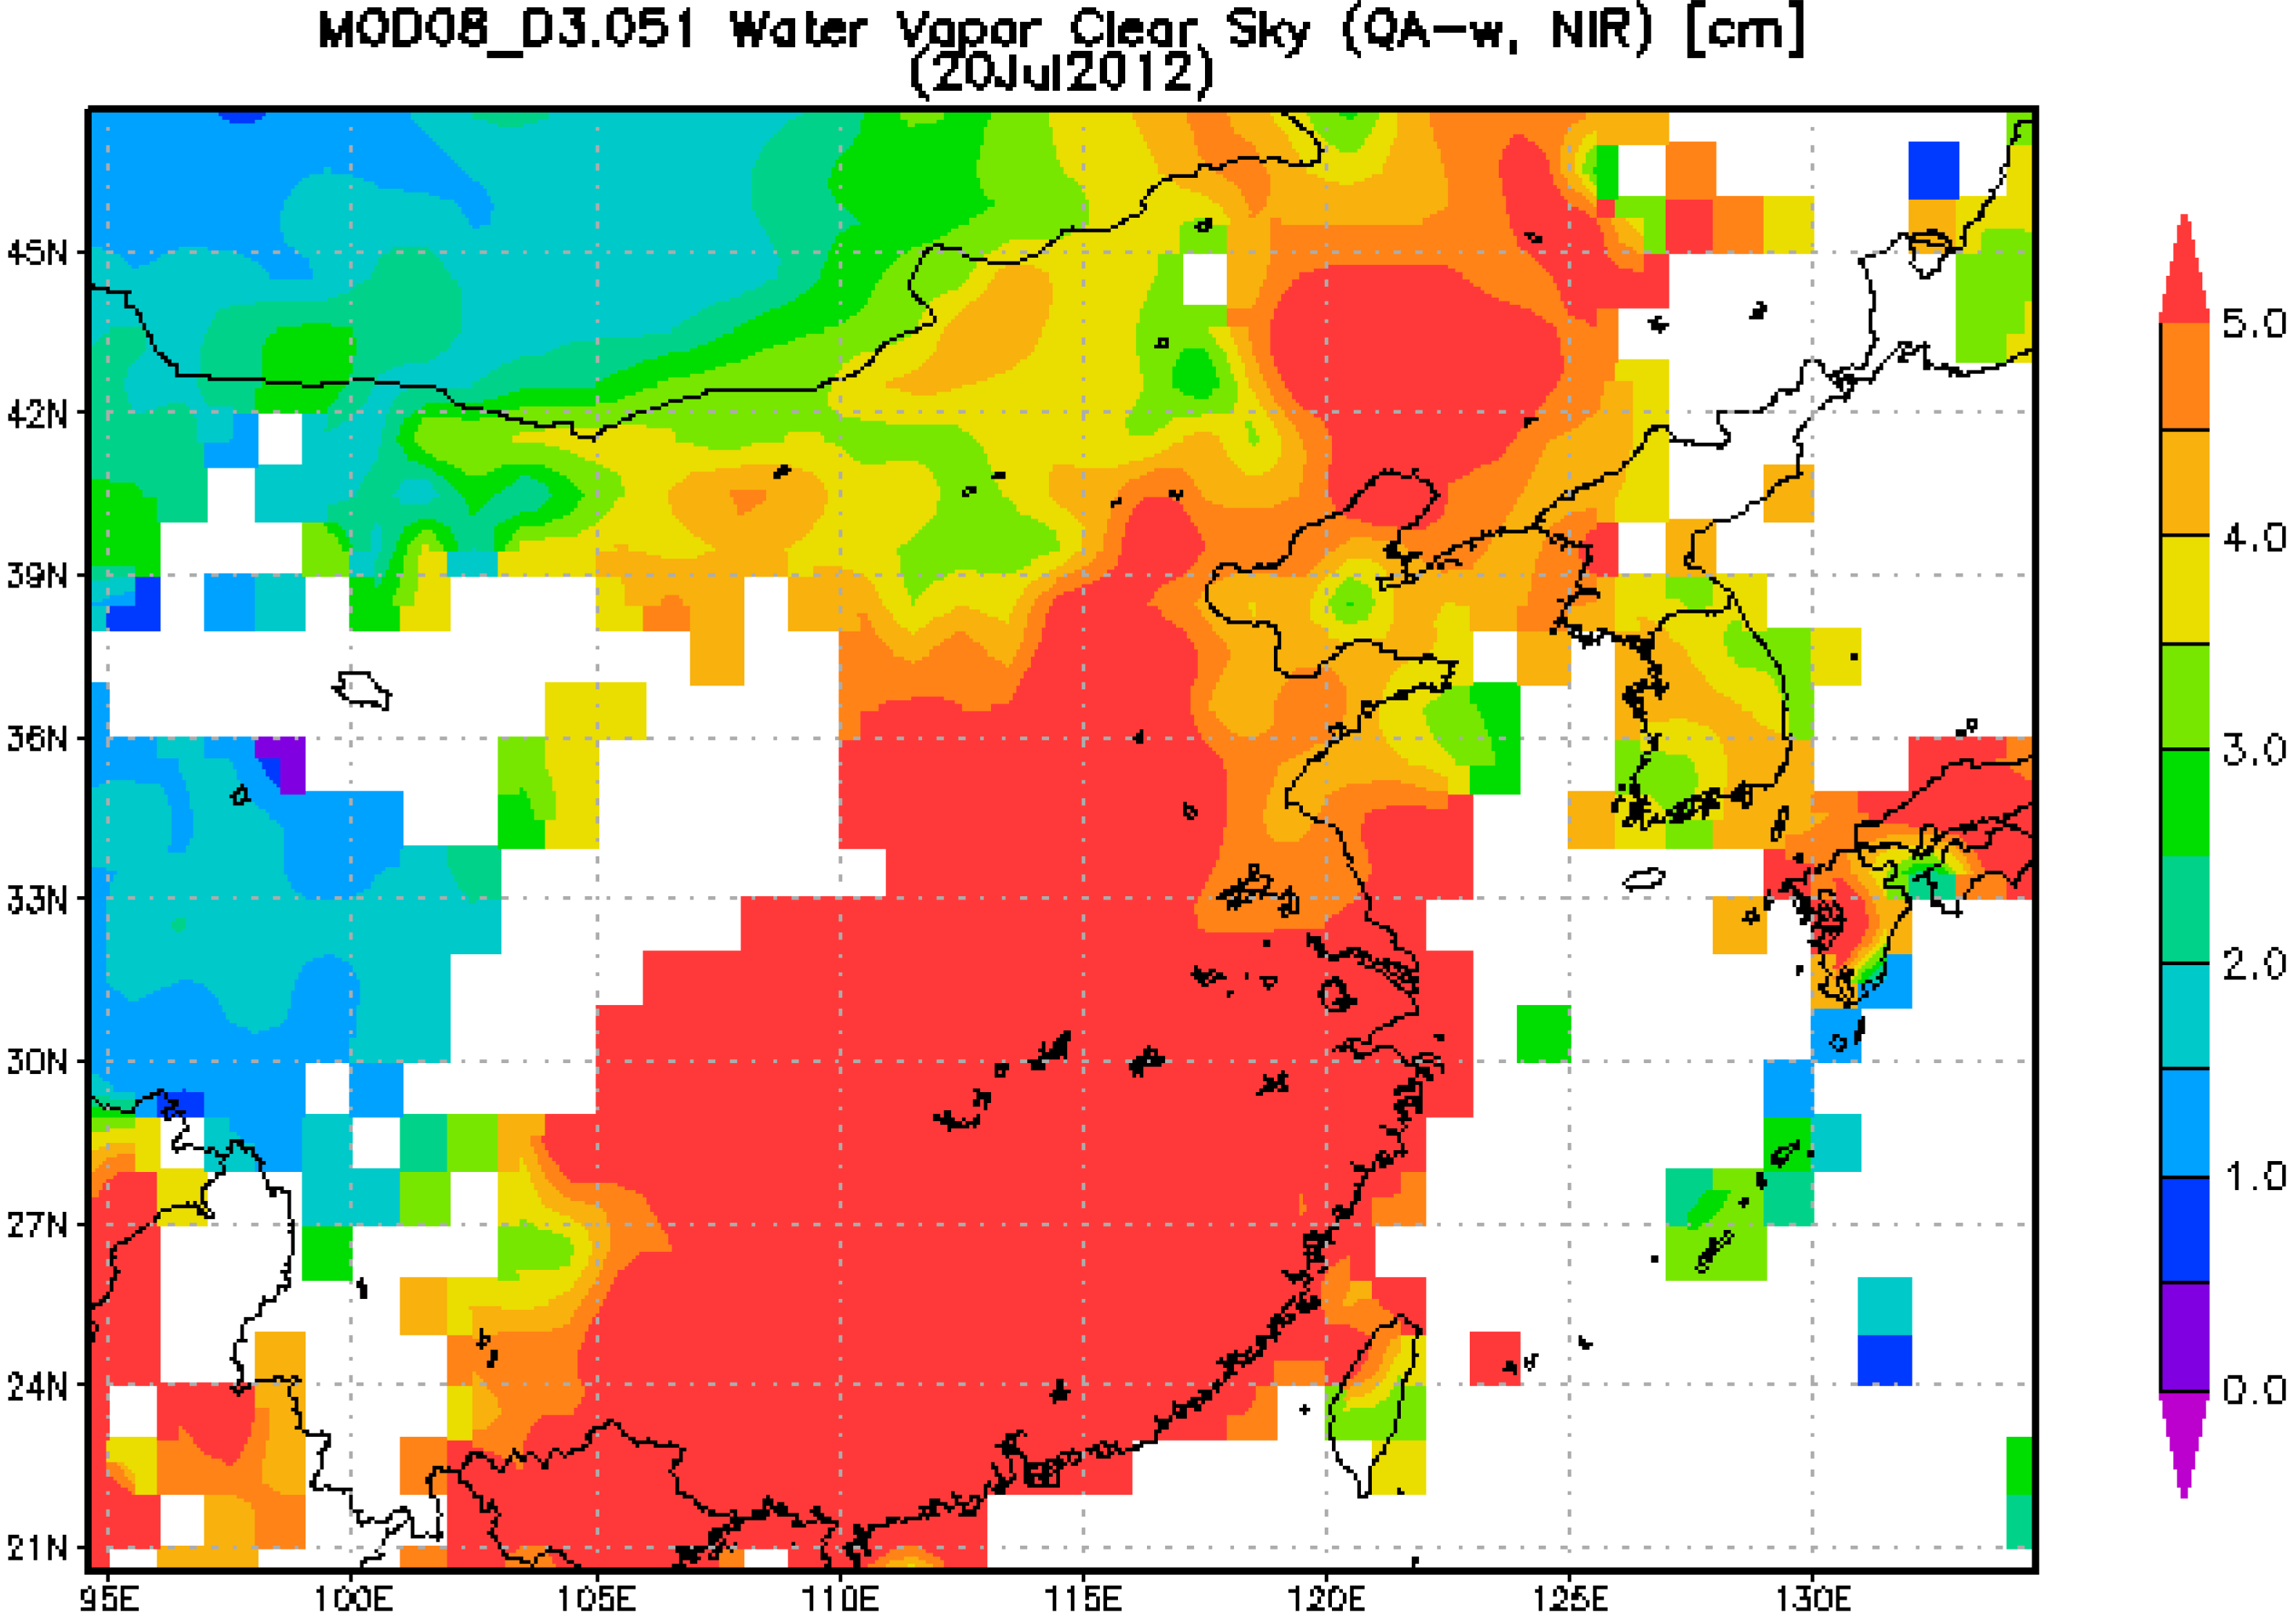
2.3. MODIS Atmosphere Data:

Level 2, collection 5 aerosol and cloud properties, including cloud optical thickness (Cloud optical thickness is a dimensionless integral of the extinction coefficient along a vertical path through the cloud. It is determined by liquid water path and effective radius. Liquid water path is the weight of liquid water droplets in the atmosphere above a unit surface area on the earth (g∙m–2). Effective radius is the ratio of volume to area of cloud drops, droplets, or ice crystals integrated over the cloud particle size distribution, cirrus fraction, water vapor, and effective radius for liquid water and ice clouds measured by MODIS [16,19] were used in this study. MODIS uses infrared bands to determine cloud physical properties related to cloud top pressure and temperature, and visible and near-infrared bands to determine cloud optical and microphysical properties. Nakajima and King [27] showed that the reflection function of clouds at a non-absorbing band in the visible wavelength region (e.g., 0.66 µm) is primarily a function of cloud optical thickness, whereas the reflection function at a liquid water (or ice) absorbing channel in the near-infrared (i.e., 1.6 or 2.1 µm) is a function of cloud particle size. This algorithm, together with extensions to distinguish between liquid water and ice clouds and to consider reflection by various underlying surfaces, including snow and sea ice has been incorporated into the operational MODIS retrieval algorithm. MODIS gives cloud droplet size in two thermodynamic phases: liquid water and ice. The cloud liquid (and ice) water path is calculated from a product of the retrieved cloud optical thickness and effective radius re. Therefore, cloud top temperature can be used to identify cloud height, which is a good index for the strength of convection. In addition, cloud droplet size is normally used to identify aerosol (e.g. Towmey effect) [28].

3. Results

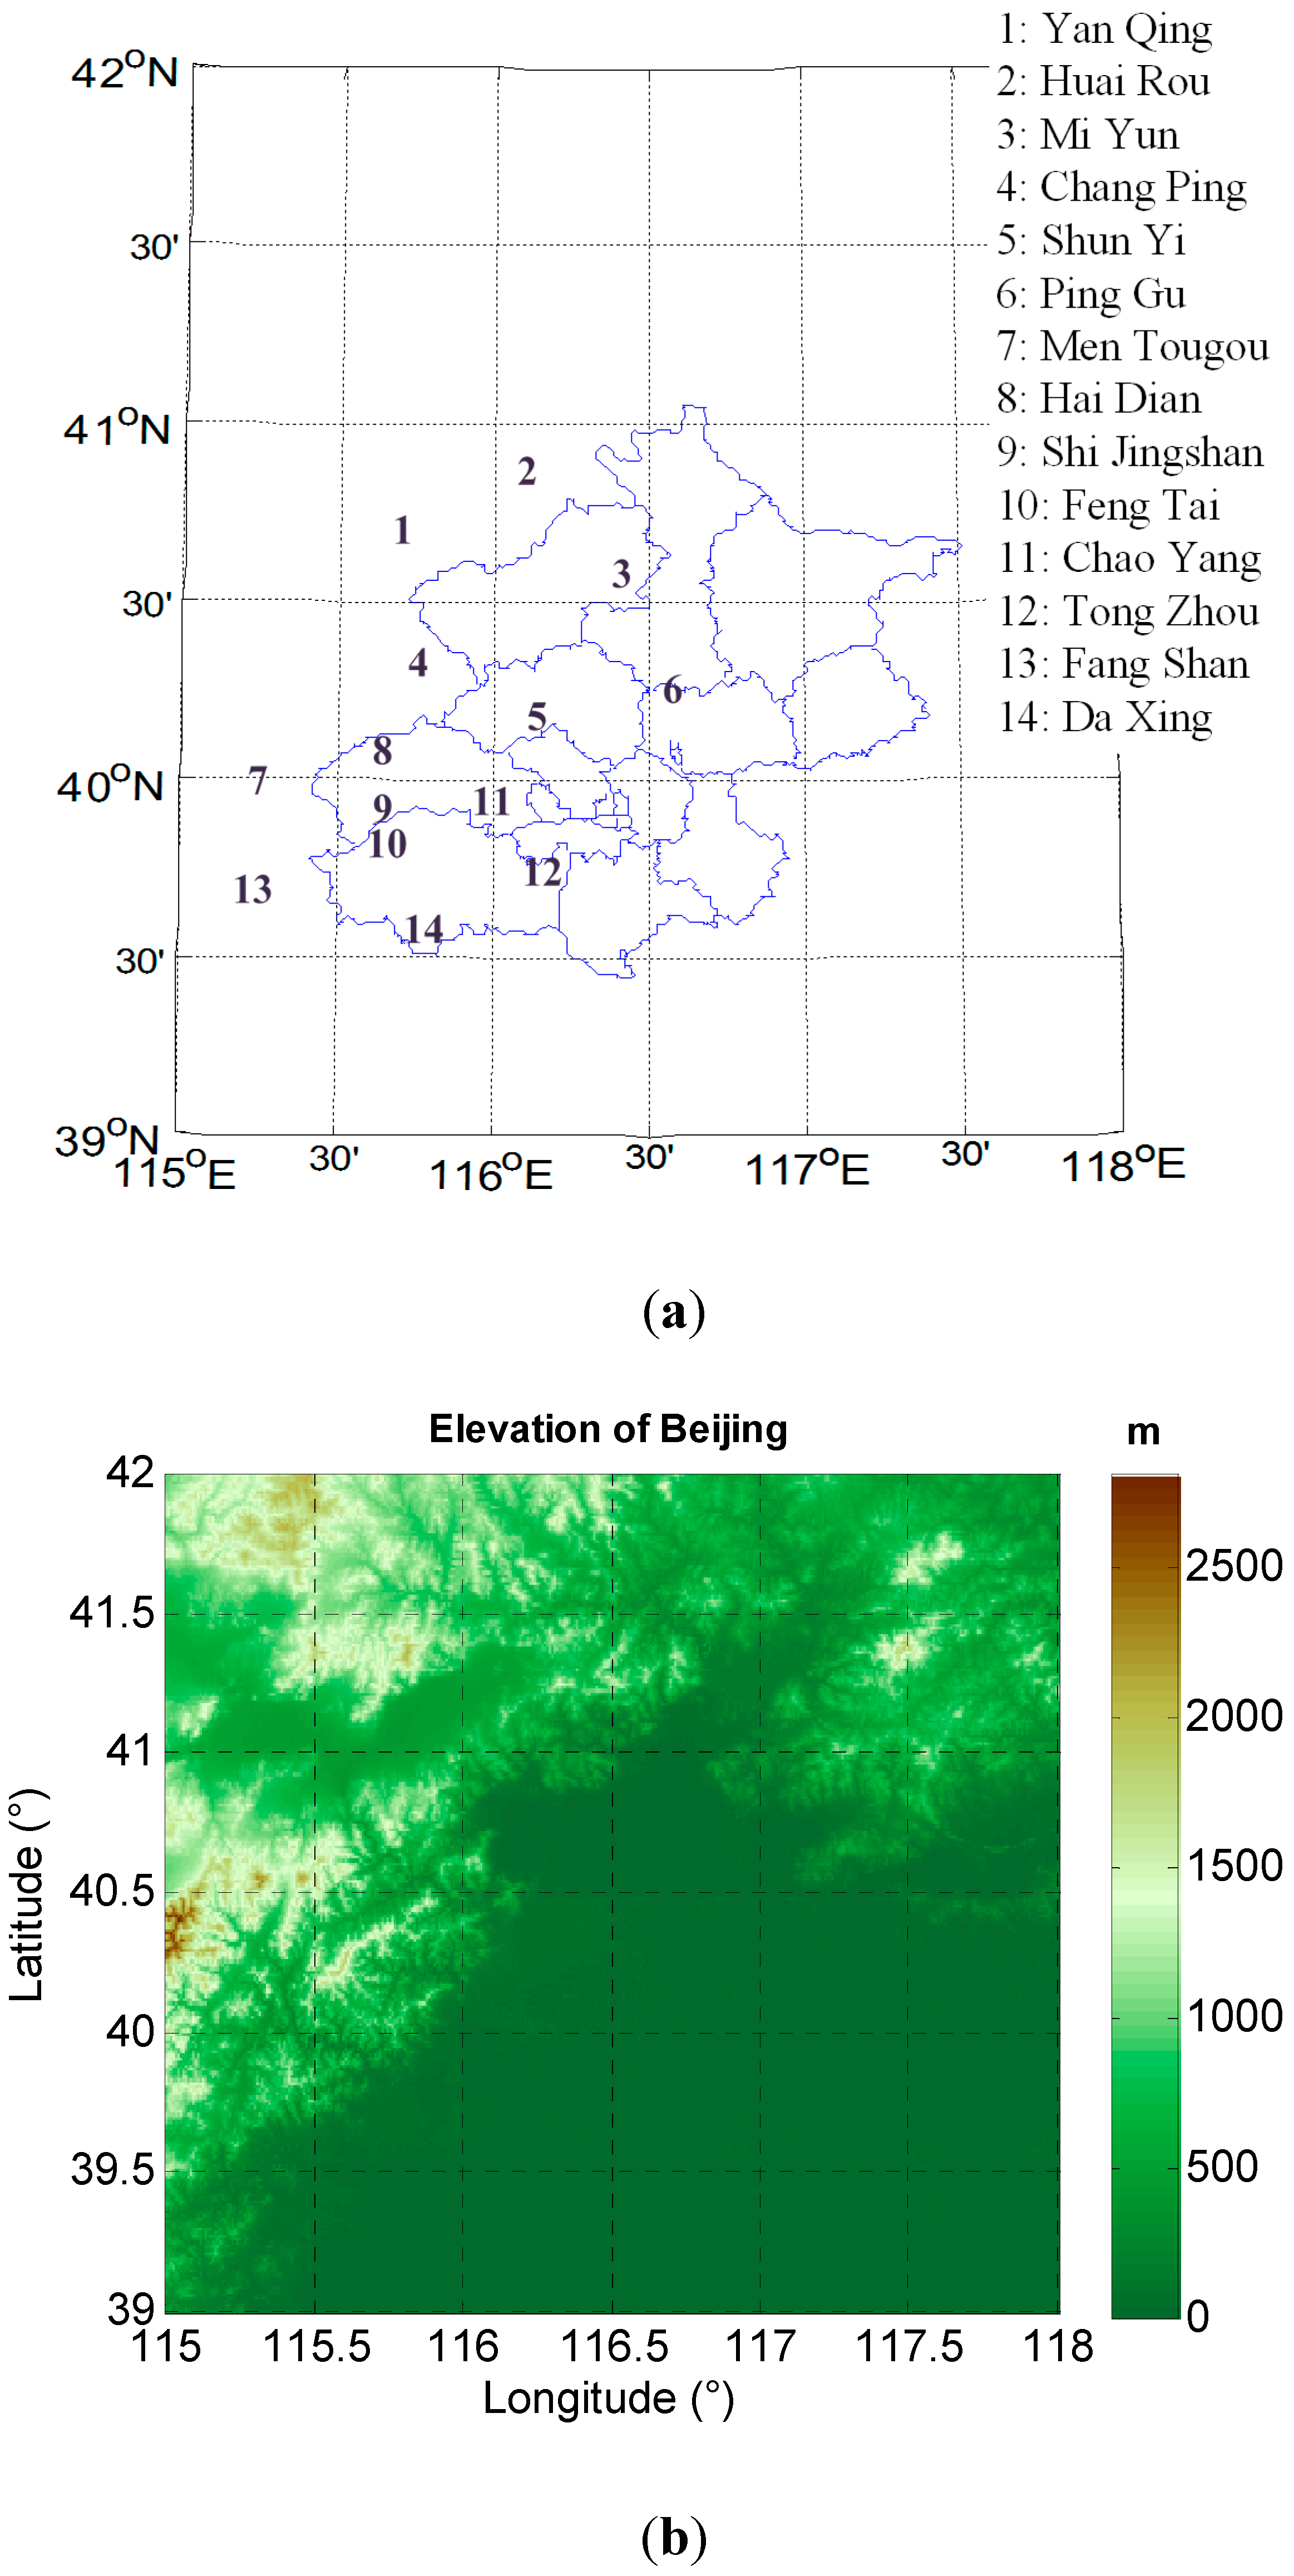
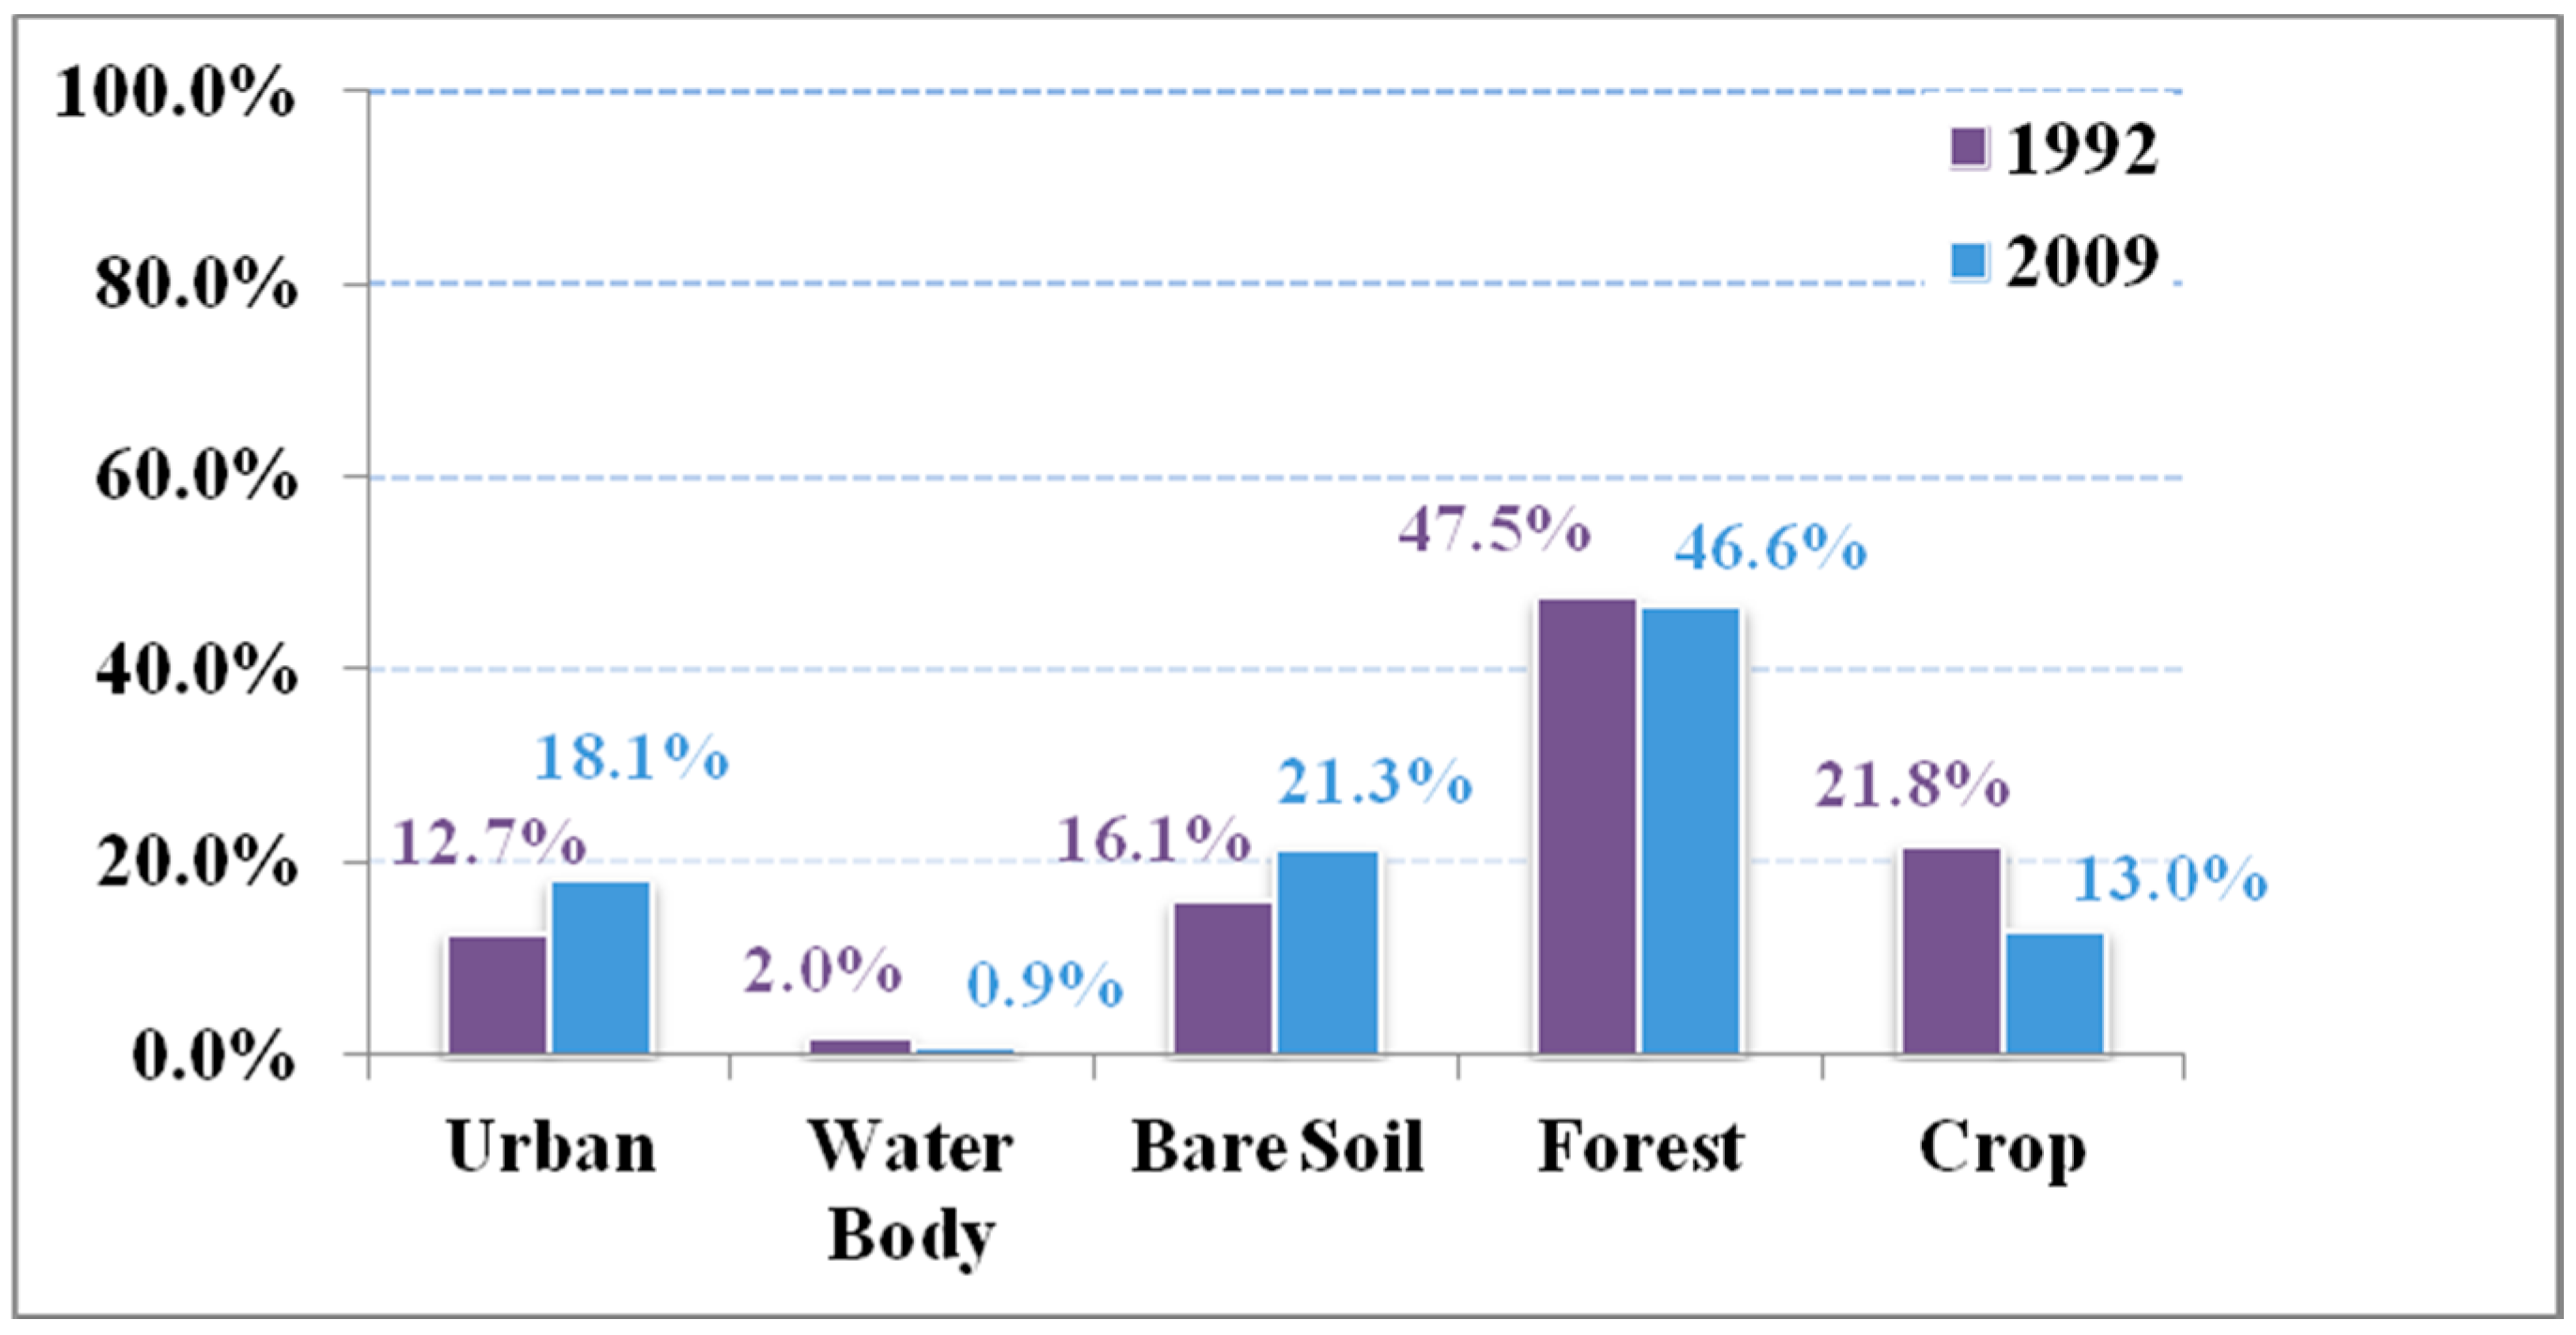
3.1. Urban Growth of Beijing
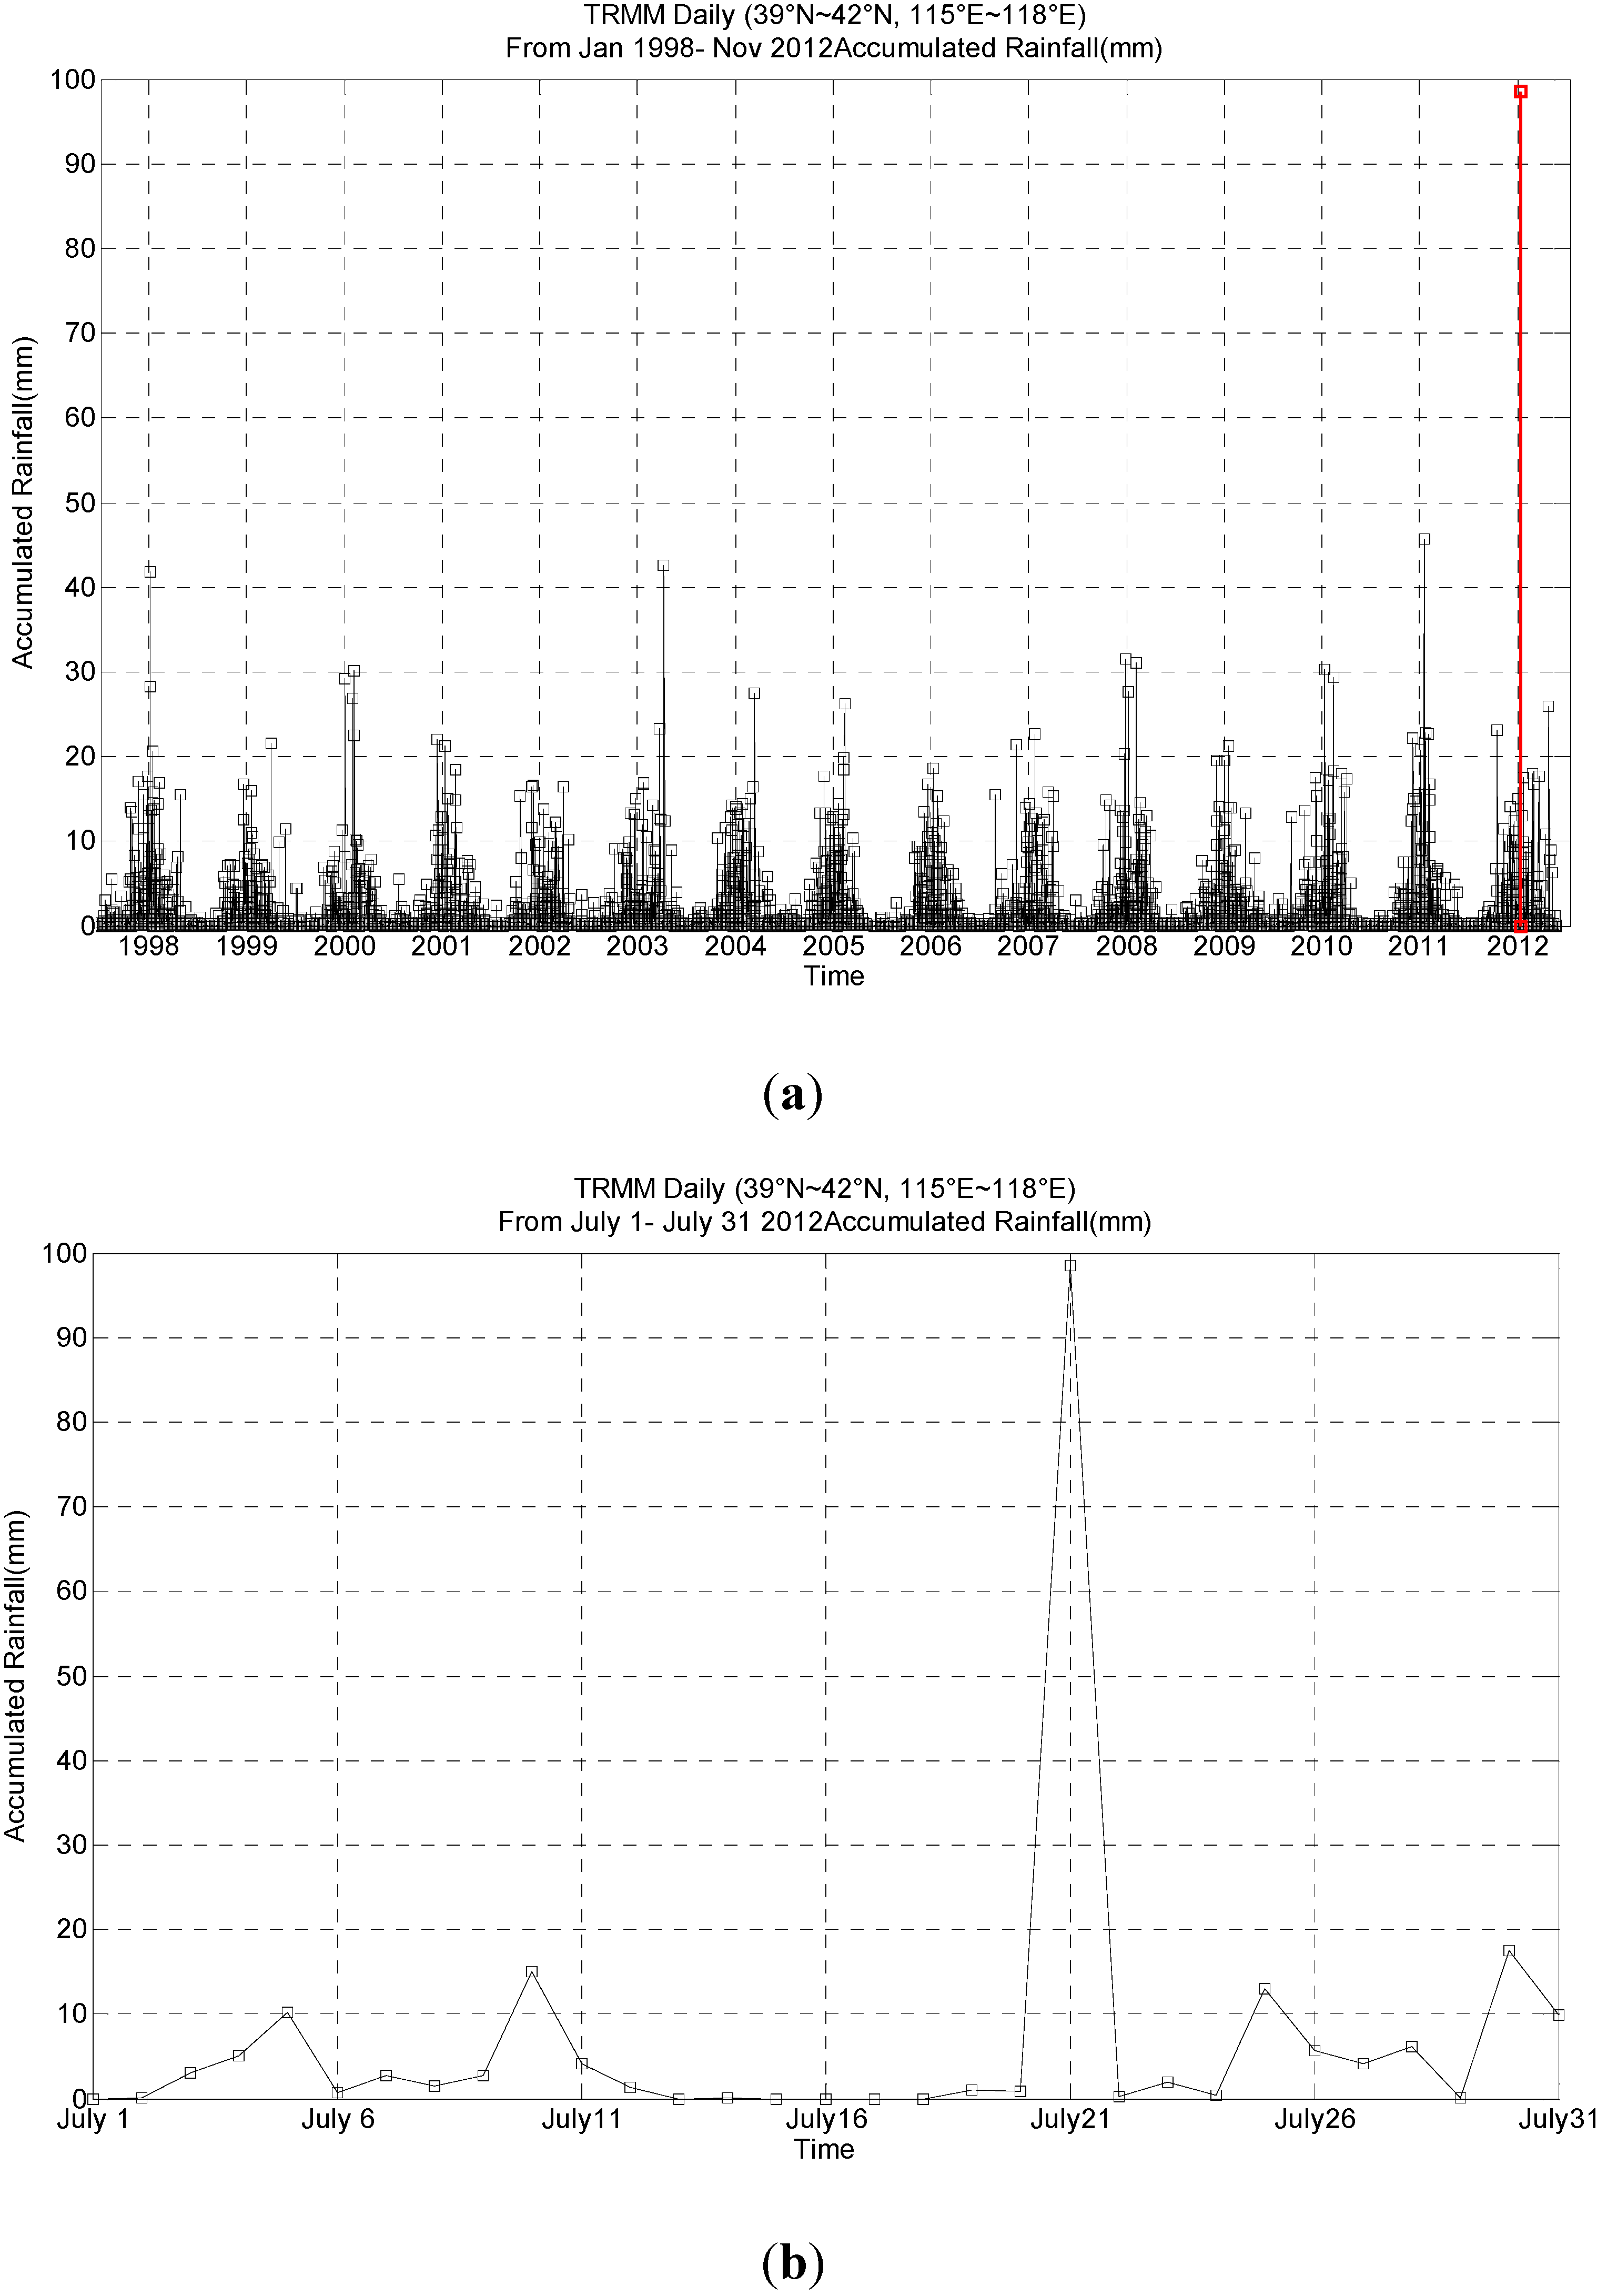
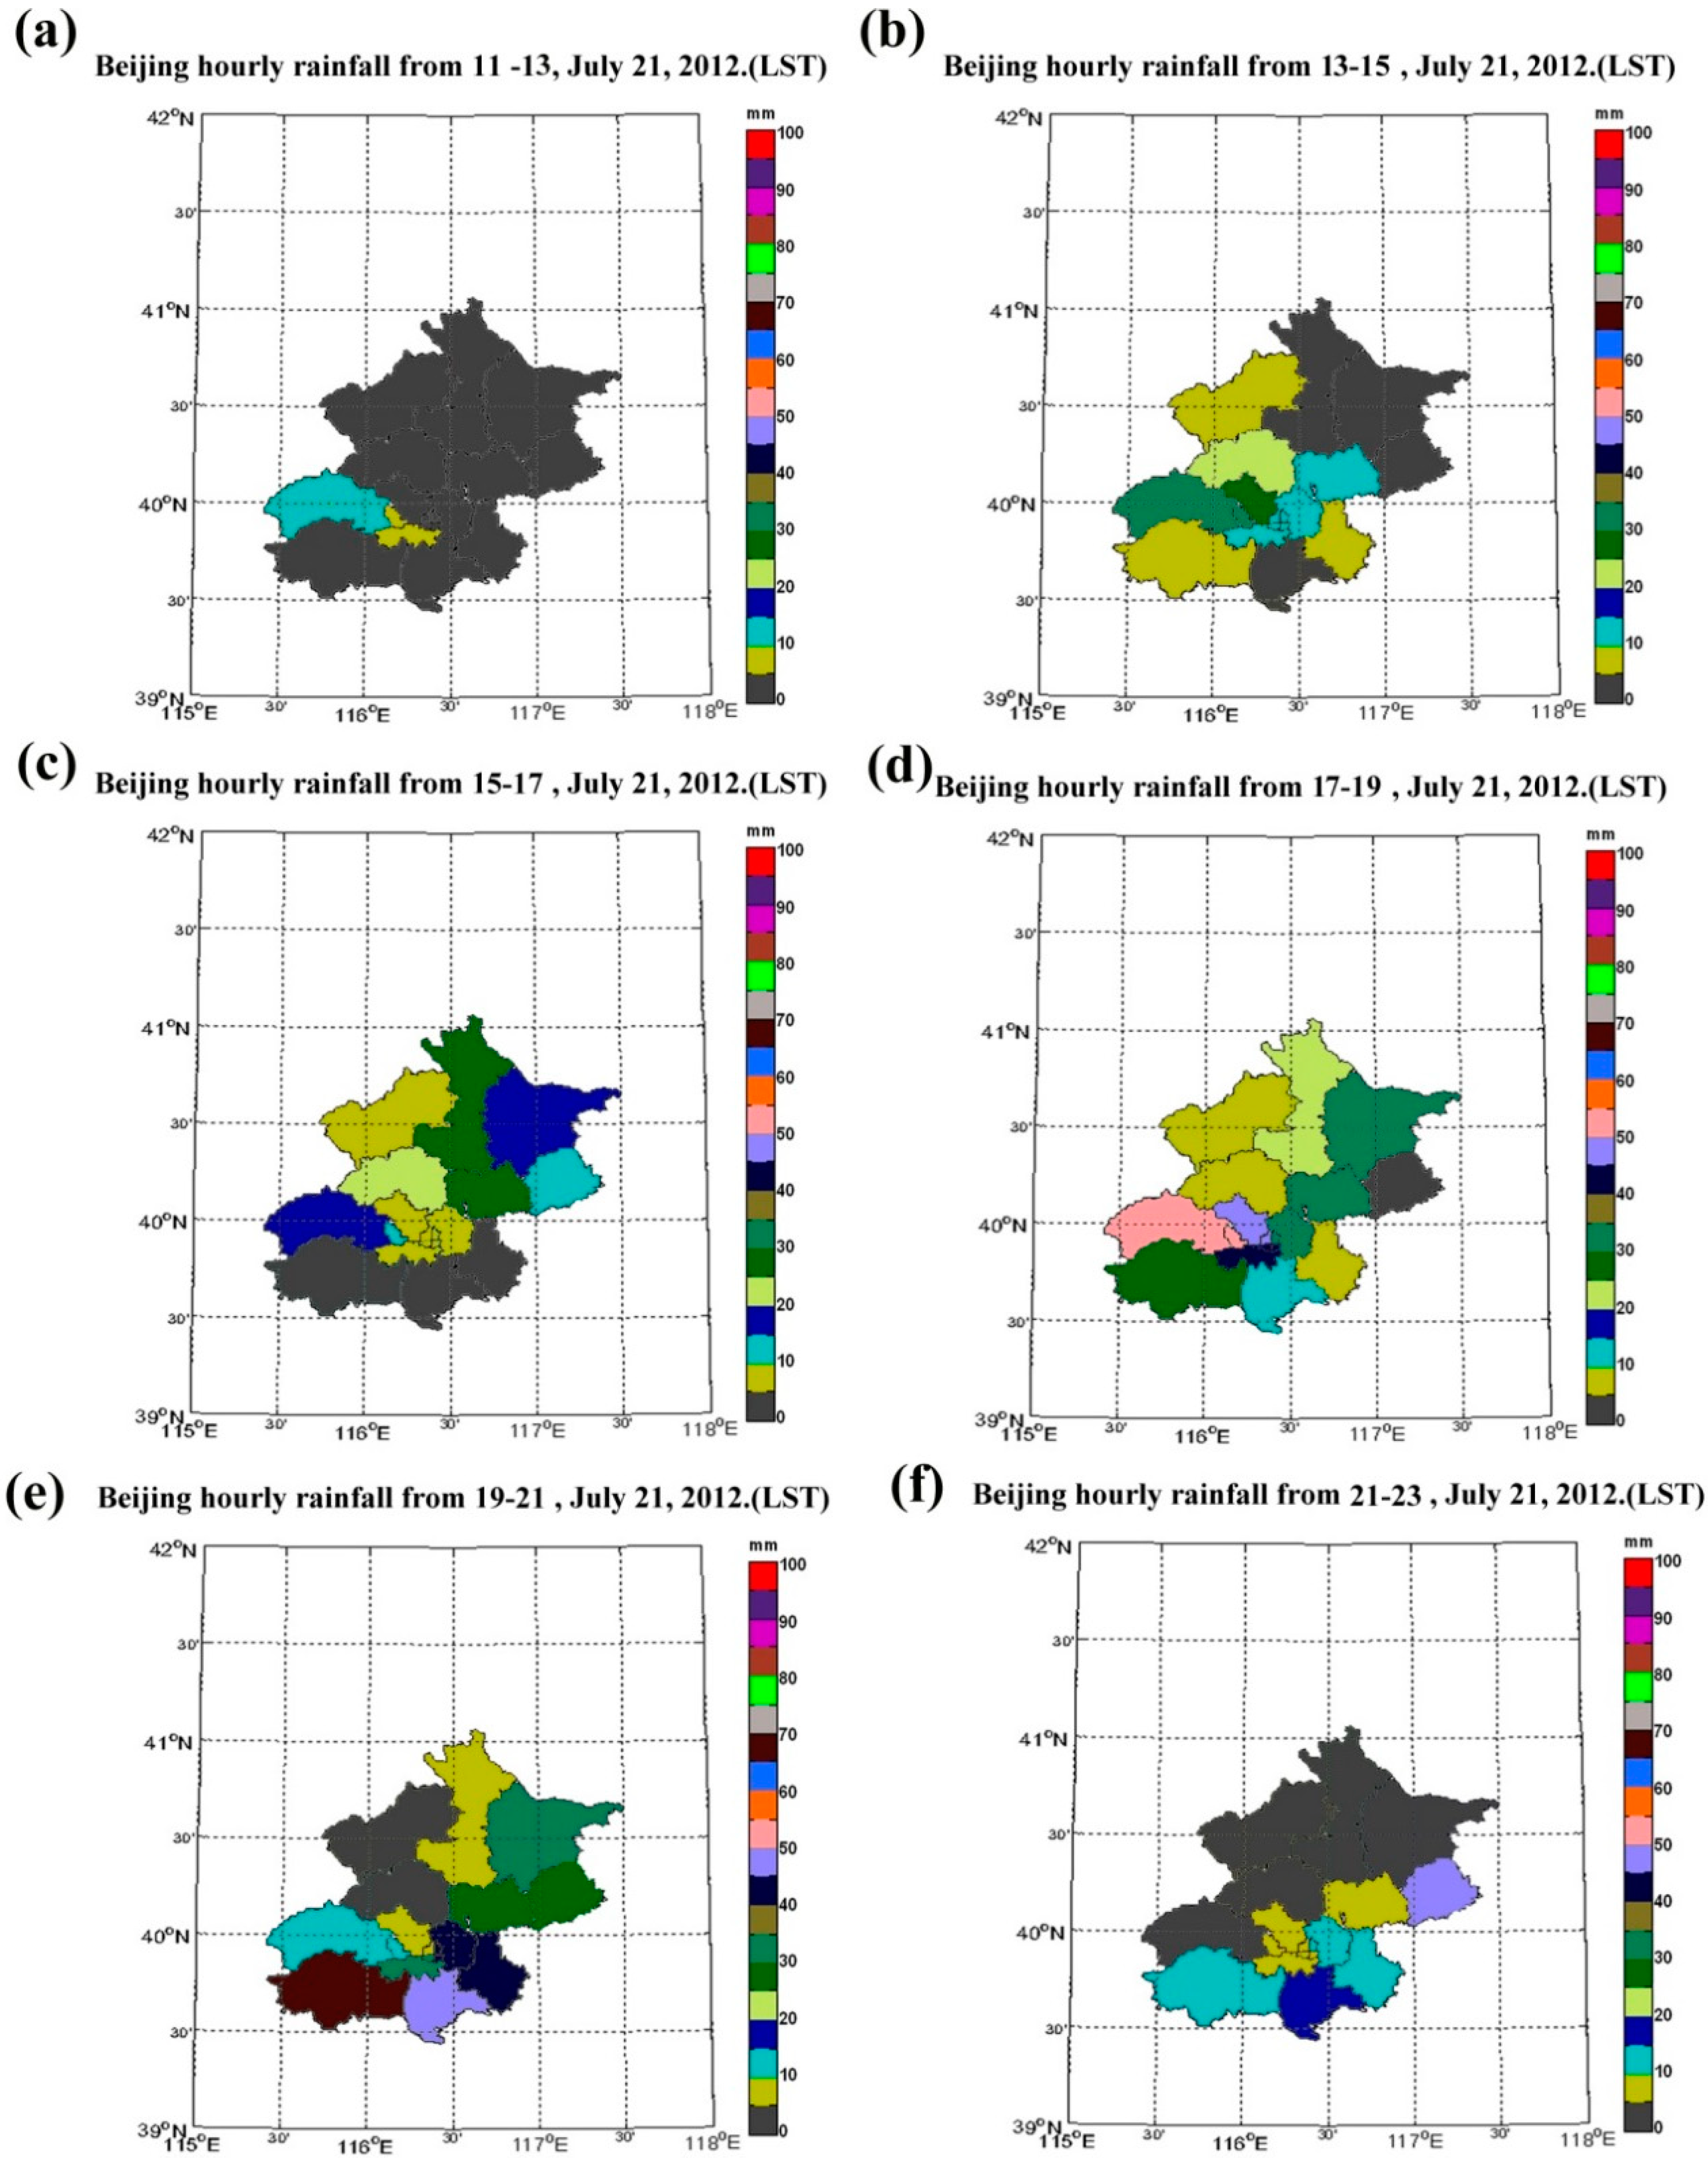
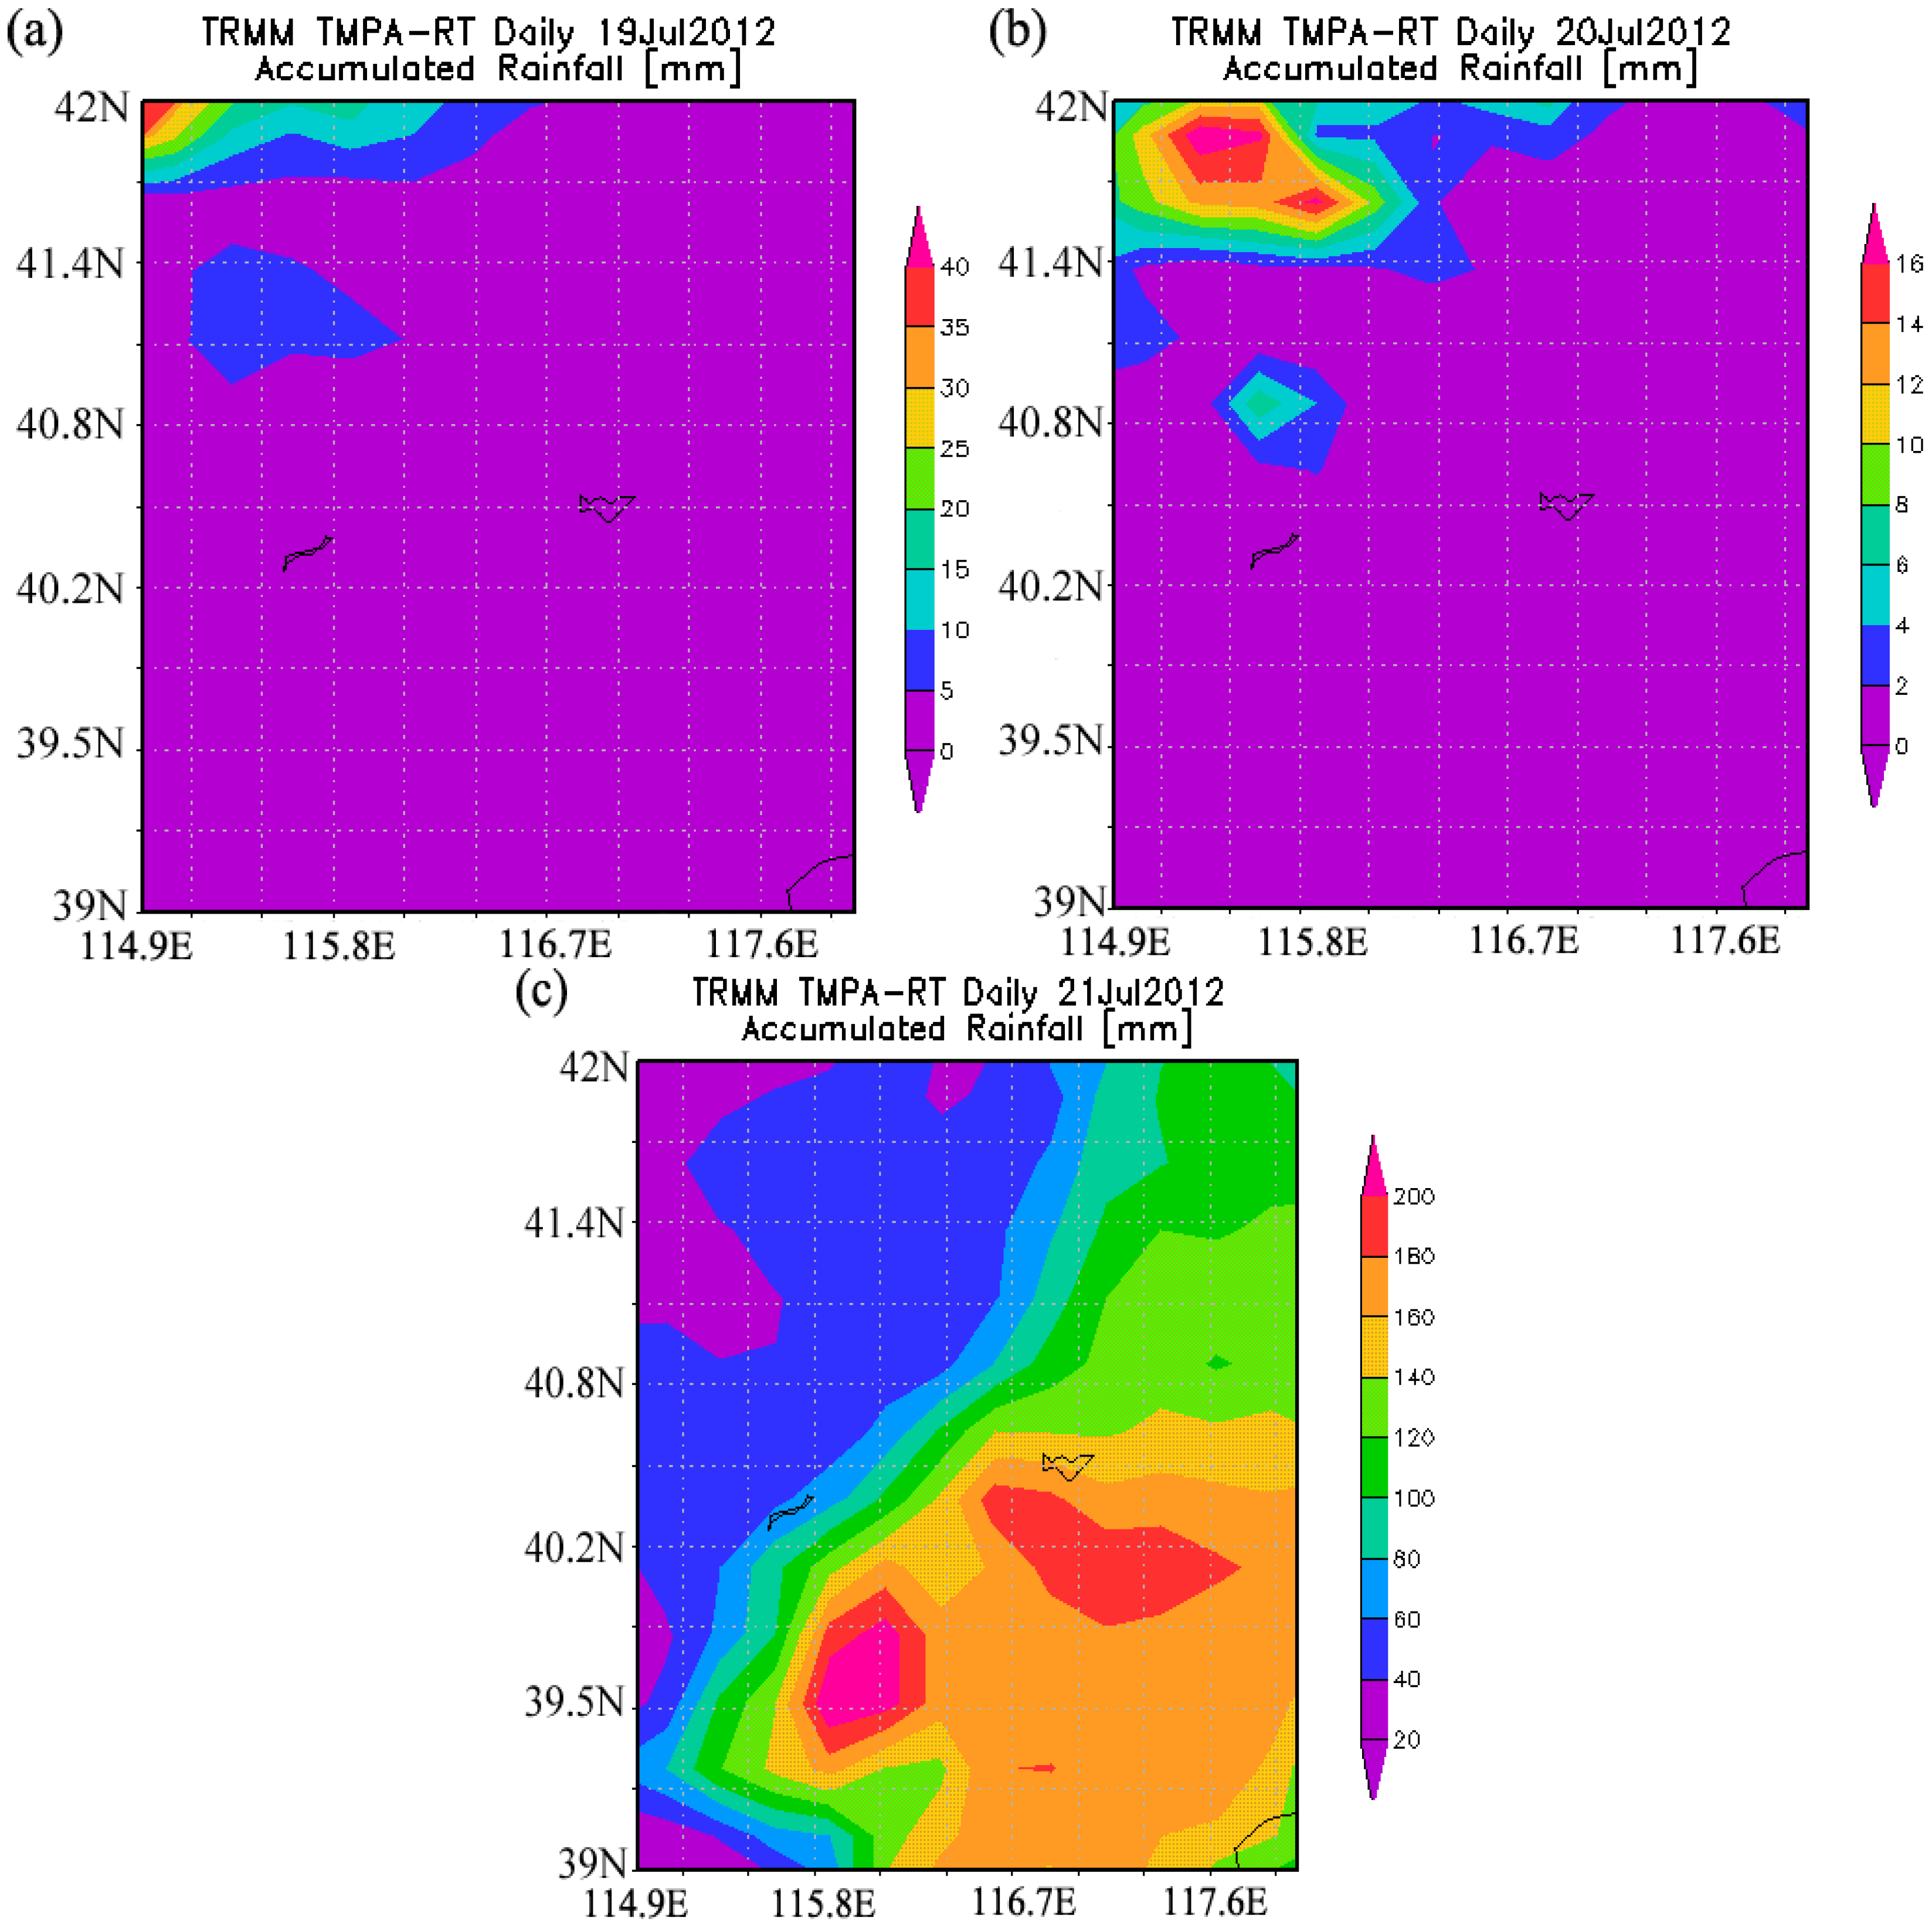
Beijing, with the population of 20 million, is located at 39.5°N–41.0°N, 115.5°E–117.5°E with center at 40.19°N, 116.5°E (Figure 1a). The overall shape of Beijing is oritented southwest to northeast. The city is surrounded by mountains to the north, west, and southwest with elevation reaching 2300 m (Figure 1b). Therefore, when water vapor is transported from southeast to Beijing via the subtropical high, it is lifted by mountain to form clouds and rainfall. In addition, due to the tall buildings of Beijing city and destabilized air, the city may also provide lifting mechanism.
Figure 1. (a) The location of Beijing and sub-regions of the Beijing city. (b) Elevation of Beijing. Elevation data source is global Digital Terrain Elevation Data (DTED®) from the Shuttle Radar Topography Mission (SRTM), Level 0 data with the resolution 30 arc second (~ one kilometer). http://data.geocomm.com/catalog/.
Climate 03 00193 g001
Corresponding to the economic growth of China, Beijing has sprawled rapidly during the last two decades (1990–2010). The spatial footprint of Beijing increased by a factor of 10 [29]. Consequently, land cover of Beijing changed significantly from 1992 to 2009 (Figure 2). Urban regions increasesd from 12.7% in 1992 to 18.1% in 2009. Bare soil increased from 16.1% to 21.3%. Forest decreased from 47.5% to 46.6%. The largest drop in coverage was cropland, with 21.8% in 1992 but only 13.0% in 2009. With such changes, land surface properties including soil moisture, vegetation cover, roughness length, albedo and emissivity are all different. As a result, the surface energy budget is evidently modified by the urban system.
The land cover change affects land-biosphere-atmosphere interactions and thus modifies weather and climate [30,31]. Beijing 721 extreme rainfall event is one of the consequences of such land cover changes.
Figure 2. Land cover percentage of Beijing, China for 1992 (purple) and 2009 (blue). Data is provided by Tsinghua Earth Climate System Center [29].
Climate 03 00193 g002

3.2. Rainfall Event

This 721 event produced a high degree of heterogeneity in terms of rainfall intensity, lasted longer than 10 hours, and possessed extreme high intensity and discrete rain clusters during the event. The TRMM observed daily area-averaged Beijing rainfall amount was 100 mm/day for the 721 event, which is about 5 times of normal daily maximum ( <20mm/day) from 1998 to 2012 (Figure 3). In fact, this rainfall event is the largest one in 61 years since the station was built in 1951.
The spatial distribution of the rainfall amount over time (Figure 4) reveals a few features of this extreme rainfall. First, this system intensified rapidly and stalled over Beijing for over 10 hours. Specifically, the rain began southwest of Beijing over Men Tougou, Shi Jingshan, and Feng Tai (Figure 4a), then it extended to the north, south and east. Rain covered the whole south of Beijing by 15 LT (center around Men Tougou), where the hourly accumulated rainfall was over 30 mm/hr (Figure 4b). During this period of time, the system continued to develop and moved to the north and reached Huai Rou, Mi Yun and Ping Gu (Figure 4c). Two peaks occurred at this time: Huai Rou and Shun Yi (~40 mm/hr). After 17 LT, a new rain cluster formed in the west and moved to the east. The precipitation over Beijing was mainly in the southwest, with Men Tougou over 50 mm/hr, Hai Dian and Feng Tai close to 50 mm/hr (Figure 4d). Since then, the system was trapped over Fang Shan to form heavy precipitation. The hourly accumulated rainfall was almost 70 mm/hr during 19–21 LT there (Figure 4e). During 19–21 LT, the system moved toward east, while Chang Ping and Yan Qing did not have rainfall (Figure 4e). Meanwhile, heavy rain peaked over south Beijing (e.g., Da Xing and Fang Shan). The accumulated rainfall value for many districts of Beijing had dramatically increased. After 21 LT, this system started to move out of the northwest to southeast. The north part of Beijing did not have rainfall (Figure 4f). Slowly, the rain stopped.
Figure 3. Cumulative daily rainfall (mm) from (a) TRMM from 1 January 1999 to 31 December 2012, and (b) from 1 July to 31 July 2012. Data are Multi-satellite Precipitation Analysis (TMPA). Image is plotted by NASA Giovanni visualization tool (http://disc2.nascom.nasa.gov/Giovanni/tovas/).
Climate 03 00193 g003
Figure 4. Bi-hourly rainfall accumulation at Beijing-sub-component. Data is from National Automatic Weather Stations in Beijing. (a) 11–13 LT, (b) 13–15 LT, (c) 15–17 LT, (d) 17–19 LT, (e) 19–21 LT, (f) 21–23 LT
Climate 03 00193 g004
According to these local ground observations, total rainfall amount reached 200 mm in the center of Beijing. Furthermore, the rainfall started around 11 LT, steadily intensified, and maximized at 18–20 LT. The hourly peak occurred in Fang Shan, a south-west sub-region of Beijing (number 13 in Figure 1a). Specifically, Fang Shan had rainfall less than 20 mm/hr from 10–18 LT, but then had heavy rainfall at 19–20 LT with the peak of 98.4 mm/hr.
Satellite observations revealed the synoptic transportation of this rainfall system (Figure 5). This rainfall system has moved from northwest. On 19 July a rainfall system located at 43°N, 114.5°W. On 20 July, the system moved southeast and centers at 41.8°N, 115.5°E. On July 21, the system continued to move further southeast to 39.9°N, 116.1°E, with two rainfall centers at surface (Figure 5c). Corresponding to this system, trough in high altitude and convergence at low altitude were reported by previous researchers [10]. The convection is one of the most important mesoscale dynamic condition responsible for this extreme rainfall in Beijing [10]. On daily average sense, two heavy rainfall centers were over Beijing—one was on Feng Tai (66.7 mm/hr) at 18–19 LT and another was on Fang Shan (98.9 mm/hr) at 19–20 LT.
Figure 5. Daily accumulated rainfall (unit: mm) for Beijing and surrounding regions (a) 19 July 2012, (b) 20 July 2012 and (c) 21 July 2012. Data is measured by TRMM-TMPA. Data is assessable via Giovanni at: http://disc2.nascom.nasa.gov/Giovanni/tovas/realtime.3B42RT.2.shtml.
Climate 03 00193 g005

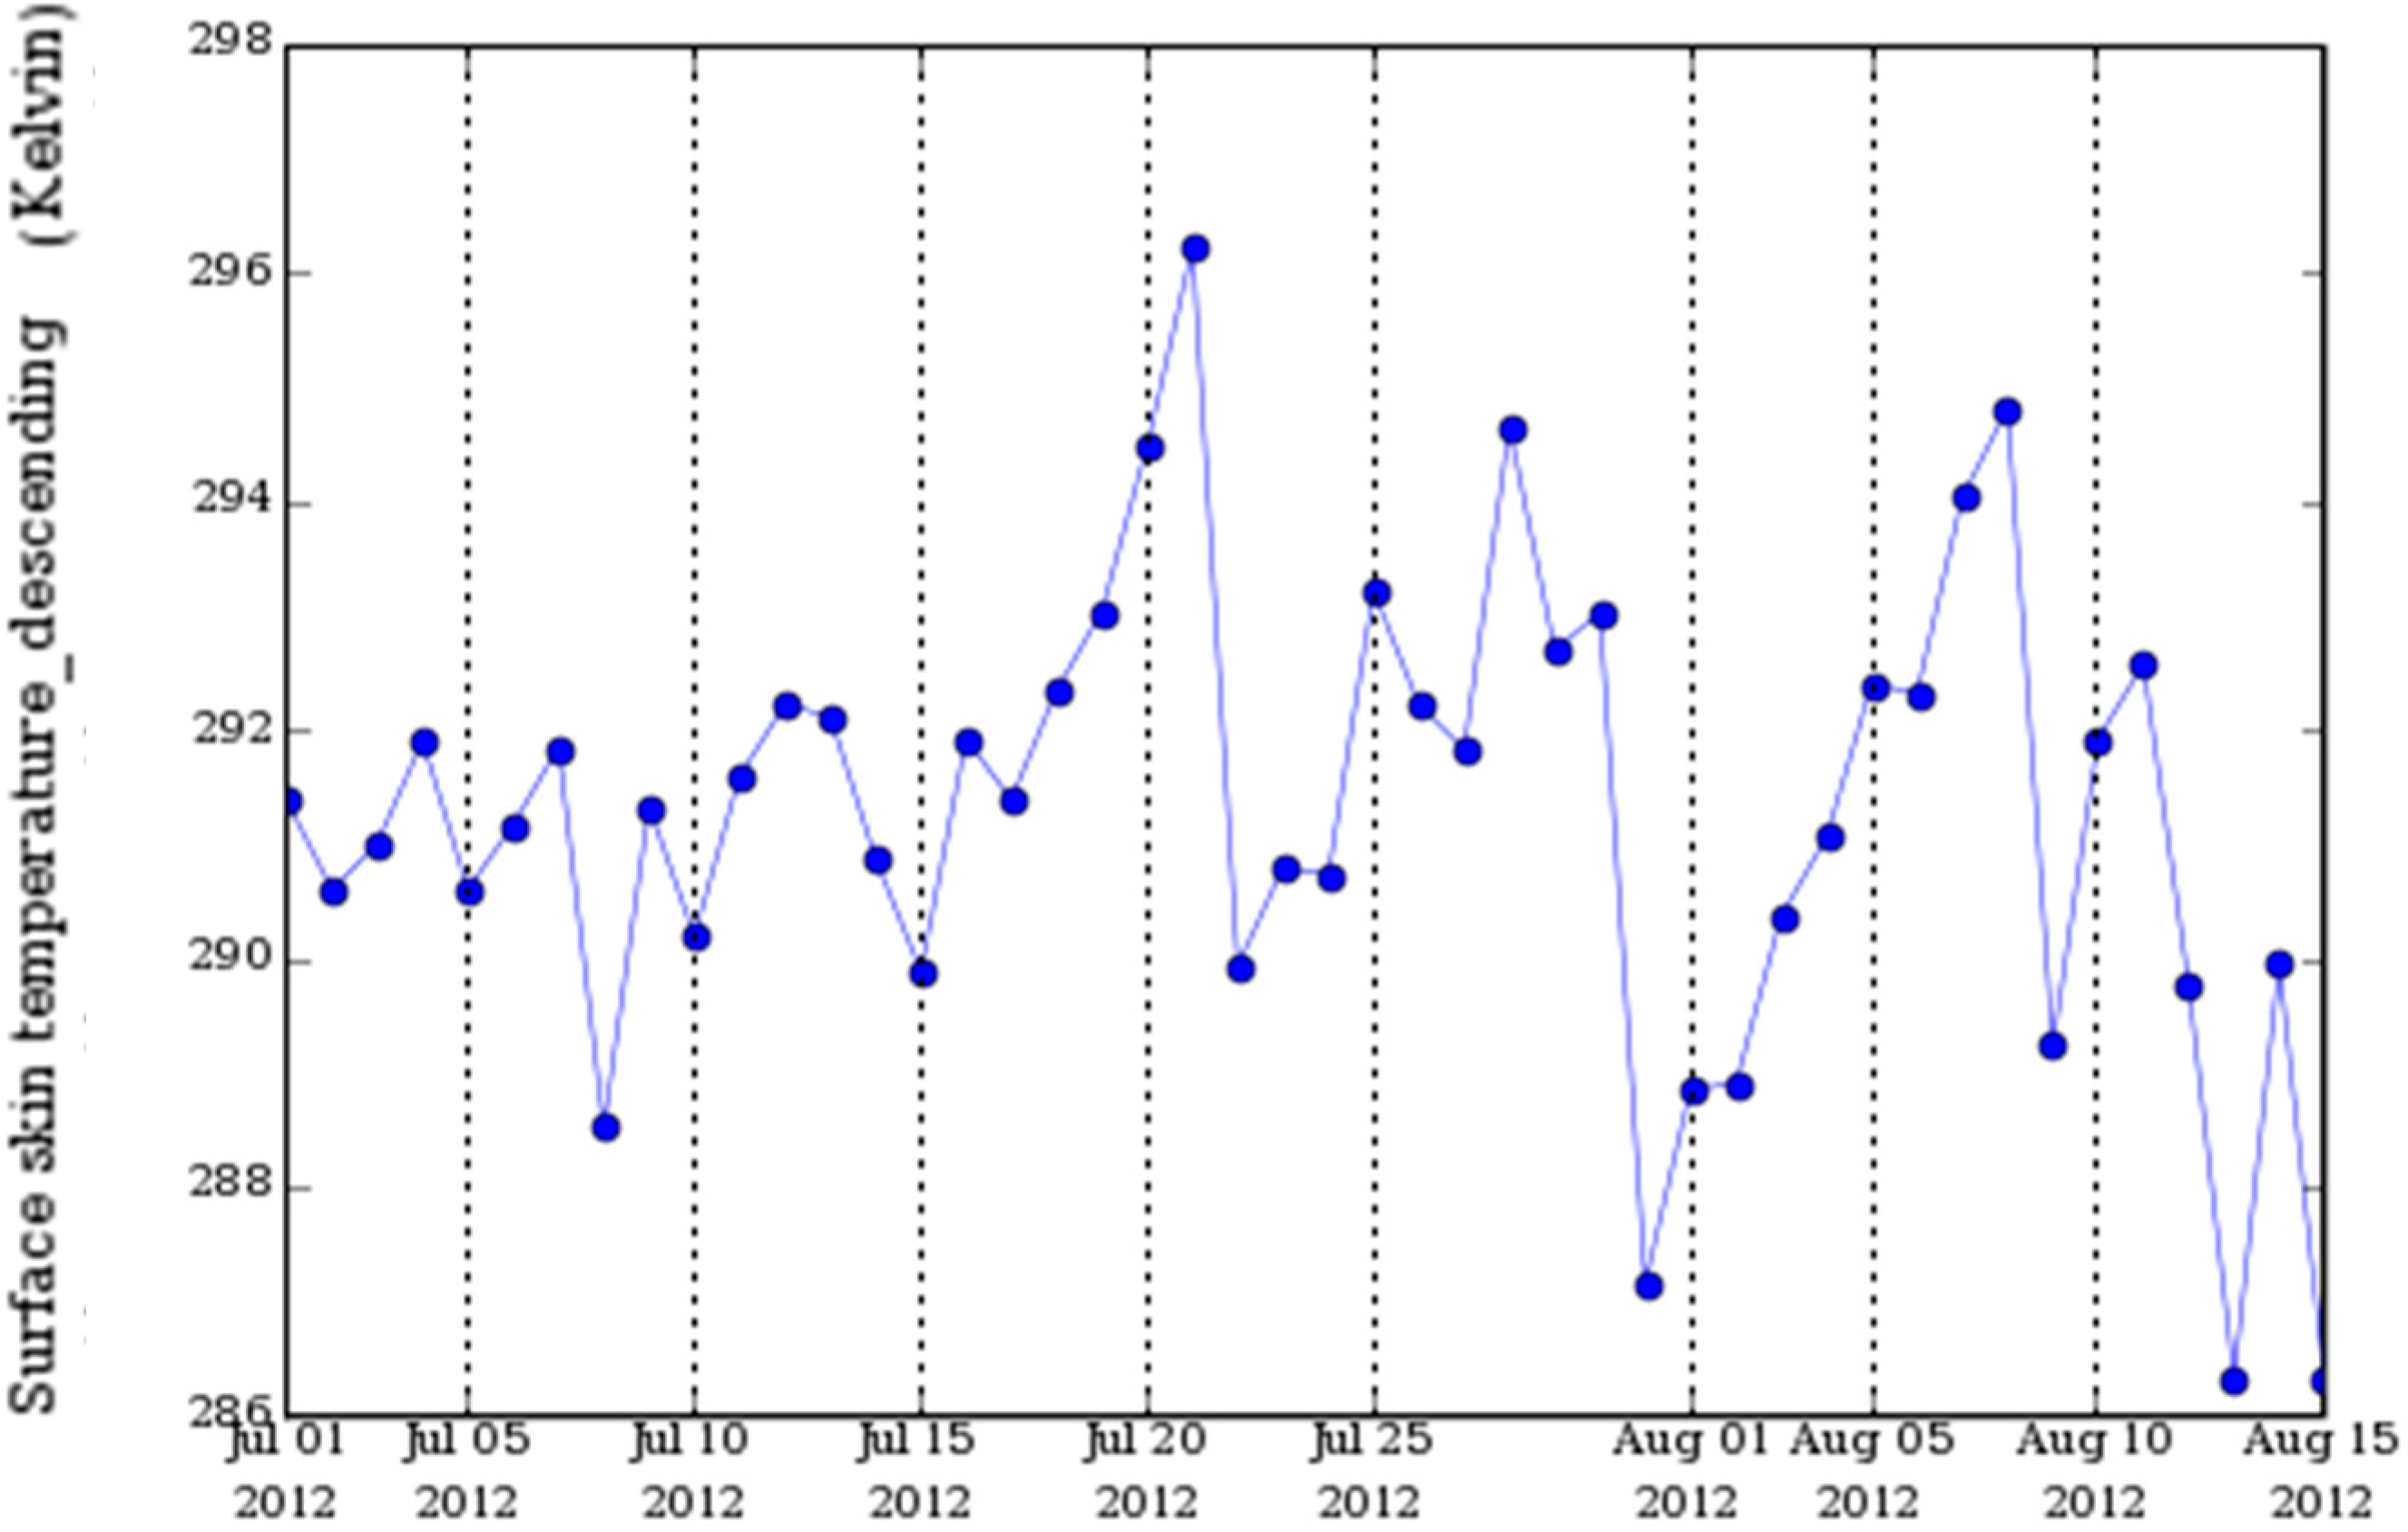
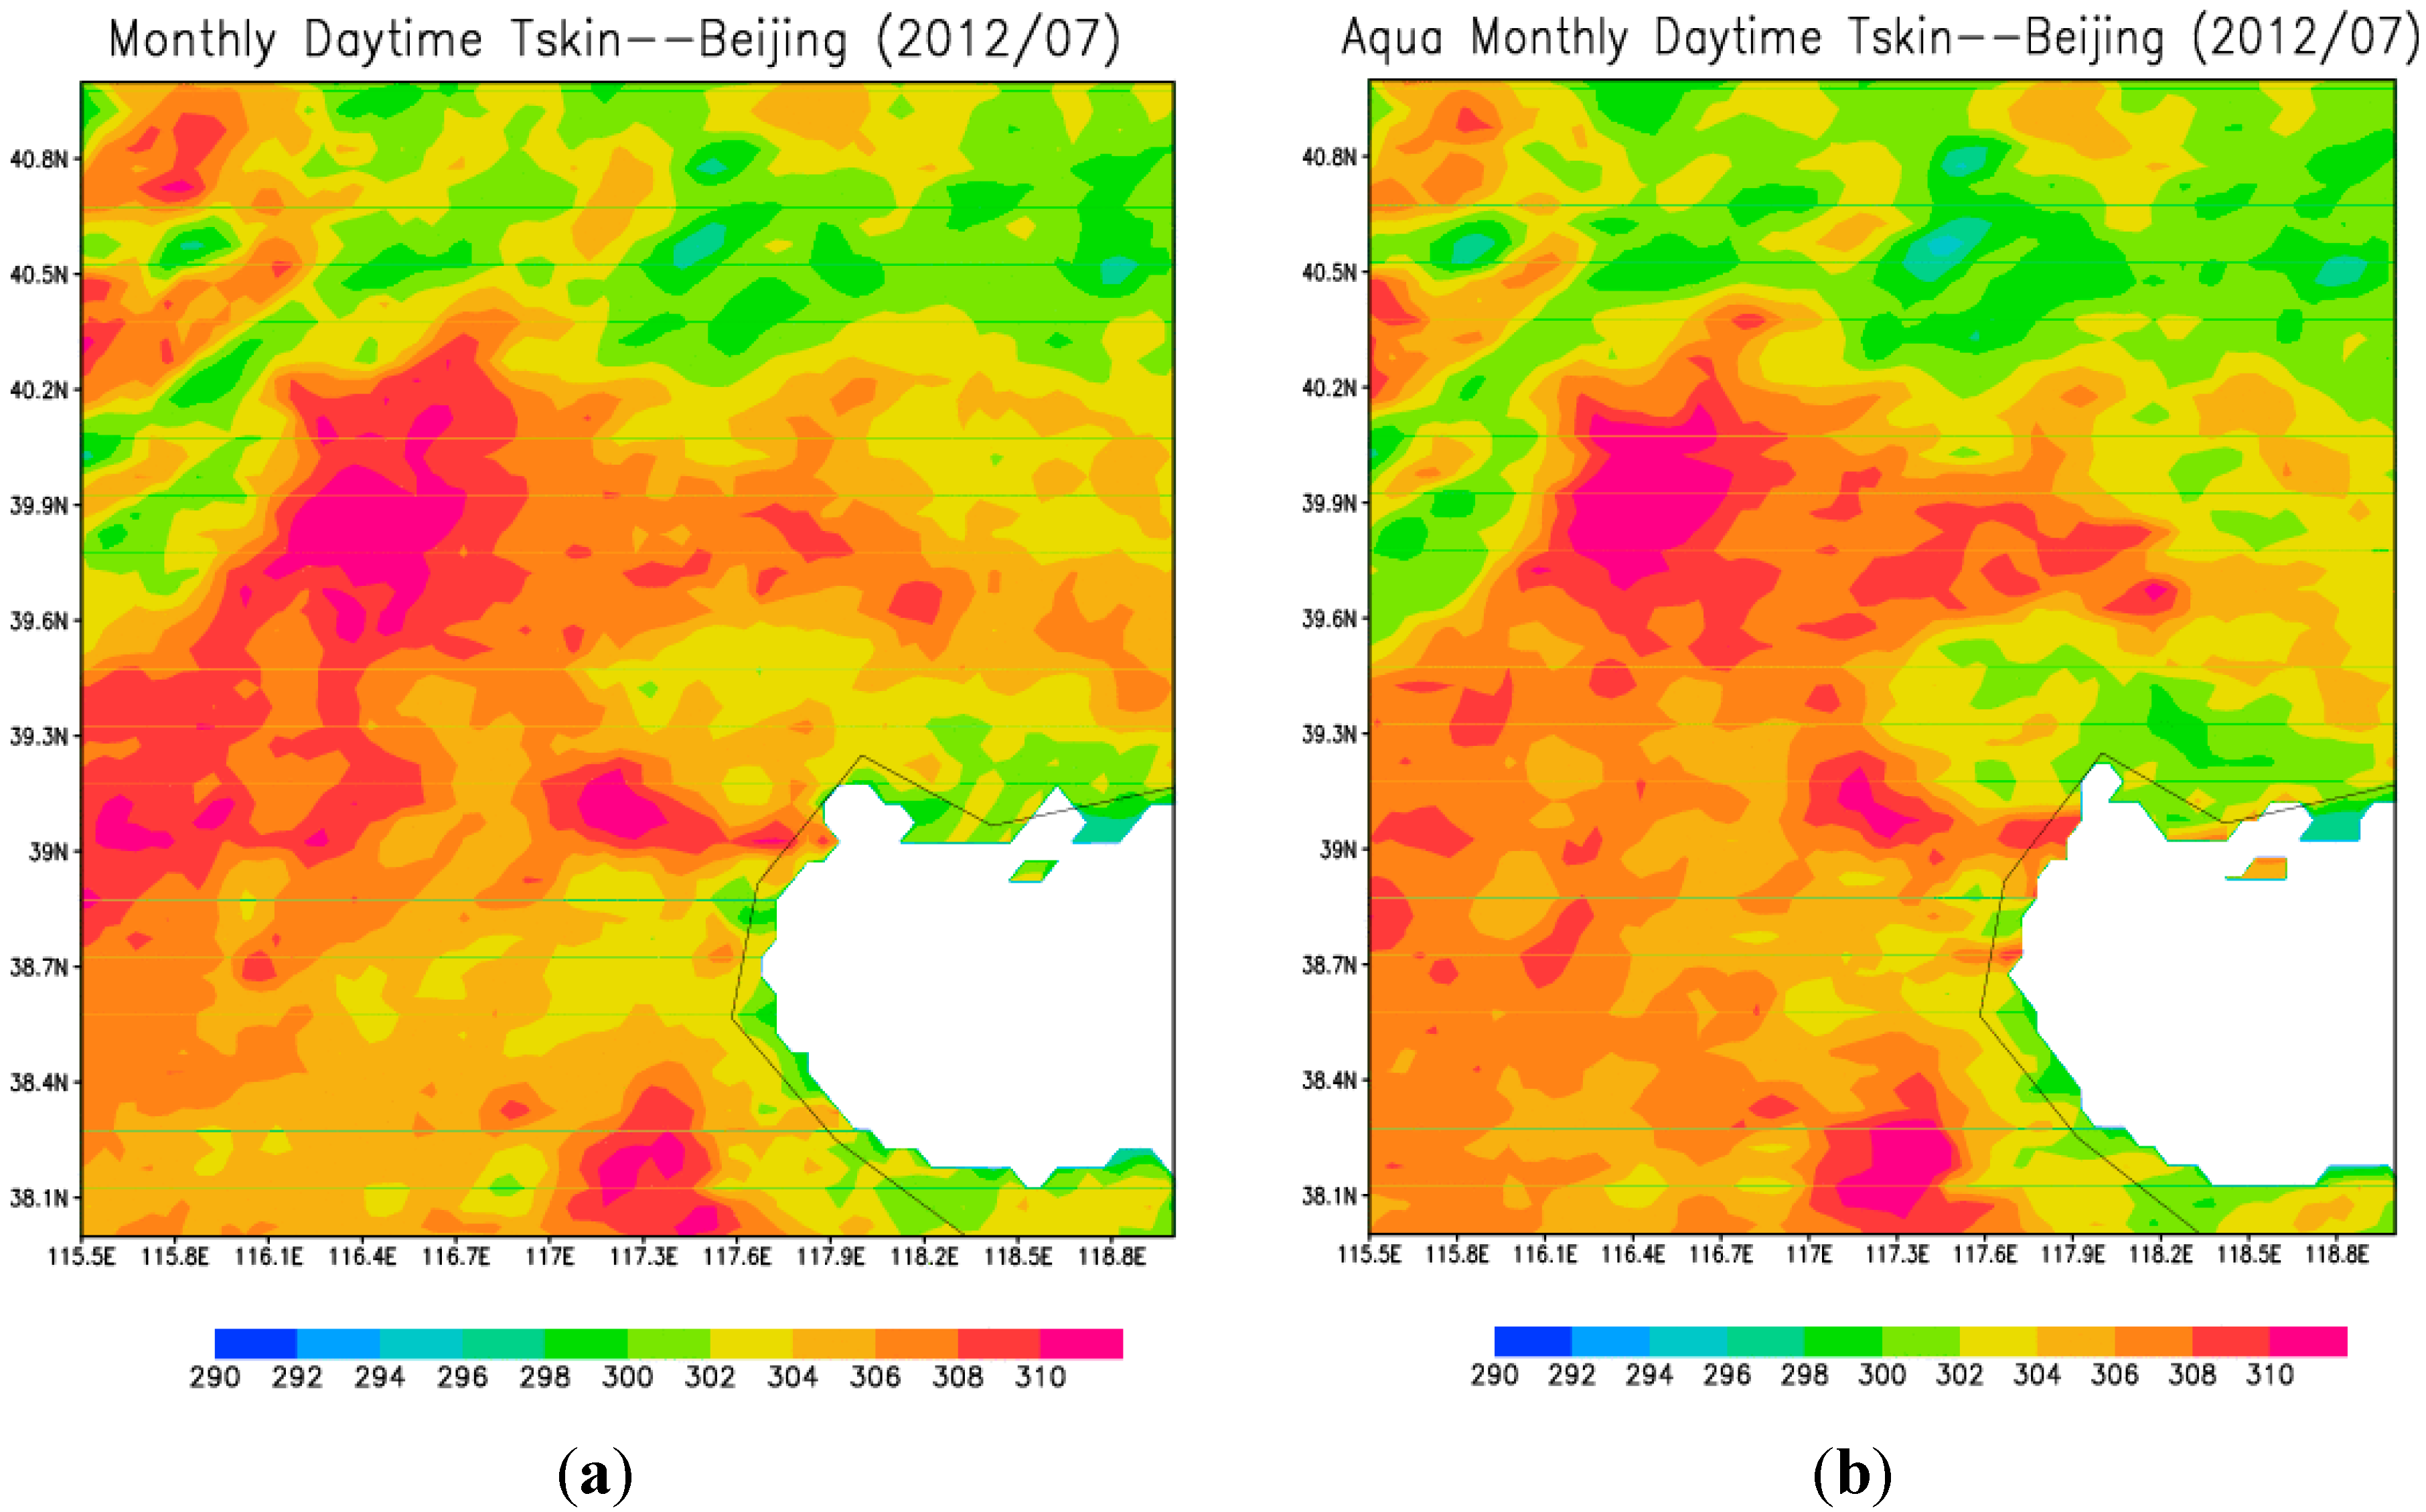
3.3. The Urban Heat Island Effect and Canyon Effect

Due to the low surface albedo and canyon effect, low surface emissivity related to human-induced, water-proof surface materials, Beijing has higher surface temperature than nearby non-urban regions. This is so-called urban heat is land effect (UHI, Figure 6) [30,31]. Before the rainfall event on 21 July, Beijing daily area averaged Tskin was as high as 296 K, which was about 4 K higher than Beijing on other days. In addition, the urban temperature has high spatial heterogeneity, the daily mean skin temperature over Beijing can be up-to 305 K for center building area at 10:30 AM and 1:30 PM, respectively (Figure 7a,b). Furthermore, Beijing was warmer by about 4K (302K vs. 298K) at night 10:30 PM and 1:30 AM (Figure 7c,d). Such warm surfaces resulted in strong convection which was essential the rainfall event.
Figure 6. Daily skin temperature averaged over 110°E–120°E, 35°N–45°N during 21 July 2012 to 15 August 2012.
Climate 03 00193 g006
Figure 7. Beijing monthly mean land surface skin temperature (unit K) in July 2012 (a) around 10:30 AM measured by Terra, (b) around 1:30 PM measured by Aqua, (c) around 10:30 PM measured by Terra, and (d) around 1:30 AM measured by Aqua. All plots are at local standard time.
Climate 03 00193 g007aClimate 03 00193 g007b
Besides, UHI- and density of tall buildings over Beijing lifted air parcels (e.g., urban canyon-lift effect). Therefore, both UHI and building canyon-lift effect helped the rainfall system to grow, sustain, and stall over Beijing, after it moved from northwest into Beijing (Figure 5).

3.4. Aerosols and Clouds Properties

The amount of aerosols in total column, as represented by Aerosol Optical Thickness (AOT. Figure 8a), reached a maximum (AOT = 1.6) on 20–21 July. Compared with the normal level of AOT, this value was an extreme. In addition, cloud fraction was also as large as 0.95 (Figure 8b) and correspondingly cloud droplet size (~15 micrometer) was smaller than most of the days (Figure 8c). Although cloud faction was partly due to the arrival of rainfall system from northwest (Figure 5), aerosols, serving as cloud condensation nuclei, reduced cloud droplet size (Figure 8c) and thus extended cloud fraction and cloud lifetime [23,28]. Therefore, Beijing aerosols seems to be partly responsible for high cloud fraction.
On a normal clear day, the clouds over Beijing were warm clouds from shallow convection (Figure 9a, for example, on July 20, 2012). However, the cloud top temperature on July 21 was lower than previous clear day (−5 °C vs. 0 °C, Figure 9b), proving that clouds at 721 was high and thus cold at rainfall time. Colder clouds were favorable for rainfall to occur since at this temperature, ice crystal can form and Bergeron process can speed up the growth of ice crystal than warm clouds.
Water vapor was high in south of Beijing (above 5.0 cm, Figure 10). This provides abundant water vapor supply through steady southeast wind at low altitude related to the Pacific subtropical high [6,7,10]. With such adequate water vapor supply, rainfall lasted long hours over Beijing.
Figure 8. (a) Daily aerosol optical thickness (AOT) at 550 nm in Beijing from 1 July to 19 August 2012, retrieved from MODIS, Aqua. (b) Daily cloud fraction in Beijing, from 1 July to 15 August 2012, retrieved from MODIS, Terra. (c) Cloud droplet size for water cloud, from 1 July to 15 August 2012, retrieved from MODIS, Aqua. Red circle outlines the peaks for each variable.
Climate 03 00193 g008aClimate 03 00193 g008b
Figure 9. Cloud top temperature (a) one day before the rainfall at 11:10 LT and (b) during rainfall 21 July 2012 at 11:50 LT.
Climate 03 00193 g009
Figure 10. MODIS observed total column water vapor for 20 July 2012. Data is assessable via Giovanni at: http://gdata1.sci.gsfc.nasa.gov/daac-bin/G3/gui.cgi?instance_id=neespi_daily&selectedMap=Blue%20Marble&.
Climate 03 00193 g010

4. Final Discussions

Our study emphasizes on understanding whether any urban related conditions enhanced this existing rainfall system and resulted in an extreme event. Satellite observations show that high aerosol amount, high cloud fraction, small cloud droplet size, high cloud height contributed, at least partly, to Beijing 721 extreme rainfall event. In addition, Beijing urban landscape had large warm surface to propagate heat energy to upper lying atmosphere column, enhanced local metrological disturbance, and thus led to the long duration of rainfall system. Therefore, the urban heat island effect, urban aerosol indirect effect, and urban tall building (e.g., so-called urban canyon) lifting effect were important in Beijing 721 rainfall extreme. Furthermore, the mechanisms identified are probably valid for most modern, large cities.
During this long, lasting rainfall event, urban building lift may explain why the system stalled in Beijing. Buildings not only absorb solar radiation during the day but also emit longwave radiation and keep lifting air and water vapor to local condensation level. With abundant water vapor, this lift made new rainfall cluster to form. As a result, long rain time was observed. The building density and distribution may determine the locations of the discrete rain clusters to form and reform.
Satellite observations provide valuable, independent information from space with high coverage and high spatial resolution. Therefore, satellite remote sensing is a considerable new source to be used to predict and alarm the rainfall extreme event. Nevertheless, satellite observations, such as skin temperature and aerosols, have uncertainties in particular over cloud conditions [19]. Namely, no skin temperature and aerosols are measurable under cloudy sky. This uncertainty should be carefully considered when implemental satellite data in weather predication.
Many previous studies used NCEP output to assess the rainfall extreme. Nevertheless, NCEP does not include urban landscape in their model and therefore, the urban contribution is not well included in their model analysis. This should be improved in future.

Acknowledgements

This work is supported by NSF larger-scale dynamics program, NASA Precipitation Program, and Chinese Beijing Urban Institute.

Author Contributions

This research article was done by several authors. Menglin S. Jin identified the topic, designed research approach, secured funding which supported this work, supervised the research assistant, and prepared the manuscript. Yu Li conducted all data analysis and the figures. Debin Su provided part of Beijing ground observations and part of funding.

Conflicts of Interest

The authors declare no conflict of interest.

References

  1. IPCC. Climate Change 2007: The Physical Science Basis; Cambridge University Press: Cambridge, UK, 2007; p. 996. [Google Scholar]
  2. Yu, L.-F.; Liao, X.-N.; Li, T. Mesoscale analysis on torrential rain over Beijing area in July 1998. Meteorol. Mon. 1999, 25, 44–48. (In Chinese) [Google Scholar]
  3. Guo, Y. Analysis of apparent heat sources and moisture sinks over Beijing during the heavy rain in 1998. Meteorol. Mon. 2000, 26, 7–14. (In Chinese) [Google Scholar]
  4. Mao, D.-Y.; Qiao, L.; Chen, T.; Yang, K.-M. A mesoscale analysis of a heavy rainfall event on 10 July 2004 in Beijing. Meteorol. Mon. 2005, 31, 42–46. (In Chinese) [Google Scholar]
  5. Liao, X.-N.; Wei, D.; Shi, Z.-Y.; Xuan, C.-Y. Some characteristics of torrential rain events during continuous drought period in Beijing. Plateau Meteorol. 2011, 30, 749–759. (In Chinese) [Google Scholar]
  6. Sun, J.; Chen, Y.; Yang, S.-N.; Dai, K.; Chen, T.; Yao, R.; Xu, J. Analysis and thinking on the extremes of the 21 July 2012 torrential rain in Beijing Part 2: Preliminary causation analysis and thinking. Meteorol. Mon. 2012, 38, 1267–1277. (In Chinese) [Google Scholar]
  7. Sun, J.-S.; He, N.; Wang, G.-R.; Chen, M.-X.; Liao, X.-N.; Wang, H. Preliminary analysis on synoptic configuration evolvement and mechanism of a torrential rain occurring in Beijing on 21 July 2012. Torrential Rain Disasters 2012, 31, 218–225. (In Chinese) [Google Scholar]
  8. Niyogi, D.; Pyle, P.; Lei, M.; Pal Arya, S.; Kishtawal, C.M.; Shepherd, M.; Chen, F.; Wolfe, B. Urban modification of thunderstorms: An observational storm climatology and model case study for the Indianapolis urban region. J. Appl. Meteor. Climatol. 2011, 50, 1129–1144. [Google Scholar] [CrossRef]
  9. Shepherd, M.; Mote, T.; Dowd, J.; Roden, M.; Knox, P.; MoCutcheon, S.C.; Nelson, S.E. An overview of synoptic and mesoscale factors contributing to the disastrous Atlanta flood of 2009. Bull. Am. Meteorol. Soc. 2001, 92, 861–870. [Google Scholar] [CrossRef]
  10. Yun, C.; Sun, J.; Xu, J.; Yang, S.; Zong, Z.; Chen, T.; Fang, C.; Sheng, J. Analysis and thinking on the extremes of the 21 July 2012 torrential rain in Beijing Part 1: Observation and thinking. Meteorol. Mon. 2012, 38, 1255–1266. (In Chinese) [Google Scholar]
  11. Easterling, D.R.; Meehl, G.A.; Parmesan, C.; Changnon, S.A.; Karl, T.R.; Mearns, L.O. Climate extremes: Observations, modeling, and impacts. Science 2000, 289, 2068–2074. [Google Scholar] [CrossRef] [PubMed]
  12. Jin, M.; Dickinson, R.E. Land surface skin temperature climatology: Benefitting from the strengths of satellite observations. Environ. Res. Lett. 2010, 5, 044004. [Google Scholar] [CrossRef]
  13. Wan, Z.; Li, Z.-L. Radiance-based validation of the V5 MODIS land-surface temperature product. Int. J. Remote Sens. 2008, 29, 5373–5395. [Google Scholar] [CrossRef]
  14. Myneni, R.B.; Nemani, R.R.; Running, S.W. Estimation of global leaf area index and absorbed par using radiative transfer models. IEEE Trans. Geosci. Remote Sens. 1997, 35, 1380–1393. [Google Scholar] [CrossRef]
  15. Friedl, M.A.; Mclver, D.K.; Hodges, J.C.F.; Zhang, X.Y.; Muchoney, D.; Strahler, A.H.; Woodcock, C.E.; Gopal, S.; Schneider, A.; Cooper, A.; et al. Global land cover mapping from MODIS: Algorithms and early results. Remote Sens. Environ. 2002, 83, 287–302. [Google Scholar] [CrossRef]
  16. Gao, B.C.; Yang, P.; Han, W.; Li, R.R.; Wiscombe, W.J. An algorithm using visible and 1.38-m channels to retrieve cirrus cloud reflectances from aircraft and satellite data. IEEE Trans. Geosci. Remote Sens. 2002, 40, 1659–1668. [Google Scholar] [CrossRef]
  17. Schaaf, C.B.; Gao, F.; Strahler, A.H.; Lucht, W.; Li, X.W.; Tsang, T.; Strugnell, N.C.; Zhang, X.Y.; Jin, Y.F.; Muller, J.P.; et al. First operational BRDF, albedo nadir reflectance products from MODIS. Remote Sens. Environ. 2002, 83, 135–148. [Google Scholar] [CrossRef]
  18. Hall, D.H.; Riggs, G.A.; Salomonson, V.V.; DiGirolamo, N.E.; Bayr, K.J. MODIS snow-cover products. Remote Sens. Environ. 2002, 83, 181–194. [Google Scholar] [CrossRef]
  19. King, M.D.; Menzel, W.P.; Kaufman, Y.J.; Tanré, D.; Gao, B.C.; Platnick, S.; Ackerman, S.A.; Remer, L.A.; Pincus, R.; Hubanks, P.A. Cloud and aerosol properties, precipitable water, and profiles of temperature and humidity from MODIS. IEEE Trans. Geosci. Remote Sens. 2003, 41, 442–458. [Google Scholar] [CrossRef]
  20. Huffman, G.; Coauthors, J. The TRMM multisatellite precipitation analysis (TMPA): Quasi global, multiyear, combined-sensor precipitation estimates at fine scales. J. Hydrometeor. 2007, 8, 38–55. [Google Scholar] [CrossRef]
  21. Zhang, X.-D. Radar features and simulation analysis of a heavy rainfall event. Meteorol. Sci. Technol. 2010, 38, 550–559. (In Chinese) [Google Scholar]
  22. Jiang, X.; Li, Z.-J.; Gong, C.-N.; Li, X.; Fu, C.-L. A classification-based research on rainstorm processes around Beijing caused by mongolia-baikal low. Trans. Atmos. Sci. 2010, 33, 412–419. [Google Scholar]
  23. Twomey, S. The influence of pollution on the shortwave albedo of clouds. J. Atmos. Sci. 1997, 34, 1149–1152. [Google Scholar] [CrossRef]
  24. Jin, M.; Shepherd, J.M. Aerosol relationships to warm season clouds and rainfall at monthly scales over east China: Urban land versus ocean. J. Geophys. Res. 2005, 113. [Google Scholar] [CrossRef]
  25. Rosenfeld, D.; Lohmann, U.; Raga, G.B.; O’Dowd, C.D.; Kulmala, M.; Fuzzi, S.; Reissell, A.; Andreae, M.O. Flood or drought: How do aerosols affect precipitation? Science 2008, 321, 1309–1313. [Google Scholar] [CrossRef]
  26. Ackerman, S.; Toon, O.B.; Stevens, D.E.; Heymsfield, A.J.; Ramanathan, V.; Welton, E.J. Reduction of tropical cloudiness. Science 2000, 288, 1042–1047. [Google Scholar] [CrossRef] [PubMed]
  27. Nakajima, T.; King, M.D. Determination of the optical thickness and effective particle radius of clouds from reflected solar radiation measurements. Part I: Theory. J. Atmcbpheric Sci. 1990, 47, 1878–1893. [Google Scholar] [CrossRef]
  28. Jin, M.; Shepherd, J.M.; King, M.D. Urban aerosols and their interaction with clouds and rainfall: A case study for New York and Houston. J. Geophys. Res. 2005, 110. [Google Scholar] [CrossRef]
  29. Gong, P.; Liang, S.; Carlton, E.J.; Jiang, Q.; Wu, J.; Wang, L.; Remais, J.V.J. Urbanization and health in China. Lancet 2012, 379, 843–852. [Google Scholar] [CrossRef] [PubMed]
  30. Jin, M.; Dickinson, R.E.; Zhang, D.-L. The footprint of urban areas on global climate as characterized by MODIS. J. Clim. 2005, 18, 1551–1565. [Google Scholar] [CrossRef]
  31. Jin, M. Developing an index to measure urban heat island effect using satellite land skin temperature and land cover observations. J. Clim. 2012, 25, 6193–6201. [Google Scholar] [CrossRef]

